22
The Impact of Electric Vehicle Penetration on South Africa’s Demand Profile MQBNAV001 Naveed Ahmed Maqbool
| Date post: | 12-Aug-2015 |
| Category: |
Documents |
| Upload: | naveed-ahmed |
| View: | 219 times |
| Download: | 2 times |

The Impact of Electric Vehicle Penetration on South Africa’s Demand
Profile
MQBNAV001 Naveed Ahmed Maqbool

Literature Review Charging Models Impact of Charging Models on grid Impact of different EV penetration rates on grid South Africa energy supply and demand Impact of EV on Rondebosch Utility Tariff Development Affordability EV Manufacturers Limitations of EV’s V2G Technology Conclusions and Recommendations
Presentation Structure
What is an EV? How does an EV function? Pollution rates? Internal Combustion versus
EV Battery Technologies
Li-Ion NiMH PbA
Fuel Cell EV versus BEV
Literature Review

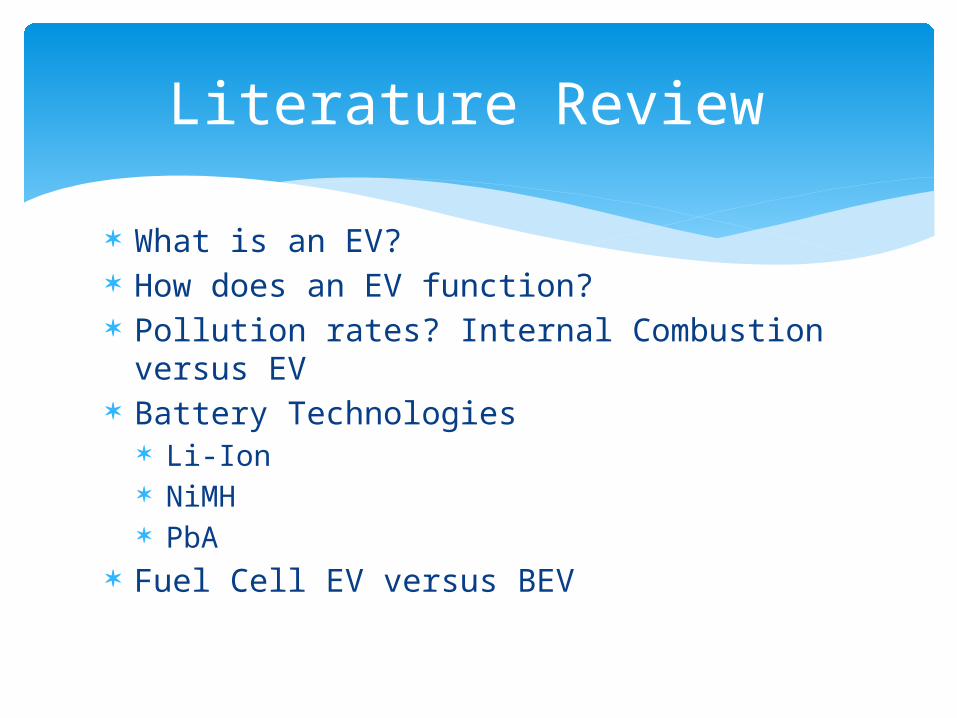
Models developed for different charging patterns
Step Loading Model
Uniform Loading Model
Interval Loading Model
Charging Models
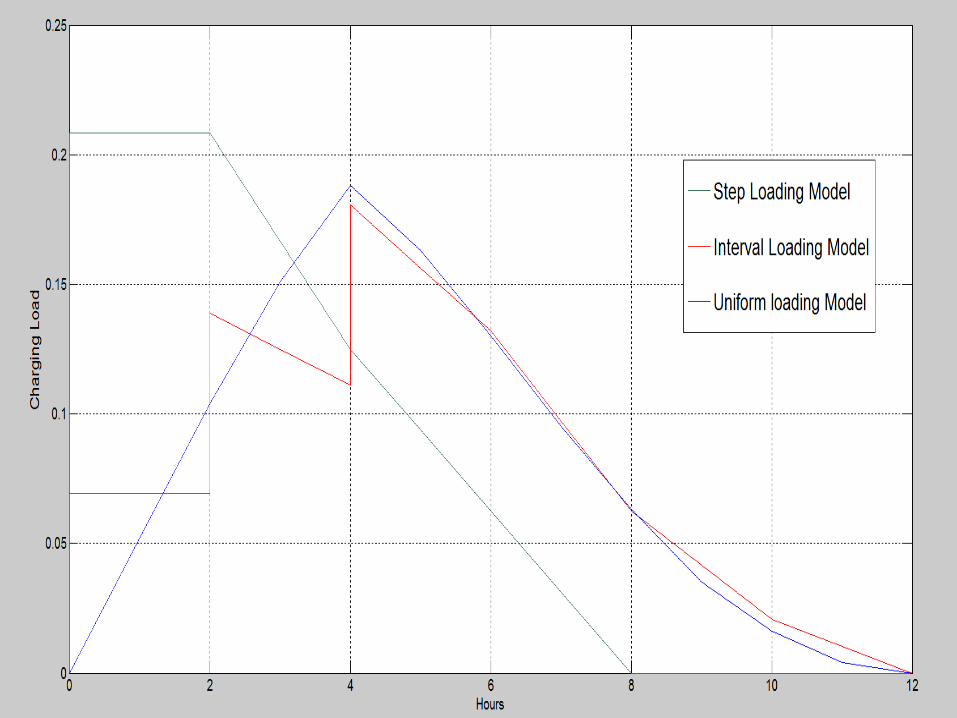

Analysis on the demand profile in different seasons
South Africa’s Demand Profile
MWh
Comparison of demand profiles in summer and winter
Off-Peak demand profile for South Africa

100% Penetration Rate

50% Penetration Rate

20% Penetration Rate
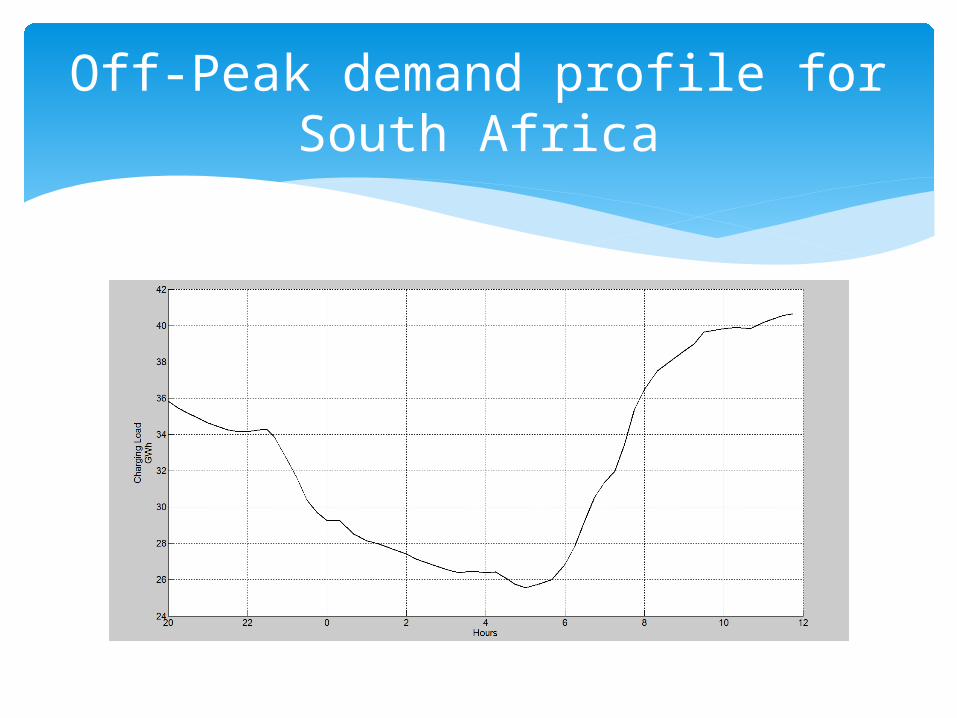
10% Penetration Rate
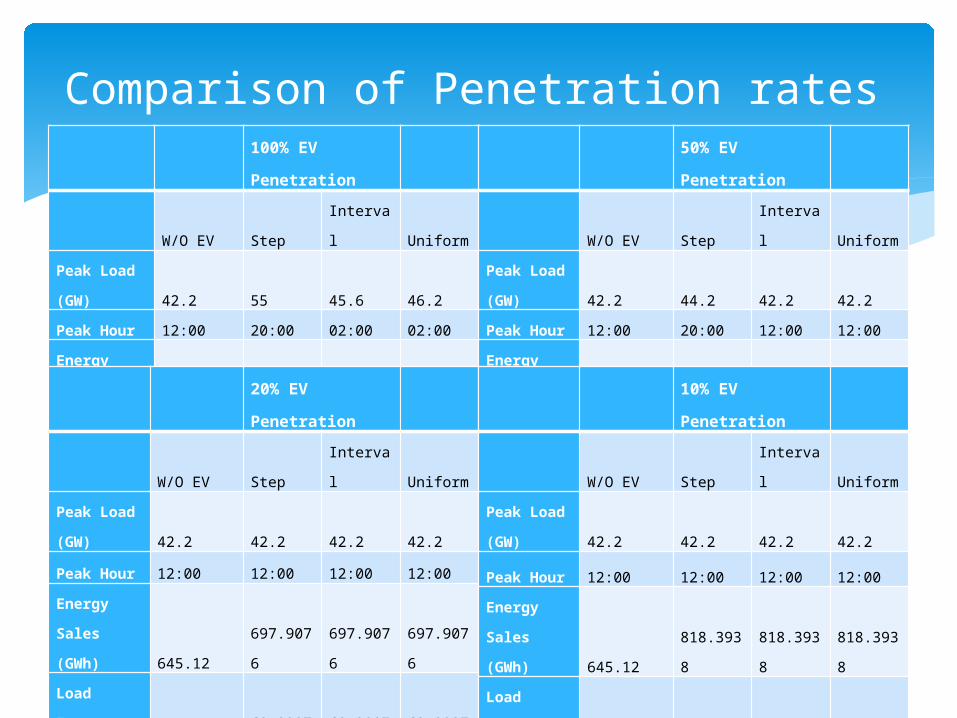
100% EV
Penetration
W/O EV Step Interval Uniform
Peak Load
(GW) 42.2 55 45.6 46.2
Peak Hour 12:00 20:00 02:00 02:00
Energy
Sales
(GWh) 645.12
909.057
9
909.057
9
909.057
9
Load
Factor (%)
63.69668
2
68.8680
2
83.0645
0
81.9857
42
Comparison of Penetration rates
20% EV
Penetration
W/O EV Step Interval Uniform
Peak Load
(GW) 42.2 42.2 42.2 42.2
Peak Hour 12:00 12:00 12:00 12:00
Energy
Sales
(GWh) 645.12
697.907
6
697.907
6
697.907
6
Load
Factor (%) 63.69668
68.9087
3
68.9087
3
68.9087
3
50% EV
Penetration
W/O EV Step Interval Uniform
Peak Load
(GW) 42.2 44.2 42.2 42.2
Peak Hour 12:00 20:00 12:00 12:00
Energy
Sales
(GWh) 645.12
777.088
9
777.088
9 777.089
Load
Factor (%)
63.69668
24
73.2549
92
76.7267
9
76.7267
9
10% EV
Penetration
W/O EV Step Interval Uniform
Peak Load
(GW) 42.2 42.2 42.2 42.2
Peak Hour 12:00 12:00 12:00 12:00
Energy
Sales
(GWh) 645.12
818.393
8
818.393
8
818.393
8
Load
Factor (%) 63.69668
80.8050
7
80.8050
7
80.8050
7

South Africa’s Energy Supply and Demand

Top down approach
Typical Home Appliance Electricity Consumption
Demand profile of households
Extra energy required for accommodation of EV
Impact of EV on Rondebosch
Time of Use, Fixed Rate or Real time?
Controlled, Uncontrolled or Smart charging
Best tariff for charging patterns
Utility Tariff DevelopmentUtility Tariff Development
ICE Toyota Corolla 2.0 versus Ford Focus EV
EV uses cheaper electricity, but more expensive to buy
46.83 years for EV to cover up for extra cost as opposed to ICE
Affordability

Nissan Motors Ford Motors Toyota Mitsubishi Honda
EV Manufacturers

Home Work Power Supplies Requirements of an EV model for a grid
integration Low power charging Battery swapping Quick charging batteries
Limitations of EV’s
Provide a future for the energy crisis? Store off-peak cheap energy and sell at peak
hours
V2G Technology
South Africa cannot integrate a large amount of EV penetration at present
EV charging should be controlled and charging must be done in off-peak hours
V2G technology should be adapted
Conclusions and Recommendations

Thank You
