50
Capitalware's MQ Technical Conference v2.0.1.6 The top issues in IBM MQ and IIB Barry D. Lamkin Executive IT Specialist [email protected]

Capitalware's MQ Technical Conference v2.0.1.6
The top issues in IBM MQ and IIB
Barry D. LamkinExecutive IT [email protected]

Capitalware's MQ Technical Conference v2.0.1.62
IBM MQ - Features
ü Assured, exactly once deliveryü Single API across 45+ platformsü Network integration across various
network protocolsü Transactional controlü Triggering of jobs/programsü Content independenceü Single message > 100MBü Asynchronous design (application
& platform independent)ü Parallel processingü Robust, commercial middlewareü Shields developers from
network complexities
Capitalware's MQ Technical Conference v2.0.1.6
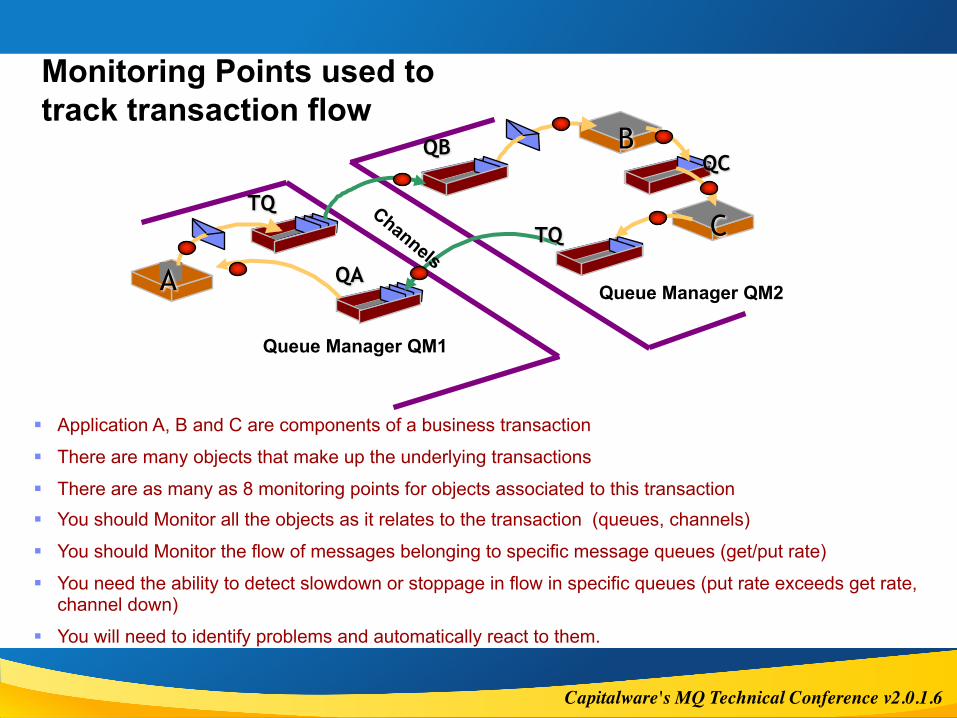
Monitoring Points used to track transaction flow
A
B
C
Queue Manager QM1
Queue Manager QM2
§ Application A, B and C are components of a business transaction
§ There are many objects that make up the underlying transactions
§ There are as many as 8 monitoring points for objects associated to this transaction§ You should Monitor all the objects as it relates to the transaction (queues, channels)
§ You should Monitor the flow of messages belonging to specific message queues (get/put rate)
§ You need the ability to detect slowdown or stoppage in flow in specific queues (put rate exceeds get rate, channel down)
§ You will need to identify problems and automatically react to them.
QBQC
QA
TQTQ
Capitalware's MQ Technical Conference v2.0.1.6
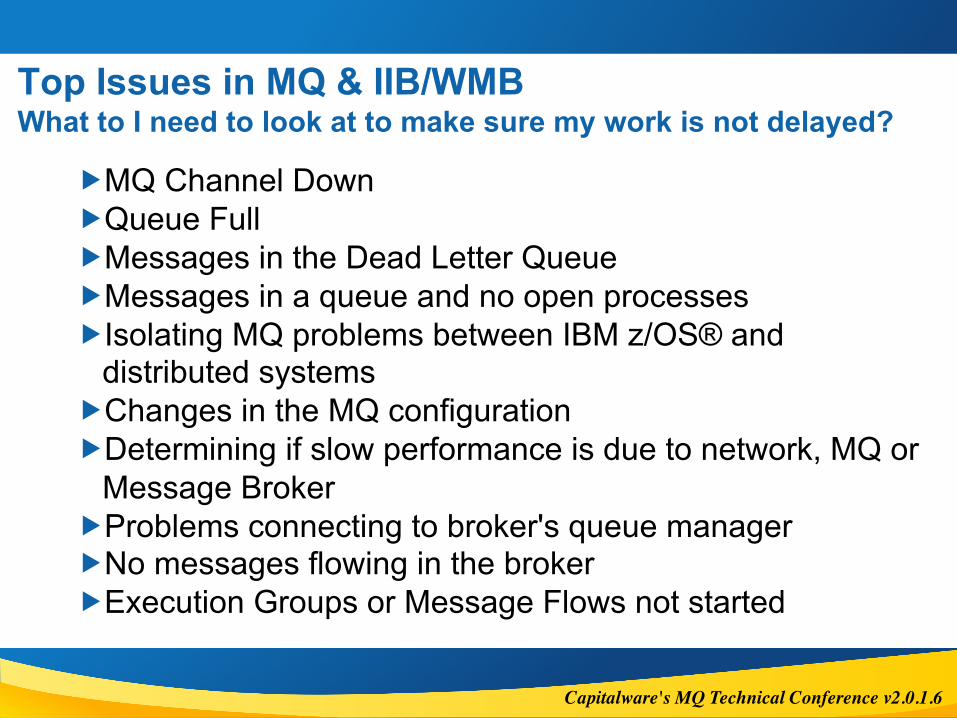
Top Issues in MQ & IIB/WMBWhat to I need to look at to make sure my work is not delayed?
�MQ Channel Down�Queue Full�Messages in the Dead Letter Queue�Messages in a queue and no open processes�Isolating MQ problems between IBM z/OS® and
distributed systems�Changes in the MQ configuration�Determining if slow performance is due to network, MQ or
Message Broker�Problems connecting to broker's queue manager�No messages flowing in the broker �Execution Groups or Message Flows not started

Capitalware's MQ Technical Conference v2.0.1.6
Problem Determination - Philosophy
¡ We prefer problem avoidance to problem determination, but sometimes you do what you have to do.
¡ It is not a skill that can be directly taught or automated – if it were it would have been automated by now. �Though there are ‘first places to look.’ �Experience and an imagination can certainly help !
¡ It can require subtle knowledge of the workings of many systems and applications to find the real problem.�Although throwing resources (CPU, memory) at a problem is
often a temporary measure to get around a problem.�But this may simply result in masking the problem
5
Capitalware's MQ Technical Conference v2.0.1.6
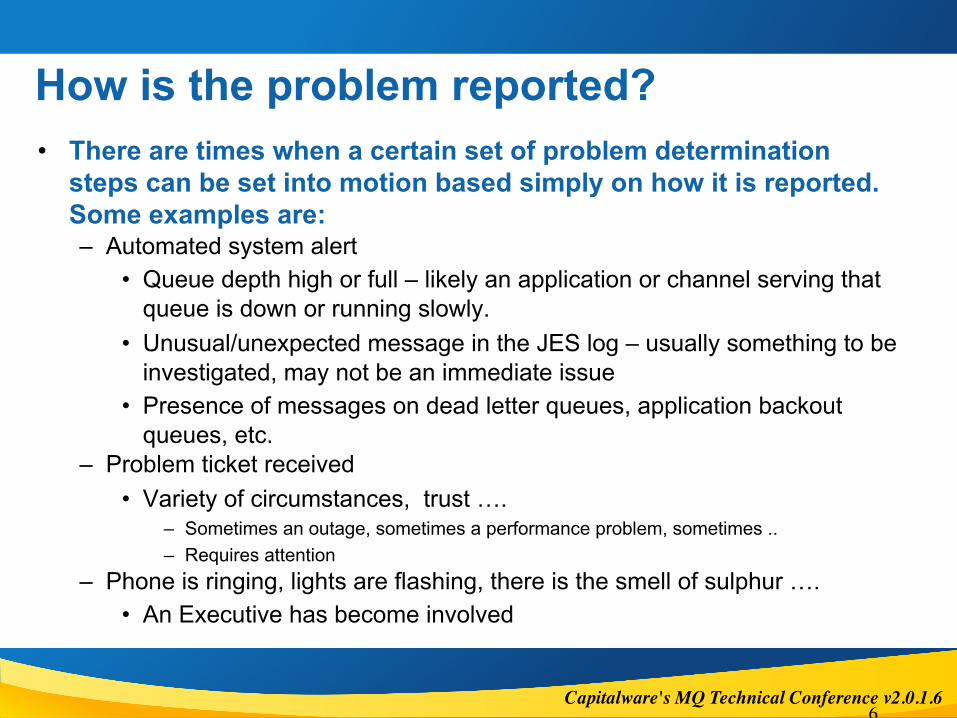
How is the problem reported? • There are times when a certain set of problem determination
steps can be set into motion based simply on how it is reported. Some examples are:– Automated system alert
• Queue depth high or full – likely an application or channel serving that queue is down or running slowly.
• Unusual/unexpected message in the JES log – usually something to be investigated, may not be an immediate issue
• Presence of messages on dead letter queues, application backout queues, etc.
– Problem ticket received• Variety of circumstances, trust ….
– Sometimes an outage, sometimes a performance problem, sometimes ..– Requires attention
– Phone is ringing, lights are flashing, there is the smell of sulphur …. • An Executive has become involved
6

Capitalware's MQ Technical Conference v2.0.1.6
What kinds of PD is typical with MQ?
¡ Nothing is typical!
¡ MQ is often blamed for everything and everything!!
¡ What are the symptoms reported? �Message Depth high or queue full�MQ is losing my messages�MQ is Broken, is down �Missing my SLAs
7

Capitalware's MQ Technical Conference v2.0.1.6
How much work is my queue manager doing?You should monitor your queue manager to see if there are trends in the work being done in the queue manager.
1.Peak number of puts and gets per hour. This tells you if there is an increase in workload, or a change in the application workload2.How many log CIs are created per hour. This tells you how much persistent data you are processing3.Queue manager and Chinit virtual storage usage. This tells you how much storage you are using - and how much free storage is available4.Peak number of channels in use.5.Highest buffer pool usage for each buffer pool.6.Peak number of pages in use in a page set.7.For a structure, the % usage of the entries and elements from the D XCf,STR,strname=.... command8.Display the SMDS usage ( or use SMF) to display your SMDS activity. An increase in SMDS activity can be caused by more shared queue activity, or by larger messages.

Capitalware's MQ Technical Conference v2.0.1.6
MQ Channels

Capitalware's MQ Technical Conference v2.0.1.6
Issues with Channels
¡ Which channels are running or stopped?
¡ If my channel is up, is it transmitting messages?
¡ Are my channels optimally configured?
¡ If channel performance is poor, how does that impact my clients?

Capitalware's MQ Technical Conference v2.0.1.6
ChannelsThe WMQ command DIS CHSTATUS gives lots of information about the channels. You can use monitoring tools (or the MQCMD in MP1B) to periodically display this information.
In WMQ V8 this information is available in SMF records.
The time to send messages over a channel is in two areas
¡The time a messages is waiting to be sent
¡The time to send the message over the network, and the end of batch processing.

Capitalware's MQ Technical Conference v2.0.1.6
How long did messages have to wait before being sent?
To display the time the message is waiting using the XQTIME. This value may change over a day, as more MQ work is processed, or as the network gets busier.
If the BATCHINT value is zero, the achieved batch size should be less than the negotiated batch size for short messages. Values XBATCHSZ < BATCHSZ in DIS CHSTATUS. If XBATCHSZ is close to BATCHSZ then most of the time there were always messages waiting to be sent.
If the BATCHINT is a large value then XBATCHSZ can be the same as BATCHSZ, as there is a get with wait.
Capitalware's MQ Technical Conference v2.0.1.6
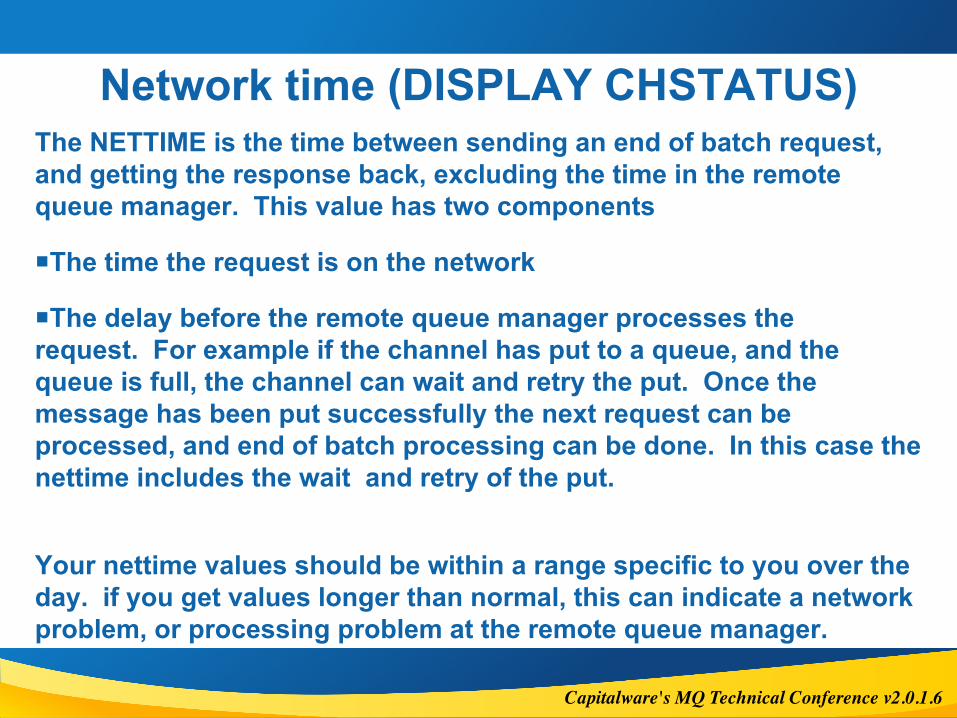
Network time (DISPLAY CHSTATUS)The NETTIME is the time between sending an end of batch request, and getting the response back, excluding the time in the remote queue manager. This value has two components
¡The time the request is on the network
¡The delay before the remote queue manager processes the request. For example if the channel has put to a queue, and the queue is full, the channel can wait and retry the put. Once the message has been put successfully the next request can be processed, and end of batch processing can be done. In this case the nettime includes the wait and retry of the put.
Your nettime values should be within a range specific to you over the day. if you get values longer than normal, this can indicate a network problem, or processing problem at the remote queue manager.
Capitalware's MQ Technical Conference v2.0.1.6
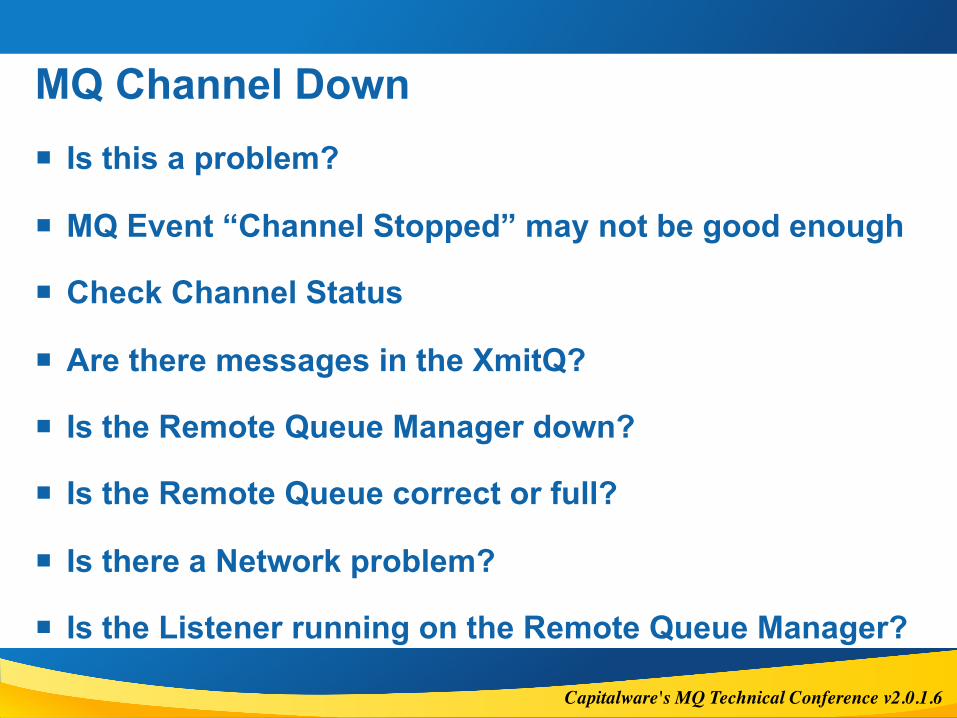
MQ Channel Down¡ Is this a problem?
¡ MQ Event “Channel Stopped” may not be good enough
¡ Check Channel Status
¡ Are there messages in the XmitQ?
¡ Is the Remote Queue Manager down?
¡ Is the Remote Queue correct or full?
¡ Is there a Network problem?
¡ Is the Listener running on the Remote Queue Manager?
Capitalware's MQ Technical Conference v2.0.1.6
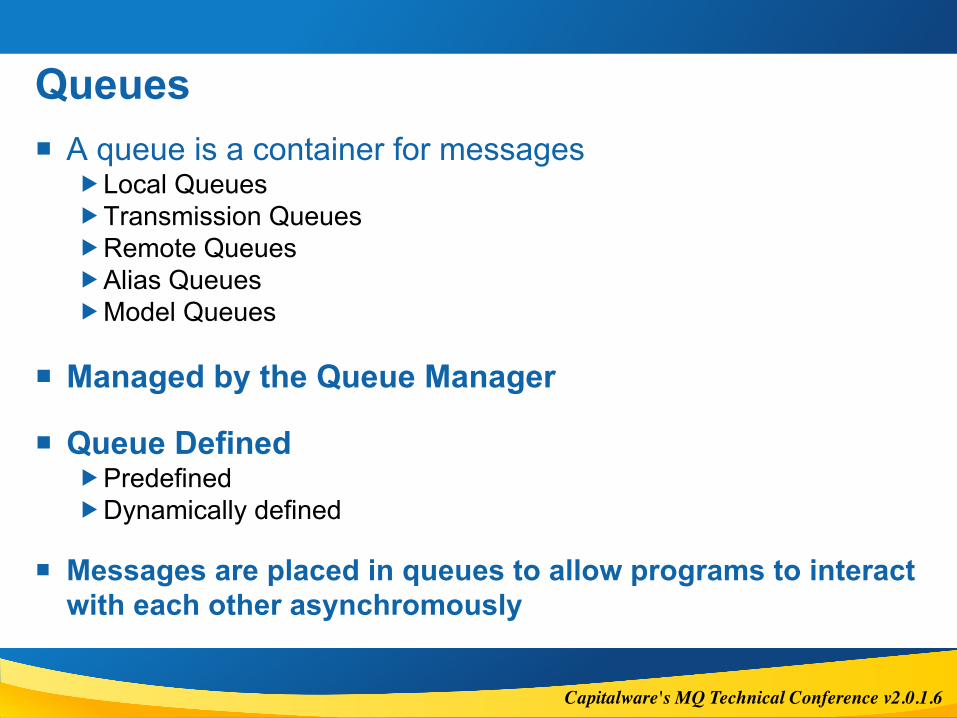
Queues¡ A queue is a container for messages
�Local Queues�Transmission Queues�Remote Queues�Alias Queues�Model Queues
¡ Managed by the Queue Manager
¡ Queue Defined�Predefined�Dynamically defined
¡ Messages are placed in queues to allow programs to interact with each other asynchromously

Capitalware's MQ Technical Conference v2.0.1.6
Queue Statistics / Definitions
§ Active, Input and Output Processes§ Local Aliased Queue Name and Type§ Queue Configuration
4 Trigger Active4 Trigger Depth4 Max Message Length
§ Oldest Message on the Queue (MONQ)

Capitalware's MQ Technical Conference v2.0.1.6
Queue Full¡ Local Application or MCA can no longer put messages to Queue
¡ Local Application should check for Queue Full condition� MQRC_Q_FULL (2053, X'805')
¡ MCA will put messages to Queue for a Remote Application� If Queue Full messages go to Dead Letter Queue� If no Dead Letter Queue channel will be stopped
¡ MQ Event “Queue Full” or “Queue High” may not be adequate� These events do not get reset until the Queue Depth hits “Queue Low”
¡ Check Queue Depth
¡ Check if messages are on a Queue and no processes have it opened

Capitalware's MQ Technical Conference v2.0.1.6
Message Depth issues• Unfortunately, the single thing many use to determine
how healthy the environment is happens to be queue depth– And the knee jerk reaction is that there is something wrong with MQ
when the depth is high or when applications start getting Queue Full reason codes
• And maybe we(you), as administrators, have brought this on ourselves from time to time.
�First place to look is the MQ JES logs for the queue manager and channel initiator address space
• Has a channel or attached queue manager that was down for a while just restarted?
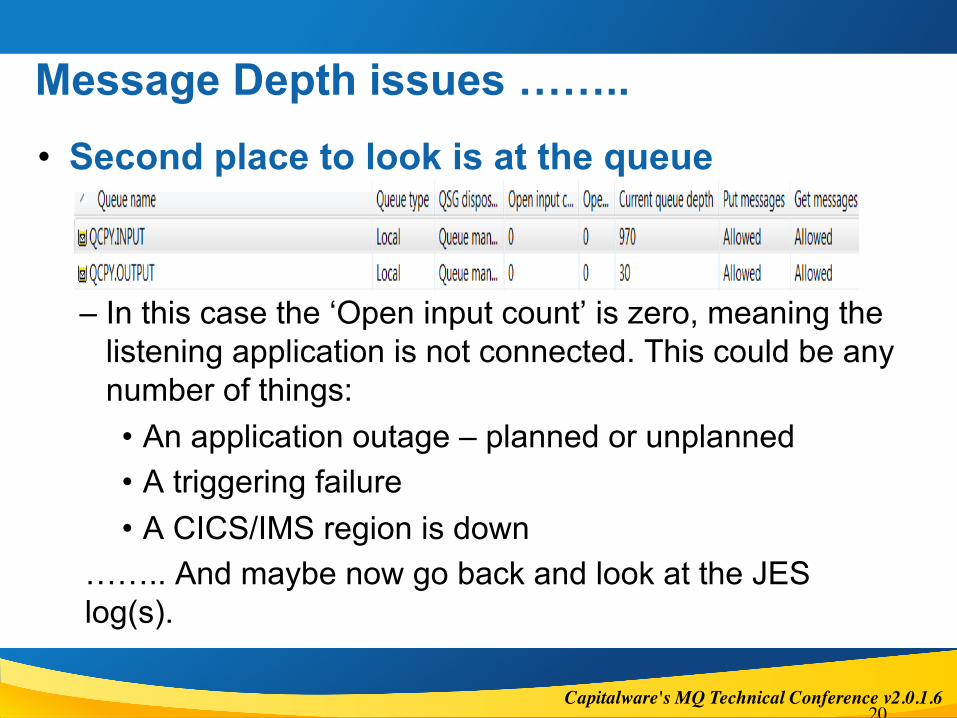
– Second place to look is at the queue
18

Capitalware's MQ Technical Conference v2.0.1.6
Message Depth issues ……..¡ Look at the JES logs first – many people are
guilty of not doing this …..�Too many instances of high queue depth, only to
discover there was a trail of clues. �And it may not just be MQ’s logs that should be
examined. �MQ just delivers the messages, CICS/IMS/Batch
process the messages. There may be something there as well.
¡ If the queues are shared, you may have to look in other LPARs as well.
Capitalware's MQ Technical Conference v2.0.1.6
Message Depth issues ……..• Second place to look is at the queue
– In this case the ‘Open input count’ is zero, meaning the listening application is not connected. This could be any number of things: • An application outage – planned or unplanned• A triggering failure• A CICS/IMS region is down
…….. And maybe now go back and look at the JES log(s).
20

Capitalware's MQ Technical Conference v2.0.1.6
Message Depth issues …….. Poison!!• Finally there is the
dreaded politician / manager / executive message J
• Just chews up resources and never does anything
• Queue depth grows but little or nothing is being processed, because the message just gets rolled back

Capitalware's MQ Technical Conference v2.0.1.6
Message Depth issues – Poison messages¡ Again a popular problem, a message that should have gone
elsewhere or cannot be processed is not removed. The application does not check the backout count and keeps rolling it back to the original queue to be picked up again, and again, and again.
¡ Sometime the only way to find out if this is the problem is to stop the application (all instances) and look at the message header. If the back out count is high that message may need to be manually removed.
¡ This is occasionally seen when different components of an application are upgraded on different dates.
¡ Another symptom is high CPU use, while this spinning is going on.
22

Capitalware's MQ Technical Conference v2.0.1.6
Message Depth issues – if all else fails• Has the message volume been trending up?
– Eventually if the volume increases there may be performance issues, that can cause unavoidable build up.
• Looking at your SMF data?
• Has the business added workload? – Did a universal pricing change take place, causing an unexpected spike? • New users of the queue/application? Mobile workload driving things
harder? • A big UK bank …….and their mobile app ……another War Story
• Has the message size changed?• Looking at your SMF data?
• For private queues, use the DISPLAY USAGE command to see if bufferpools and pagesets may be constrained
23

Capitalware's MQ Technical Conference v2.0.1.6
Message Depth issues – if all else fails…• If there has been no monitoring of message volume, MQ can keep
up for years, until it can no longer do so. Then there may be internal contention, etc.
• Businesses adding workload without considering the impact on infrastructure is an old tale. ‘The straw that broke the camels back’ is not a new adage.
• Even changes in message sizes have been known to cause issues, especially when the queue manager or the queue was already struggling. Increased message sizes impact the amount of data being logged, when the messages are persistent. Take up more pages in the bufferpool, etc.
24
Capitalware's MQ Technical Conference v2.0.1.6
Issues with DLQ
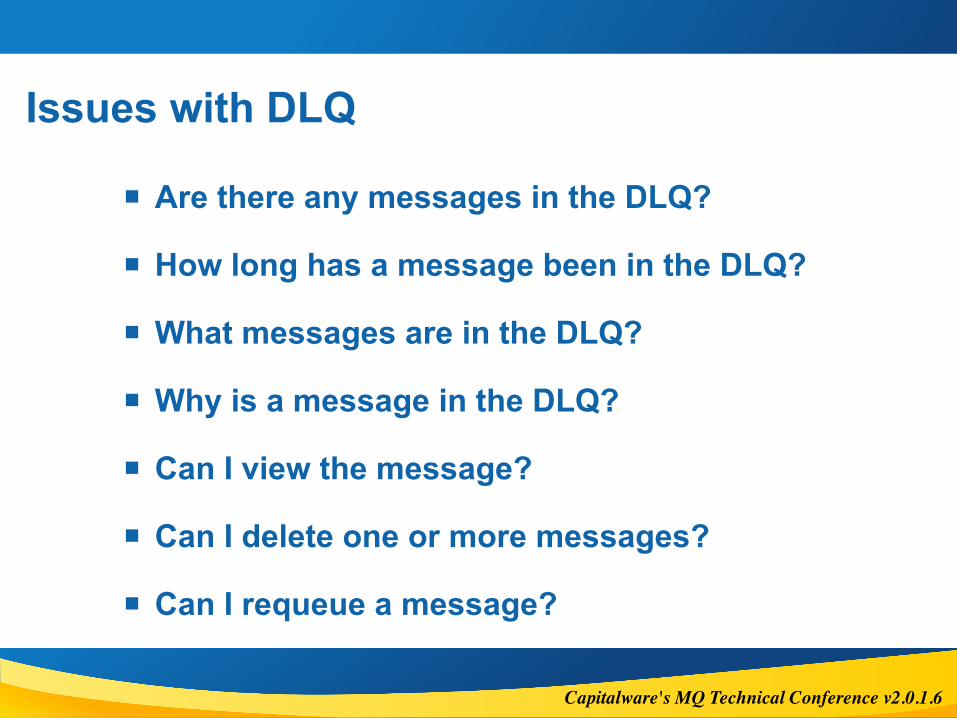
¡ Are there any messages in the DLQ?
¡ How long has a message been in the DLQ?
¡ What messages are in the DLQ?
¡ Why is a message in the DLQ?
¡ Can I view the message?
¡ Can I delete one or more messages?
¡ Can I requeue a message?

Capitalware's MQ Technical Conference v2.0.1.6
Messages in the Dead Letter Queue¡ Dead Letter Queue prevents the Queue Manager from
stopping the channel
¡ Need to monitor if messages arrive in the Dead Letter Queue
¡ Need to quickly isolate the cause of the message(s) arriving in the DLQ
¡ Need to be able to resolve the issue with the DLQ messages�Fix the issue�Delete the message(s)�Retry the messages

Capitalware's MQ Technical Conference v2.0.1.6
Rate at which data can be logged¡ For persistent messages the most important resource is
the rate at which you can write to the active log datasets. The maximum rate at which you can log data depends on your DASD and your workload profile.1. DASD dependent. The rate at which you can log to disk depends on
your DASD. If our DASD is mirrored synchronously then this will be slower than if it is not mirrored. If your I/O subsystem is slow this will impact performance.
2. If the workload profile has large persistent messages, then a lot of data can be written in each I/O. If the workload profile has only lots of short messages (a few KB) then there may only be a small amount of data per I/O.
3. Log Switches - if these are exceeding every two minutes, you need to start thinking about a second queue manager for the workload.
Capitalware's MQ Technical Conference v2.0.1.6
Issues with Buffers
§ Do my buffer pools contain enough storage for message management?
§ Am I experiencing a problem now?§ Are my buffer pools filling up?§ How are my buffer pools performing?

Capitalware's MQ Technical Conference v2.0.1.6
Buffer pool usage
Keeping your buffers pools under 85% is key to good performance for short lived messages. This eliminates application I/O to the page set.If all your messages are in the buffer pool ( the optimum for performance) then there should be no reads from the page sets. There may be writes to pages sets during checkpoint activity.
Capitalware's MQ Technical Conference v2.0.1.6
Shared Queue
For performance you should monitor the response time of the structures. The response time will depend on the configuration of the hardware. For example you can get contention on the channels to the CF. If the CF is on the same physical processor as an LPAR the response time will be much better than from a remote processor.Use z/OS facilities, such as RMF to monitor these response times.

Capitalware's MQ Technical Conference v2.0.1.6
MQ is losing my messages! • Why, after all these years, is this still a thing?
– As an overwhelming rule, MQ does NOT lose persistent messages.• There are very few exceptions to this rule.
– Where might the messages have gone?• Messages have been routed somewhere
‘unexpected’• Messages have been discarded by an application• Messages are not really persistent• Message PUT did not complete correctly • Messages have been put, but not committed
31

Capitalware's MQ Technical Conference v2.0.1.6
MQ is losing my messages! …• OK, lets look at some exceptions:
• Pagesets and Logs– Someone co-located the pageset and logs on the same physical
devise and cleared the device. – The log RBA Wrapped, and unless really determined this could not
happen with current MQ versions
• Messages routed somewhere unexpected– Might be a system DLQ or an application DLQ/Backout queue– Might be a new instance of a cluster queue
• Run a trace-route test before and after significant changes in the cluster is a good preventative technique.
– Might be a bad alias queue– Might be where the application ‘really’ told MQ to put it
32
Capitalware's MQ Technical Conference v2.0.1.6
MQ is losing my messages! …. • Messages not really persistent:
– Many applications rely on the queue definition for message persistence. That gets changed, and poof! As if by magic messages start disappearing.
• Messages may have been discarded. Examples where an application discards messages it cannot process rather than posting them to an application backout queue (or application DLQ). DLQ processing program that was discarding messages that did not have a ‘known’ reason code.
• Another all too common scenario, Indoubt UOWs or application has not committed the messages so they cannot be processed.
• Using the log utility may be of assistance.
33

Capitalware's MQ Technical Conference v2.0.1.6
MQ is losing my messages! ….
– Where might the messages have gone? �Queue may have been cleared
�Should have events turned on for this and have a paper trail on clearing of queues.
�Queue may have been unloaded and not yet restored� In dealing with a problem, the contents might have
been moved to a temporary location or downloaded to a dataset
�Messages may have expired�A new one that we, unfortunately, expect to see
�CAPEXPRY is set too low
34

Capitalware's MQ Technical Conference v2.0.1.6
MQ is missing SLAs
¡ More subtle, the reasons for this can include every other symptom (missing messages, etc.)
¡ Quite often this is a natural volume increase and new resource constraints�For example, internal delays caused by longer I/O
response time because both MQ and DB2 are logging as much data as they can, and the controller is at capacity
�At times predictable, if the queue manager SMF Statistics and accounting are being monitored.
35

Capitalware's MQ Technical Conference v2.0.1.6
Missing SLAs – quick info• Use the
DISPLAY QSTATUS command or the MQX
• This will give a quick view into latest put and get date and time
• In this case messages are being put, but the last GET was done several days previously.
36

Capitalware's MQ Technical Conference v2.0.1.6
Missing SLAs ….• If you do not get the
last put and get times, as per this example, then the queue monitoring is not set correctly – or not set correctly when the messages were put ….. There is a difference J
37
Capitalware's MQ Technical Conference v2.0.1.6
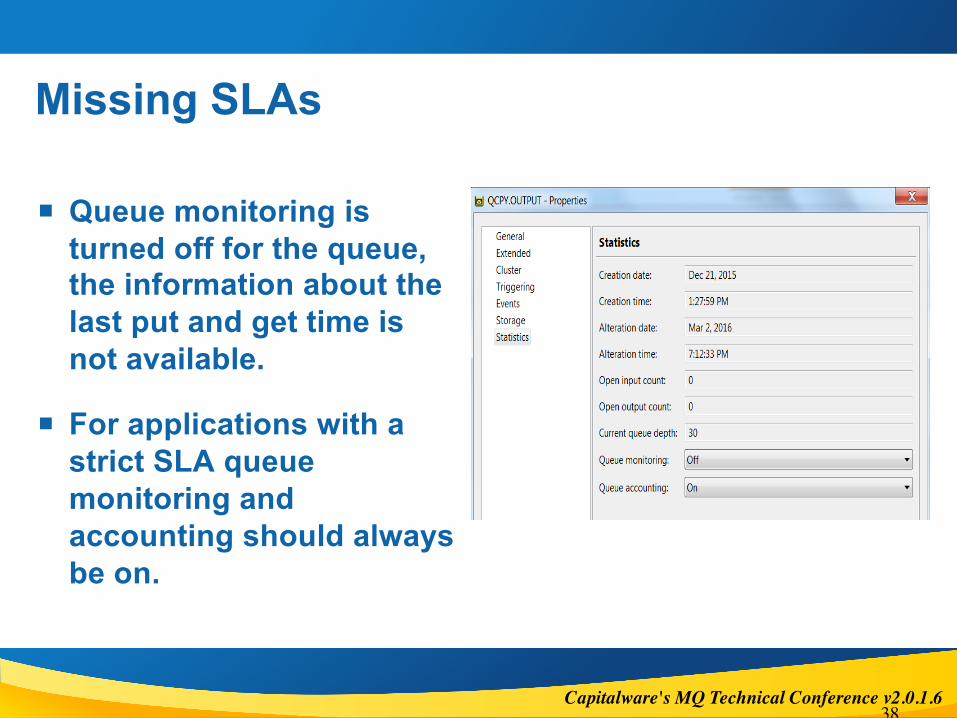
¡ Queue monitoring is turned off for the queue, the information about the last put and get time is not available.
¡ For applications with a strict SLA queue monitoring and accounting should always be on.
Missing SLAs
38

Capitalware's MQ Technical Conference v2.0.1.6
¡ It must be on at the queue manager level as well!
And of course
39

Capitalware's MQ Technical Conference v2.0.1.6
Missing SLAs …• If the last get and put times are more reasonable, and
SLAs are not being met closer investigation is needed.– Hopefully it is as simple as adding a new getting application
instance• May be a spike or early indication of growth• Might be a poison message indicator• However a new application instance can make the problem
worse, when the issue is underlying contention– Database contention– Systems resource contention
• Time to start looking at the SMF, the detailed accounting data
40

Capitalware's MQ Technical Conference v2.0.1.6
MQ is Broken
¡ MQ may really be broken, it happens. �We need to “take it on the chin” …. L
¡ Though often it is just links that are broken, not the queue manager �Look for channel outages first
¡ Often the MQ system admins know that this is happening before the first phone call, automations tools ‘notice’ the events and send urgent email/notification
41

Capitalware's MQ Technical Conference v2.0.1.6
What do the MQ messages tell me? ¡ All MQ for z/OS messages start with CSQ
¡ The fourth character indicates the MQ component
¡ The next three are the message number
¡ The final character is the message type code:�A – Immediate Action Required�D – Immediate Decision Required�E – Action in needed in the future�I – Information, may need to be monitored for the future
42

Capitalware's MQ Technical Conference v2.0.1.6
MQ problems between IBM z/OS® and distributed systems
¡ MQ provides common API across all platforms
¡ Different monitoring/management solutions for each platform?
¡ Best practices dictate looking at MQ environment holistically
¡ Differing backup & recover strategies for MQ objects

Capitalware's MQ Technical Conference v2.0.1.6
MQ Configuration - Administration
¡ Enterprise-wide configuration/administration strategy?
¡ Different strategies depending on platform?
¡ What about backup/recovery?
¡ If an object is modified you need to be able to detect that.

Capitalware's MQ Technical Conference v2.0.1.6
WebSphere Message Broker (IIB)¡ More of a Black Box than MQ
� Execution Groups� Message Flows� Processing Nodes� Threads
¡ Need to understand if IIB is being affected by MQ
¡ Is the Queue Manager running?
¡ Is the Broker connected to the Queue Manager?
¡ Are the issues with the Network?
¡ Are there issues with the OS?
¡ Demands a holistic approach to monitoring to improve MTTR

Capitalware's MQ Technical Conference v2.0.1.646
¡ The Message Broker Explorer enables you to start/stop message flow statistics on the broker, and view the output.
¡ Warnings are displayed advising there may be a performance impact (typically ~3%)
Broker Explorer & Message Flow Statistics
Capitalware's MQ Technical Conference v2.0.1.6
What else?¡ Logs (different for z/OS and Distributed)
¡ Buffer Pools (z/OS)
¡ Page Sets (z/OS)
¡ Shared Queues/Coupling Facility (z/OS)
¡ Clusters
¡ Age of Messages
¡ Queue/Dequeue Rate
¡ Channel Usage
¡ What’s normal activity?
¡ Predictive Analysis

Capitalware's MQ Technical Conference v2.0.1.6
Summary
¡ Once introduced into an environment WMQ and WMB become ubiquitous.
¡ Monitoring/managing your messaging backbone in a silo is not adequate
¡ Start looking at your Enterprise Monitoring & Management strategy holistically.
¡ It may look like the problem is WMQ or WMB, maybe it Is not.
¡ Use automation for corrective action when appropriate

Capitalware's MQ Technical Conference v2.0.1.6
Fantasy vs. Reality
49

Capitalware's MQ Technical Conference v2.0.1.6
Questions & Answers


![JD Edwards EnterpriseOne Tools Messaging Queue Adapter ... · PDF file[1]JD Edwards EnterpriseOne Tools Messaging Queue Adapter Configuration Guide Release 9.1 for WebSphere MQ Guide](https://static.documents.pub/doc/80x56/5ab701bc7f8b9a0f058e841f/jd-edwards-enterpriseone-tools-messaging-queue-adapter-1jd-edwards-enterpriseone.jpg)


