Final 4/12/10 1 EM Protocol for Application of Contingency and Management Reserve for the Acquisition of Capital Asset Projects This document provides guidance for the development and consistent application of government contingency and contractor management reserve (MR) in the planning and execution of DOE capital asset projects in accordance with the requirements of DOE Order 413.3 and the Federal Acquisition Regulations (FARs). This guidance is consistent with Acquisition Letter 2009-01, “Management Reserve and Contingency,” October 6, 2008 from the Office of Procurement and Assistance Management. Project contingency and MR are an integral part of the DOE capital asset project risk management process, providing project managers with the tools to respond to project risks and uncertainties that are inherent in all DOE projects. With appropriate management and funding of projects, coupled with well-administered Federal and contractor Risk Management Plans and Change Control processes, project baselines are well suited to deal with anticipated project risks. In accordance with the DOE O 413.3 project management model, the government cost estimate must include contingency for all project risks during the development of performance baselines. When the government awards all or portions of the project work scope to a contractor, the terms of the contract establish which project risks are borne by the contractor. Budget for contractor’s risks is expected to be included within the contractor’s price, and is used to mitigate the costs associated with contractor execution risks that are realized or to execute mitigation actions or exploit/enhance opportunities. This has been a point of confusion. Contributing to the confusion is that while "contingency" is a term used in both the project and contracting disciplines, its interpretation and application are different between the two disciplines. Part of the challenge faced by the Federal Project Director (FPD), contracting officer, and the integrated project team is ensuring a common basis of understanding of definitions, derivation, and authorization of the use of contractor Management Reserve and government Contingency. The objective of this guidance is to provide additional clarification regarding the development and use of Management Reserve and Contingency in DOE contract and project management spaces. In DOE project terminology “contingency” and “management reserve” are used to identify budgeted resources for risks owned by the government and contractor, respectively. Contingency is the portion of the project budget that is available for risk uncertainty within the project scope, but held outside the contract budget. Contingency is part of the Total Project Cost and government’s baseline, but is not part of the contractor’s baseline. It is used to manage both cost and schedule risk events resulting from, but not limited to, government actions, changed requirements, program and project assumptions, delays in government-furnished services, equipment, and items, and other influences outside the contractor’s control. Contingency is held
Transcript
Final 4/12/10
1
EM Protocol for Application of Contingency and Management Reserve for the
Acquisition of Capital Asset Projects
This document provides guidance for the development and consistent application of government
contingency and contractor management reserve (MR) in the planning and execution of DOE
capital asset projects in accordance with the requirements of DOE Order 413.3 and the Federal
Acquisition Regulations (FARs). This guidance is consistent with Acquisition Letter 2009-01,
“Management Reserve and Contingency,” October 6, 2008 from the Office of Procurement and
Assistance Management.
Project contingency and MR are an integral part of the DOE capital asset project risk
management process, providing project managers with the tools to respond to project risks and
uncertainties that are inherent in all DOE projects. With appropriate management and funding of
projects, coupled with well-administered Federal and contractor Risk Management Plans and
Change Control processes, project baselines are well suited to deal with anticipated project risks.
In accordance with the DOE O 413.3 project management model, the government cost estimate
must include contingency for all project risks during the development of performance baselines.
When the government awards all or portions of the project work scope to a contractor, the terms
of the contract establish which project risks are borne by the contractor. Budget for contractor’s
risks is expected to be included within the contractor’s price, and is used to mitigate the costs
associated with contractor execution risks that are realized or to execute mitigation actions or
exploit/enhance opportunities. This has been a point of confusion. Contributing to the confusion
is that while "contingency" is a term used in both the project and contracting disciplines, its
interpretation and application are different between the two disciplines. Part of the challenge
faced by the Federal Project Director (FPD), contracting officer, and the integrated project team
is ensuring a common basis of understanding of definitions, derivation, and authorization of the
use of contractor Management Reserve and government Contingency. The objective of this
guidance is to provide additional clarification regarding the development and use of Management
Reserve and Contingency in DOE contract and project management spaces.
In DOE project terminology “contingency” and “management reserve” are used to identify
budgeted resources for risks owned by the government and contractor, respectively.
Contingency is the portion of the project budget that is available for risk uncertainty within the
project scope, but held outside the contract budget. Contingency is part of the Total Project Cost
and government’s baseline, but is not part of the contractor’s baseline. It is used to manage both
cost and schedule risk events resulting from, but not limited to, government actions, changed
requirements, program and project assumptions, delays in government-furnished services,
equipment, and items, and other influences outside the contractor’s control. Contingency is held
Final 4/12/10
2
by DOE for project risks that are owned by DOE and whose obligation onto the contract vehicle
typically should not occur without determining the impact on the contract and project. Where a
legitimate change to the contract is required, the project personnel must coordinate with the
contracting officer to identify and negotiate the change and modify the contract. The contracting
officer will only modify the contract after the contractor's proposed costs have been fully
reviewed and analyzed, and is satisfied that the negotiation has resulted in a fair and reasonable
price1.
Management reserve is the amount of the total contract budget withheld for management
control by the contractor for risk uncertainty within the project scope that is within the scope of
the contract. Management reserve should be risk-based. The contractor shall use MR in
accordance with ANSI/EIA-748. The contractor must report the use of MR in the monthly
project performance reports.
Contracting Approach. “Contingency” and “management reserve”, as defined in DOE O 413.3,
are not synonymous with those provided in the FAR. In fact, the term “management reserve” is
not used in the FAR, and is not considered a discrete element of cost. Within the FAR, the term
“contingency” refers to contractor contingency and not Government contingency, as defined by
DOE O 413.3. If MR is not recognized as a discrete element of cost such as labor, overhead,
materials, etc., how then is it factored into a contractor’s cost proposal and negotiated into the
contract? The answer is that the FAR does allow for contractors to price in contingencies that
meet specific conditions, i.e., “those that may arise from presently known and existing
conditions, the effects of which are foreseeable within reasonable limits of accuracy”, such as
escalation for out-year prices, anticipated costs of rejects and defective work, etc. In fact, FAR
31.205-7 states that “contingencies of this category are to be included in the estimates of future
costs so as to provide the best estimate of performance cost.” As a general matter, in a cost
proposal, contractor contingency should be tied to specific work scope and be proposed as
standard cost elements recognized by the FAR. What this implies is that the contract price is not
allowed to explicitly call out a separate budget for management reserve, since reserves for
uncertainties within the scope of the contract are expected to be included within the contractor
price. Management reserve is carved out after the contract value has been negotiated.
While DOE Acquisition Letter 2009-01 provides an extensive discussion of pricing of contractor
reserves, a source of confusion has been the interpretation of certain guidance stated in AL 2009-
01 with respect to the DOE O 413.3 project management model. Specifically, AL 2009-01 states
“Contracting officers shall not include in the contract price any amount (for management reserve,
1 Acquisition Policy Flash 2008-39 provides more extensive coverage on change orders and requests for equitable adjustment; Acquisition Guide 15.4-3 provides added guidance on the analysis and evaluation of a contractor’s proposal.
Final 4/12/10
3
contingency, etc.) to cover prospective requests for equitable adjustments, changes, or risks that
might or might not occur during performance.” Equitable adjustments, changes to the contract,
and other unknown risks do not satisfy the requirement that contractor contingencies that are
priced into a contract must be those that arise from presently known and existing conditions, the
effects of which are foreseeable within reasonable limits of accuracy. Changes to the contract,
equitable adjustments, and other unknown risks simply cannot be reasonably priced. Changes of
this nature are generally handled through the "Changes" clause as long as the change is within
the general scope of the contract.
FAR 31.205-7 also requires that contingencies, “the effect of which cannot be measured so
precisely as to provide equitable results to the contractor and to the Government; e.g., results of
pending litigation”, are to be excluded from cost estimates and should be disclosed separately
(including the basis upon which the contingency is computed) to facilitate the negotiation of
appropriate contractual coverage. The expectation is that the contractor’s proposal includes a
clear statement of assumptions and risks that are to be borne by the government that the
Government may accept or reject.
Contract Considerations. The discussion thus far is primarily focused on cost reimbursement
contract types. However, additional discussion on the relationship between risk and contract
type is warranted, especially with respect to firm fixed price contracts. Firm fixed price
contracts are frequently utilized for capital asset projects throughout the Government. The issue
of risk assumes a different complexion in a fixed price environment because the cost risk is
wholly borne by the contractor, the contractor is generally not required to provide cost data to the
Government, and they are not required to provide visibility into the formulation and use of their
MR. Projects that can be priced on a firm fixed price basis will tend to be well-defined and
characterized in terms of work scope. Cost overruns are absorbed by the contractor, not the
Government.
Under a cost reimbursement contract, the tools, processes, and systems that are required to award
and administer the contract reflect efforts to mitigate cost and performance risk that in a cost
reimbursement environment are primarily borne by the Government.
An additional consideration with respect to managing risk on a capital asset project is whether it
will be performed by the prime contractor, a first tier subcontractor, or a lower tiered
subcontractor. FPDs and Contracting Officer’s Representatives (CORs) should always be
mindful that the Government only has privity of contract with the prime contractor, and not with
subcontractors, therefore, the Government’s desire to manage a project should carefully account
for the role of the prime contractor in directing subcontractors and managing risk for the work
scope that has been subcontracted.
Project Management Approach. DOE O 413.3 prescribes a project management model that
supports effective contract management. To comply with DOE O 413.3 and to establish the
Final 4/12/10
4
components of the Performance Baseline, contractor costs must be separated, typically after
contract award, to identify a portion of the contract price as MR; however, this does not imply
these costs will be subsequently removed by the contracting officer regardless of contract type.
The contractor is expected to establish a project management approach that separates the contract
budget base (contract price minus profit/fee) into a budget for performance measurement
baseline (PMB) and a budget for MR. MR is maintained separately from the PMB and is utilized
through the contractor’s change control process. MR is established after contract award by the
contractor. MR should be risk based, and quantitatively derived and justified.
When a pre or post award integrated baseline review (IBR) is required in accordance with FAR
Subpart 34.2 and 52.234, the contractor must demonstrate the ability of the PMB to successfully
execute the project and attain cost objectives. This demonstration can best be achieved by
identifying the threats and opportunities that the contractor has priced in its bid proposal and the
approach to be used in managing the associated budget for those threats and opportunities.
During project execution, MR should not be used to resolve past variances (positive or negative)
resulting from poor performance or to address issues that are beyond the scope of the contract
requirements. Appropriate uses of MR include revising plans for remaining work due to realized
risk events, implementation of risk handling actions, and execution of opportunities to accelerate
remaining work in the PMB to increase confidence in schedule commitments. Though DOE
does not require its authorization for contractor use of MR, DOE requires the reporting of the use
of MR as part of the monthly reporting of performance against the established PMB. MR and
DOE contingency must be monitored and evaluated as part of the ongoing project control and
oversight functions. The use of cost and schedule contingency must be planned, reported, and
managed over the project duration to ensure successful project completion.
EM policy is that all capital asset projects be analyzed using a minimum 80 percent confidence
level and such confidence be reflected in the project funded contingency, budgetary requests, and
funding profiles. If a project has a performance baseline change, the FPD should consider
reanalyzing the risks at a higher confidence level for budgetary requests and funding profiles.
DOE does not provide confidence level guidance for the determination of MR. Consistent with
DOE O 413.3, the contractor is expected to complete the full contracted scope of work.
Final 4/12/10
5
Appendix
1. Risk Identification, Development and Use of Contingency and Management Reserve
DOE’s Risk Management Guide (DOE G 413.3-7) provides detailed guidance on effective risk
management process. Contingency and Management Reserve (MR) are project cost elements
directly related to project risks and are part of the project cost estimates.
The specific confidence level (CL) used to develop the project performance baseline estimate is
determined by the project’s FPD/Integrated Project Team (IPT) and is approved by the
Acquisition Executive. The project confidence level should be based on but not limited to the
project risk assumptions, project complexity, project size, and project criticality. At a minimum,
project performance baselines should be estimated, budgeted, and funded to provide at least an
80 percent confidence level for EM capital asset projects. If a project has a performance baseline
change, the FPD should consider reanalyzing the risks at a higher confidence level for budgetary
requests and funding profiles to ensure project completion.
This DOE contingency and management reserve protocol defines four categories of contingency, each of which is discussed throughout this document.
• DOE contingency budget is identified as funded contingency for use by the FPD.
Contingency is the risk based, quantitatively derived portion of the project budget that is
available for managing risks within the DOE performance baseline. At a minimum, EM
capital asset project costs should be estimated to provide an 80 percent confidence level.
• DOE schedule contingency is the risk-based, quantitatively derived portion of the overall
project schedule duration that is estimated to allow for the time-related risk impacts and
other time-related project uncertainties. Project schedule contingency should be
estimated to provide a minimum 80 percent confidence level.
• Contractor management reserve budget is determined by the contractor and is the risk
based, quantitatively derived portion of the contract budget base (CBB) that is set aside
for management purposes to handle risks that are within the contractor’s contractual
obligations. Once the CBB has been established, it is allocated by the contractor to MR
and the Performance Measurement Baseline (PMB). The contractor’s determination of
MR is not intended to justify a post contract increase to the CBB. MR is maintained
separately from the PMB and is utilized through the contractor’s change control process.
MR should not be used to resolve past variances (positive or negative) resulting from
poor contractor performance or to address issues that are beyond the scope of the contract
requirements.
• Contractor schedule reserve is determined by the contractor, and is the risk based,
quantitatively derived portion of the overall contract schedule duration estimated to allow
the contractor time to manage the time-related impacts of contractor execution risks and
other contractor duration uncertainties within the contract period
reserve does not add time or schedule duration to the contracted end date.
The quantitative methodologies used to analyze DOE pr
evaluate project cost and schedule estimate uncertainties and discrete project risks. The analysis
should aggregate the probability and consequences of individual risks, and cost and schedule
uncertainties to provide an estimate of the potential project costs.
The purpose of the quantitative risk analysis is to provide
completion date estimates using statistical modeling techniques such as Monte Carlo, Quasi
Monte Carlo, sensitivity simulations, and other stochastic methodologies depending upon the
project data.
While the use of the Monte Carlo simulation is one of the standards used by DOE, the use of alternate forms of quantitative analysis may be used in conjunction with Monte to validate contingency conclusions. Other suggested forms of quantitative analysis that are often used include: decision trees, influence diagrams, system dynamics models, and neural networks. Figure 1.1 below shows the typical componenbaseline representing the fundamental building blocks used in this protocol.
Figure 1.1: Performance Baseline Components
6
other contractor duration uncertainties within the contract period. Contractor schedule
reserve does not add time or schedule duration to the contracted end date.
The quantitative methodologies used to analyze DOE projects should use an objective analysis to
evaluate project cost and schedule estimate uncertainties and discrete project risks. The analysis
should aggregate the probability and consequences of individual risks, and cost and schedule
vide an estimate of the potential project costs.
The purpose of the quantitative risk analysis is to provide risk-based project budget and
completion date estimates using statistical modeling techniques such as Monte Carlo, Quasi
imulations, and other stochastic methodologies depending upon the
While the use of the Monte Carlo simulation is one of the standards used by DOE, the use of alternate forms of quantitative analysis may be used in conjunction with Monte Carlo simulation to validate contingency conclusions. Other suggested forms of quantitative analysis that are often used include: decision trees, influence diagrams, system dynamics models, and neural
below shows the typical components of the DOE project performance baseline representing the fundamental building blocks used in this protocol.
: Performance Baseline Components for Capital Asset Projects
Final 4/12/10
. Contractor schedule
reserve does not add time or schedule duration to the contracted end date.
ojects should use an objective analysis to
evaluate project cost and schedule estimate uncertainties and discrete project risks. The analysis
should aggregate the probability and consequences of individual risks, and cost and schedule
project budget and
completion date estimates using statistical modeling techniques such as Monte Carlo, Quasi-
imulations, and other stochastic methodologies depending upon the
While the use of the Monte Carlo simulation is one of the standards used by DOE, the use of Carlo simulation
to validate contingency conclusions. Other suggested forms of quantitative analysis that are often used include: decision trees, influence diagrams, system dynamics models, and neural
project performance
for Capital Asset Projects
Final 4/12/10
7
2. Cost and Schedule Contingency Development Process
DOE O 413.3 requires that DOE project estimates be developed based on qualitative and
quantitative analysis of project risks and other uncertainties. The DOE qualitative and
quantitative analysis process begins in the project’s planning stage with the identification of
project risks during the initial project planning phase prior to the first Critical Decision (CD)
point (approval of mission need). After CD-0, project development and planning documentation
are prepared that include the initial Federal Risk Management Plan (FRMP) as part of the
preliminary Project Execution Plan (PEP). During this phase of the project, the initial
development of the project risk register is initiated with the identification of potential project
risks and enabling assumptions.
At CD-1, the baseline scope is refined enough to develop a preliminary baseline cost range and
schedule. The FRMP continues to evolve as the project scope is refined, new risks are added to
the risk register and existing risks are re-examined and the project knowledge base increases.
In preparation for the CD-2 project phase, the project performance baseline estimate is refined to
include risk handling costs and evaluated to determine the project budget needed to provide an
appropriate confidence level (CL) to ensure the project’s success. The identified DOE project
risks are qualitatively and quantitatively evaluated to determine the likelihood of occurrence and
the potential impacts to the project should the risk events occur.
2.1 Quantitative Contingency Analyses
The DOE G 413.3-7, Risk Management Guide, states the purpose of the quantitative risk analysis is to provide budget and completion date estimates that include the effects of the project risks and other project uncertainties using statistical modeling techniques such as Monte Carlo analyses or other similar methodologies. Other forms of quantitative analysis may be used in conjunction with Monte Carlo simulation including:
• Decision trees.
• Influence diagrams.
• System dynamics models.
• Neural networks.
This document assumes Monte Carlo methodologies will be used in the development of the cost and schedule baseline models. The diverse and unique nature of DOE projects characterized by an assortment of distinct technologies, physical locations, project duration, and project size has a significant impact on the risk profile of each DOE capital asset project that makes it impossible to establish a prescriptive procedure or single quantitative risk model for determining a project’s contingency needs. Consequently, only a basic framework is used to outline considerations essential in the development of DOE contingencies.
2.2 Cost and Schedule Risk Models
DOE contingency risk models are used to evaluate the effects of risk impacts and estimate uncertainties on project cost and schedule performance baselines. The results of the risk analysis
Final 4/12/10
8
are used to establish the cost and schedule contingency needed by the project to provide a suitable confidence level for DOE project success. The analyses may use one or more risk models to evaluate the cost impacts and the associated schedule impacts.
For each risk, a percent or percentage distribution is assigned to the probability (the likelihood of the risk occurring), a dollar value or dollar value distribution is assigned to the cost impact, and a schedule duration impact or duration distribution is assigned to the affected activity in the schedule.
In general the concept is implemented as:
EV = Σ(PRi x CIRi) where,
EV = Expected Value of cost impact of all risks PRi = Probability of a risk occurring CIRi = Cost Impact of a risk occurrence
Note: ∑ is not the summation of individual expected values for each risk, but represents a stochastic process (e.g. Monte Carlo simulation) using the collective probabilities and cost impacts for all the identified risk events.
Figure 2.1 is a sample from a DOE construction project risk register showing the residual risk data elements used for modeling the probability of occurrence (Probability %) and the triangular distribution representing a three point estimate of the anticipated range of cost and schedule impacts.
Figure 2.1: Sample Risk Register
The results of Monte Carlo analyses are generally summarized by a probability distribution function (PDF) and a cumulative distribution function (CDF), as shown in Figure 2.2. The PDF, also described as a probability density function, represents the distribution of the analytical model outcomes. As an example, the Monte Carlo analysis may be designed to estimate the cost or duration of a project. The PDF represents the number of times a certain cost or duration is achieved. The CDF is a statistical function based on the accumulation of the probabilistic likelihoods of the analytical analysis. In the case of the DOE risk analysis, it represents the likelihood that at a given probability the project cost or duration will be at or below a given value. As an example, the x-axis might represent the range of potential project cost values evaluated by the Monte Carlo simulation and the y-axis represents the project’s probability of completion.
Best Case Most Likely Worst Case Best Case Most Likely Worst Case
An advantage of an integrated cost and schedule risk model is the ability to capture schedule related costs impacts, such as level-of-effort (LOE) support activities that increase project costs as schedule related risk impacts delay or extend work efforts. Ideally, the integrated risk model is based on a life-cycle resource loaded critical path schedule to which cost and schedule risks and cost and schedule uncertainties are applied. Integrated risk models increase the flexibility of the risk analysis and reduce the amount of manual coordination needed to model cost and schedule risk impacts.
Project risks and the associated cost and schedule impacts are the primary inputs to the risk model and are maintained within the project’s risk register. Figure 2.3 depicts a conceptual risk model showing typical inputs and outputs.
Figure 2.3: Conceptual Risk Analysis Process
Contractor Budget Base
305
244
183
122
61
0
Fre
qu
en
cy
of
Oc
cu
rren
ce
Cu
mu
lativ
e P
rob
ab
ility
— 100 %
— 95 %
— 90 %
— 85 %
— 80 %
— 75 %
— 70 %
— 65 %
— 60 %
— 55 %
— 50 %
— 45 %
— 40 %
— 35 %
— 30 %
— 25 %
— 20 %
— 15 %
— 10 %
— 5 %
500
600
800
PDF Curve
500 600 700400300 800 900 1000 1100 1200
CDF Curve
Final 4/12/10
10
2.3 Cost Risk Model
DOE capital asset projects are estimated to provide a CL adequate to ensure project success which includes evaluation of all project risks. Risk models should include contractor execution risks and DOE project risks. The risk cost model should provide an estimate of the Performance Baseline with at least an 80 percent confidence level for success, which includes the contractor’s CBB, profit/fee, and government other direct costs. The contractor MR is determined by the contractor and represents the amount of the CBB that will be used for project management purposes for accomplishing the work scope within the contractor’s contractual PMB.
When developing risk models, care should be exercised to assure the risk models are developed using appropriate performance baseline information and project risk assumptions.
The cost risk model should:
• Include contractor execution risks, DOE risks, and all estimate uncertainties that are within the project baseline.
• Contain enough detail to allow segregation of contractor execution risks and DOE risks.
• Contain enough detail to allow project risks to be associated with the Work Breakdown Structure (WBS) they affect.
• Include a provision for uncertainty ranges in cost escalation rates for the project.
• Allow correlated DOE risks that affect multiple cost elements, e.g., escalation rates, to be modeled at a high level to preserve the dependent relationship among correlated risks.
• Include sufficient information to estimate costs associated with uncertainties in task durations consistent with the schedule risk model.
• Allow for inclusion of threats and opportunities.
• Allow risk impacts to be placed in the appropriate fiscal year to support the identification of annual contingency budgeting and reporting requirements.
2.4 DOE Schedule Risk Model
Schedule risk models should be based on the DOE project performance baseline schedule. If practical, the DOE schedule risk model should be developed to include the schedule impacts of the contractor execution risks and DOE project risks, as well as any schedule duration uncertainties.
The schedule risk model should:
• Contain both contractor execution risks and DOE risks that fall within the project baseline.
• Contain enough detail to allow segregation of contractor execution risks and DOE risks.
• Contain enough detail to distinguish among DOE schedule activities that have different degrees of schedule uncertainty and should include estimate uncertainties.
• Contain enough detail to allow specific DOE risk events to be associated with the schedule activity that they affect.
• Estimate the schedule impact on LOE activities so cost increases associated with schedule slippages can be calculated and incorporated into the contingency estimates.
Final 4/12/10
11
• Allow for alterations in activity duration that result from implementation of DOE risk handling strategies or opportunities.
2.5 Determining Contingency Amounts
A common method used to evaluate risk model results is through the use of CDF curves, also referred to as S-curves. As an example, for a cost risk model, the S-curve represents the probability of completing the project at or below a given project cost. In this example the x-axis represents the range of potential project cost values estimated by the Monte Carlo simulation and the y-axis represents the probability of project completion. Figure 2.4 illustrates two S-curves for a hypothetical project. The S-curve on the left is based on the CBB and the S-curve on the right is for the DOE capital asset project performance baseline and includes the contractor execution risks and DOE project risks.
Figure 2.4: S-Curves of Contractor CBB and DOE Performance Baseline
2.6 Determining Schedule Contingency
The DOE schedule contingency is based on the same risks used in the development of the DOE cost contingency. The DOE schedule contingency should be developed using a critical path schedule. Schedule activities that are affected by an identified risk or duration uncertainty are modeled in the schedule risk analysis with an appropriate probability distribution.
The calculation of schedule contingency is an iterative process requiring an initial analysis of the schedule to determine the base schedule contingency values followed by a revision of the schedule to adjust work scope to meet the existing selected key milestones and deliverable dates.
The FPD may alternately choose to apply the DOE schedule contingency to the end of milestones and/or the project completion date to determine the expected completion date should
Probabilistic Projection of Cost using Monte Carlo Analyses
0%
10%
20%
30%
40%
50%
60%
70%
80%
90%
100%
Pro
ba
bil
ity o
f C
om
ple
tio
n a
ta
giv
en
Pro
jec
t C
os
t
CBB PB
Capital Asset Project Cost
Based on Contactor Budget Base
80% CL Includes all Contactor Execution Risks & DOE Project Risks
Probabilistic Projection of Cost using Monte Carlo Analyses
0%
10%
20%
30%
40%
50%
60%
70%
80%
90%
100%
Pro
ba
bil
ity o
f C
om
ple
tio
n a
ta
giv
en
Pro
jec
t C
os
t
CBB PB
Capital Asset Project Cost
Based on Contactor Budget Base
80% CL Includes all Contactor Execution Risks & DOE Project Risks
project risks be realized that delay the anticcontractor schedule reserve, which cannot add time or schedule duration to the contracted end date.
2.7 Risk Model Outputs
To support the required budgeting, management, and reporting requirements of the prisk analysis should provide the following:
• The risk analysis models should be able to produce a PDF and a CDF for the project.
• The risk analysis models should be able to produce a PDF and a CDF for each selected milestone.
• The models should be capable of performing a sensitivity analysis for project cost and schedule elements. Risk analysis sensitivity results are typically presented as tornado diagrams that provide an analytical and visual representation of risk event impacts.
• Ideally, the model should place resulting contingencies in a time frame to allow for fiscal year budgeting of DOE contingency. Figure 2.5 illustrates how projections can be depicted.
Figure D
12
project risks be realized that delay the anticipated project completion. Note that this differs from contractor schedule reserve, which cannot add time or schedule duration to the contracted end
To support the required budgeting, management, and reporting requirements of the prisk analysis should provide the following:
The risk analysis models should be able to produce a PDF and a CDF for the project.
The risk analysis models should be able to produce a PDF and a CDF for each selected
d be capable of performing a sensitivity analysis for project cost and schedule elements. Risk analysis sensitivity results are typically presented as tornado diagrams that provide an analytical and visual representation of risk event impacts.
the model should place resulting contingencies in a time frame to allow for fiscal year budgeting of DOE contingency. Figure 2.5 illustrates how contingency
depicted.
Figure 2.5: Contingency Budget Projection
Final 4/12/10
Note that this differs from contractor schedule reserve, which cannot add time or schedule duration to the contracted end
To support the required budgeting, management, and reporting requirements of the project, the
The risk analysis models should be able to produce a PDF and a CDF for the project.
The risk analysis models should be able to produce a PDF and a CDF for each selected
d be capable of performing a sensitivity analysis for project cost and schedule elements. Risk analysis sensitivity results are typically presented as tornado diagrams that provide an analytical and visual representation of risk event impacts.
the model should place resulting contingencies in a time frame to allow for fiscal contingency budget
Final 4/12/10
13
2.8 Updating Contingency Analyses
The IPT must analyze project risks and update the risk register on a continual basis. Quantitative cost and schedule contingency analyses should be updated periodically throughout the project life-cycle. At a minimum, the DOE quantitative analysis should be reviewed semi-annually and updated if necessary. Monthly project performance reporting should include a review of the use of MR and contingency.
As needed, the FPD should update the project contingency analysis to determine if scope revisions or unanticipated risks present the potential for future budget shortfalls or extensive project delays based on new information. The identification of new or unanticipated risks and project uncertainties do not necessarily provide justification for increasing the project completion date, the TPC, or the project budget and funding profiles originally established.
3. Contingency Estimate Inputs and Interface Needs
Development of cost and schedule contingency for capital asset projects requires rigorous analysis of potential risks, mitigation plans, and opportunities.
3.1 Risk Management Input Requirements
The necessary quantitative risk analysis inputs identified within the DOE Risk Management Guide include but are not limited to:
• DOE and contractor risk management plans.
• Historical records (especially where similar risks were handled).
• Actual costs to date.
• Critical Path analysis.
• Subject matter experts.
• Delphi techniques.
• Interviewing staff, crafts, retirees, and others familiar with similar work efforts at the site or other sites.
• Technical records such as safety analysis documents including the risk and opportunity assessment, quality assessments, safeguards and security analyses, and environmental assessments.
Beyond the inputs described in the Risk Management Guide, the project schedules must integrate the contractor and DOE schedules to allow the use of Monte Carlo simulation software.
To facilitate Monte Carlo analysis, all schedules and cost estimates must include the following characteristics:
• Activities in the schedules must be logically linked and must have a well defined critical path.
• Critical path and near-critical path activities must have duration uncertainties defined.
• A resource loaded schedule is required by DOE O 413.3 and is necessary for integrated cost/schedule risk models.
Final 4/12/10
14
• LOE activities need to be clearly identified, logically linked, and declared as a type LOE activity, e.g., not a fixed duration activity. (Modeling requirements of scheduling details will vary by application.)
• Risks need to be mapped to schedule activities or the lowest WBS element in a higher level schedule.
• Co-dependent risks need to be clearly identified and evaluated to segregate impacts.
• Complete DOE and contractor cost estimates must be available.
• Schedule uncertainties must be defined for each WBS element.
• If an integrated cost/schedule model is not being performed, hotel loads or minimum safe conditions need to be defined.
3.2 Estimate Uncertainty
Estimate uncertainties are fundamental contributors to cost growth and are expected to decrease over time as the project definition improves and the project matures. Estimate uncertainty is a function of, but not limited to, the quality of the project scope definition, the current project life-cycle status, and the degree to which the project uses new or unique technologies. Estimate uncertainties occur throughout the DOE baseline. One approach to account for estimate uncertainty is to use uncertainty ranges established by the professional societies such as the Association for the Advancement of Cost Engineering International (AACEI), Table 2.1, or other estimating guidance. Estimate uncertainty contributes to both cost and schedule contingency.
Class of Cost Estimate
Estimate Uncertainty (Low Range)
Estimate Uncertainty (High Range)
Class 5 – Concept Screening -20% to -50% +30% to +100%
Class 4 – Study or Feasibility -15% to -30% +20% to +50%
Class 3 – Budget Authorization -10% to -20% +10% to +30%
Class 2 – Control or Bid -5% to -15% +5% to +20%
Class 1 – Check Estimate -3% to -10% +3% to +15%
Table 2.1: Estimate Uncertainty Range as a Function of Estimate Class
3.3 Risk Events
Risk events, by definition, include both threats and opportunities. These risk events may or may not happen at some future time. An example of a risk event identified as a threat would be if a new technology fails to work as expected. An example of a risk event identified as an opportunity would be the elimination of project work scope as a result of a new technology.
Risk events can be represented as probabilistic distributions that identify the likelihood of the risk event occurring with separate distributions that describe the consequence or impact to the project if the risk event occurs. Risk events have schedule and/or cost consequences. One must consider the impacts that realized risks might have on the critical path or near-critical path resulting in increases to the overall project schedule affecting escalation of costs, overhead costs, and other project execution costs associated with work scope delays and/or extensions.
Final 4/12/10
15
In summary, when assessing the project risks the FPD, IPT, and Project Manager should:
• Consider and distinguish between estimate uncertainty and risk events.
• Quantify the risk likelihood, and the risk cost and schedule impacts.
• Identify the activities in the schedule that are affected by the risks.
• Estimate the cost of each risk handling strategy for consideration as additional baseline work scope, and consider the ramifications of excluding the handling strategy in the baseline work scope.
• Consider the potential impacts of secondary risks resulting from specific risk handling strategies.
• Quantify the residual risks likelihood, and the residual risks cost and schedule impacts.
3.4 Categories of Risk
Development and management of project cost and schedule contingency requires clarity regarding risk ownership and risk characterization.
Project risks are potential threats or opportunities categorized as:
• DOE program/portfolio risks.
• DOE project risks.
• Contractor execution risks.
• Unknown-unknowns
As described in the DOE Risk Management Guide, identification of contractor execution (performance) risks, DOE project risks, and DOE programmatic risks are done by the IPT.
• DOE Program/Portfolio Risks are risks that are owned and managed outside of the project and cannot be managed within the project funding. These are typically associated with the Enabling or Bounding Assumptions referenced in the Risk Management Plan. Portfolio risks are owned and managed by DOE, and represent inter-dependent risks common to more than one project. The cost and schedule impacts of program/portfolio risks are not, and should not, be included in a project’s contingency calculation. Examples include:
o Closure of Waste Isolation Pilot Plant.
o National repository opening later than anticipated.
o Congressional funding reductions.
o DOE funding reductions.
o Re-programming.
o Stakeholder changes.
o Site mission changes.
o Regulatory and Statutory changes.
o DOE directives.
Final 4/12/10
16
• DOE Project Risks are risks that are within the project baseline but are generally beyond the contractor’s control and are managed at the project level. Risks cannot be effectively shared between DOE and the contractor, and must be handled by partitioning them into separate DOE and contractor risks. Examples of DOE risks include:
o Major technological failures.
o Coordination across site programs.
o Changes due to direction from Agency senior management. .
o Unusual weather delays.
o Interpretation of Regulatory and Statutory requirements (how clean is clean).
o Design (one-of-a-kind, maturity).
o Procurement (government furnished services and items (GFS/I).
o Contractor performance (based on work history).
• Contractor Execution Risks are those that may fall within the contractor’s contractual obligations. Examples include:
o Material availability (non GFS/I).
o Market pricing.
o Failure of the design (non-GFS/I).
o Labor availability.
o Productivity
o Procurement (supplier performance, and product availability).
o Subcontractor performance.
o Safety (compliance, occurrences and events, etc.).
o Basic process uncertainty.
o Normal weather delays.
• Unknown-unknowns (can also be DOE project risks) are program risks that are identified during the execution of the project through either routine risk management practices or because they have been realized.
It is not possible to identify all risks at the onset of a project. As new risks are identified, they should be added to the risk register. Unidentified risks might originally be unanticipated because the probability of the event is so small that its occurrence is virtually unimaginable. Alternatively, an unidentified risk might be one that falls into an unanticipated or uncontrolled risk event category. This would include Hurricane Katrina-type events or an event that materialized because of other events outside the project baseline control.
Final 4/12/10
17
4. Management and Reporting of MR and Contingency
The integrated project baseline, cost, schedule, and risk analysis process is used to identify and quantify the various risks and uncertainties that have the potential to affect project performance.
4.1 Use of Contingency
Contingency is used to pay for, or recover from, the impacts of realized DOE project risks, poor performance, and DOE estimating uncertainties and inaccuracies incurred in the execution of the project baseline. DOE contingency is managed through a formal baseline configuration change control process and utilization should be reported as the contingency is expended. It is important to reiterate that contingency and MR should not be used to resolve past negative variances resulting from poor contractor performance and MR is not to be used to address issues that are beyond the scope of the contract requirements. Cost variances should be preserved during project realignments and/or re-sequencing of project activities.
To a greater or lesser extent, the occurrence of a risk event or the impact of the risk event may be mitigated at the direction of the FPD. The FPD may adopt various risk handling strategies that decrease a risk’s likelihood of occurrence or decrease the anticipated risk impact should the risk event occur. While all project budgets should include funds for risk management (including risk mitigation strategies to reduce the probability and/or consequence of risk events) within their budget, the project budget should not be viewed as the primary means to deal with risks after a risk event occurs. These funds are intended to be used to pursue the selected mitigation strategies in the FRMP. For example, conducting research and development to mitigate a specific risk does not mean the funds are held as contingency until the event occurs. The funds are intended to be used to prevent the event from occurring, or reducing its impact. Consequently, the risk mitigation effort should be an active work package within the WBS that is scheduled and executed as part of the project work scope. Various risk handling strategies are discussed in the DOE Risk Management Guide.
4.2 Project Change Control Processes
When a contractor risk is realized, the contractor uses the contractor’s change control process, employing standard Earned Value Management System practices and procedures, to transfer MR to the PMB. As MR is utilized, the PMB is adjusted to reflect the change and the CBB remains unchanged. If a contractor opportunity is realized, MR can be increased and the PMB is decreased accordingly, while the CBB remains unchanged. The contractor’s change control process and the necessary approval thresholds are documented in the contractor’s Project Management Plan.
When a DOE risk is realized, contingency budget may be transferred to the project. However, this should not occur until the impact of the realized risk has been determined, necessary changes to the contract have been identified and coordinated with the contracting officer. The transfer of contingency budget to the project PMB should not occur until the contract has been modified. The FPD and the Contracting Officer use the Project and Contract Change Management processes to ensure the project baseline and the contract remain aligned. The baseline change control process and the necessary approval thresholds are documented in the PEP.
Final 4/12/10
18
4.3 Monitoring and Evaluating
Since contractor cost and schedule reserves and DOE cost and schedule contingency are finite resources, their use should be monitored, tracked, and evaluated as part of the ongoing project control function. The reporting requirements for cost and schedule reserve and DOE cost and schedule contingency usage can be tailored to meet the project needs.
4.3.1 Monitoring and Evaluating Contractor Reserves and DOE Contingencies
Contractors should plan the usage of MR and schedule reserves and FPDs should plan the usage of DOE cost and schedule contingencies over time, based on the anticipated risk occurrences and impacts. MR and DOE contingency should be time-phased over the project duration, allocated by fiscal year. Trending usage of these resources may indicate larger unforeseen issues as latent risks become visible. Figure 4.1 is an example of a utilization curve showing the planned and actual resource usage.
Figure 4.1: Example of a Utilization Curve
4.3.2 Summary of MR Reporting Elements
The contractor should report the following information to the FPD as part of their monthly Contractor Performance Report requirements:
• MR and schedule reserve available at the beginning of the month.
• An updated MR utilization curve.
• An update of schedule reserve utilization, if applicable
• A list of realized risks (threats and opportunities) that required usage of MR and schedule reserves (amount changed, Risk Identification (ID), and Title/Description of risk).
• A list of risks that were realized and funded by delay of scope (amount, Risk ID, Title/Description, Change Control ID #, and scope that was delayed).
• A list of risk opportunities that were realized and the days of schedule that were gained and/or MR gained.
• Adequacy of remaining contractor MR and schedule reserves.
• Cost Performance Index (CPI) and Schedule Performance Index (SPI)
Example Utilization Curve
0
5,000,000
10,000,000
15,000,000
20,000,000
25,000,000
20072007 20082008 20092009
= Projected Utilization= Actual Utilization
Final 4/12/10
19
4.3.3 Summary of DOE Contingency Reporting Elements
The FPD should report the following information to DOE-Headquarters as part of their Quarterly/Monthly Project Review requirements:
• DOE cost and schedule contingency available at the beginning of the current month.
• Updated DOE project contingency utilization.
• Update of DOE schedule contingency utilization.
• List of risks (threats and opportunities) that required use of cost and schedule contingency (amount changed, Risk ID, Title/Description of risk, and previously unidentified risks).
• List of risks that were realized and funded by delay of scope (amount, Risk ID, Title/Description, Change Control ID #, and delayed work scope).
• List of risk opportunities that were realized and the days of schedule that were gained and/or DOE project contingency gained.
• Adequacy of remaining DOE cost and schedule contingencies.
• List of closed project risks.
• List of newly identified project risks.
• List of risks nearing realization.
• Updated risk register.
5. Derivation of MR and DOE Contingency
This section illustrates the procedural steps that would be followed to derive both contractor MR and DOE Contingency for a hypothetical DOE project. This is a fictitious project, but the steps are extracted and summarized from actual DOE projects as well as various resource documents, including this guide. The project illustrated here is conventional construction of a new office and laboratory building (non-nuclear), with a base cost estimate (no contingency or MR) of $150 million. The shaded areas represent the new information required at each step of the risk management process.
5.1 Contractor’s Management Reserve
Remember that MR is developed by the contractor, after contract award, for risk and uncertainty within the contracted scope of work. Budget for contractor risks and uncertainties is part of (embedded within) the contractor’s bid price. A method for determining contractor MR is described below. DOE can follow this method when it develops the government estimate for the project, as a means to initially evaluate contractor proposals and later during project execution to assess the robustness of the contractor’s stated MR and management plan. Note that MR is an estimate of the potential amount of additional budget the contractor may need to execute the project scope, and is a combination of the costs derived from 1) risk events, and 2) cost estimating uncertainty. Steps 1-4 below may be used to derive the MR contribution from risk events. Step 5 may be used to derive the MR contribution from cost estimating uncertainty.
Final 4/12/10
20
1. Risk Identification.
• The contractor team identifies the bounding (enabling) assumptions for the project,
based on the contract scope of work.
Examples:
� Site utilities will be available in sufficient quantities.
� The construction site is free from any contamination that will require
remediation prior to construction.
• The contractor then identifies the risks (threats and opportunities) associated with its
contracted scope of work, and assigns a risk owner to each risk. The two risk lists
may resemble the following (only a few threats and opportunities are listed to
exemplify the process):
Threats (typical)
ID Threat Owner
T-001 Labor unavailability due to competing projects. John Smith-Constr. Mgr.
T-002 Construction subcontractor bids come in significantly higher than estimate.
Mary Jones – Contracts Mgr.
T-003 Material prices rise higher than budgeted. Joe Adams – Procurement Mgr.
T-004 Stakeholder objections delay building permit. Ann Johnson – Project Mgr.
Opportunities (typical)
ID Opportunity Owner
O-001 Shorten the construction schedule by adding shifts. John Smith-Constr. Mgr.
O-002 Obtain material discounts using prompt payment provisions in procurement contracts.
Joe Adams – Procurement Mgr.
2. Risk Assessment – Qualitative Analysis
• Identify risk triggers and interdependencies.
• Assign probabilities and consequences to each threat and opportunity based on
threshold guideline tables developed by the contractor.
• Assign an overall risk rating to each threat and opportunity using a risk matrix based
on the probabilities and consequences.
Final 4/12/10
21
Threats
ID
Threat Trigger Event
Affected WBS
Elements
Probability Consequence Overall Risk
Rating T-001 Labor unavailability
due to competing projects.
? ? Low Significant Low
T-002 Construction subcontractor bids come in significantly higher than estimate.
? ? High Critical High
T-003 Material prices rise higher than budgeted.
? ? Moderate Significant Moderate
T-004 Stakeholder objections delay building permit.
? ? Very Low Marginal Low
? = additional information to be filled in by contractor
Opportunities
ID Opportunity Trigger Event
Affected WBS
Elements
Probability Consequence Overall Risk
Rating O-001 Shorten the
construction schedule by adding shifts.
? ? High Significant Moderate
O-002 Obtain material discounts using prompt payment provisions in procurement contracts.
? ? Moderate Significant Moderate
? = additional information to be filled in by contractor
3. Risk Handling
Decide on a risk handling strategy for each threat and opportunity, based on the overall
risk rating and professional judgment. Appropriate strategies for threats are Accept,
Avoid, Transfer, or Mitigate. Appropriate strategies for opportunities are Accept, Exploit,
Share, and Enhance. The process includes the following steps:
• Identify a handling strategy for each risk
• Develop an implementation (mitigation) plan for the strategy, as appropriate
• Plan the implementation activities into the baseline project scope
• Develop cost and schedule estimates for the planned activities and include in project baseline
Final 4/12/10
22
• Document probability of mitigation success
• Identify residual risks and secondary risks, if applicable
• Document strategy and handling plan (briefly) on Risk Assessment Form
Threats
ID
Threat Handling Strategy
Mitigation Strategy
Probability of Mitigation Success
Residual or Secondary Risk
T-001 Labor unavailability due to competing projects.
Accept None - Same as primary
T-002 Construction subcontractor bids come in significantly higher than estimate.
Mitigate Advertise nationwide. Have pre-bid meeting with bidders.
50% Construction contractor bids come in slightly higher than estimate.
T-003 Material prices rise higher than budgeted.
Transfer DOE accepts material price escalation over 10% above contractor budget.
50% Material prices rise up to 10% higher than original budget.
T-004 Stakeholder objections delay building permit.
Accept None - Same as primary
Opportunities
ID Opportunity Handling Strategy
Enhancement Strategy Probability of Enhancement Success
O-001 Shorten the construction schedule by adding shifts.
Enhance Re-plan the project to use multiple shifts for work on or near the critical path.
75%
O-002 Obtain material discounts using prompt payment provisions in procurement contracts.
Enhance Contact suppliers and fabricators early in project to ensure discounts are made available and included in procurement contracts.
50%
4. Risk Assessment – Quantitative Analysis
• Estimate the cost and schedule impacts for each primary or residual risk, reported as
best case, most likely, and worst case.
Final 4/12/10
23
Threats
ID Threat Cost Impacts, $000s Schedule Impacts, weeks Probability
Best Case
Most Likely
Worst Case
Best Case
Most Likely
Worst Case
T-001 Labor unavailability due to competing projects.
1,000 2,000 4,000 4 8 16 10-25%
T-002 Construction subcontractor bids come in slightly higher than estimate.
0 5,000 20,000 0 0 0 25-75%
T-003 Material prices rise higher than budgeted.
500 1,500 3,000 0 0 0 25-75%
T-004 Stakeholder objections delay building permit.
1,000 2,500 4,000 4 10 16 0-10%
Opportunities
ID Opportunity Cost Impacts, $000s Schedule Impacts, weeks Probability
Best Case
Most Likely
Worst Case
Best Case
Most Likely
Worst Case
O-001 Shorten the construction schedule by adding shifts.
3,500* 2,000* 750* 16 10 4 75-90%
O-002 Obtain material discounts using prompt payment provisions in procurement contracts.
3,000 1,500 0 0 0 0 25-75%
*These cost impacts represent the net savings of a shorter schedule (with lower hotel loads, etc.) offset by higher costs resulting from added labor costs (shift differential) and craft productivity impacts.
• Input the cost impact ranges for both threats and opportunities into the Monte Carlo
analysis tool, along with the probability of occurrence, to estimate the cost
contingency associated with contractor risks.
• Analyze the results from the Monte Carlo (distribution curves) to determine the cost
contingency at the desired confidence level. For example, assume the results for all
risks and opportunities (not just the ones shown above) show the following:
o Contribution to MR for Cost Risks - $23.75 million at 80% confidence level
Final 4/12/10
24
Example Output of Monte Carlo Analysis of Cost Risk Impacts
Percentiles
Risk Cost Impact
0% 6.11
10% 12.84
20% 14.79
30% 16.23
40% 17.65
50% 19.05
60% 20.50
70% 22.32
80% 23.77
90% 26.08
100% 35.35
Final 4/12/10
25
• Input the schedule impact ranges for both threats and opportunities into the Monte
Carlo analysis tool, along with the probability of occurrence, to estimate the schedule
contingency associated with contractor risks that affect the Critical Path.
• Analyze the results from the Monte Carlo (distribution curves) to determine the
schedule reserve at the desired confidence level. For this example, assume the results
for all risks and opportunities (not just the ones shown above) show the following:
o Schedule reserve – 5 months at 80% confidence level
• Calculate the cost impact due to schedule contingency using the hotel load. For this
example, assume hotel load is $250,000 per month.
o Contribution to MR from schedule risks – 5 months x $250,000/month =
$1.25 million.
5. Cost Estimating Uncertainty
• Using the project cost estimate, define the range of cost estimating uncertainty. This
is usually done at a summary level and may appear similar to the following:
Cost Estimate Uncertainty
WBS Description Cost Range, $ million
Best Case Most Likely (Baseline Cost)
Worst Case
2.1 Preliminary Design
1 15 15 15
2.2 Final Design 9 10 12
3.0 Construction 85 92.5 115
4.0 Project Management
9.5 10 11
5.0 Construction Management
2 7.4
8% of Construction
8% of Construction
10% of Construction
6.0 Title III Design2
6.5
7% of Construction
7% of Construction
9% of Construction
7.0 OPCs 6 8.6 11
Total 150
Note: In actual practice, Cost Estimate Uncertainty can be modeled in a variety of ways. This may be done using a lower level of the WBS or by breaking the project down into key cost drivers (e.g., bulk commodities – quantities and pricing; labor – productivity and rates; equipment pricing; engineering – hours and rates; etc.). 1 – Since Preliminary Design is assumed complete, this cost is frozen for purposes of this example. 2 – In an actual model, it may be better to use percentages of construction cost to model these uncertainties in order to recognize the close correlation that exists.
Final 4/12/10
26
• Input the cost estimate ranges into the Monte Carlo analysis tool to estimate the cost
estimate uncertainty for the contractor.
• Analyze the results from the Monte Carlo to determine the cost estimate uncertainty
at the desired confidence level. For this example, assume the results show a cost
estimate uncertainty of $5 million at the 80% confidence level.
Contractor Management Reserve
• Add the cost contingency (derived from the risk analysis) to the cost estimate
uncertainty contingency, at the same confidence levels, to derive the total MR for the
contractor. For example:
Contributions to MR from cost risks $23.75 million
Contributions to MR from schedule risks 1.25 million
Contributions to MR from Cost estimating uncertainty 5.0 million
Total MR $30.0 million
5.2 DOE Contingency
The DOE Contingency discussed here is the contingency needed to mitigate project risks that are
within the project baseline but are generally beyond the contractor’s control. It is additive to the
MR portion determined in Step A. The steps to follow for DOE Contingency are similar as for
MR.
1. Risk Identification.
• The IPT defines the bounding (enabling) assumptions for the project.
Examples:
� Funding will be available according to the funding profile.
� There will be no extraordinary ES&H incident or other event that
causes an extended shutdown.
• The IPT then identifies the risks (threats and opportunities) associated with the
project, and assigns a risk owner to each risk. The two risk lists may resemble the
following (only a few threats and opportunities are listed to exemplify the process):
Final 4/12/10
27
Threats (typical)
ID Threat Owner DOE-T-001 Adequate power is not available to the contractor. FPD
DOE-T-002 The site requires some groundwater cleanup prior to construction.
ES&H Manager
DOE-T-003 GFS/I are delayed. Contracting Officer
DOE-T-004 Construction contractor fails to meet performance expectations.
FPD
Opportunities (typical)
ID Opportunity Owner
DOE-O-001 General contractors will consider fixed price, incentivized contract.
Contracting Officer
DOE-O-002 Government provided equipment is available for sharing with another project in the area.
Contracting Officer
Follow Steps 2 and 3 above for MR.
4. Risk Assessment – Quantitative Analysis
• Estimate cost and schedule impacts for each primary or residual risk, reported as best
case, most likely, and worst case.
• Input the cost impact ranges into the Monte Carlo analysis tool, along with the
probability of occurrence, to estimate the cost contingency associated with DOE
risks.
• Input the schedule impact ranges into the Monte Carlo analysis tool, along with the
probability of occurrence, to estimate the schedule contingency associated with DOE
risks that affect the Critical Path.
• Analyze the results from the Monte Carlo to determine the cost and schedule
contingency at the desired confidence level. Calculate the cost impact due to schedule
contingency using the hotel load. For this example, assume the results show the
following:
o Cost contingency due to cost risks - $15.5 million at 80% confidence level
o Cost contingency due to schedule risks - $1.5 million
o Schedule contingency – 6 months at 80% confidence level.
Final 4/12/10
28
o
5. Cost Estimating Uncertainty
• Determine cost estimating uncertainty for DOE costs that are outside of the contractor
scope, if applicable (e.g. other direct costs or services).
• Using the cost estimate for DOE costs, define the range of cost estimating
uncertainty.
• Input the cost estimate ranges into the Monte Carlo analysis tool to estimate the cost
estimate uncertainty for DOE costs.
• Analyze the results from the Monte Carlo to determine the cost estimate uncertainty
at the desired confidence level. For this example, assume the results show a cost
estimate uncertainty of $3 million at the 80% confidence level.
6. DOE Contingency
Add the cost contingency (derived from the risk analysis) to the cost estimate uncertainty contingency, at the same confidence levels, to derive the total MR for the contractor. For example:
Cost contingency due to cost risks $15.5 million Cost contingency due to schedule risks 1.5 million Cost estimating uncertainty 3.0 million Total DOE Contingency $20.0 million
Note: The preceding example represents a simplistic approach towards MR and DOE contingency derivation. Good risk management practice dictates that further sensitivity analyses should be employed in order to determine the MR and DOE contingency contributions from individual cost risks, schedule risks, and estimating uncertainty. This enables the IPT to assess and monitor where the greatest potential impact to project performance baseline might originate.
7. Total MR and Contingency
Based on the assessment of all project risks and cost estimating uncertainty, the total project
contingency is as follows:
Management Reserve $30 million
DOE Contingency 20 million
Total MR and Contingency $50 million
This is added to the base costs of $150 million, which results in a Total Project Cost of $200
million.
Final 4/12/10
29
Terms and Definitions
This glossary of terms is derived within the context of how terms are used in this MR and Contingency Implementation Guideline.
Activity: An element of work performed during the course of a project. An activity normally has an expected duration, an expected cost, and expected resource requirements.
Actual Cost: The costs actually incurred and recorded in accomplishing work performed.
Baseline: A quantitative definition of cost, schedule, and technical performance that serves as a base or standard for measurement and control during the performance of an effort; the established plan against which the status of resources and the effort of the overall program, field program(s), project(s), task(s), or subtask(s) are measured, assessed, and controlled.
Capital Asset Projects: A unique effort to acquired or perform additions, improvements, modifications, replacements, restorations, rearrangements and reinstallations, and major repairs but not ordinary repairs and maintenance. The project acquisition cost of a capital asset includes both its purchase price and all other costs incurred to bring it to a form and location suitable for its intended use. Capital assets include the environmental remediation of land to make it useful, leasehold improvements and land rights
Change Control: A process that ensures changes to the approved baseline are properly identified, reviewed, approved, implemented, tested and documented.
Co-dependent Risk: Co-dependent project risks are generated when intermediate deliverables or outcomes (two or more projects or sub-projects at the same site) interlock in such a way that if both projects are not successfully completed, neither can be successfully completed.
Cost Estimate: A documented statement of costs estimated to be incurred to complete the project or a defined portion of a project.
Critical Path: A logically related sequence of activities in a critical path schedule having the longest duration. The total float is zero. A delay in any activity will have a corresponding impact on the completion date of the project.
Cumulative Distribution Function: A statistical function based on the accumulation of the probabilistic likelihood of occurrences. In the case of the DOE risk analysis, it represents the likelihood that at a given percentage the project cost or duration will be at or below a given value. As an example, the x-axis might represent the range of potential project cost values evaluated by the Monte Carlo simulation and the y-axis represents the project’s probability of completion (see Figure 2.2).
Delphi Methods/Techniques: The Delphi method is a systematic interactive method based on the principle that forecasts from a structured group of experts are more accurate than those from unstructured groups or individuals. The carefully selected experts answer questionnaires in two or more rounds. After each round, a facilitator provides an anonymous summary of the experts’ forecasts from the previous round as well as the reasons they provided for their judgments. Thus, participants are encouraged to revise their earlier answers in light of the replies of other members
Final 4/12/10
30
of the group. It is believed that during this process the range of the answers will decrease and the group will converge towards the "correct" answer. Finally, the process is stopped after a pre-defined stop criterion (e.g. number of rounds, achievement of consensus, and stability of results) and the mean or median scores of the final rounds determine the results.
Estimate-at-Completion: The current estimated total cost for program authorized work. EAC equals the actual cost to a point in time plus the estimated costs to completion.
Estimate to Complete (ETC): The current estimated cost for remaining authorized work to complete the project.
DOE Contingency: Is the portion of the project budget that is available for risk uncertainty
within the project scope, but held outside the contract budget. Contingency is part of the Total
Project Cost and government’s baseline, but is not part of the contractor’s baseline. It is used to
manage both cost and schedule risk events resulting from, but not limited to, government actions,
changed requirements, program and project assumptions, delays in government-furnished
services, equipment, and items, and other influences outside the contractor’s control.
Contingency is held by DOE for project risks that are owned by DOE and whose obligation onto
the contract vehicle typically should not occur without determining the impact on the contract
and project.
Earned Value Measurement System (EVMS): Is the integrated set of processes used to implement the standard and its criteria. In its simplest form, EVMS can be implemented without any software. Software simply enhances productivity, allows the implementation of EVMS more economically and facilitates managing complex projects. EVMS is not software.
Hotel Loads: A term used to identify the cost associated with level of effort activities and fixed costs that will be incurred until a given piece of work is complete. These costs can include the costs for project management and administration and other direct costs associated with generic facilities, rentals, and other indirect costs that are not part of the direct production activities.
Level-of-Effort: Baseline scope of a general or supportive nature for which performance cannot be measured or is impracticable to measure using activity-based methods. Resource requirements are represented by a time-phased budget scheduled in accordance with the time the support will likely be needed. The value is earned by the passage of time and is equal to the budget scheduled in each time period.
Management Reserve (MR): Determined by the contractor and is the amount of the total contract budget withheld for management control by the contractor for risk uncertainty within the project scope that is within the scope of the contract. Management reserve should be risk-based.
Milestone: A schedule event marking the due date for accomplishment of a specified effort (baseline activity) or objective. A milestone may mark the start, an interim step, or the completion of one or more activities.
Final 4/12/10
31
Mitigation Strategy: The risk handling strategy used to eliminate or lessen the likelihood and/or consequence of a risk.
Monte Carlo Analysis: A method of calculation that approximates solutions to a variety of mathematical problems by performing statistical sampling experiments on a computer; applies to problems with no probabilistic content as well as to those with inherent probabilistic structure.
Opportunity: A risk with a positive consequence or benefit.
Probability: Likelihood of an event occurring, expressed as a qualitative and/or quantitative metric.
Probability Distribution Function (PDF): A probability distribution, also described as a probability density function, represents the distribution of the probability of an outcome. As an example, the Monte Carlo analysis may be designed to estimate the cost or duration of a project. The PDF represents the number of times a certain cost or duration is achieved (see Figure 2.2).
Project Risk: Events identified as potential threats or opportunities that are within the project baseline cost or schedule.
Qualitative Risk Analysis: Assessment of the probability and impact of project risks using a variety of subjective techniques to rank or establish priorities for the risks.
Quantitative Risk Analysis: Assessment of the cumulative probability and impact of project risks using statistical based techniques, such as simulation and decision tree analysis, for determining risk implications.
Residual Risk: The risk that remains after the risk mitigation strategy has been implemented.
Risk: Factors, elements, constraints, events, or courses of action that introduce an uncertainty of outcome, either positively or negatively, that could impact project objectives.
Risk Assessment: Identification and analyses used to understand the potential cause and impact of each risk in terms of likelihood and consequences.
Risk Event: A potential (identified or unidentified) condition (threat or opportunity) that may or may not occur during the execution of a project.
Risk Handling: Strategies developed with the purpose of eliminating, or at least reducing, the higher risk levels identified during the risk analysis. The strategies may include risk reduction or mitigation, risk transfer/share, risk avoidance, and risk acceptance.
Risk Identification: The process to find, list, and characterize elements of risk.
Risk Management: The process of planning, identifying, handling, monitoring, and reporting project risks through specific methods and techniques.
Risk Management Plan: Documents how the risk processes will be carried out during the project/program.
Final 4/12/10
32
Risk Modeling: Creation of a physical representation or mathematical description of an object, system or problem that reflects the functions or characteristics of the item involved. Model building may be viewed as both a science and an art. Cost estimate and critical path schedule development should be considered modeling practices and not exact representations of future costs, progress and outcomes.
Risk Analysis Method: The technique used to analyze the risks associated with a project or program. Specific categories of risk analysis methods are:
1. Qualitative - based on project characteristics and historical data (check lists, scenarios, etc.)
2. Risk models - combination of risks assigned to parts of the estimate or project to define the risk of the total project.
3. Probabilistic models - combining risks from various sources and events (e.g., Monte Carlo, Latin hypercube, decision tree, influence diagrams, etc.) (6/07)
Risk Monitoring and Tracking: Process of systematically watching the evolution of the project risks, taking appropriate action, and evaluating the effectiveness of risk strategies against established metrics over the project duration.
Risk Register: Database for risks associated with the project; also known as risk database or risk log.
Schedule Baseline: Time phased project activity durations and milestone commitment dates by which projects are accomplished. The approved project schedule is a component of the overall project plan. The schedule baseline provides the basis for measuring and reporting schedule performance.
Schedule Contingency: Time allowance used to adjust schedule for realized DOE risks; based on the schedule risk analysis.
Schedule Reserve: Time allowance used to adjust schedule for realized risks within the contractor’s baseline.
Simulation (Monte Carlo): Process for modeling the behavior of a stochastic or probabilistic system. A sampling technique is used to obtain trial values for uncertain model input variables. By repeating the process for many trials, a frequency distribution is built up, which approximates the true probability distribution for the system’s output. This random sampling process, averaged over many trials, is effectively the same as integrating what is usually a very difficult or impossible equation.
Threat: A risk with negative consequences.
Unidentified Risks: Risks that were not anticipated or foreseen by the IPT or by DOE-HQ staff members. Unidentified risks might originally be unanticipated because the probability of the event is so small that its occurrence is virtually unimaginable. Alternatively, an unidentified risk might be one that falls into an unanticipated or uncontrolled risk event category.
Final 4/12/10
33
Abbreviations and Acronyms
AACEI Association for the Advancement of Cost Engineering International
CBB Contract Budget Base
CD Critical Decision
CDF Cumulative Distribution Function
CL Confidence Level
CO Contracting Officer
DOE U.S. Department of Energy
DOE-HQ U.S. Department of Energy, Headquarters
EAC Estimate-at-Completion
EVMS Earned Value Management System
FAR Federal Acquisition Regulation
FPD Federal Project Director
FRMP Federal Risk Management Plan
GFS/I Government Furnished Services and Items
IPT Integrated Project Team
LOE Level of Effort
MR Management Reserve
PBS Program Baseline Summary
PDF Probability Distribution Function
PEP Project Execution Plan
PMB Performance Measurement Baseline
PMP Project Management Plan
TPC Total Project Cost
WBS Work Breakdown Structure
Final 4/12/10
34
References
1. Association for the Advancement of Cost Engineering International Recommended Practice No. 18R-97, Cost Estimate Classification System – As Applied in Engineering, Procurement and Construction for the Process Industries.
2. DOE G 413.3-10, Earned Value Management System.
3. DOE G 413.3-7, Risk Management Guide.
4. DOE Order 413.3A, Program and Project Management for the Acquisition of Capital Assets, July 28, 2006.
5. U.S. Department of Energy, Office of Procurement and Assistance Policy, Office of Procurement and Assistance Management to Procurement Directors, Acquisition Letter 2009-01, “Management Reserve and Contingency,” October 6, 2008.
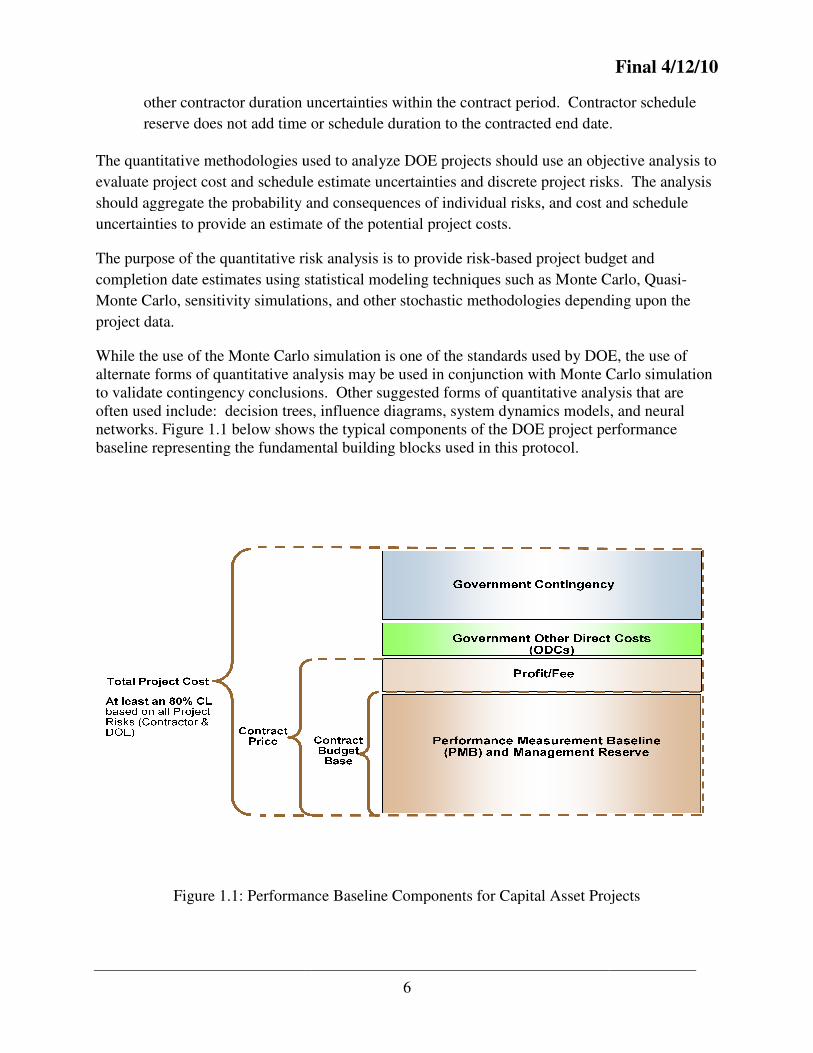
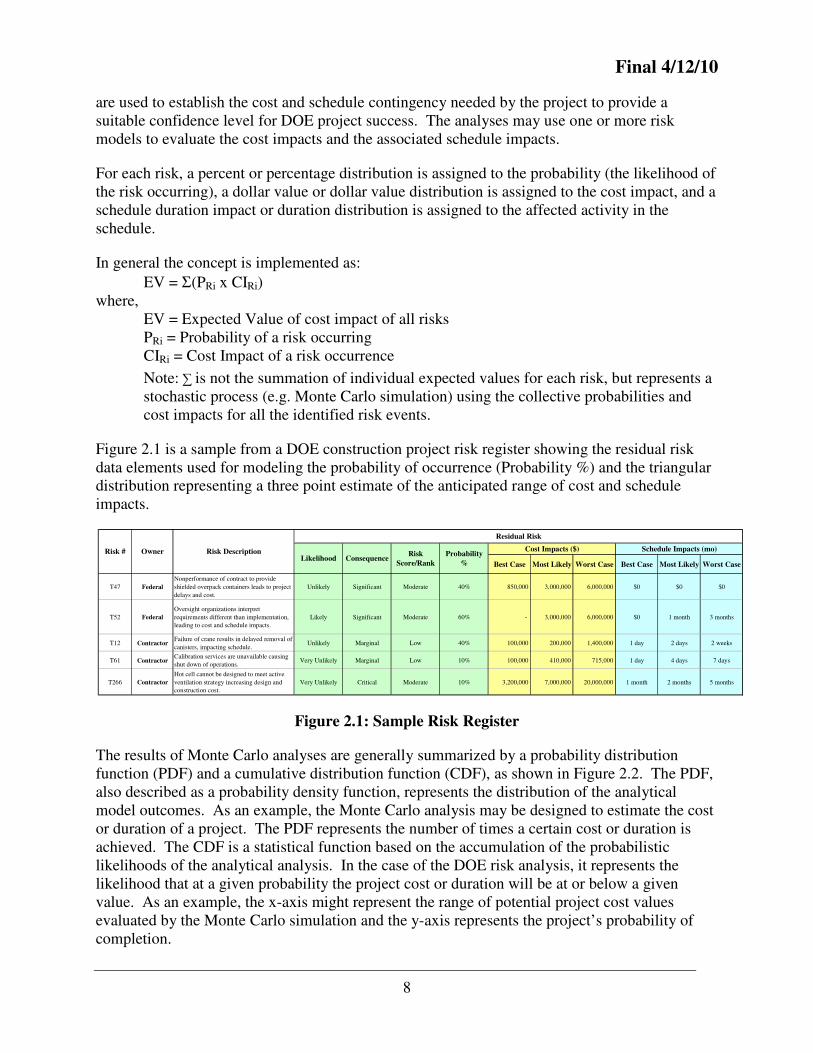
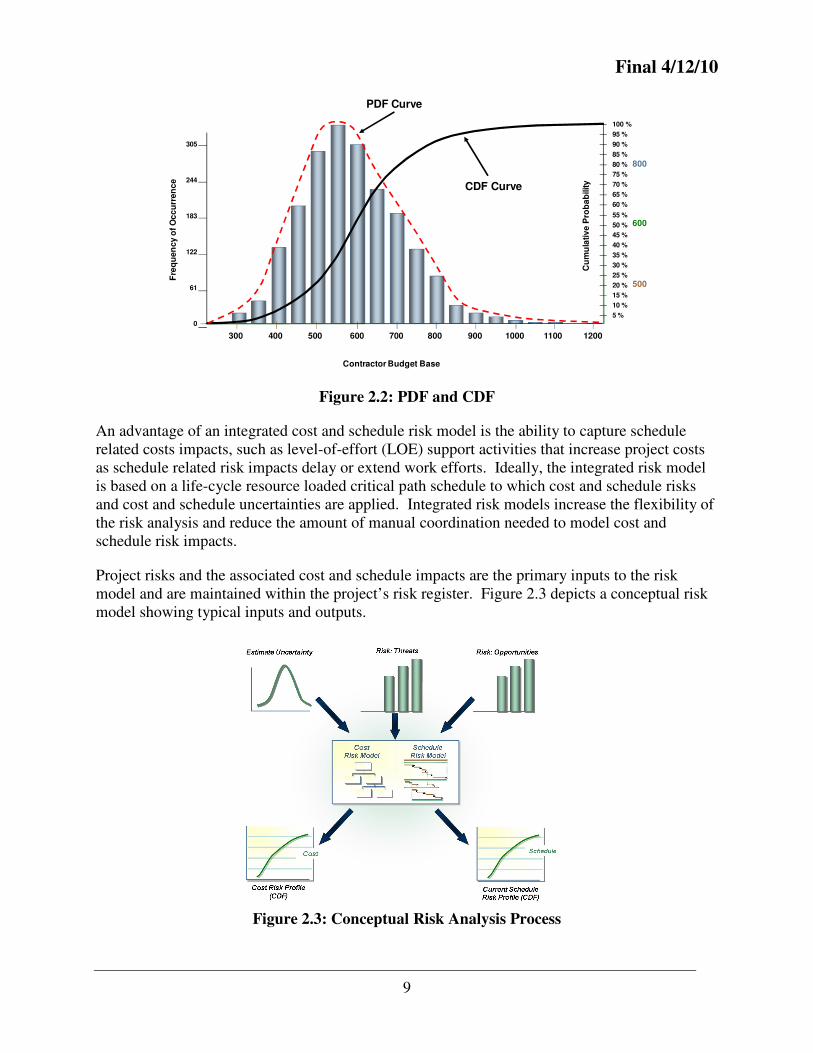
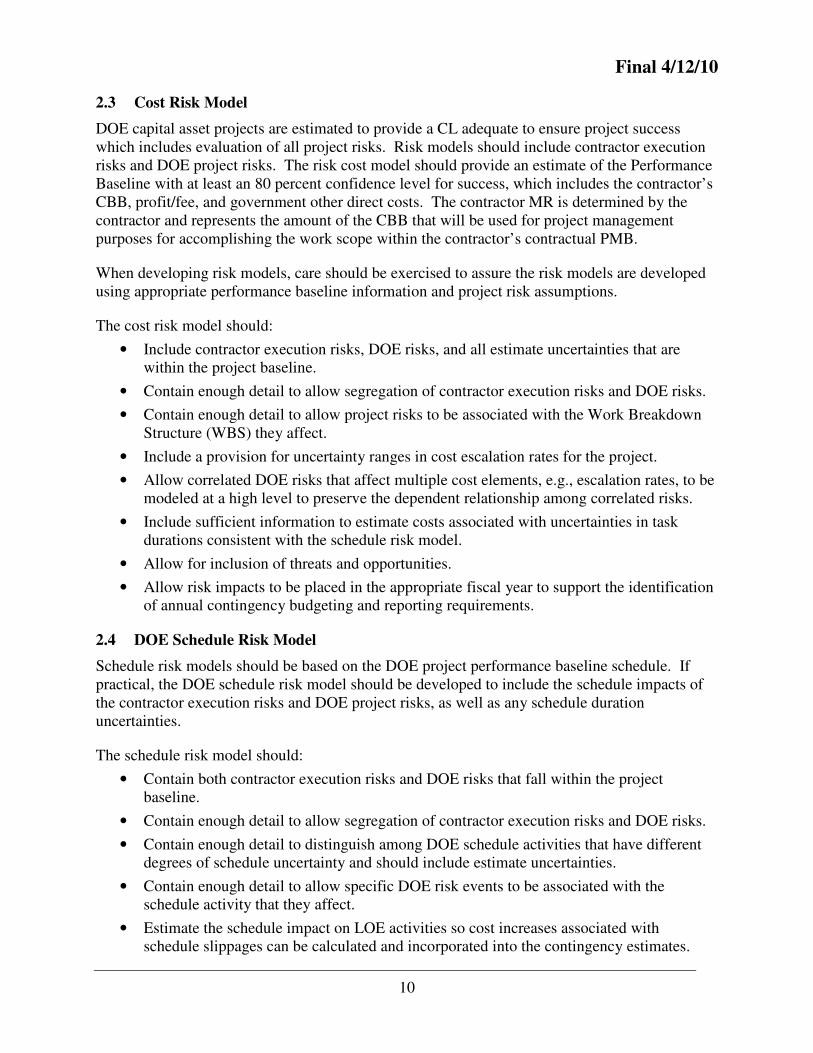
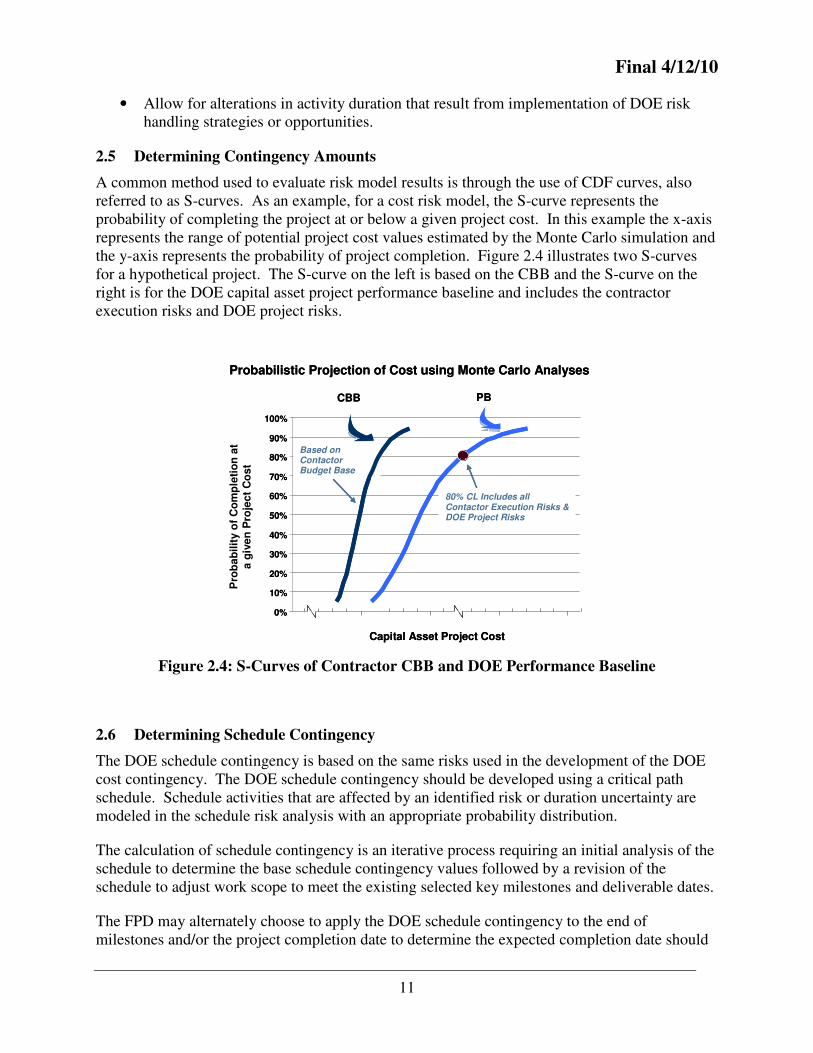
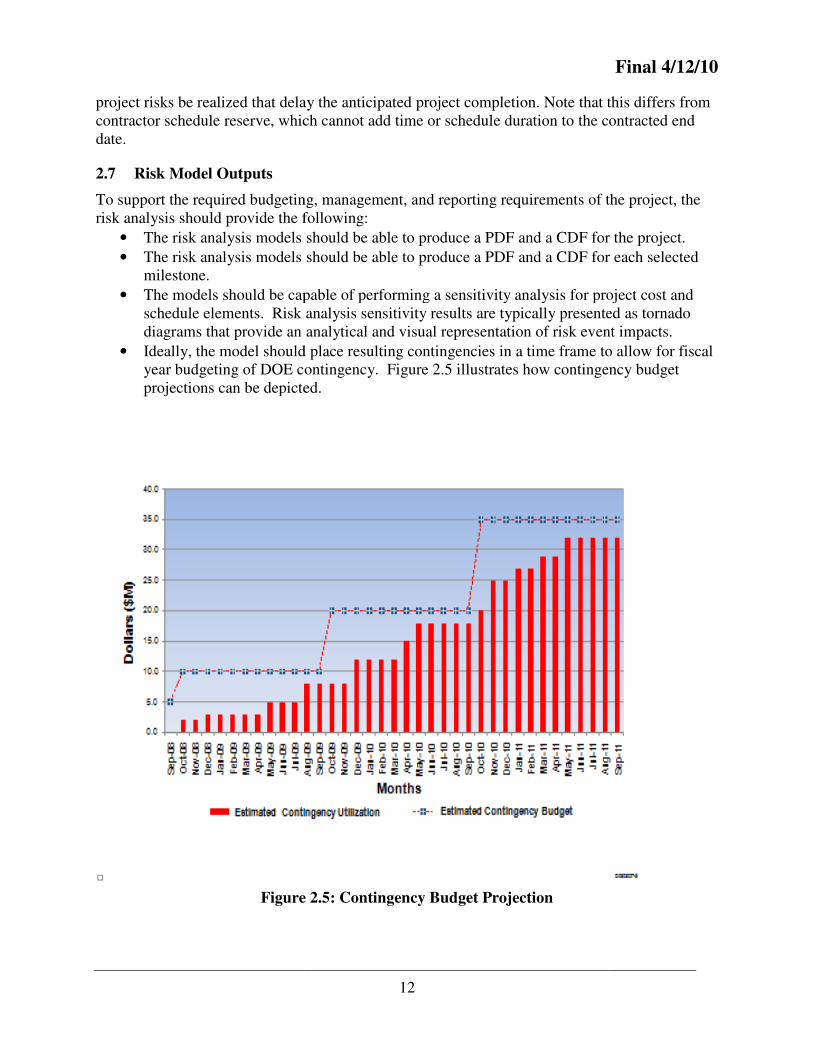
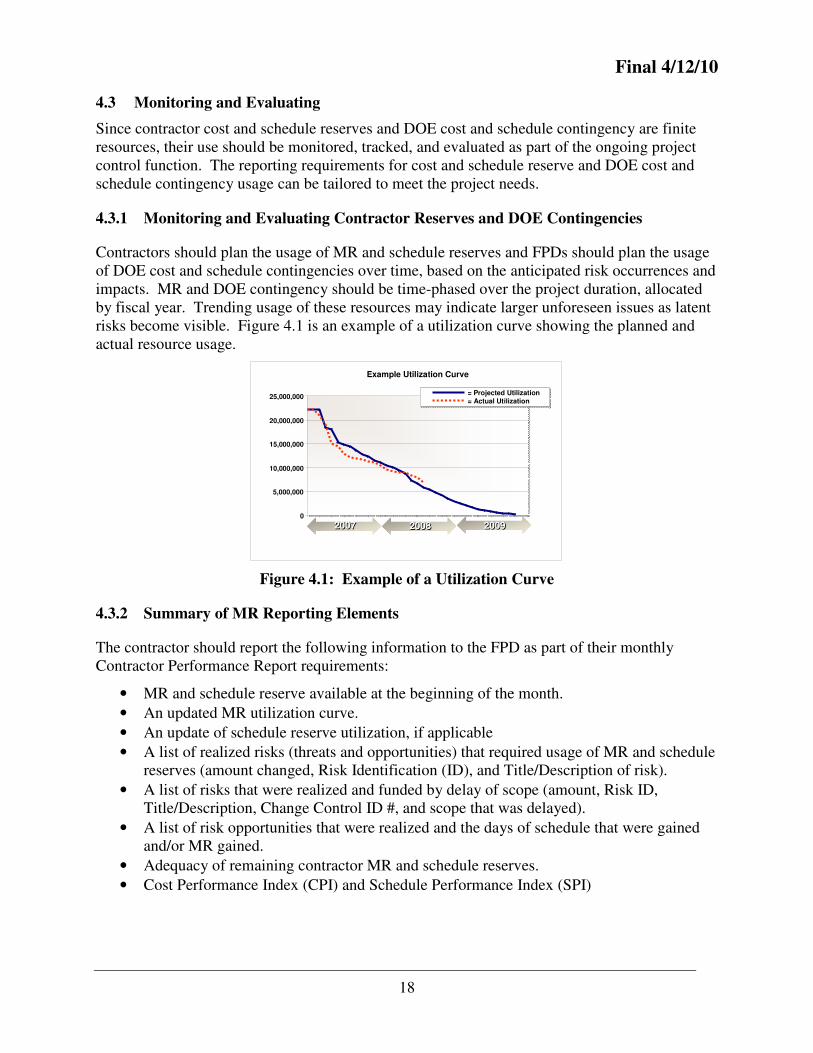
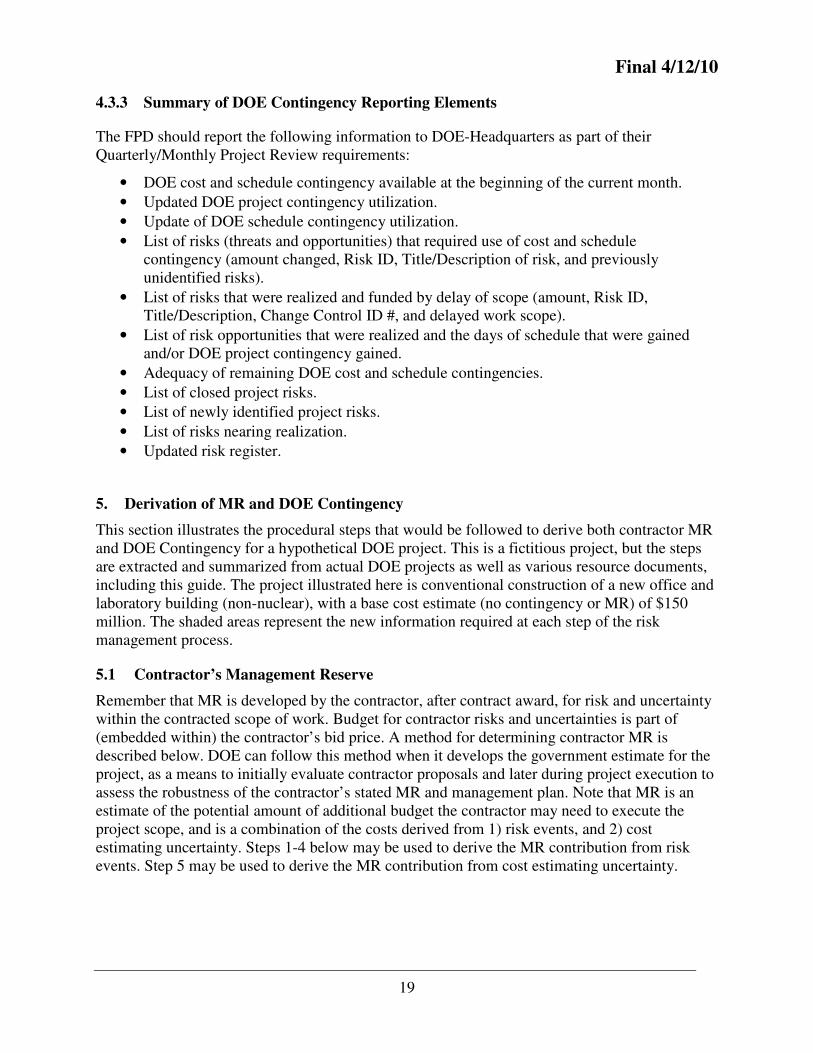
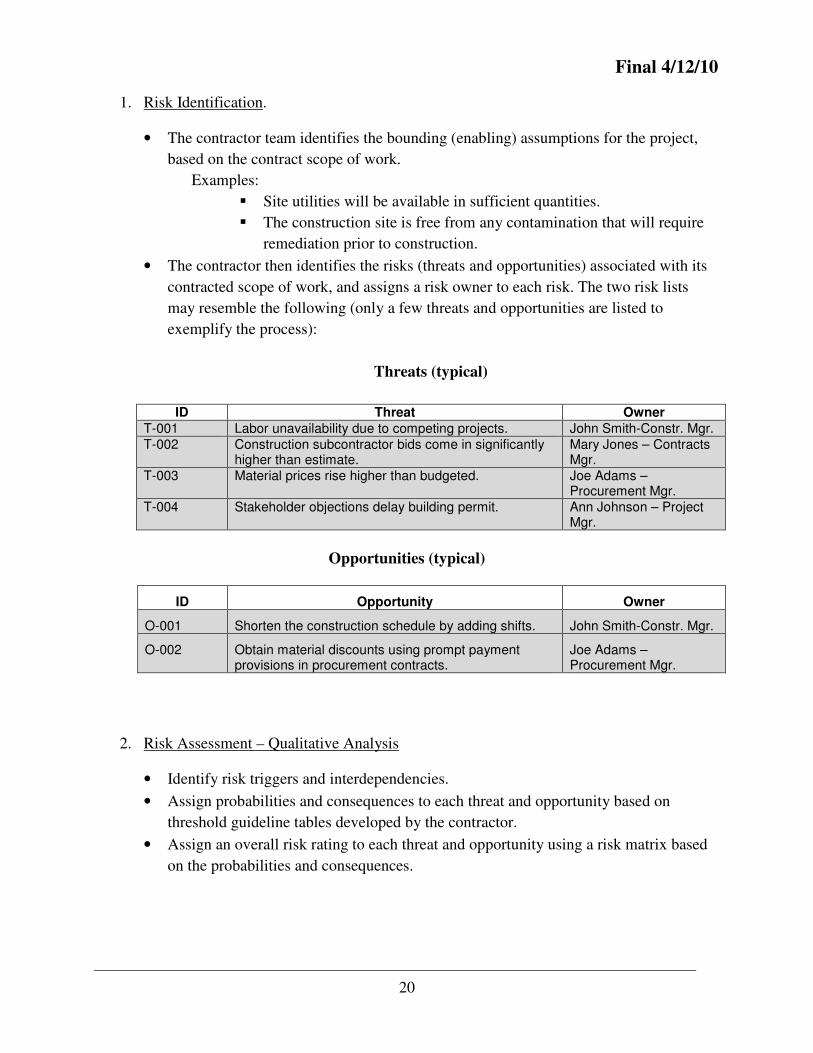
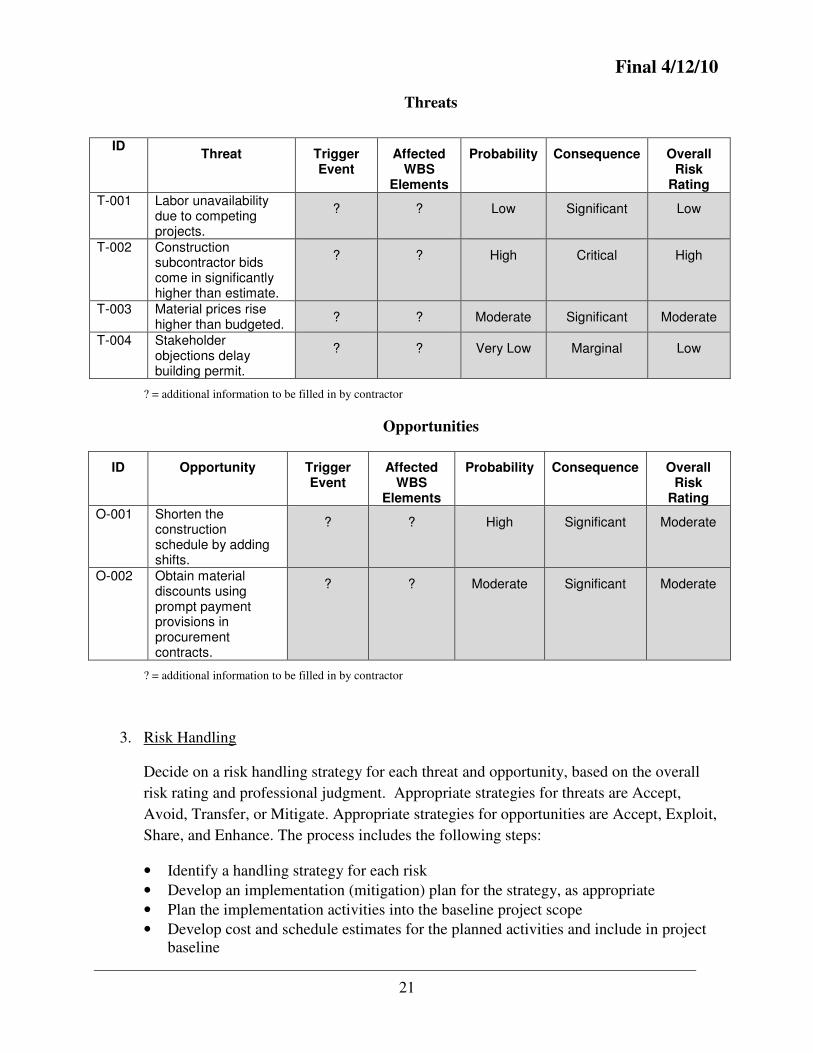

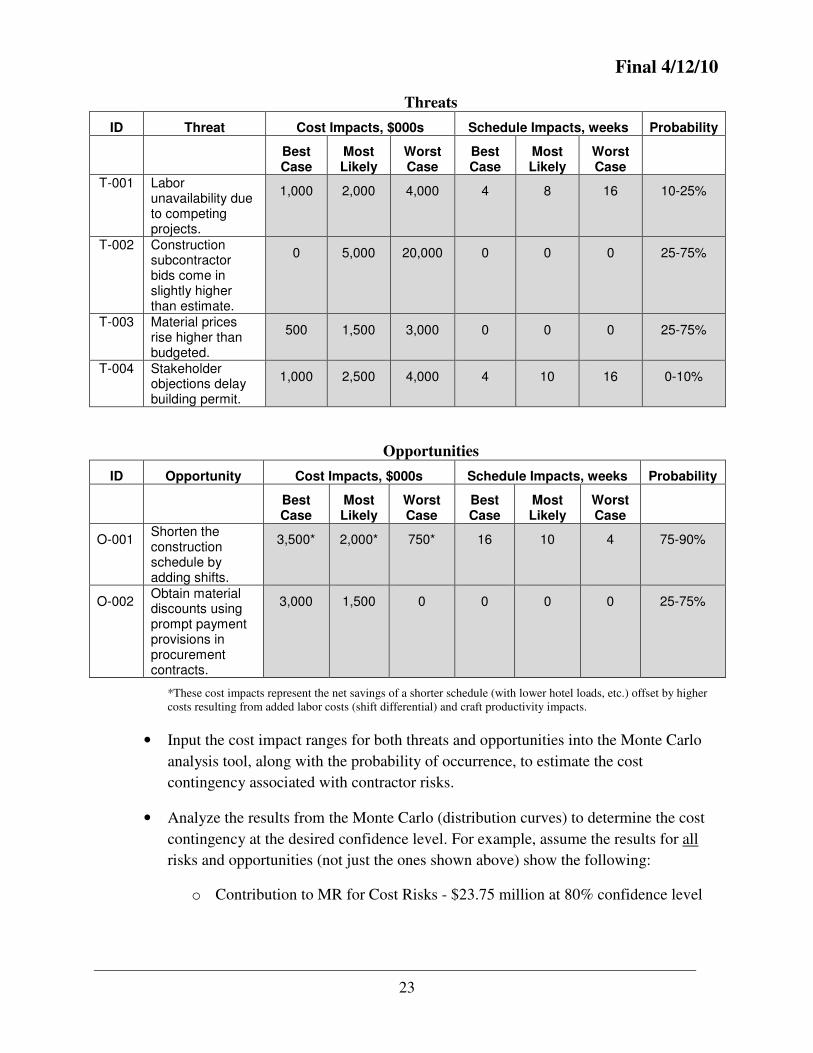
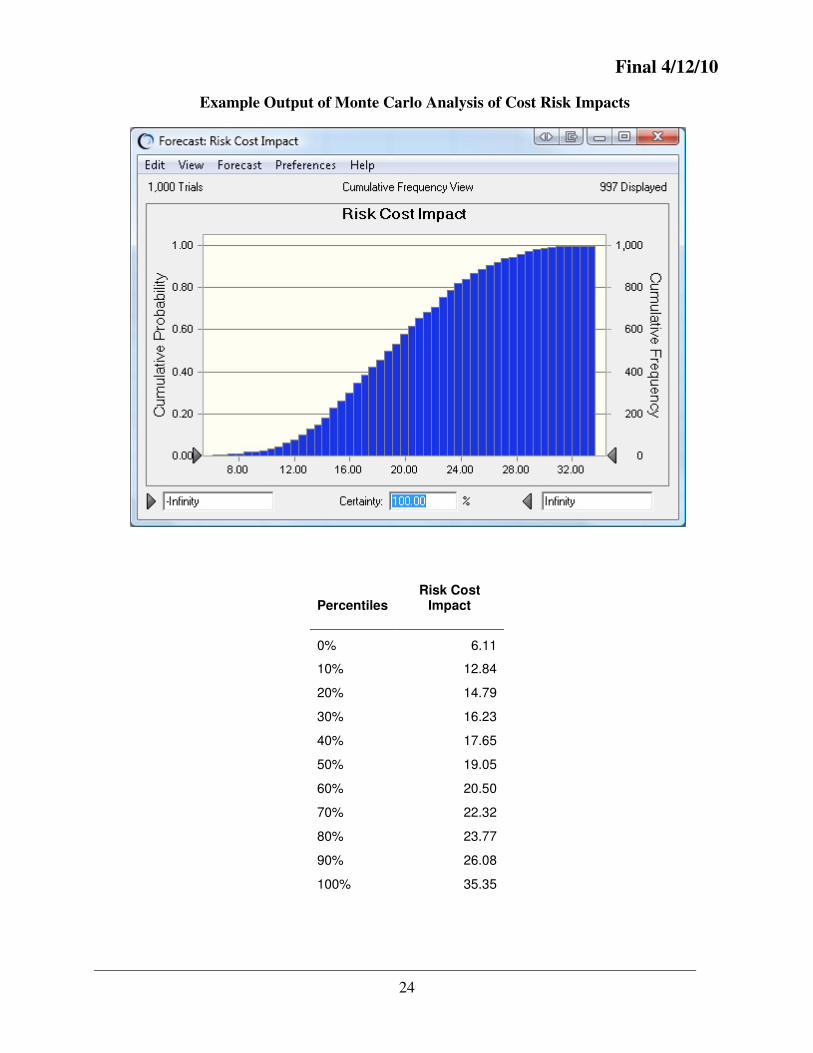
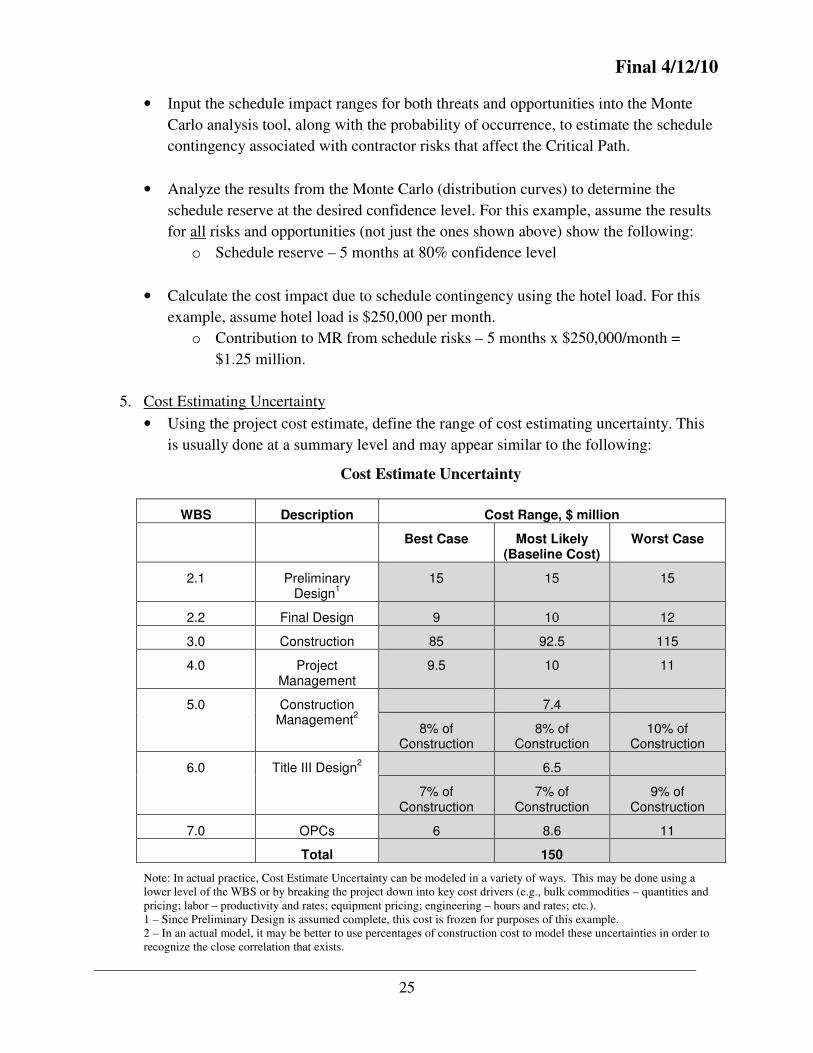
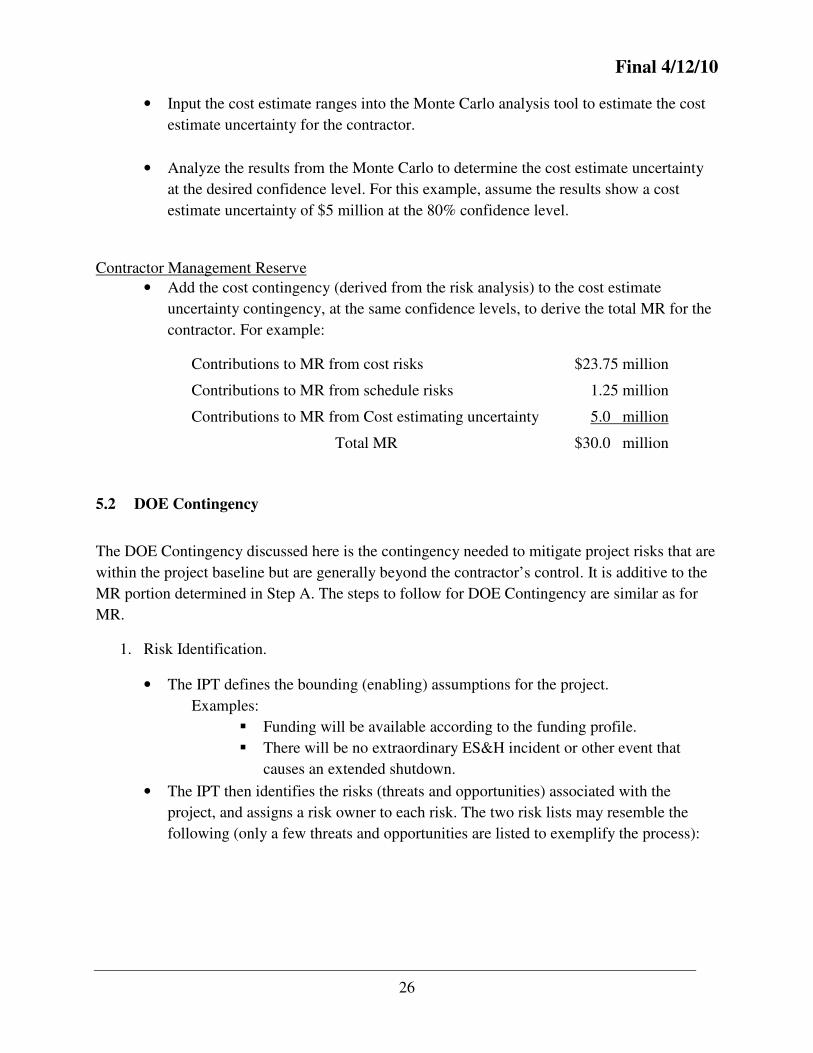


![Contingencies and provisioning[1]](https://static.documents.pub/doc/80x56/5457ed9faf795963388b5b66/contingencies-and-provisioning1.jpg)


