This article appears in the July/August 1988 issue of AJNR and the October 1988 issue of AJR.
Received December 12, 1986; accepted after revision November 27,1987.
Presented at the annual meeting of the American Society of Neuroradiology, San Diego, January 1986.
, Department of Radiology, University of Iowa Hospitals and Clinics, Iowa City, IA 52242.
2 Present address: Greenville Radiology, P.A., 1210 W. Faris Rd ., Greenville, SC 29605.
3 Present address: Department of Radiology, Neuroradiology Section, University of Utah School of Medicine, 50 N. Medical Dr. , Salt Lake City, UT 84132. Address reprint requests to W. R. K. Smoker.
4 Department of Neurosurgery, University of Iowa Hospitals and Clinics, Iowa City, IA 52242.
MR Imaging of the Corpus Callosum: Normal and Pathologic Findings and Correlation with CT
649
The MR appearance of the corpus callosum was investigated in 80 normal volunteers. Normal variations in appearance were recorded with regard to age, gender, and handedness. The MR studies of 47 patients with a wide spectrum of callosal disease were also reviewed. Abnormalities included trauma, neoplasia, congenital abnormalities, vascular lesions, and demyelinating and inflammatory conditions. The information provided by MR was compared with that obtained from other radiographic examinations, particularly CT and angiography. In all cases MR provided as much, and frequently more, information than was obtained by other imaging techniques.
We believe that MR should be the primary imaging technique for the evaluation of corpus callosal disease.
Numerous imaging techniques have been used in the evaluation of the corpus callosum (CC). Although CT has been the technique used most widely, it does not portray optimally the three-dimensional anatomic relationships of the CC on routine axial images. High-quality reformatted images require thin, contiguous or overlapping sections, which increase both radiation exposure and scanning time.
MR has proved valuable for evaluating the CNS. The sensitivity of MR permits recognition of disease processes not seen with other imaging methods. Its multiplanar capabilities permit direct imaging of structures in lieu of reformatted images. To assess the normal appearance of the CC on MR and the value of MR in the evaluation of callosal disease, we prospectively imaged 80 normal volunteers and retrospectively reviewed the MR studies of 50 patients with CNS disease involving the corpus callosum.
Subjects and Methods
MR studies were performed on Picker 0.5-T and General Electric 1.5-T superconducting magnets. Eighty healthy volunteers 19-40 years old (20 male and 20 female righthanders and 20 male and 20 female lefthanders) underwent midsagittal MR scanning with an inversionrecovery (IR) pulse sequence, 1600/600/40 (TRfTlfTE). Handedness was studied in each individual with the Oldfield Questionnaire, a standardized and validated instrument for the study of handedness (adapted from [1 J). The outlines of the cerebral hemisphere and CC were traced directly from scans. The maximal anteroposterior length of the CC was measured and divided into quartiles (Fig . 1). The anterior quartile corresponded to the head and genu, the second and third quartiles to the body, and the posterior quartile to the splenium. Area measurements were made with a digitizer pad and computer. All measurements were made without knowledge of gender or handedness. All measurements were performed three times and a mean was calculated for use in analysis. Data were analyzed by a standard computer statistical program: The following area ratios were calculated and analyzed: CC/brain , splenium/brain , first quartile/CC, body/CC, and splenium/CC.
The MR scans of 47 patients with various CC abnormalities were reviewed retrospectively. A variety of pulse sequences and imaging planes were used. T1-weighted sagittal images were frequently available as IR , 1600/600/40, or short spin-echo (SE) , 400/40 (TRfTE), pilot sequences. Transverse and coronal images of varying sequences were also obtained .
• ANOVA.
650 REINARZ ET AL. AJNR:9, JulylAugust 1988
2
Fig. 1.-Example of corpus callosal tracing. Quartile 1 = head and genu; quartiles 2 and 3 = body; quartile 4 = splenium. The ratios of the measurements were used to define the normal corpus callosum.
Results
Normal Anatomy
The ratios of CC/brain and splenium/brain revealed no significant differences among the four subgroups of normals in relation to gender and handedness. Significant differences were found in the ratios of callosal quartiles to the entire callosal area. The calculated means of the ratios used in analysis are presented in Table 1.
TABLE 1: Ratios Used to Assess the Normal Corpus Callosum (CC)
% Mean Ratios ± SEM Measurement: Gender
Righthanders Lefthanders
First quartile/CC: Male 35.07 ± 0.56 35.09 ± 0.72 Female 33.11 ± 0.59 33.54 ± 0.46
The data were analyzed by using a multivariate and univariate analysis of variance with one between-subject factor for gender and another for handedness. The only statistically significant effects were gender differences in percentage of first quartile area (F [1 ,76] = 8.77 , P = .0041) and in percentage of splenium area (F [1,76) = 5.94, P = .0171). Males had an average first quartile percentage area of 35.08, while females had an average first quartile percentage area of 33.33. Males had an average splenium percentage area of 33.34, while females had an average splenium percentage area of 34.82.
Examples of normal sagittal and coronary anatomy are presented in Figures 2 and 3, respectively.
Pathology
Trauma.-Injury to the CC was identified in 16 patients. In 14 patients, the involvement was nonhemorrhagic and presumably reflected diffuse axonal injury. Unenhanced CT scans were obtained in all patients on the day of admission. Abnormalities of the CC were not appreciated in any of these patients on the basis of the CT scan, but were clearly identified on MR performed within an average of 5 days of admission (range, 1-19 days) (Fig. 4). The remaining two trauma patients had hemorrhagic injury of the CC. CT scans were obtained in both. Although hemorrhage was identified on CT in both, MR delineated the CC involvement better than CT did (Fig. 5). The splenium was involved most often, followed by the body and genu. These patients are presented in more detail in a separate report.
Neoplasia.-The second largest category of disease was neoplastic involvement of the CC (Fig. 6). Thirteen cases were reviewed. CSF cytology identified a glioma in one patient; the other patients had biopsy-proved astrocytomas. MR routinely surpassed CT in the demonstration of neoplastic involvement of the CC. T2-weighted (long TR/long TE) SE pulse sequences were the most sensitive for detecting lesions. Differentiation of neoplasia from surrounding edema was difficult.
Congenital abnormalities .-Eleven congenital anomalies involving the CC were evaluated, including complete and partial
B Fig. 2.-Normal, 10-mm-thick sagittallR image, Fig. 3.-Normal appearance of genu (A) and splenium (8) of corpus callosum (arrows) on 10-
1600/600/40, of left-handed man. mm-thick coronallR images, 2100/600/40.
AJNR:9, July/August 1988
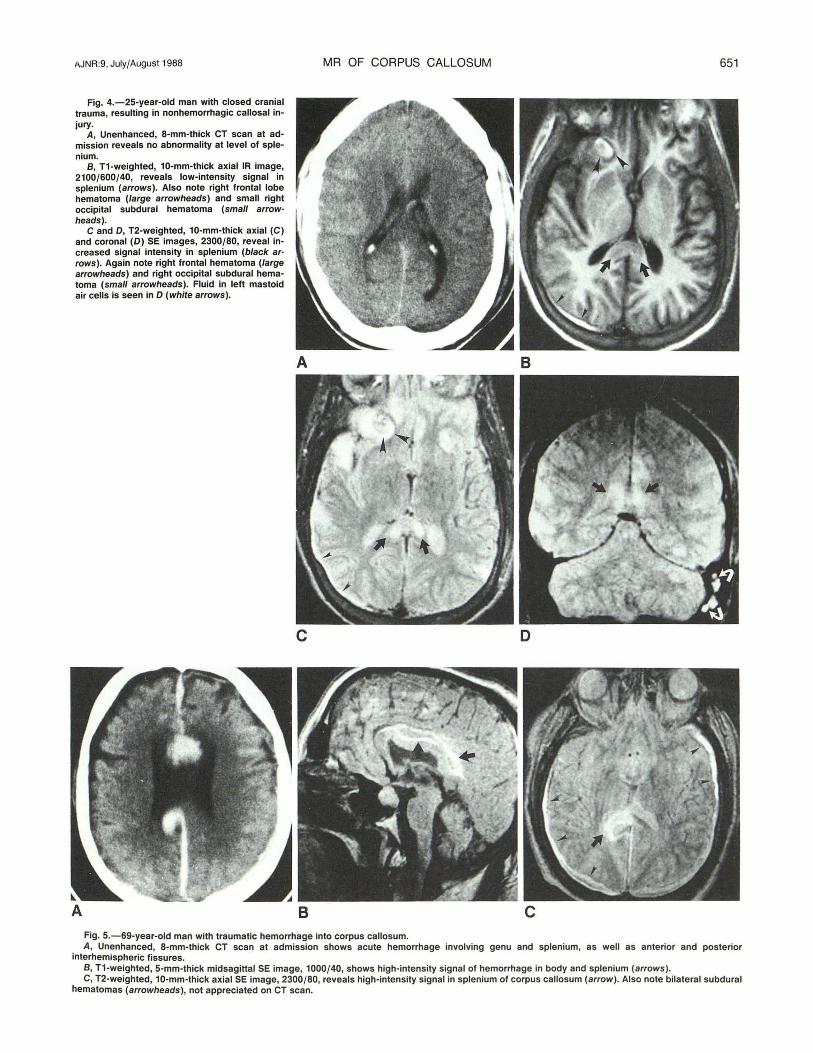
Fig. 4.-25-year-old man with closed cranial trauma, resulting in nonhemorrhagic callosal injury.
A, Unenhanced, 8-mm-thick CT scan at admission reveals no abnormality at level of splenium.
B, T1-weighted, 10-mm-thick axial IR image, 2100/600/40, reveals low-intensity signal in splenium (arrows). Also note right frontal lobe hematoma (large arrowheads) and small right occipital subdural hematoma (small arrow· heads).
C and 0, T2-weighted, 10-mm-thick axial (C) and coronal (D) SE images, 2300/80, reveal increased signal intensity in splenium (black ar· rows). Again note right frontal hematoma (large arrowheads) and right occipital subdural hematoma (small arrowheads). Fluid in left mastoid air cells is seen in 0 (white arrows).
MR OF CORPUS CALLOSUM
A
c
Fig. 5.-69-year-old man with traumatic hemorrhage into corpus callosum.
651
B
D
A, Unenhanced, 8-mm-thick CT scan at admission shows acute hemorrhage involving genu and splenium, as well as anterior and posterior interhemispheric fissures.
B, T1-weighted, 5-mm-thick midsagittal SE image, 1000/40, shows high-intensity signal of hemorrhage in body and splenium (arrows). C, T2-weighted, 10-mm-thick axial SE image, 2300/80, reveals high-intensity signal in splenium of corpus callosum (arrow) . Also note bilateral subdural
hematomas (arrowheads), not appreciated on CT scan.
652 REINARZ ET AL.
c D
A B c Fig. 7.-12-year-old boy with cerebral palsy, seizures, and hydrocephalus. A, 8-mm-thick CT scan shows lack of crossing fibers in region of splenium as well as shunt tube (dot).
AJNR:9, July/August 1988
Fig. 6.-62-year-old woman with biopsyproved grade II astrocytoma of the splenium.
A, Contrast-enhanced, 8-mm-thick CT scan suggests shift of midline to left and compression of right lateral ventricle. Splenium appears normal.
B, T1-weighted, 10-mm-thick midsagittal IR image, 2000/600/40, shows abnormal decreased signal intensity in splenium (arrows) compared with remainder of corpus callosum.
C, T2-weighted, 10-mm-thick axial SE image, 2300/80, reveals markedly abnormal signal intensity in splenium (arrows) and right hemispheric white matter. Differentiation between tumor and edema is not possible.
D, Posttherapy T1-weighted, 5-mm-thick midsagittal SE scan, 400/40, reveals normal signal intensity of splenium.
B, T1-weighted, 5-mm-thick midsagittal SE image, 500/40, shows agenesis of splenium and posterior one-half of body of corpus callosum. Anterior body and genu appear poorly developed (arrows) . Also note abnormalities of posterior fossa structures and marked enlargement of diploic space.
C, T2-weighted, 10-mm-thick coronal SE image, 2300/80, reveals only thin band of fibers composing body of corpus callosum (arrows).
AJNR:9. July/August 1988 MR OF CORPUS CALLOSUM 653
Fig. 8.-37-year-old schizophrenic woman. A, Contrast-enhanced, 8-mm-thick CT scan shows midline lipoma. B, Midsagittal, 5-mm-thick T1-weighted SE image, 400/40, shows high-intensity signal, consistent with fat, apparently involving entire corpus callosum
(dots). C, Coronal, 10-mm-thick T1-weighted IR image, 2000/600/40, reveals thin band of normal callosal tissue (arrows) below lipoma (dot).
Fig. 9.-38-year-old woman with hemorrhage into corpus callosum caused by pericallosal artery aneurysm rupture. T1-weighted, 5-mm-thick midsagittal SE image, 400/40.
A, 3 weeks after aneurysm clipping. Highintensity signal of subacute hemorrhage is easily identified (arrows). Clip artifact (arrowheads).
B, 3 months after aneurysm rupture. Highintensity signal abnormality has resolved. There is marked thinning of corpus callosum, probably due to atrophy or less likely to hydrocephalus.
A
agenesis (Fig. 7) and lipomas (Fig . 8). CT was performed in eight of the 11 cases. However, the direct sagittal and coronal imaging capabilities of MR more readily demonstrated these midline abnormalities. In agenesis, the sagittal MR images clearly demonstrated the absent CC and the abnormal configuration of gyri and sulci (Fig. 7). Lipomas had a characteristic high-intensity signal on T1-weighted sequences.
Vascular lesions.-Three patients in our series had CC involvement from "vascular" lesions. One patient had hemorrhage into the CC resulting from aneurysm rupture (Fig . 9). The other two patients had CC involvement from cerebral infarction (Fig. 10). All patients underwent both CT and MR evaluations, in that order. T2-weighted MR demonstrated areas of infarction with more sensitivity than CT did.
Demyelinating conditions.-Multiple sclerosis (MS) plaques were easily identified on MR (Fig. 11). The lesions presented as foci of increased signal intensity on T2-weighted images. Of the 156 patients with MS we examined, only three had
B
evidence of involvement of the CC. CT, performed in two of these patients, failed to demonstrate a lesion of the CC.
Inflammatory lesions .-Of 11 patients with the diagnosis of encephalitis who were evaluated with MR , only one patient had visible involvement of the CC (Fig. 12). Inflammatory changes involved both white and gray matter in all patients; these were manifested by increased signal intensity on T2-weighted images.
Discussion
Normal Anatomy
There is preliminary evidence that the CC may carry a different number of fibers in males and females and in rightas opposed to lefthanders [2 , 3] . This is an important issue, because, if those data are correct, they would constitute powerful evidence for different brain organization in relation
654 REINARZ ET AL. AJNR:9, July/August 1988
A 8
A 8
to gender and cerebral dominance. A significant difference has been found in total callosal area in relation to handedness in autopsy studies; lefthanders have a larger callosal area than righthanders [2]. The size and shape of the splenium has been found to vary between male and female autopsy specimens; the female splenium is wider and more bulbous than that of the male [3]. Because MR allows for the visualization and accurate measurement of midline sagittal structures, it is an accurate reflection of in vivo anatomy.
Our MR studies show that the corpora of males and females have significantly different configurations. These variations probably represent small, but reliable differences in the distribution of fibers within the corpora of males and females. These data provide additional evidence that brain organization differs in relation to gender and are in concordance with the autopsy findings of DeLacoste-Utamsing and Holloway [3]. However, our data do not agree with the findings of Witelson [2] , as we found significant differences only in callosal configuration and not in overall callosal size.
Pathology
Trauma.-Nonhemorrhagic and hemorrhage changes in the brain associated with trauma often result from diffuse axonal
Fig. 10.-51-year-old man with multiple infarct dementia.
A, Contrast-enhanced, 8-mm-thick CT scan reveals multiple areas of low attenuation and suggests involvement of splenium.
B, T2-weighted, 10-mm-thick axial SE scan, 2300/80, more clearly shows involvement of splenium (arrows).
Fig. 11.-49-year-old man with clinical signs of cervical myelopathy. Neurologic evaluation, including MR, led to diagnosis of multiple sclerosis (MS).
A, T1-weighted, 10-mm-thick axial IR image, 2100/600/40, shows low-intensity signal in region of right side of splenium (arrow) .
B, T2-weighted, 10-mm-thick axial SE image, 2300/80, reveals high signal intensity, typical of MS plaque (arrow).
injury [4]. Biomechanics investigators suspect axonal disruption is due to shear strains induced during angular acceleration of the brain [5]. The signal characteristics are those of increased tissue water, suggesting edema resulting from axonal disruption. These findings are appreciated better on MR than on CT [6, 7]. Our experience certainly agrees with this, as the nonhemorrhagic shear injury changes were much less evident on unenhanced CT of our patients.
Subacute hemorrhage is known for its MR characteristics of high signal intensity on both T1- and T2-weighted imaging [8]. Hemorrhagic lesions of the CC are readily visible on both CT and MR.
Neoplasia.-MR contrast agents were not administered, so differentiation between true neoplastic involvement of the CC and tumorogenic edema tracking across the CC was not possible in our patients. In an investigation of cerebral edema, Cowley [9] concluded that "the CC is refractory to transmission of edema from a remote lesion ," and he confirmed that it is unusual to see a bilateral pattern of hemispheric edema unless the lesion involves the CC primarily. The patient shown in Figure 6 demonstrates direct involvement of the CC with tumor so that edema is present in both hemispheres, most marked in the right hemisphere.
AJNR:9, July/August 1988 MR OF CORPUS CALLOSUM 655
Fig. 12.-7-year-old girl with subacute disseminated encephalitis. Admission CT study was unremarkable.
A, T1-weighted, 10-mm-thick axial IR image, 2300/600/40, shows abnormal low-intensity signal of genu (arrows).
8 and C, T2-weighted, 10-mm-thick axial (8) and coronal (C) SE images, 2300/80, reveal high signal intensity, manifesting edema, involving corpus callosum (arrows) . Multiple areas of abnormal signal are identified throughout hemispheres bilaterally.
D, T1-weighted, 10-mm-thick axial IR scan, 2300/500/40, 2 months later shows normal signal intensity of genu.
c
Congenital abnormalities.-Dysgenesis of the CC has been extensively documented in the literature, and an excellent review is available [10] . MR of dysgeneSiS has been reported [11] . Sagittal MR imaging is superior for demonstrating associated characteristics of complete agenesis, including absence of the cingulate gyrus and medial cortical sulci radiating to the diencephalon. One-third of intracranial lipomas occur in the region of the CC [10] . Demonstration of intracranial lipomas by MR has been documented [12]. The single lipoma encountered in our series was well seen on CT, but intact callosal fibers below the lipoma were not appreciated without coronal MR.
Vascular /esions .-Infarcts involving the CC are uncommon [13]. The multi planar capability of MR has permitted improved differentiation between infarct and mass when the clinical picture is not clear. In our patient with callosal hemorrhage as a result of aneurysm rupture, CT was sufficient to diagnose the acute hemorrhage, but MR more readily displayed the CC atrophy in the convalescent period (Fig. 10). The neurologic abnormalities of this case have been described in detail [14].
Demyelinating lesions . -Only three of 156 MS patients evaluated by MR to date at our institution had involvement of the CC. This corresponds to a frequency of less than 2%.
D
This finding is similar to that reported by Stewart et al. [15] , and at variance with the report of Simon et al. [16] . We included only abnormalities of signal and of gross CC configuration. Measurements to detect mild atrophic changes were not made, which may explain some of our discrepancies with Simon et al. [17].
Inflammatory conditions.-Of the 11 patients with encephalitis evaluated by MR , only one had involvement of the CC. MR revealed the lesions better at initial presentation than enhanced CT did, and provided a more sensitive means of monitoring during the resolution of the illness.
In conclusion, evaluation of the corpus callosum has been improved by the application of MR . Study of the CC and its variations in healthy volunteers provides new information pertaining to the organization of the normal brain . In disease states, MR often provides more complete characterization of the nature of a lesion and more clearly reveals the anatomic relationships to adjacent structures.
ACKNOWLEDGMENTS
We thank Patricia Osborn for assistance in manuscript preparation and Kevin Berbaum for help with the statistics .
656 REINARZ ET AL. AJNR:9, July/August 1988
REFERENCES
1. Oldfield RC. The assessment and analysis of handedness: the Edinburgh Inventory. Neuropsycho/ogia 1971 ;9: 97 -113
2. Wi tel son SF. The brain connection: the corpus callosum is larger in lefthanders. Science 1985;229:665- 668
3. DeLacoste-Utamsing C, HOlloway RL. Sexual dimorphism in the corpus callosum. Science 1982;216:1431-1432
4. Adams JH, Graham 01, Murray LS, Scott G. Diffuse axonal injury due to nonmissile head injury in humans: an analysis of 45 cases. Ann Neurol 1982;12: 557-563
5. Gennarelli TA, Thibault LE, Adams JH, et al. Diffuse axonal injury and traumatic coma in the primate. In: Dacey RG, Jr, ed. Trauma of the central nervous system. New York: Raven, 1985: 169-193
6. Hans JS, Kaufman B, Alfidi RJ. Head trauma evaluated by magnetic resonance and computed tomography: a comparison. Radiology 1984;150 :71 - 77
7. Gentry LR , Godersky JC, Thompson B, Dunn VD. Prospective comparative study of intermediate-field MR and CT in the evaluation of closed head trauma. AJNR 1988;9 :91 - 100, AJR 1988;150 :673-682
8. Gomori JM, Grossman RI , Goldberg HI, et al. Intracranial hematomas: imaging by high-field MR. Radiology 1985;157:87-93
9. Cowley AR . Influence of fiber tracts on the CT appearance of cerebral edema: anatomic-pathologic correlation . AJNR 1983;3 :915-925
10. Kendall BE. Dysgenesis of the corpus callosum. Neuroradio/ogy 1983;25:239-256
11 . Davidson HD, Raj A, Steiner RE. Agenesis of the corpus callosum: magnetic resonance imaging. Radiology 1985;155 :371-373
12. Kean OM, Smith MA, Douglas RHB, et al. Two examples of CNS lipomas demonstrated by computed tomography and low field (0.08T) MR imaging. J Comput Assist Tomogr 1985;9:494-496
13. Watson RT, Heilman KM, Bowers D. Magnetic resonance imaging (MRI, NMR) scan in a case of callosal apraxia and pseudoneglect. Brain 1985; 108: 535-536
15. Stewart JM, Houser OW, Baker HL, et al. MR imaging in the diagnosis of multiple sclerosis. Radiology 1985;157 (P):371
16. Simon JH, Cohn FS, Rudick RA, et al. Focal and diffuse abnormalities of the corpus callosum in multiple sclerosis. Radiology 1985;157 (P) : 151
17. Simon JH, Schiffer RB, Rudick RA, Herndon RM. Corpus callosum atrophy and callosal-subcallosal peri ventricular lesions in multiple sclerosis. Presented at annual meeting of the American Society of Neuroradiology, San Diego, January 1986