77
1

1

Name Company Committee
Mr. J. R. Shah Jayvee Organics & Polymers Pvt Ltd Convenor
Mr. Francis Pinto Consultant Chairman
Mr. Prem G Manghani Consultant Coordinator - Raw Materials
Mr. S.N. Kabra Kolsite Group of Companies Coordinator - Machinery
Mr. Achal N. Thakkar Tipco Industries Ltd. Member
Mr. Hemant Minocha Rajiv Plastics Limited Member
Mr. T. K. Bandopadhyay Indian Centre for Plastics in the Environment Member
Mr. N. K. Balgi Ferromatik Milacron India Ltd. Member
Mr. Rajendra Sharma Ferromatik Milacron India Ltd. Member
Mr. Sunil Jain Rajoo Engineers Ltd, Member
Mr. L. K. Singh Fixopan Machines Pvt. Ltd. Member
Mr. Rajiv Trivedi Prasad Koch Technik Pvt. Ltd. Member
Mr. Soham Mehta Axcel Polymers Ltd. Member
Mr. J. J. Modi Baerlocher India Additives Pvt. Ltd. Member
Mr. Bhaskar Ghosh Reliance Industries Limited Member
Mr. Vinod K. R. Reliance Industries Limited Member
Mr. Shekhar Balakrishan Reliance Industries Limited Member
Mr. Pushpraj Singhvi Consultant Member
Ms. Malini Hariharan ICIS Member
Mr. Chanchal Dasgupta Borouge Member
2
Committee Members

3
Contents
India Overview
Polymer Manufacturing Capacity
Polymer Consumption
Imports/Exports
Masterbatch/Additives
Machinery Manufacturing Industry
Polymer Growth Opportunities
Conclusion
Auxiliary Equipment
Plastics Recycling
4 – 13
14 – 19
20 – 35
42 – 46
36 – 41
51 – 60
63 – 70
71 – 77
61 – 62
47 – 50

4
…..land of billion opportunities
India Snapshot
• Population 1.25 Bn (4 times US)
• Largest parliamentary democracy
• Secular state - no state religion
• Independent judiciary
• 23 official languages, business language predominantly English
• Excellent social infrastructure – education, healthcare, travel & recreation.
• Third largest economy on PPP basis (appx. US $5 trillion)
Source: Plastindia Foundation

5
54
56
58
60
62
64
66
68
70
72
74
2000
2005
2010
2015
2020
2025
2030
India Brazil
China Russia
G6
Large potentially productive workforce
Working Age Population as % of Total
Population (Age 15 – 60)
• 66% of India in the working
age group – 768m
• Median age – 24 years
Demographic Profile
Source: Plastindia Foundation
6
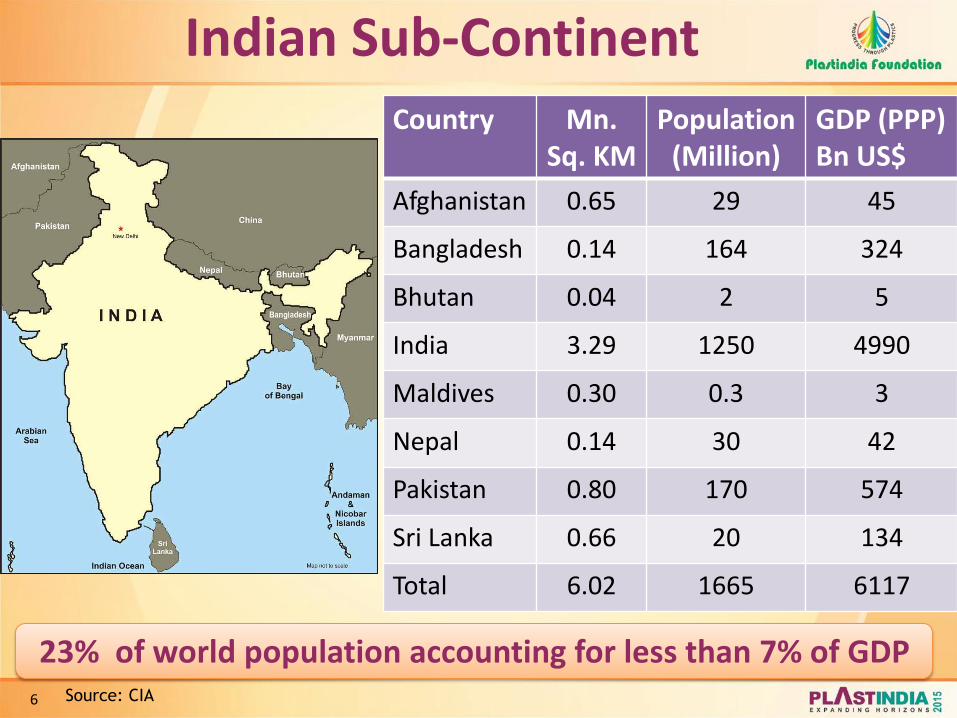
Country Mn. Sq. KM
Population (Million)
GDP (PPP) Bn US$
Afghanistan 0.65 29 45
Bangladesh 0.14 164 324
Bhutan 0.04 2 5
India 3.29 1250 4990
Maldives 0.30 0.3 3
Nepal 0.14 30 42
Pakistan 0.80 170 574
Sri Lanka 0.66 20 134
Total 6.02 1665 6117
23% of world population accounting for less than 7% of GDP
Indian Sub-Continent
Source: CIA

7
10th largest in the world by nominal GDP and the 3rd largest by PPP Source: CRISIL/Ministry of Finance
Indian Economy (%)
2010-11 2011-12 2012-13 2013-14
GDP (Factor Cost) 8.4 6.9 4.5 4.9
Growth
Agriculture 5.0 2.7 1.4 4.6
Industry 8.6 8.2 1 0.7
Services 9.4 9.6 7 6.9
Total 8.4 6.9 4.5 4.9
Inflation WPI-Average
8.0-8.5 9.2 7.3 5.98
Interest rate 10-year G-Sec
8.1-8.3 8.5 8.1 8.4
Exchange rate Re / US $ (Year-end)
43.5 48 54.4 60.06
Fiscal deficit As a % of GDP
4.8 5.7 5.2 4.50
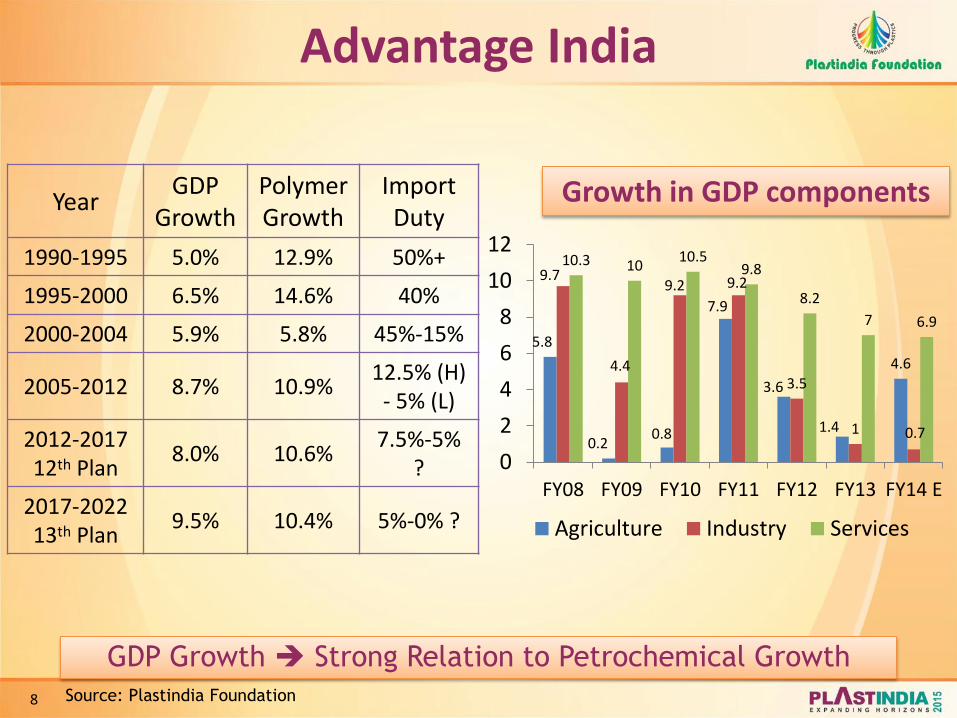
Advantage India
Year GDP
Growth
Polymer Growth
Import Duty
1990-1995 5.0% 12.9% 50%+
1995-2000 6.5% 14.6% 40%
2000-2004 5.9% 5.8% 45%-15%
2005-2012 8.7% 10.9% 12.5% (H)
- 5% (L)
2012-2017 12th Plan
8.0% 10.6% 7.5%-5%
?
2017-2022 13th Plan
9.5% 10.4% 5%-0% ?
5.8
0.2 0.8
7.9
3.6
1.4
4.6
9.7
4.4
9.2 9.2
3.5
1 0.7
10.3 10 10.5
9.8
8.2
7 6.9
0
2
4
6
8
10
12
FY08 FY09 FY10 FY11 FY12 FY13 FY14 E
Agriculture Industry Services
Growth in GDP components
GDP Growth Strong Relation to Petrochemical Growth
8 Source: Plastindia Foundation
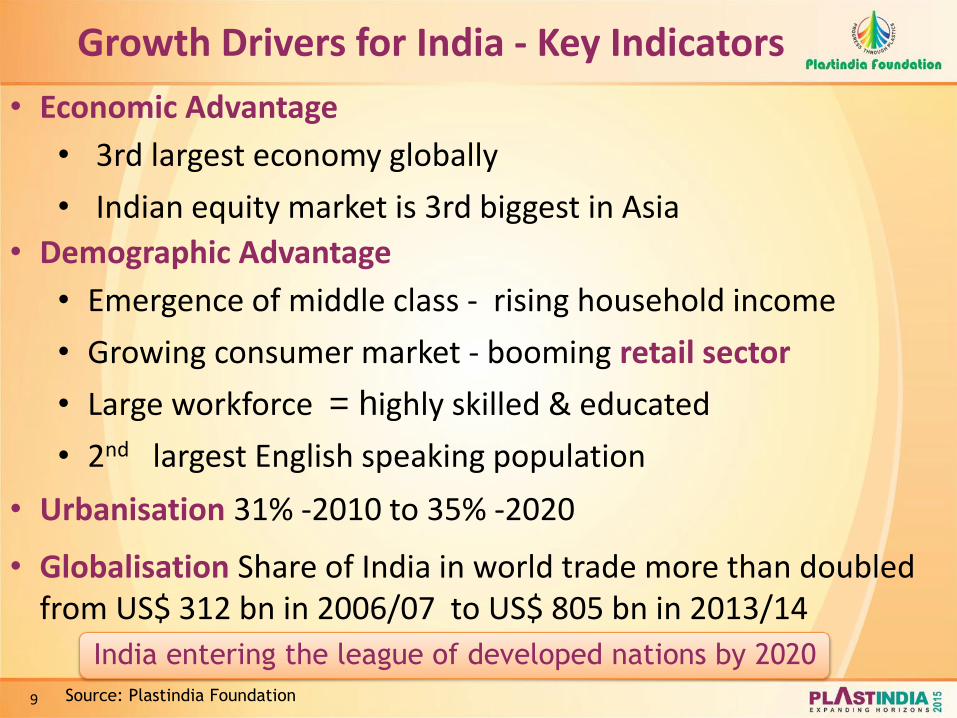
9
• Economic Advantage
• 3rd largest economy globally
• Indian equity market is 3rd biggest in Asia
• Demographic Advantage
• Emergence of middle class - rising household income
• Growing consumer market - booming retail sector
• Large workforce = highly skilled & educated
• 2nd largest English speaking population
• Urbanisation 31% -2010 to 35% -2020
• Globalisation Share of India in world trade more than doubled from US$ 312 bn in 2006/07 to US$ 805 bn in 2013/14
Growth Drivers for India - Key Indicators
India entering the league of developed nations by 2020
Source: Plastindia Foundation
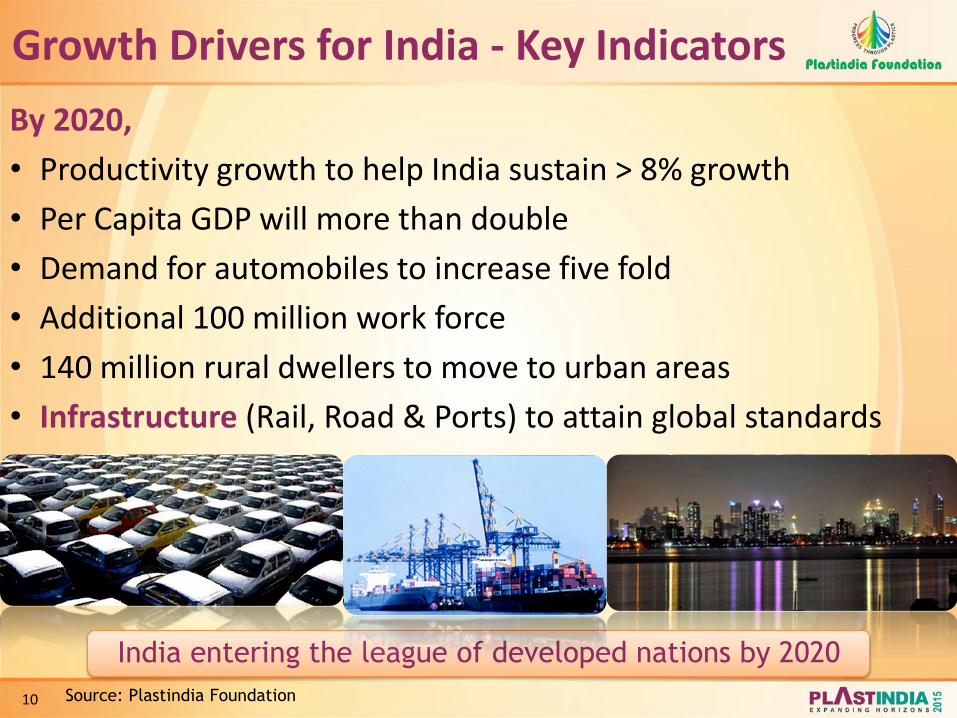
10
By 2020,
• Productivity growth to help India sustain > 8% growth
• Per Capita GDP will more than double
• Demand for automobiles to increase five fold
• Additional 100 million work force
• 140 million rural dwellers to move to urban areas
• Infrastructure (Rail, Road & Ports) to attain global standards
Growth Drivers for India - Key Indicators
India entering the league of developed nations by 2020
Source: Plastindia Foundation

11
Large market creates inherent demand for petrochemicals
Source : Cris Infac, SIAM, MoSPI, DGCA, TRAI, Industry, Plastindia Foundation
Growth Drivers - Examples of Growth Millions 2011 2020E CARG
White goods CTV 13.6 60 20%
Refrigerator 5.1 14.3 8%
Air conditioner 2.6 18 13%
Washing Machines 2.5 9.1 14%
Transportation Car 1.7 9.7 18%
Commercial Vehicles 0.43 5.4 30%
Two wheelers 8.9 30 66%
Infrastructure Electricity (Bn Units) 773 1870 13%
Steel (MT) 55.1 130 11%
Coal (MT) 540.6 1380 16%
Cement (MT) 193.5 509 13%
Airline Passengers 43.2 452 28%
Mobile subscribers (Additions)
160 5000 24%
Polymers 2013 Consumption in MMT
12.2 20 10%

12
India – the wide open economy Source: Ministry of Commerce & Industry, Government of India
• India’s total merchandise
trade increased over two-
fold from US$ 312 Bn in
2006/07 to US$ 805Bn in
2013/14
India’s International Trade
126 163 185 179 251 306 300 314 186 252
304 288 370
489 492 491 312
415 489 467
621
795 792 805
FY2007 FY2008 FY2009 FY2010 FY2011 FY2012 FY2013 FY2014
Exports Imports Trade
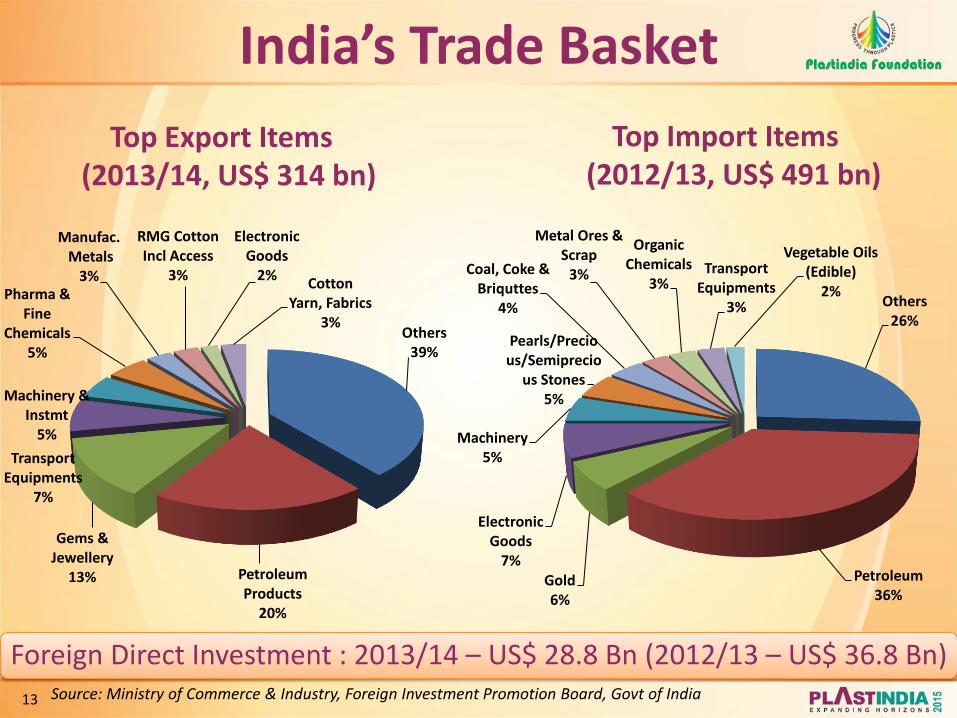
13 Source: Ministry of Commerce & Industry, Foreign Investment Promotion Board, Govt of India
Top Import Items (2012/13, US$ 491 bn)
Top Export Items (2013/14, US$ 314 bn)
Foreign Direct Investment : 2013/14 – US$ 28.8 Bn (2012/13 – US$ 36.8 Bn)
India’s Trade Basket
Others 39%
Petroleum Products
20%
Gems & Jewellery
13%
Transport Equipments
7%
Machinery & Instmt
5%
Pharma & Fine
Chemicals 5%
Manufac. Metals
3%
RMG Cotton Incl Access
3%
Electronic Goods
2% Cotton
Yarn, Fabrics 3%
Others 26%
Petroleum 36%
Gold 6%
Electronic Goods
7%
Machinery 5%
Pearls/Precious/Semiprecio
us Stones 5%
Coal, Coke & Briquttes
4%
Metal Ores & Scrap
3%
Organic Chemicals
3% Transport
Equipments 3%
Vegetable Oils (Edible)
2%

14
Polymer Manufacturing
Capacity
0
500
1000
1500
2000
2500
3000
3500
4000
4500
5000
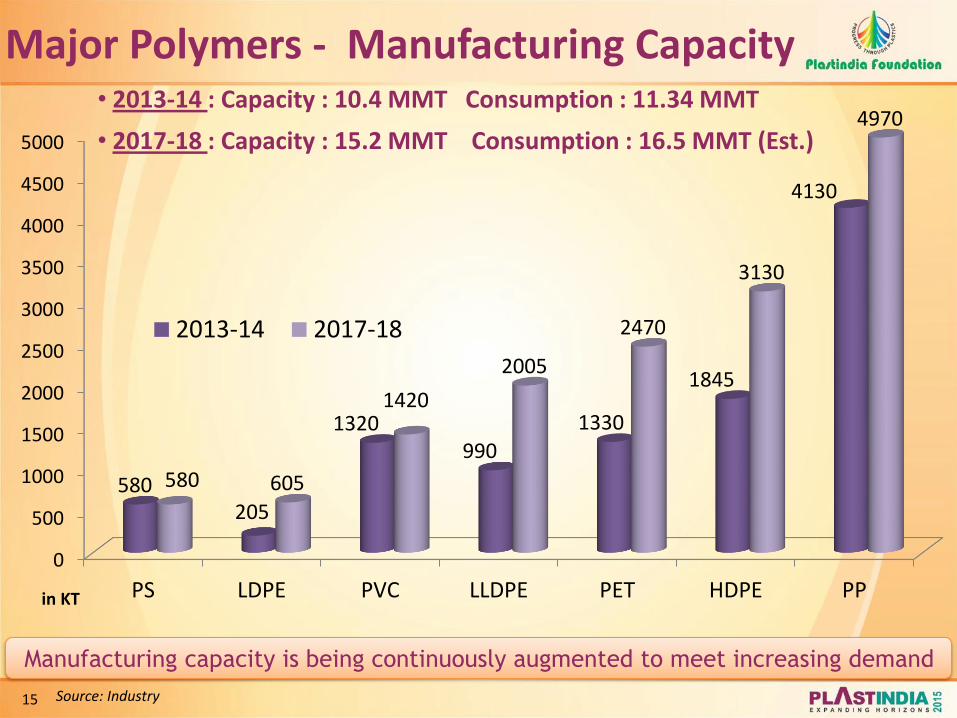
PS LDPE PVC LLDPE PET HDPE PP
580 205
1320 990
1330
1845
4130
580 605
1420
2005
2470
3130
4970
2013-14 2017-18
15
Major Polymers - Manufacturing Capacity
Manufacturing capacity is being continuously augmented to meet increasing demand
• 2013-14 : Capacity : 10.4 MMT Consumption : 11.34 MMT
• 2017-18 : Capacity : 15.2 MMT Consumption : 16.5 MMT (Est.)
in KT
Source: Industry
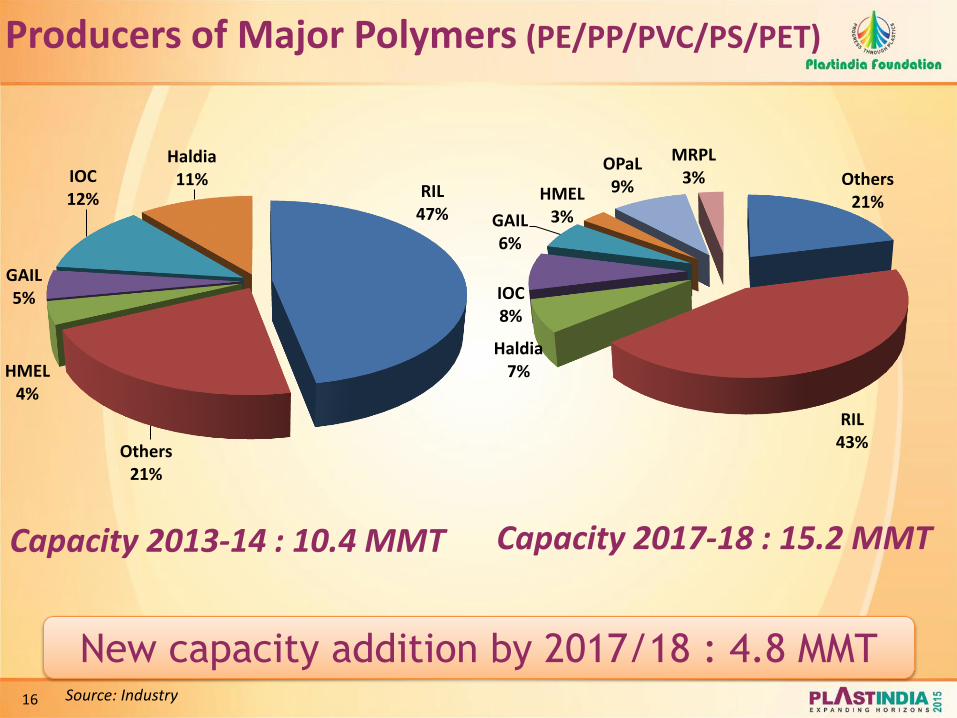
16
Producers of Major Polymers (PE/PP/PVC/PS/PET)
Capacity 2013-14 : 10.4 MMT Capacity 2017-18 : 15.2 MMT
New capacity addition by 2017/18 : 4.8 MMT Source: Industry
RIL 47%
Others 21%
HMEL 4%
GAIL 5%
IOC 12%
Haldia 11% Others
21%
RIL 43%
Haldia 7%
IOC 8%
GAIL 6%
HMEL 3%
OPaL 9%
MRPL 3%
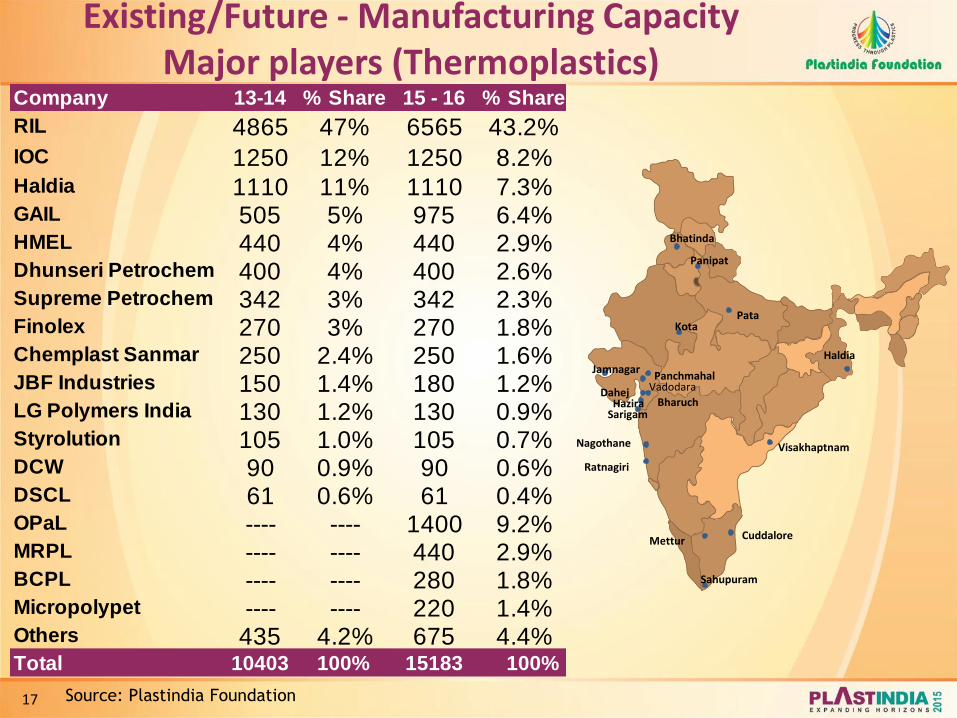
17
Existing/Future - Manufacturing Capacity Major players (Thermoplastics)
Vadodara
Nagothane
Dahej Hazira
Jamnagar
Pata
Panipat
Haldia
Bhatinda
Visakhaptnam
Panchmahal
Bharuch
Ratnagiri
Mettur Cuddalore
Sarigam
Sahupuram
Kota
Company 13-14 % Share 15 - 16 % Share
RIL 4865 47% 6565 43.2%IOC 1250 12% 1250 8.2%Haldia 1110 11% 1110 7.3%GAIL 505 5% 975 6.4%HMEL 440 4% 440 2.9%Dhunseri Petrochem 400 4% 400 2.6%Supreme Petrochem 342 3% 342 2.3%Finolex 270 3% 270 1.8%Chemplast Sanmar 250 2.4% 250 1.6%JBF Industries 150 1.4% 180 1.2%LG Polymers India 130 1.2% 130 0.9%Styrolution 105 1.0% 105 0.7%DCW 90 0.9% 90 0.6%DSCL 61 0.6% 61 0.4%OPaL ---- ---- 1400 9.2%MRPL ---- ---- 440 2.9%BCPL ---- ---- 280 1.8%Micropolypet ---- ---- 220 1.4%Others 435 4.2% 675 4.4%Total 10403 100% 15183 100%
Source: Plastindia Foundation

18
Planned Manufacturing Capacity (Thermoplastics)
ONGC PetroAdditions Dahej - Gujarat
Indian Oil Paradip - Odhisa
MRPL Mangalore - Karnataka
BCPL Lapetkata - Assam
Source: Plastindia Foundation

19
Speciality Polymers Production
Note: Mainly for export; local consumption only 10-15% of capacity
Made in India for the world
MANUFACTURER PLASTICS CAPACITY
(Tonnes/ annum) MAJOR
APPLICATIONS
Solvay Specialties
Polyether Sulfone (PES) 1200 Chip Trays, Electricals.
Polyether Ether Ketone (PEEK) 500
Stock Shapes, E&E, Cables, Gen. Engineering
Cytec/Rallis Polyether Ketone
Ketone (PEKK) 100 CF Composites
Gharda Chemicals
Polyether Ketone (PEK) 100
Stock shape, Cable, Gen. Engineering
Polyether Ketone Ketone (PEKK) 50
Electronics, Oil Fields, Gen. Engineering
PolyBenzimidazole (ABPBI) 25
Blends with PEK, Fire Resistant Fiber, High Temp.
Membranes

20
India - Polymer Consumption
21
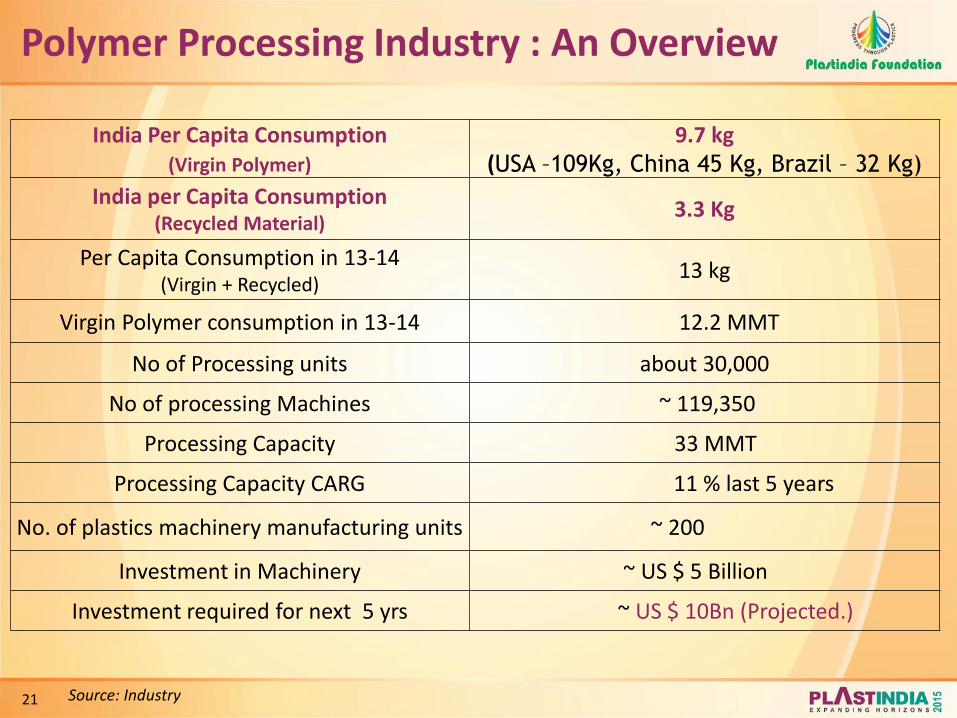
Polymer Processing Industry : An Overview
Source: Industry
India Per Capita Consumption (Virgin Polymer)
9.7 kg (USA –109Kg, China 45 Kg, Brazil – 32 Kg)
India per Capita Consumption (Recycled Material)
3.3 Kg
Per Capita Consumption in 13-14 (Virgin + Recycled)
13 kg
Virgin Polymer consumption in 13-14 12.2 MMT
No of Processing units about 30,000
No of processing Machines ~ 119,350
Processing Capacity 33 MMT
Processing Capacity CARG 11 % last 5 years
No. of plastics machinery manufacturing units ~ 200
Investment in Machinery ~ US $ 5 Billion
Investment required for next 5 yrs ~ US $ 10Bn (Projected.)

22
Demand 12.2 MMT (2013/14) 17.6 MMT (2017/18) : ~ 11% CARG
Total Polymer Consumption : 2013-14 (Thermoplastics + Thermosets)
Source: PlastIndia Foundation
(KT)
PE 3450
PP 3400
PVC 2400
Thermosets 840
PET 600
BOPET 430
Engg. Polymers 530
PS/EPS 310 EVA
110
Others* 130
cPVC – 100
TPE – 16
TPU – 14
23
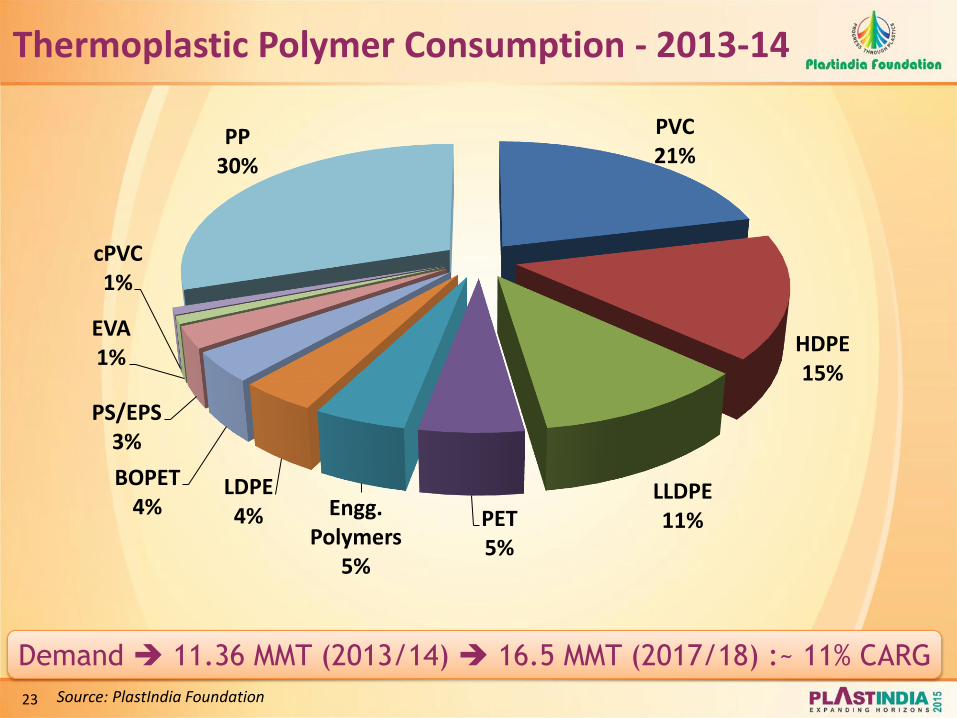
Thermoplastic Polymer Consumption - 2013-14
Demand 11.36 MMT (2013/14) 16.5 MMT (2017/18) :~ 11% CARG
Source: PlastIndia Foundation
PVC 21%
HDPE 15%
LLDPE 11% PET
5%
Engg. Polymers
5%
LDPE 4%
BOPET 4%
PS/EPS 3%
EVA 1%
cPVC 1%
PP 30%
24
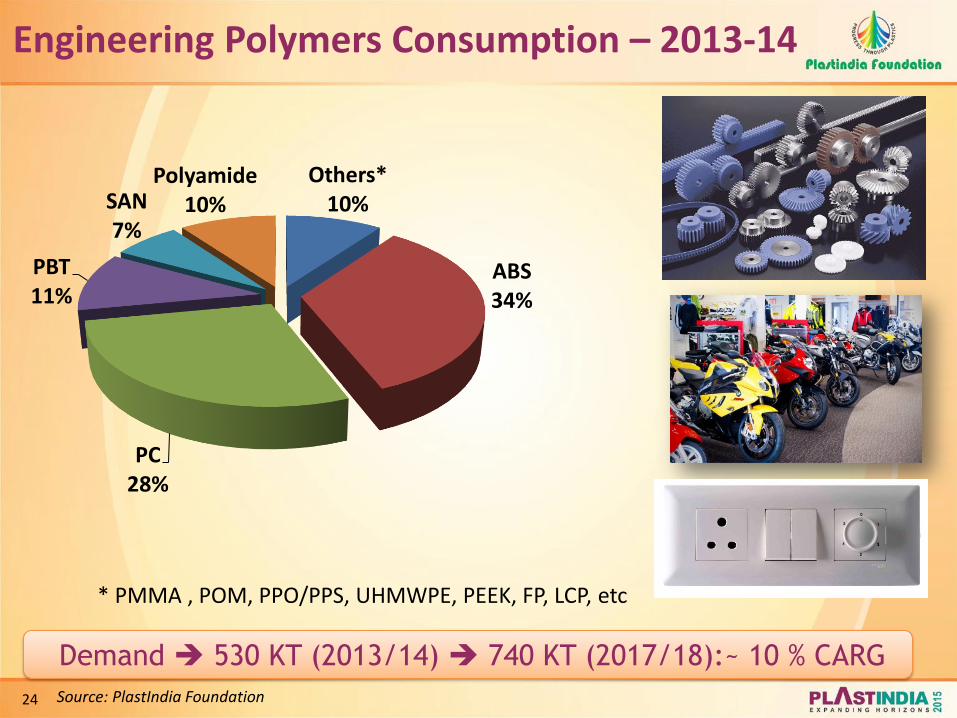
Demand 530 KT (2013/14) 740 KT (2017/18):~ 10 % CARG
Engineering Polymers Consumption – 2013-14
Source: PlastIndia Foundation
Others* 10%
ABS 34%
PC 28%
PBT 11%
SAN 7%
Polyamide 10%
* PMMA , POM, PPO/PPS, UHMWPE, PEEK, FP, LCP, etc
25
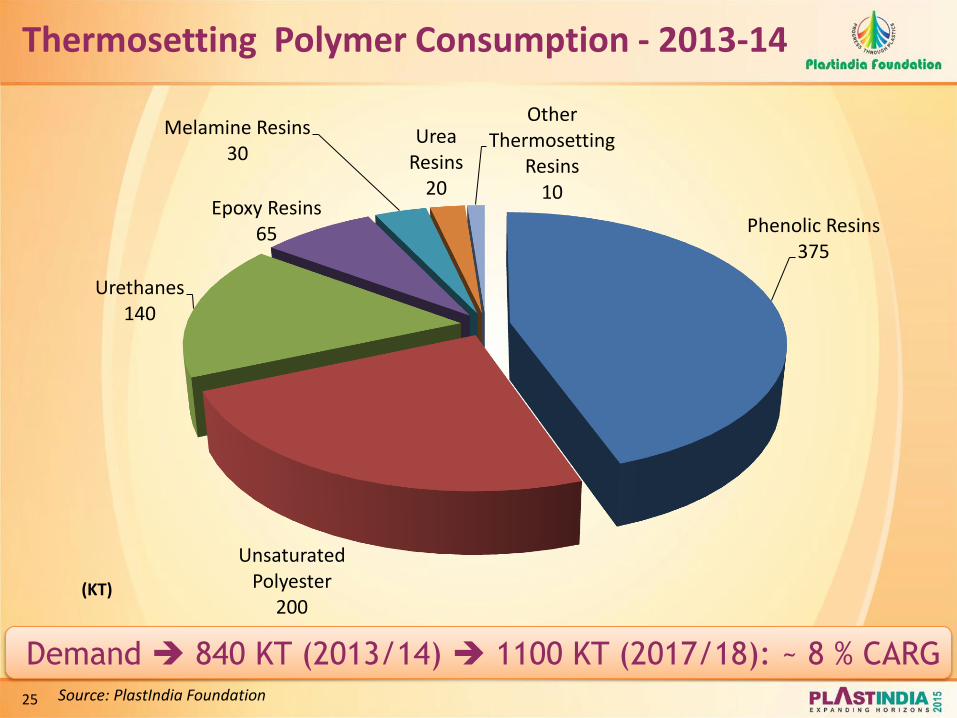
Demand 840 KT (2013/14) 1100 KT (2017/18): ~ 8 % CARG
Thermosetting Polymer Consumption - 2013-14
Source: PlastIndia Foundation
Phenolic Resins 375
Unsaturated Polyester
200
Urethanes 140
Epoxy Resins 65
Melamine Resins 30
Urea Resins
20
Other Thermosetting
Resins 10
(KT)
26
Sector wise Polymer
Consumption

27
Demand – 3.45 MMT (2013/14) – 4.90 MMT(2017/18) : ~ 10% CARG
India to be top ten packaging consumer by 2017 - demand set to reach $24 Bn by 2017
PE Sector wise Consumption - 2013-14
Source: PlastIndia Foundation
Others 9%
Film 45%
BM 17%
IM 6%
Raffia 7%
Pipe 10%
Rotomoulding 2%
W&C 2% EC
2%
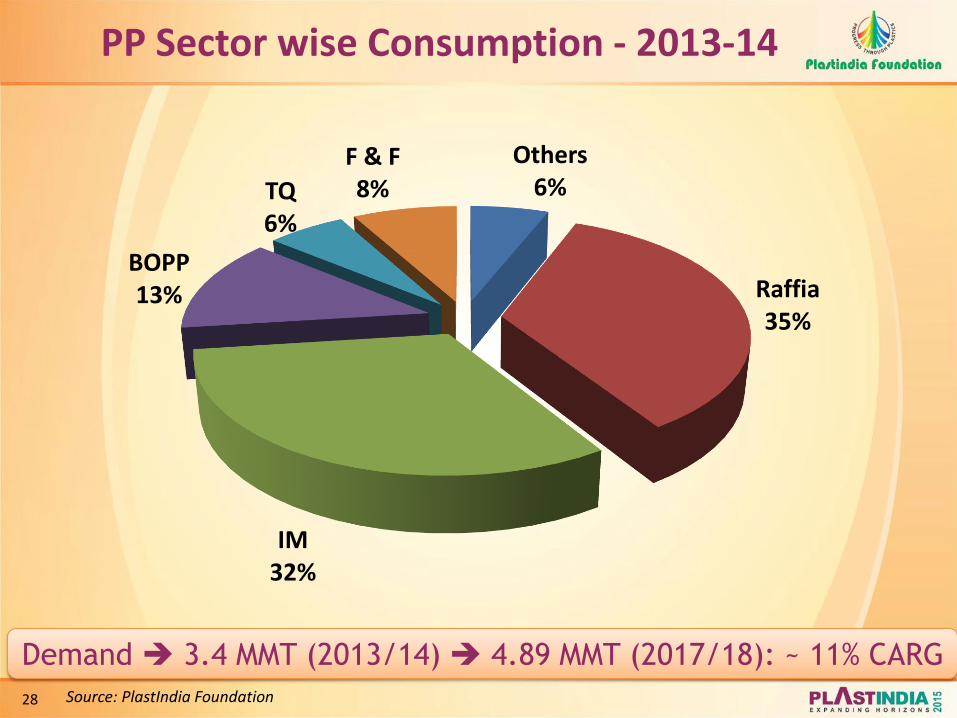
28
PP Sector wise Consumption - 2013-14
Source: PlastIndia Foundation
Others 6%
Raffia 35%
IM 32%
BOPP 13%
TQ 6%
F & F 8%
Demand 3.4 MMT (2013/14) 4.89 MMT (2017/18): ~ 11% CARG

29
PVC Sector wise Consumption - 2013-14
Source: PlastIndia Foundation
Pipes 67%
Calendering 9%
Wire & Cables
5%
Films 2%
Fittings 6%
Profiles 5%
Others 6%
Demand 2.4 MMT (2013/14) 3.33 MMT (2017/18):~ 9% CARG
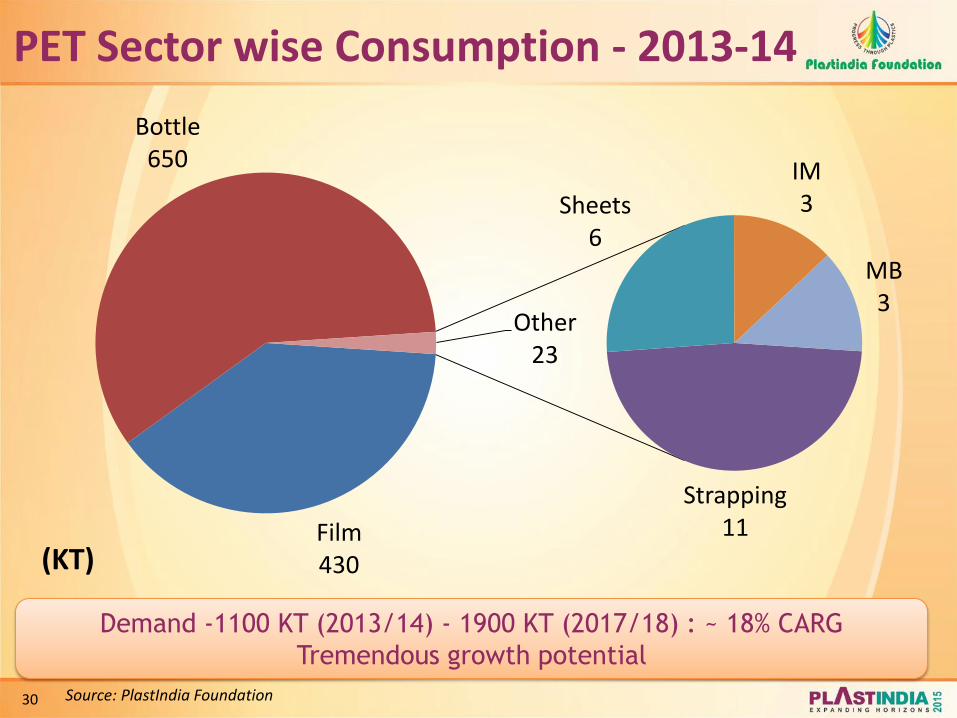
30
PET Sector wise Consumption - 2013-14
Demand -1100 KT (2013/14) - 1900 KT (2017/18) : ~ 18% CARG
Tremendous growth potential
Source: PlastIndia Foundation
(KT) Film 430
Bottle 650
Strapping 11
Sheets 6
IM 3
MB 3
Other 23

31
PET (Bottle Grade) Sector wise Consumption
Demand 650 KT (2013/14) 1200 KT (2017/18) : ~ 21 % CARG
Tremendous Growth Potential for Indian Market
Source: PlastIndia Foundation
Alcoholic Beverages
14% Health Care
15%
Personal Care 8%
Flavoured Beverages
6% Cooking Oil 5%
Agro Chemicals 2%
Others 12%
Water 21%
CSD 17%

32
PS/EPS Sector wise Consumption - 2013-14
Source: PlastIndia Foundation
Consumer Durables
31%
Food Services
14%
Novelty/ Gift Items 11%
Writing Instruments
7%
Foamed Sheet
7% Electronics
4% Razor,
Hanger, Toy 5%
Packaging 75%
Insulation 25%
EPS 80
Demand 310 KT (2013/14) 385 KT (2017/18):~ 6 % CARG
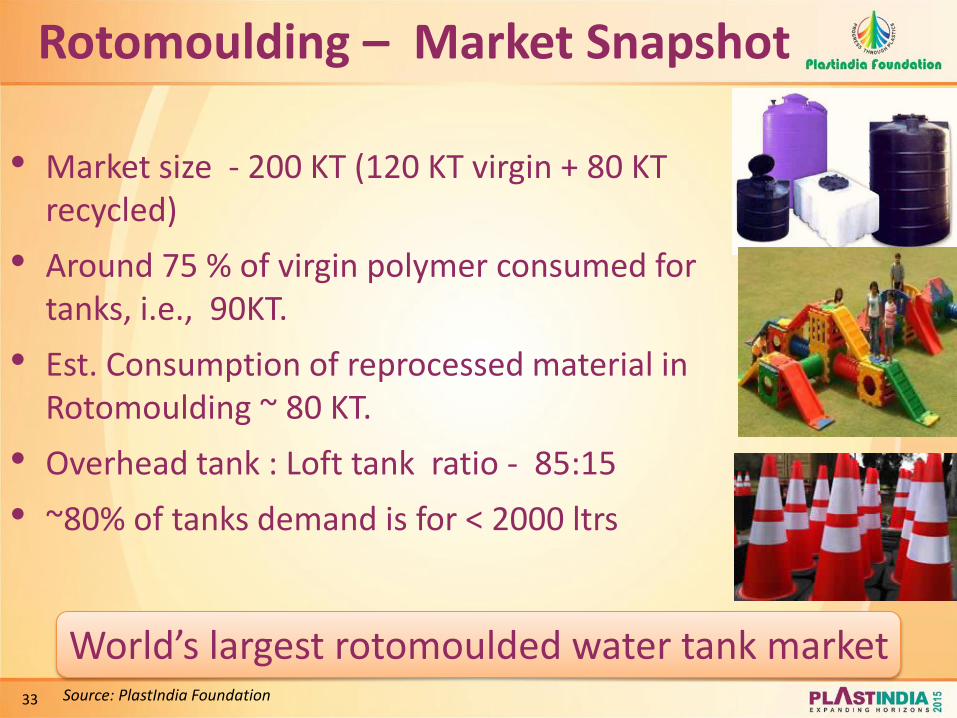
33
World’s largest rotomoulded water tank market
Rotomoulding – Market Snapshot
Source: PlastIndia Foundation
• Market size - 200 KT (120 KT virgin + 80 KT recycled)
• Around 75 % of virgin polymer consumed for tanks, i.e., 90KT.
• Est. Consumption of reprocessed material in Rotomoulding ~ 80 KT.
• Overhead tank : Loft tank ratio - 85:15
• ~80% of tanks demand is for < 2000 ltrs
34
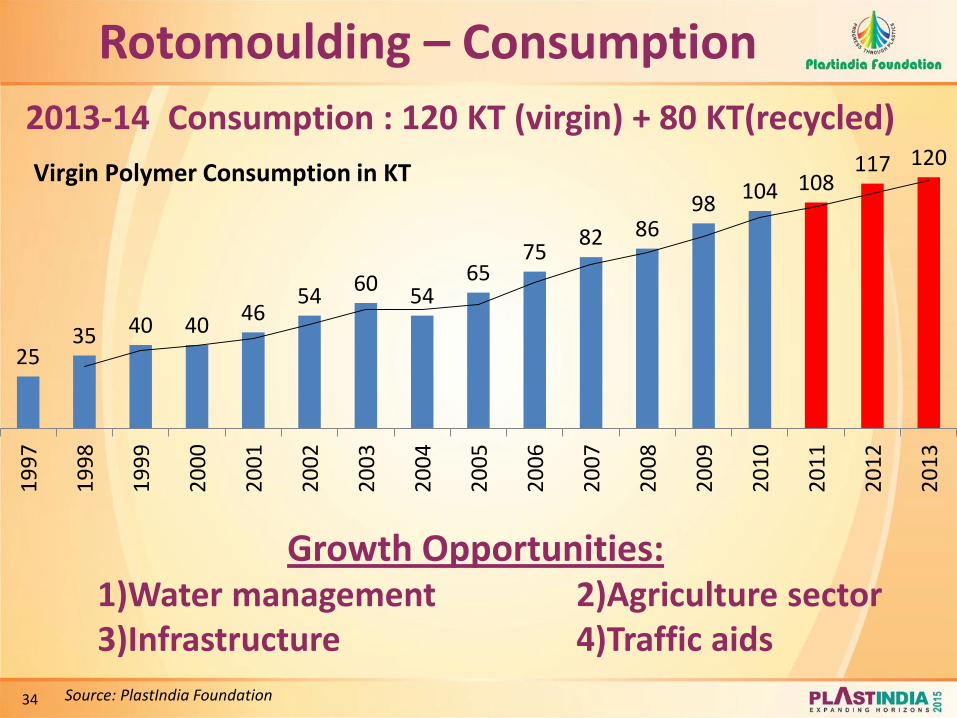
Rotomoulding – Consumption
Source: PlastIndia Foundation
2013-14 Consumption : 120 KT (virgin) + 80 KT(recycled)
Growth Opportunities: 1)Water management 2)Agriculture sector 3)Infrastructure 4)Traffic aids
25 35 40 40
46 54
60 54
65 75
82 86 98
104 108 117 120
19
97
19
98
19
99
20
00
20
01
20
02
20
03
20
04
20
05
20
06
20
07
20
08
20
09
20
10
20
11
20
12
20
13
Virgin Polymer Consumption in KT
35
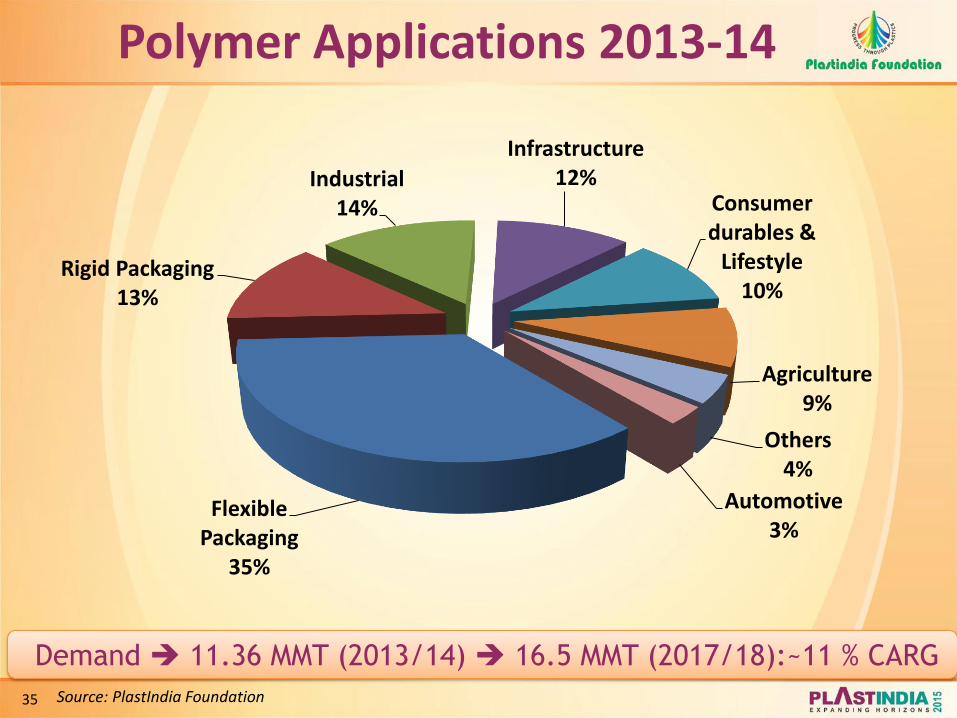
Flexible Packaging
35%
Rigid Packaging 13%
Industrial 14%
Infrastructure 12%
Consumer durables &
Lifestyle 10%
Agriculture 9%
Others 4%
Automotive 3%
Polymer Applications 2013-14
Source: PlastIndia Foundation
Demand 11.36 MMT (2013/14) 16.5 MMT (2017/18):~11 % CARG

36
Masterbatch
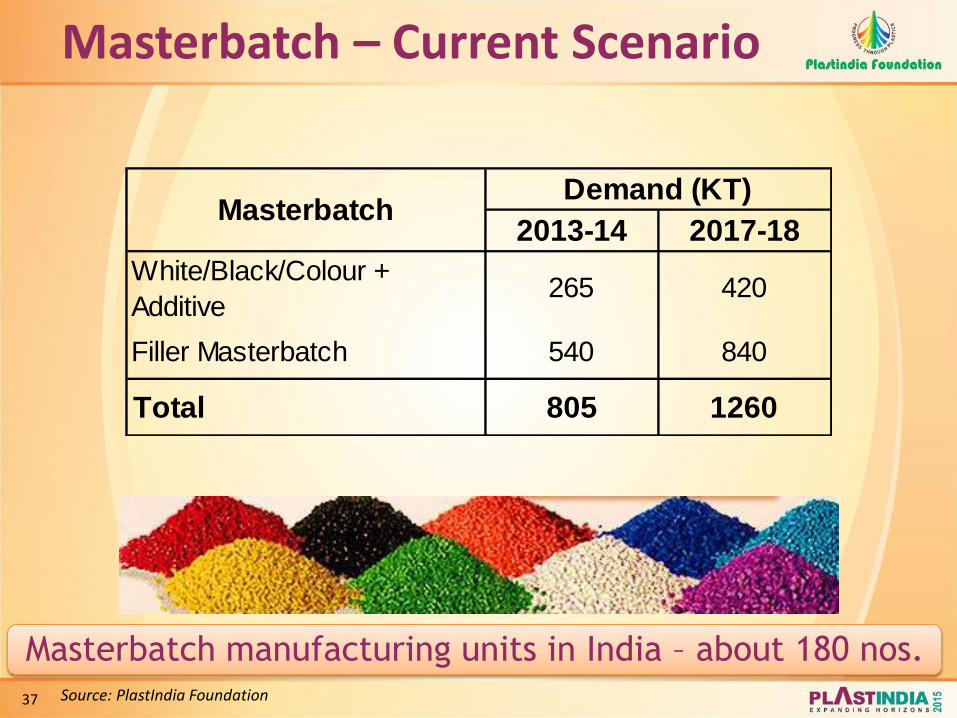
37
Masterbatch manufacturing units in India – about 180 nos.
2013-14 2017-18
White/Black/Colour +
Additive 265 420
Filler Masterbatch 540 840
Total 805 1260
Demand (KT)Masterbatch
Masterbatch – Current Scenario
Source: PlastIndia Foundation

38
Masterbatch – Growth drivers
• Cling, anti-bacterial, anti-static, anti-fog, foaming agents and high speed extruded films
• Focus on quality aspects
• Surface printed film for packaging of milk, oil, etc
• Black Masterbatch
• Raffia
Source: Plastindia Foundation

39
Additives
40
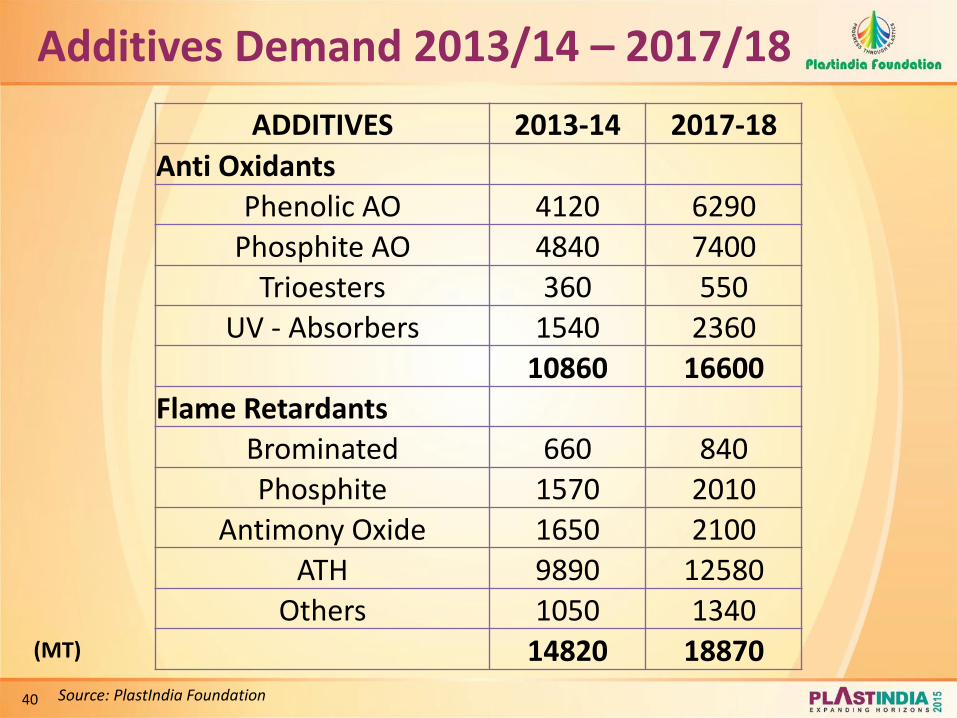
Additives Demand 2013/14 – 2017/18
(MT)
Source: PlastIndia Foundation
ADDITIVES 2013-14 2017-18
Anti Oxidants Phenolic AO 4120 6290
Phosphite AO 4840 7400
Trioesters 360 550
UV - Absorbers 1540 2360
10860 16600
Flame Retardants Brominated 660 840
Phosphite 1570 2010
Antimony Oxide 1650 2100
ATH 9890 12580
Others 1050 1340
14820 18870

41
Additives Demand 2013/14 – 2017/18
(MT)
Source: PlastIndia Foundation
ADDITIVES 2013-14 2017-18
Stabilizers
PVC Heat Stabilisers 58700 80460
Modifiers
Impact Modifiers 7300 10050
Processing Aids 5820 7980
13120 18030
Plastisizers
Primary Plastisizers 231750 306110
Epoxy Plastisizers 30900 40810
Chlorinated Paraffins 128750 170060
391400 516980
42
Imports/Exports
43
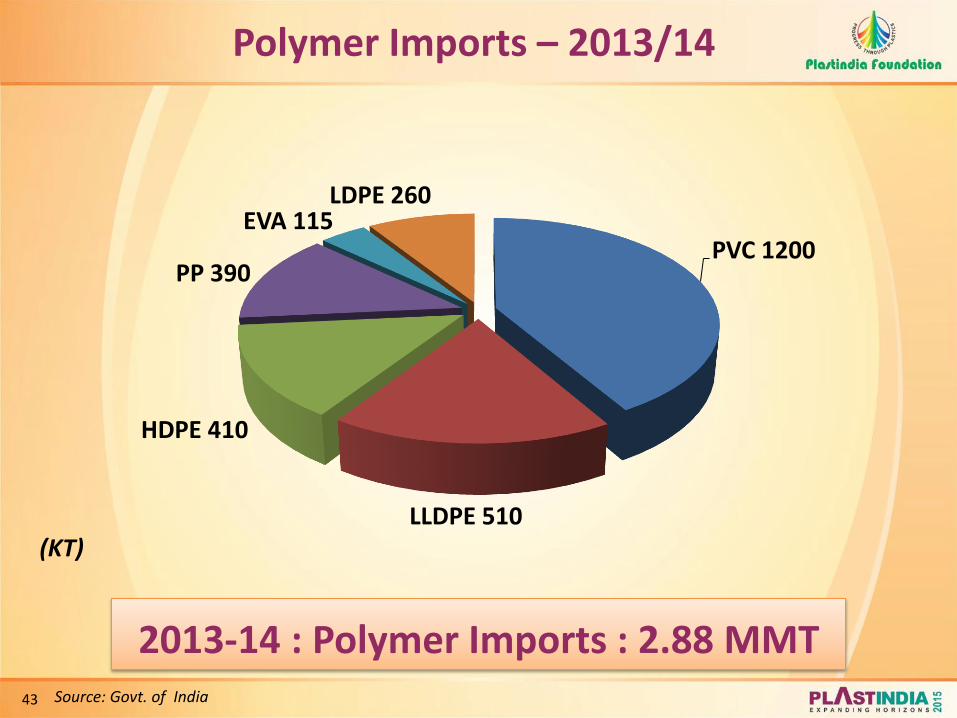
2013-14 : Polymer Imports : 2.88 MMT
Polymer Imports – 2013/14
(KT)
Source: Govt. of India
PVC 1200
LLDPE 510
HDPE 410
PP 390
EVA 115 LDPE 260
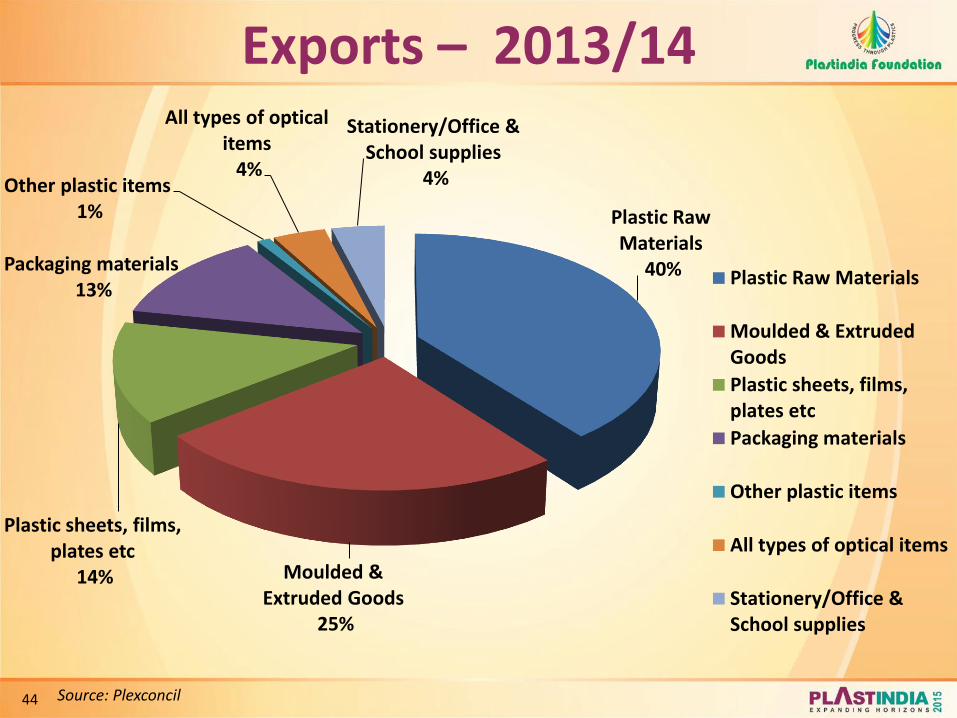
44 Source: Plexconcil
Exports – 2013/14
Plastic Raw Materials
40%
Moulded & Extruded Goods
25%
Plastic sheets, films, plates etc
14%
Packaging materials 13%
Other plastic items 1%
All types of optical items 4%
Stationery/Office & School supplies
4%
Plastic Raw Materials
Moulded & ExtrudedGoods
Plastic sheets, films,plates etc
Packaging materials
Other plastic items
All types of optical items
Stationery/Office &School supplies
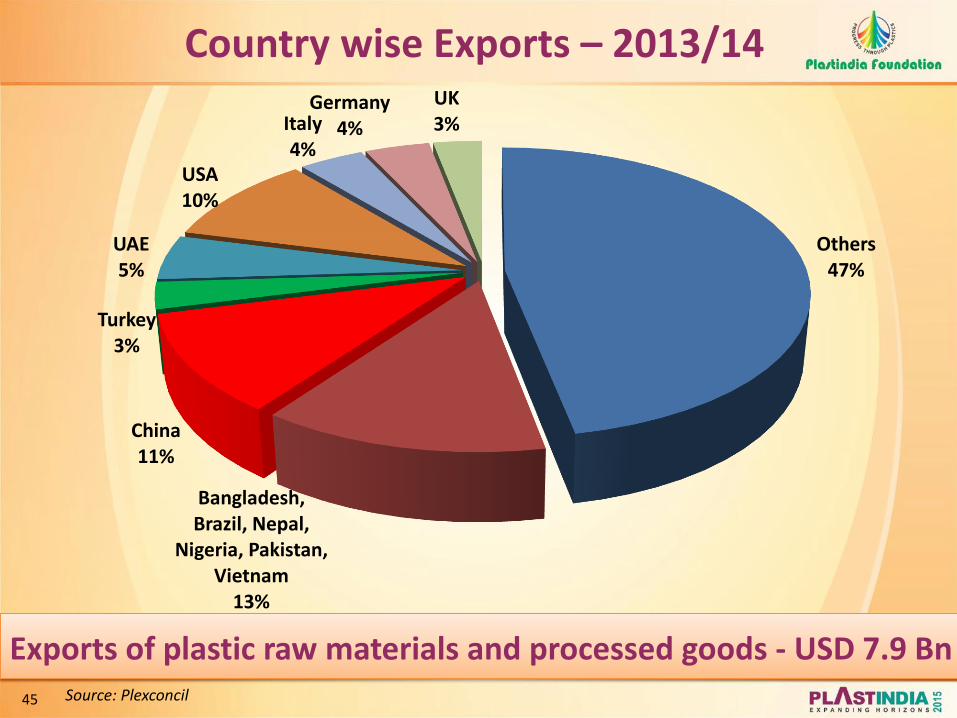
45 Source: Plexconcil
Country wise Exports – 2013/14
Exports of plastic raw materials and processed goods - USD 7.9 Bn
Others 47%
Bangladesh, Brazil, Nepal,
Nigeria, Pakistan, Vietnam
13%
China 11%
Turkey 3%
UAE 5%
USA 10%
Italy 4%
Germany 4%
UK 3%

46
Product Imports – 2013/14
• Moulded & Extruded goods • Laminates
• Polyester film • Poly-lined jute goods
• Woven sacks/Fabrics/Bags • Moulded & Soft luggage items
• Writing instruments • Lenses
• Floor coverings • GRP/FRP products
• PVC fabricated goods • Electrical accessories
• PVC leather cloth • Bangles/Imitation jewelry
• Ropes/Twines/Yarn/Bristles • Optical goods
• Fish nets/Fishing line • Polythene pipes
• PVC rigid/flexible pipes/fitting • Cine X-Ray films
• PVC sheeting/film • Toys/Dolls/Games
Source: Plastindia Foundation
47
Plastics Recycling

48
Plastics Recycling • Last industry study on recycling published in 2008
• Number of organised recycling units: 3500
• Number of unorganised recycling units: 4000
• Major types of plastics recycled: PET, HDPE, PVC, LDPE/LLDPE, PP, PS & others like ABS, PMMA etc.
• Manpower directly involved in plastics recycling: around 6, 00,000
• Manpower indirectly involved in plastics recycling: around 10, 00,000
• Quantum of plastics recycled per annum: 4 MMT. Estimation based on following facts :
Almost 100% of rigid packaging products is recycled except EPS
70% of PET bottles are recycled
Large imports of plastic scrap & waste pairings
Waste generated by plastic industry, industrial plastic waste
Recycling including plastics from household, furniture etc applications
Plastic products going into municipal solid waste
Source: ICPE

49
Plastics Recycling Clusters
Estimated quantity of recycled plastics 4 MMT
• Dhoraji, Gujarat • Daman • Vapi, Gujarat • Malegaon (Dyana) & Solapur in
Maharashtra • Dharavi and Bhandup in Mumbai • Indore, Madhya Pradesh • Delhi, NCR
Recycling Centres
Source: ICPE
50
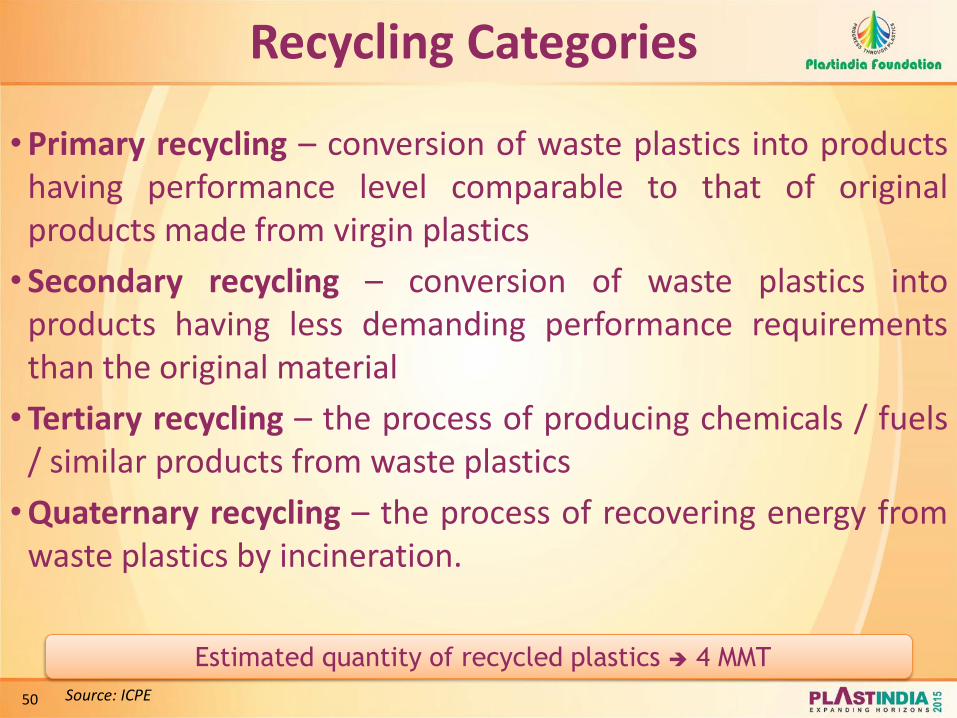
• Primary recycling – conversion of waste plastics into products having performance level comparable to that of original products made from virgin plastics
• Secondary recycling – conversion of waste plastics into products having less demanding performance requirements than the original material
• Tertiary recycling – the process of producing chemicals / fuels / similar products from waste plastics
• Quaternary recycling – the process of recovering energy from waste plastics by incineration.
Estimated quantity of recycled plastics 4 MMT
Recycling Categories
Source: ICPE

51
Machinery Manufacturing
Industry
52
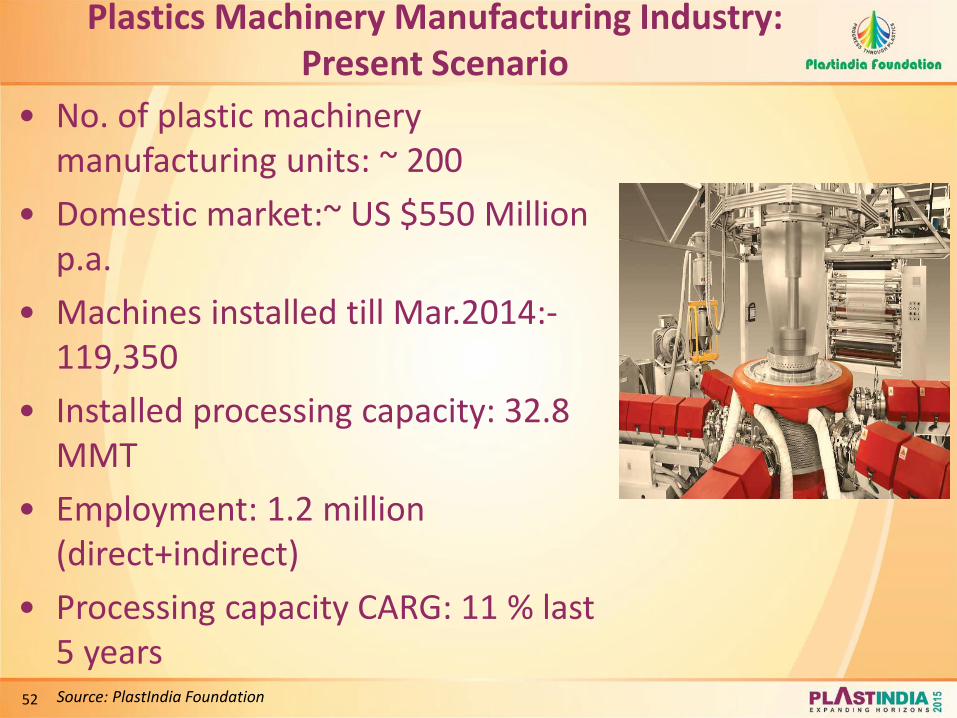
Plastics Machinery Manufacturing Industry: Present Scenario
• No. of plastic machinery manufacturing units: ~ 200
• Domestic market:~ US $550 Million p.a.
• Machines installed till Mar.2014:- 119,350
• Installed processing capacity: 32.8 MMT
• Employment: 1.2 million (direct+indirect)
• Processing capacity CARG: 11 % last 5 years Source: PlastIndia Foundation
53 Source: PlastIndia Foundation (Excludes Mortality)
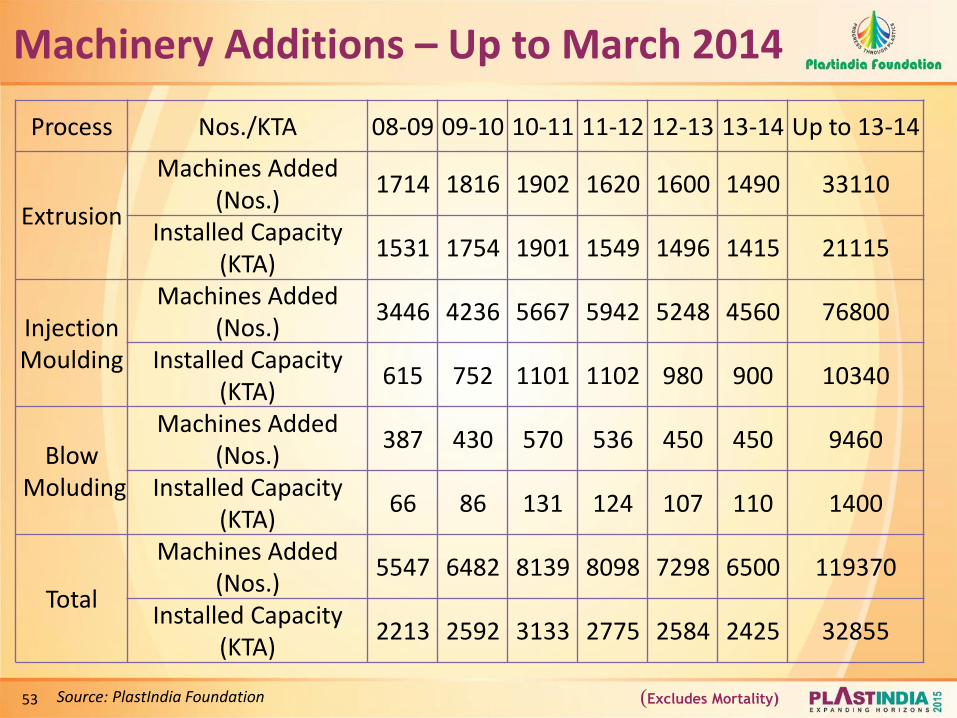
Machinery Additions – Up to March 2014
Process Nos./KTA 08-09 09-10 10-11 11-12 12-13 13-14 Up to 13-14
Extrusion
Machines Added (Nos.)
1714 1816 1902 1620 1600 1490 33110
Installed Capacity (KTA)
1531 1754 1901 1549 1496 1415 21115
Injection Moulding
Machines Added (Nos.)
3446 4236 5667 5942 5248 4560 76800
Installed Capacity (KTA)
615 752 1101 1102 980 900 10340
Blow Moluding
Machines Added (Nos.)
387 430 570 536 450 450 9460
Installed Capacity (KTA)
66 86 131 124 107 110 1400
Total
Machines Added (Nos.)
5547 6482 8139 8098 7298 6500 119370
Installed Capacity (KTA)
2213 2592 3133 2775 2584 2425 32855
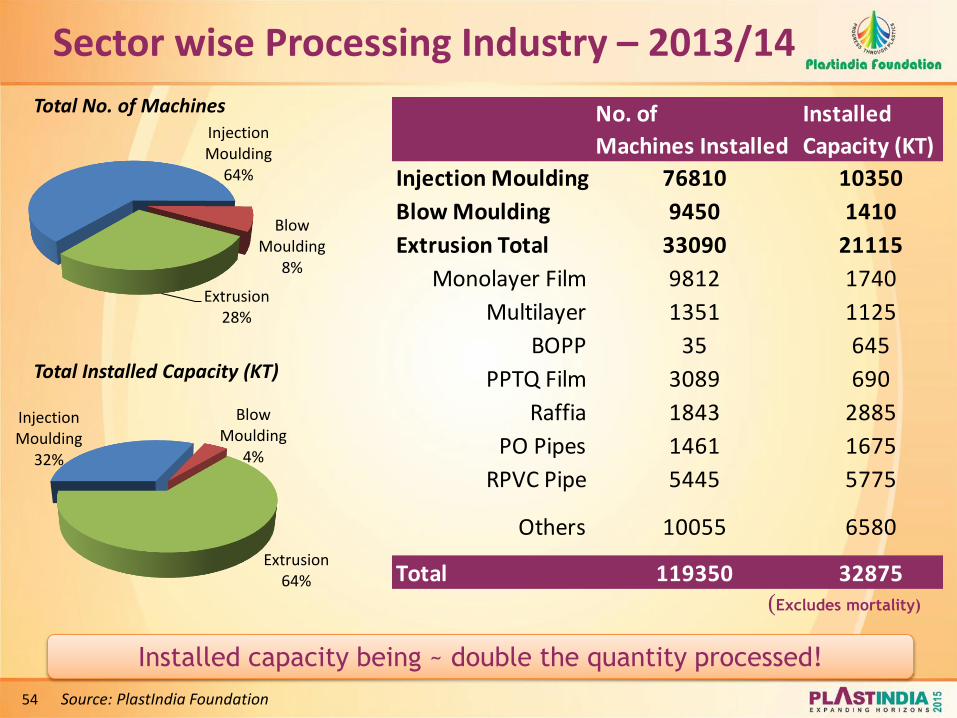
54
No. of
Machines Installed
Installed
Capacity (KT)
Injection Moulding 76810 10350
Blow Moulding 9450 1410
Extrusion Total 33090 21115
Monolayer Film 9812 1740
Multilayer 1351 1125
BOPP 35 645
PPTQ Film 3089 690
Raffia 1843 2885
PO Pipes 1461 1675
RPVC Pipe 5445 5775
Others 10055 6580
Total 119350 32875
Installed capacity being ~ double the quantity processed!
Source: PlastIndia Foundation
Injection Moulding
64%
Blow Moulding
8%
Extrusion 28%
Injection Moulding
32%
Blow Moulding
4%
Extrusion 64%
Total No. of Machines
Total Installed Capacity (KT)
(Excludes mortality)
Sector wise Processing Industry – 2013/14

55
No of Machines
Description 2006-07 2007-08 2008-09 2009-10 2010-11 2011-12 2012-13 2013-14
IMM 2,899 3,139 3,446 4,236 5,667 5,942 5,248 4,560
Extrusion 1,273 1,645 1,714 1,816 1,902 1,620 1,600 1,490
BMM 336 326 387 430 570 536 450 450
Total 4,508 5,110 5,547 6,482 8,139 8,098 7,298 6,500
Description 2016-17 2017-18 2022-23 2023-24 CAGR
IMM 6,450 7,250 13,000 14,500 12.3%
Extrusion 1,975 2,200 3,600 3,950 10.2%
BMM 600 660 1,140 1,250 10.8%
Total 9,025 10,110 17,740 19,700 11.7%
Projection for 2017-18 : 11.7% IMM: 12.3 %, Extrusion: 10.2%, BMM: 10.8%
Source: PlastIndia Foundation
Plastics Machinery Demand & Growth Projections

56
Tonnage
Range
Sales
03-04
Sales
07-08
Sales
12-13
Sales
13-14
Sales
16-17
Nos. Nos. Nos. Nos. Nos.
Up to 110T 1,156 1,566 2,196 1,908 2,550
125-200T 405 898 1,790 1,560 2,200
220-275T 75 205 390 340 500
350-450T 96 275 515 445 700
500-910T 69 167 305 265 450
> 910T 10 28 50 42 50
Total 1,811 3,139 5,248 4,560 6,450
Projection for 2017-18 : 12.3 % CAGR Source: PlastIndia Foundation
Injection Moulding Machinery Capacity Addition
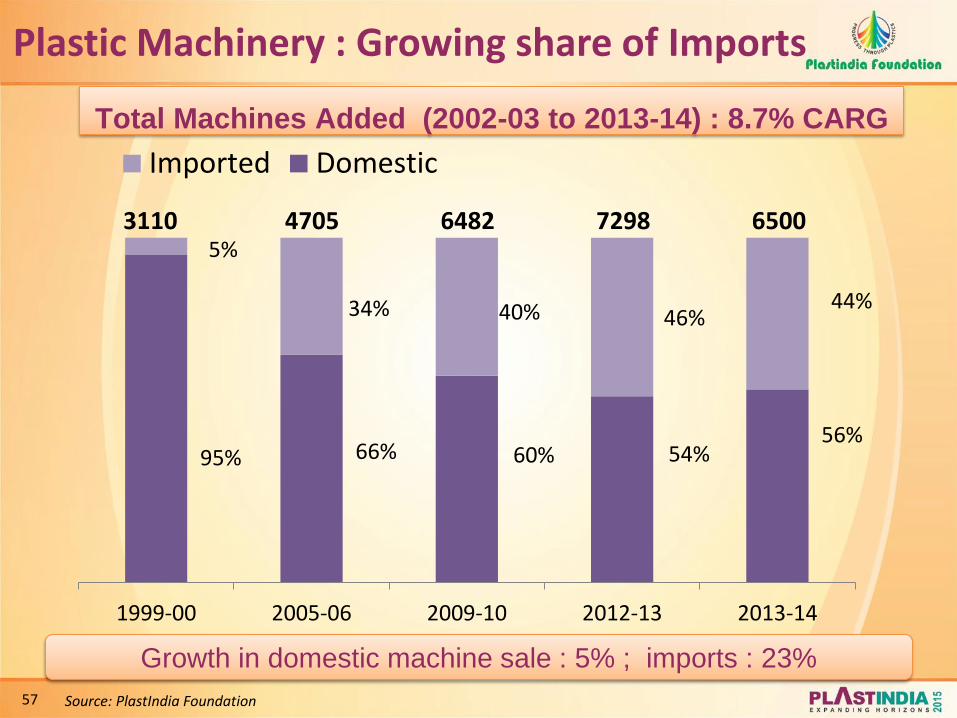
57
Growth in domestic machine sale : 5% ; imports : 23%
Total Machines Added (2002-03 to 2013-14) : 8.7% CARG
Source: PlastIndia Foundation
Plastic Machinery : Growing share of Imports
95% 66% 60% 54% 56%
5%
34% 40% 46% 44%
1999-00 2005-06 2009-10 2012-13 2013-14
Imported Domestic
3110 4705 6482 7298 6500
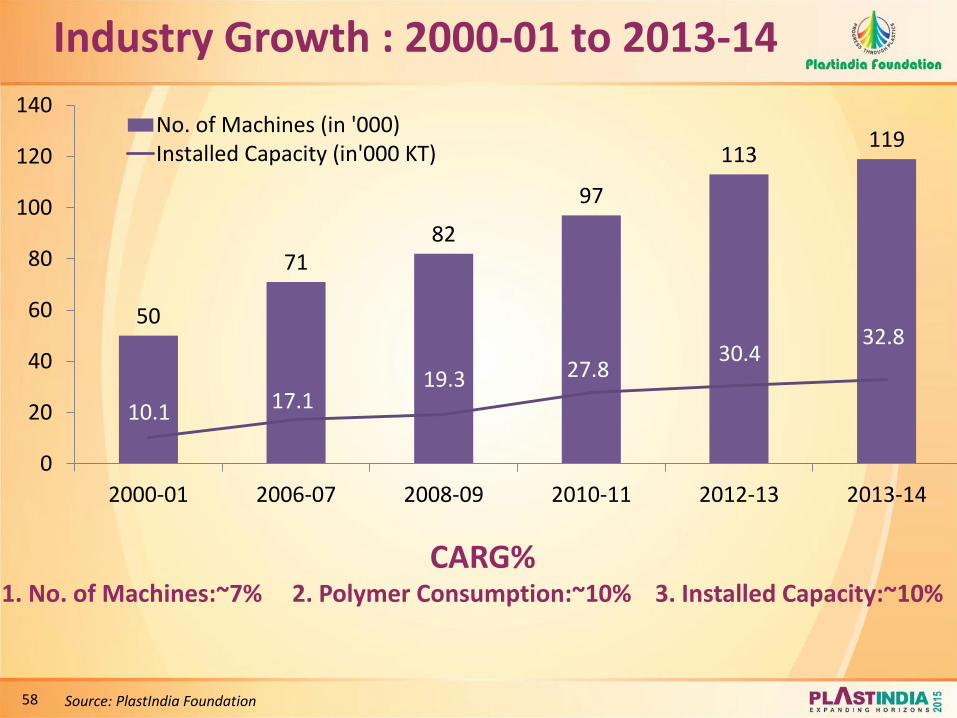
58
Industry Growth : 2000-01 to 2013-14
CARG% 1. No. of Machines:~7% 2. Polymer Consumption:~10% 3. Installed Capacity:~10%
50
71 82
97
113 119
10.1 17.1 19.3 27.8
30.4 32.8
0
20
40
60
80
100
120
140
2000-01 2006-07 2008-09 2010-11 2012-13 2013-14
No. of Machines (in '000)Installed Capacity (in'000 KT)
Source: PlastIndia Foundation

59
• Compounding Lines
• Tape Lines & looms
• Multilayer Film plants
• Lamination Plants
• Pipe extrusion lines
• Injection Moulding Machines
• Rotomoulding Machines
• Blow moulding Machines
• Thermoforming Machines
• Thermosetting Presses
• Compression Presses
• Auxiliary equipment
Indian technology competes Globally
Source: Plastindia Foundation

60
…Project investment to the tune of US $ 12 Billion
IM, Pipe, Raffia, Films are growth drivers
0 2000 4000 6000 8000
Misc
Roto
Sheet Line
F&F And Nonwoven
Compounding & MB
HDPE Pipe
Blow Moulding
BOPP & CPP Film
Multilayer Film
Monolayer Film
RPVC Pipe & Profiles
Raffia Tape Line
Injection Moulding
2897
324
370
220
338
592
1019
465
875
1820
2834
2094
6656
982
87
135
160
182
218
364
447
473
655
1091
1527
5455
Investment (Mn US $)
Ins Cap (KT)
Injection Moulding 42,000
Blow Moulding 13,000
Extrusion 4,000
TOTAL 59,000
Est. No. of Additional
Machines Required by 2019-
2020
Source: PlastIndia Foundation
Opportunities by 2020…….

61
Auxiliary Equipment

62
Auxiliary equipment share – 10-15% of machinery business
Source: PlastIndia Foundation
Auxiliary Equipment Industry 13-14
0.0
5.0
10.0
15.0
20.0
25.0
30.0
20
12
-13
20
13
-14
20
14
-15
20
15
-16
20
16
-17
20
17
-18
12.70 15.5
17.5 20.5
24.0 26.0
Auxilliary Equipments (in US$ - Mn)
Auxiliary Equipments in Plastics Industry
Product Units
Chilling plant 5000
Mould temp. Controller 1200
Drying System
- Hot Air Dryer 4000
- Dehumidified Air Dryer 800
Raw Material Conveying System
- Hopper Loader 8000
- Central Conveying System 75
Volumetric/Gravimetric Blending
System 700
Conveyor Belt with Coumting
System 500
Granulator 3800
Robot 150
Hot Runners 900
63
Polymer Growth Opportunities

64
Demand Growth Drivers – Packaging
Retail revolution setting pace for growth in packaging
Growth Drivers Food / Processed food
FMCG items
Packaged and fast food industry
Single serve packs/Power packs
Shopping bags/Bags on rolls
Textiles and Toys Applications Multilayer films
BOPP Films
Shrink & Stretch wraps
Thin wall molding
Thermoforming
Blow molded containers
Source: Plastindia Foundation
65
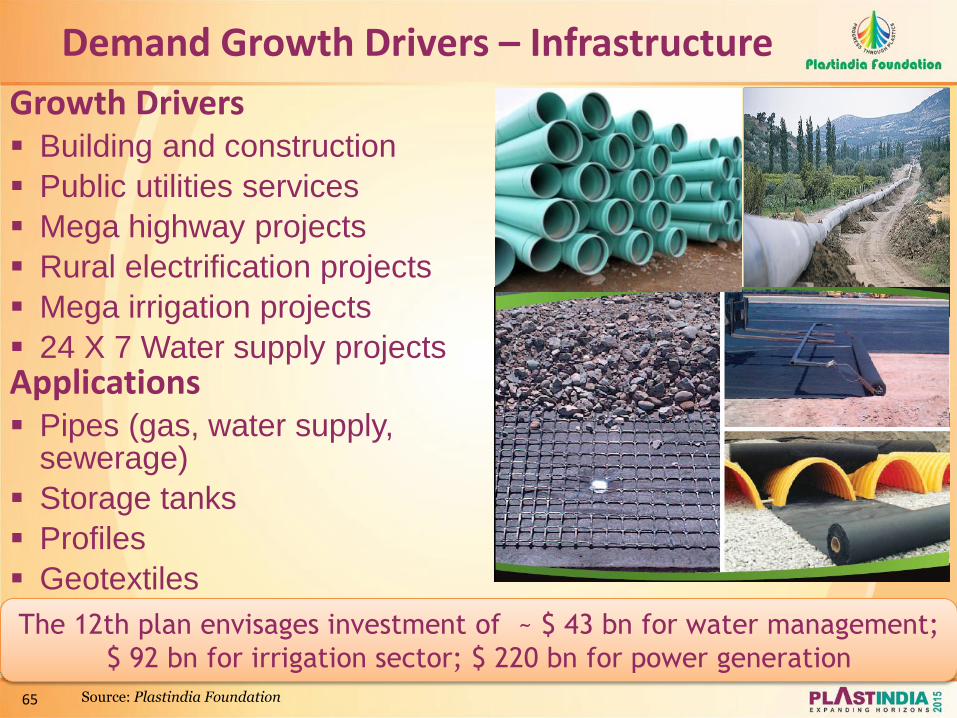
Demand Growth Drivers – Infrastructure
The 12th plan envisages investment of ~ $ 43 bn for water management;
$ 92 bn for irrigation sector; $ 220 bn for power generation
Growth Drivers Building and construction
Public utilities services
Mega highway projects
Rural electrification projects
Mega irrigation projects
24 X 7 Water supply projects Applications Pipes (gas, water supply,
sewerage)
Storage tanks
Profiles
Geotextiles
Source: Plastindia Foundation
66
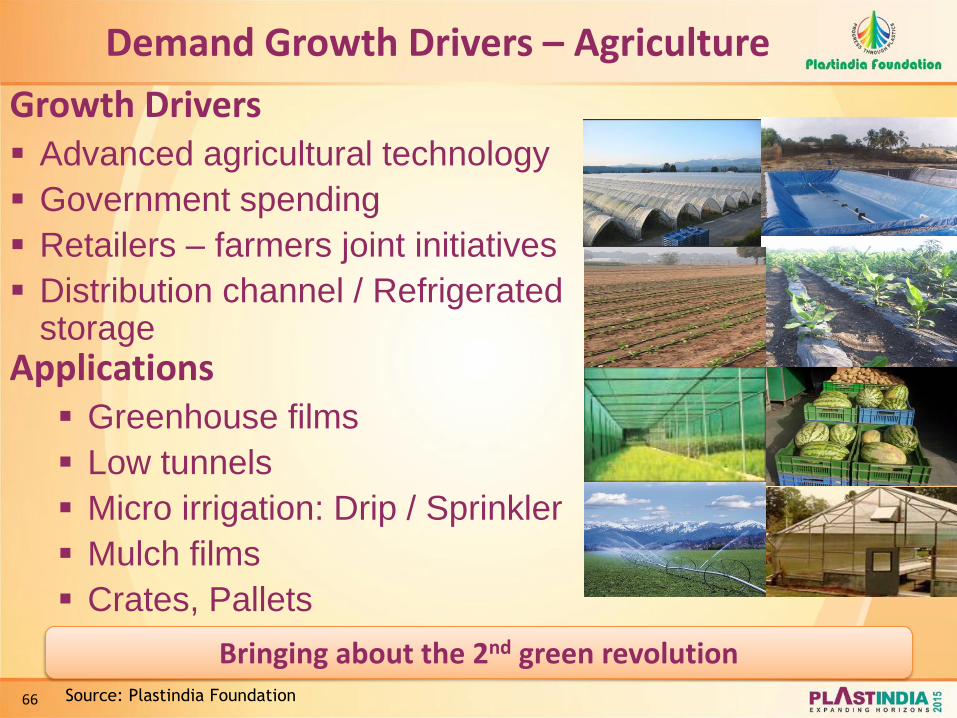
Demand Growth Drivers – Agriculture
Bringing about the 2nd green revolution
Growth Drivers Advanced agricultural technology
Government spending
Retailers – farmers joint initiatives
Distribution channel / Refrigerated storage
Applications Greenhouse films
Low tunnels
Micro irrigation: Drip / Sprinkler
Mulch films
Crates, Pallets
Source: Plastindia Foundation
67
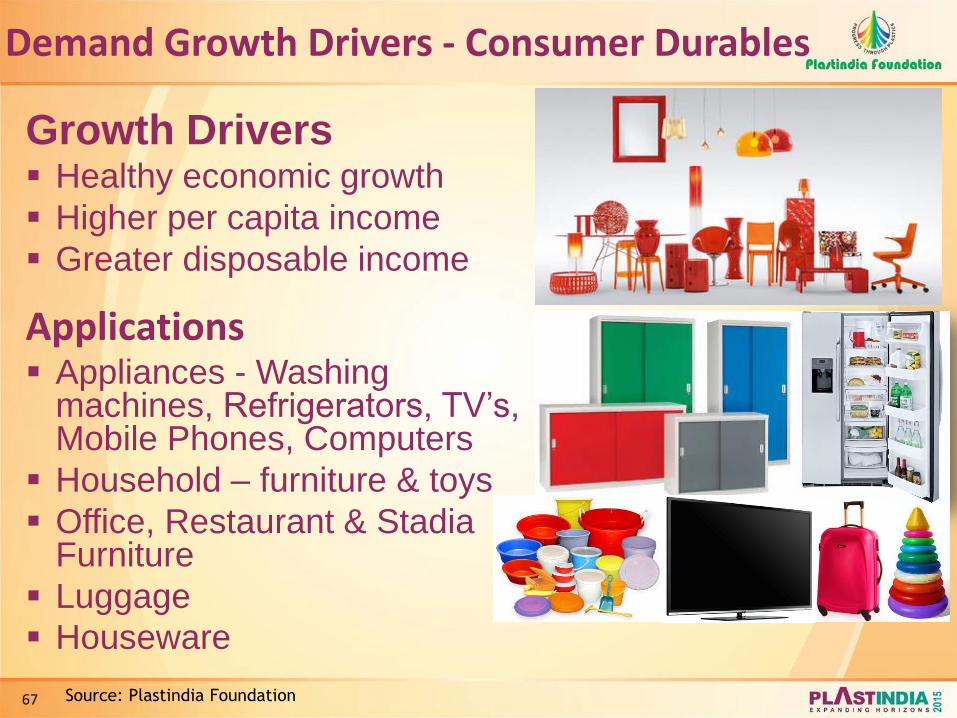
Demand Growth Drivers - Consumer Durables
Growth Drivers Healthy economic growth
Higher per capita income
Greater disposable income
Applications Appliances - Washing
machines, Refrigerators, TV’s, Mobile Phones, Computers
Household – furniture & toys
Office, Restaurant & Stadia Furniture
Luggage
Houseware
Source: Plastindia Foundation

68
Demand Growth Drivers – Healthcare
Growth Drivers India as a medical tourism destination
Growing health awareness
Applications Heart valves, hearing aids, spectacles,
prosthetics, etc.
Packaging of medicines, devices etc.
Disposable products : Syringes, IV
sets, blood bags, diapers, bed covers,
pillow covers, gowns, masks, gloves etc.
Source: Plastindia Foundation

69
Other Growth Areas
•Rigid Packaging
•Automotive
•Industrial Components
Source: Plastindia Foundation

70
Plastic Parks -Existing & Proposed
Dahej
Sanand
Narasapura
Auriaya
Tamot Siju
Barjora
Ibrahimpatnam
North Chennai
Kannur
Tinsukia Panipat
Plastic Parks Area (Acres)
Sanand, Gujarat 140
Dahej, Gujarat 100
Narasapura, Karnataka 100
Auraiya, Uttar Pradesh 225
Tamot, Madhya Pradesh 150
Siju village, Odisha 120
Barjora, West Bengal 496
Ibrahimpatnam, Andhra Pradesh
500
Kannur, Kerala Not Known
Tinsukia, Assam 600.785
North Chennai, Tamil Nadu 300
Panipat, Harayana Not Known
Source: Plastindia Foundation

71
Conclusions
72
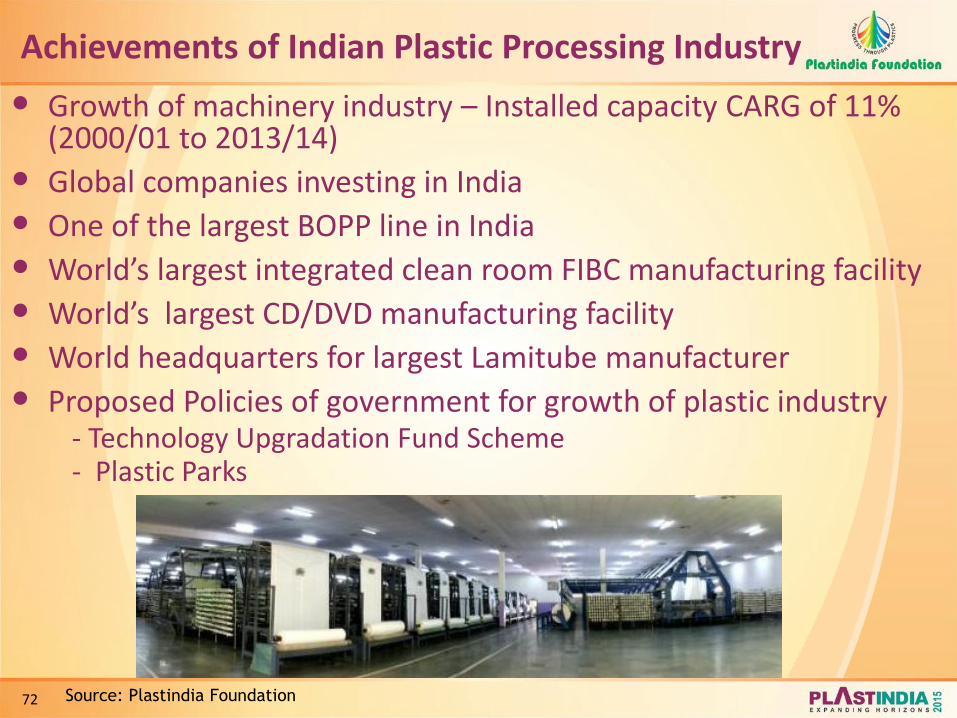
• Growth of machinery industry – Installed capacity CARG of 11% (2000/01 to 2013/14)
• Global companies investing in India
• One of the largest BOPP line in India
• World’s largest integrated clean room FIBC manufacturing facility
• World’s largest CD/DVD manufacturing facility
• World headquarters for largest Lamitube manufacturer
• Proposed Policies of government for growth of plastic industry - Technology Upgradation Fund Scheme - Plastic Parks
Achievements of Indian Plastic Processing Industry
Source: Plastindia Foundation
73
India ……..Happening
Together We Prosper!
• Established democracy & stable democratic government with favorable economic policies.
• Young population; median age of 24 years
• Setting up of SEZs to overcome bottlenecks of infrastructure and create business friendly policies
• Large pool of scientific and technically trained manpower
• India, the largest market in South Asia
• Rising income levels and changing lifestyles driving demand for plastics
Source: Plastindia Foundation

74
• Indian economic fundamentals are robust despite current gloom and continuing uncertainty in global economy
• Huge growth opportunities in India for plastics due to lower per capita consumption as compared to world average
• Flexible packaging industry poised for strong growth, insulated from the current economic scenario due to huge & diversified consumer base
• New applications /innovations in Packaging development are driving growth in India and these are ably supported by the current and upcoming domestic capacities
Summary
Source: Plastindia Foundation

75
401, Landmark 'B', Suren Road, Off Andheri Kurla Road, Andheri (E), Mumbai - 400093, India.
Tel.: +91 22 2683 2911 – 14 • Fax: +91 22 2684 5861 E-mail: [email protected] • Website: www.plastindia.org

76
This presentation contains forward-looking statements which may be identified by their use of
words like “plans,” “expects,” “will,” “anticipates,” “believes,” “intends,” “projects,” “estimates” or
other words of similar meaning. Forward-looking statements are based on certain assumptions
and expectations of future events. The Committee referred to in this presentation cannot
guarantee that these assumptions and expectations are accurate or will be realized.
The actual results, performance or achievements, could thus differ materially from those
projected in any such forward-looking statements. These companies assume no responsibility to
publicly amend, modify or revise any forward looking statements, on the basis of any subsequent
developments, information or events, or otherwise.
The information contained was obtained from various sources believed to be reliable and we do
not guarantee its accuracy. Neither Plastindia Foundation or any of the members of the
Committee accepts any liability whatsoever for any direct or consequential damages or losses
arising from any use of this presentation or its contents.
Disclaimer

77
Thank You


