15
Mrs.Shefa El Sagga Mrs.Shefa El Sagga F&BMP F&BMP 1 1 10/2/2010 10/2/2010
| Date post: | 29-Dec-2015 |
| Category: |
Documents |
| Upload: | marshall-gregory-pitts |
| View: | 217 times |
| Download: | 2 times |

Mrs.Shefa El Sagga F&BMPMrs.Shefa El Sagga F&BMP 1110/2/201010/2/2010
3.2.2 Interaction among risks3.2.2 Interaction among risksAll of the various risks discussed above are interdependent,
common to all businesses including banks. These other risks are often more discrete or event-type,
affecting a bank’s profitability and risk exposure.
Risks include sudden, unexpected changes in taxation, regulatory policy or in financial market conditions due to war, revolution or market collapse, and macroeconomic risks such as increased inflation, inflation volatility and unemployment.
Regulators have identified three key risks related to banks: 1. credit, 2. market and 3. operating risk.
Mrs.Shefa El Sagga F&BMPMrs.Shefa El Sagga F&BMP 2210/2/201010/2/2010
3.33.3 . .Approaches to the Management of Approaches to the Management of Financial RisksFinancial RisksThough risk management was always central to the
profitability of banks, its focus has changed over time. In the 1960s, the emphasis was on the efficient employment of funds for liabilities management.
In the 1970s, the focus shifted to the management of interest rate risk and liquidity risk, with a bank’s credit risk usually managed by a separate department or division.
Asset–liability management (ALM) is the proactive management of both sides of the balance sheet, with a special emphasis on the management of interest rate and liquidity risks.
Mrs.Shefa El Sagga F&BMPMrs.Shefa El Sagga F&BMP 3310/2/201010/2/2010
Continue: In the 1980s, risk management expanded to include the bank’s off-
balance sheet operations, and the risks inherent therein. In the new century, managers are answerable not only to
shareholders but to national and international regulators. In particular, it should be emphasized that while traditional risk
management focused on a bank’s banking book, modern risk management has been extended to include the trading book, which consists mainly of off-balance sheet financial instruments.
3.3.1. Interest Rate Risk and Asset–Liability Management3.3.2. Gap Analysis3.3.3. Duration Analysis3.3.4. Duration Gap Analysis3.3.5. Liquidity Risk and Asset–Liability Management
Mrs.Shefa El Sagga F&BMPMrs.Shefa El Sagga F&BMP 4410/2/201010/2/2010

3.3.1. Interest Rate Risk and Asset–Liability 3.3.1. Interest Rate Risk and Asset–Liability ManagementManagementThe ALM group may measure their performance in terms of net interest income (loan income less cost of deposit), the market value of equity (the market price of bank stock) or the economic equity ratio (new equity value/new loan value) for an unexpected change in interest rates. The three measures will be very closely linked.1.If bank’s loans and deposits is roughly equal, which makes the case for matching the maturity of the deposit with the loan.2.If the objective is to minimize interest rate risk. 3.Focus on the sensitivity of the profit and loss account in the short term to a change in interest rates.
Mrs.Shefa El Sagga F&BMPMrs.Shefa El Sagga F&BMP 5510/2/201010/2/2010
Continue:Continue:Over the longer term, the effect on net economic value will be considered, where net economic value is defined as the difference between the change in the present value of the bank’s assets and the present value of its liabilities, plus the net change in the present value of its off-balance sheet positions, for a given change in market interest rates.
في = الفرق االقتصادية القيمة صافيالحالية) - القيمة البنك ألصول الحالية القيمة في التغيير
. الحاضر( + الوقت في التغير صافي اللتزاماته
Mrs.Shefa El Sagga F&BMPMrs.Shefa El Sagga F&BMP 6610/2/201010/2/2010

Risk Analysis and Bank Financial Statements FDFinancial Diplomats
Risk information not directly reflected in AFSRisk information not directly reflected in AFS
Risk in the context of a Bank Balance Sheet Assets
Liabilities
Credit risk +Interest Rate in the banking book +Liquidity
Market risk + Banking book hedges
Investment risk + Liquidity risk + Market risk
Liquidity risk
Liquidity & Funding risk + Interest rate in the banking book
Market risk + Banking book hedgesMarket risk
Jun-09
Deposits 489,129
Derivative Financial Instruments 54,436
Short Trading Positions 23,434
Long Term Liabilities 10,887
Capital related 49,429
Other Liabilities 19,518
Total Liabilities 646,833
Capital riskFunding risk
High level allocation to key risk typesJun-09
Cash and Short Term Funds 25,756
Derivative Financial Instruments 60,229
Net Advances 420,224
Investment Securities and Other 113,083
Property and Equipment 9,488
Other Assets 18,052
Total Assets 646,833
Note: figures are provisional

3.3.2. Gap Analysis3.3.2. Gap Analysis
Gap analysis is the ALM technique, normally used to manage interest rate risk, though it can also be used in liquidity risk management.
The ‘‘gap’’ is the difference between interest sensitive assets and liabilities for a given time interval, say six months. If total earning
assets must equal total funding sources, the incremental gaps must always total zero and therefore, the last cumulative gap must be zero.
1. The ‘‘gap’’ (see Table 3.3) is the sterling amount by which rate sensitive assets (RSA) > rate sensitive liabilities (RSL). A negative gap means RSA < RSL; A positive gap means RSA > RSL.
2. The gap ratio is defined as RSA/RSL. If the gap ratio is one, then the rate sensitivity of assets and liabilities is matched, and the sterling gap is zero.
Mrs.Shefa El Sagga F&BMPMrs.Shefa El Sagga F&BMP 8810/2/201010/2/2010

Continue: Most banks have a positive gap, that is, rate sensitive assets exceed rate sensitive liabilities, because most banks borrow long and lend short, so their assets will mature later than their liabilities. Suppose a bank has a positive gap (RSA > RSL). Then a rise in interest rates will cause a bank to have asset returns rising faster than the cost of liabilities, but if interest rates fall, liability costs will rise faster than asset returns.Defining E as the equity value or net worth of the bank, then
E = A − L▲E = A – L ▲ ▲ where:▲E: change in the net worth of the bank▲A: change in the value of assets▲L: change in the value of liabilities
Mrs.Shefa El Sagga F&BMPMrs.Shefa El Sagga F&BMP 9910/2/201010/2/2010

3.3.3. Duration Analysis3.3.3. Duration AnalysisDuration analysis expands on the gap analysis by taking duration into account. Again, the objective is to consider the impact on shareholders’ equity if a risk-free rate, for all maturities, rises or falls. Duration analysis allows for the possibility that the average life (duration) of an asset or liability differs from their respective maturities. Suppose the maturity of a loan is six months and the bank to match this asset with a six-month CD.Duration is the present value weighted average to reprising, and was originally applied to bonds with coupons, correcting for the impurity of a bond. The duration is expressed as follows:
Mrs. Shefa El Sagga F&BMPMrs. Shefa El Sagga F&BMP 101010/2/201010/2/2010
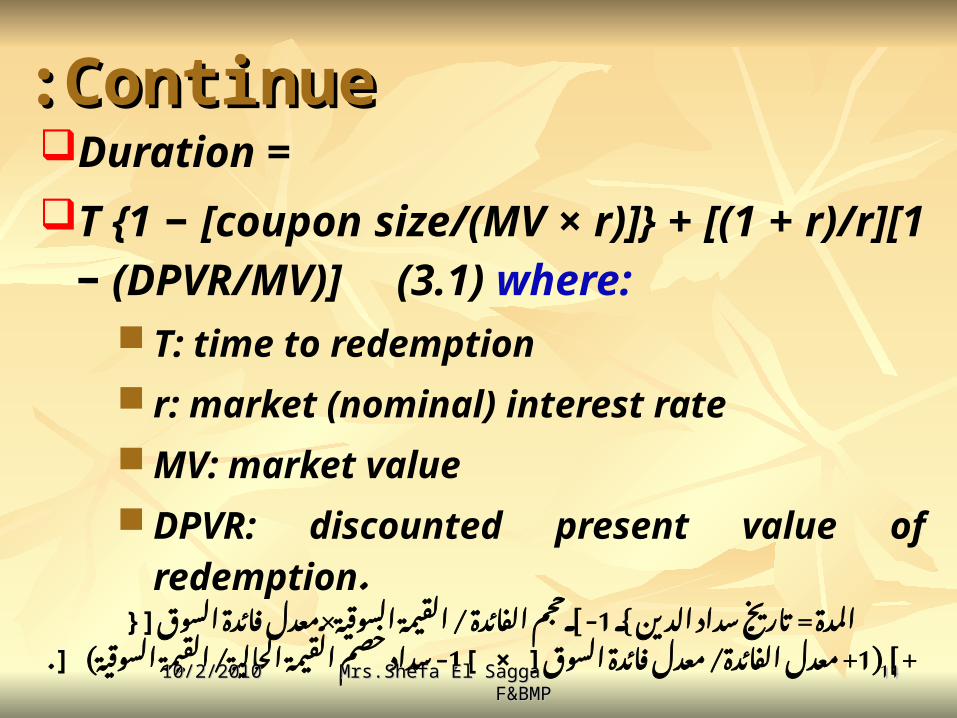
ContinueContinue::Duration = T {1 − [coupon size/(MV × r)]} + [(1 + r)/r][1 −
(DPVR/MV)] (3.1) where: T: time to redemption r: market (nominal) interest rate MV: market value DPVR: discounted present value of redemption.
الدين المدة = سداد السوقية / [- 1 {تاريخ القيمة الفائدة معدل ×حجمالسوق ]} فائدة
+](1 / السوق+ فائدة معدل الفائدة القيمة- 1] × [معدل خصم سداد) السوقية/ القيمة . ]الحالية Mrs.Shefa El Sagga F&BMPMrs.Shefa El Sagga F&BMP 111110/2/201010/2/2010
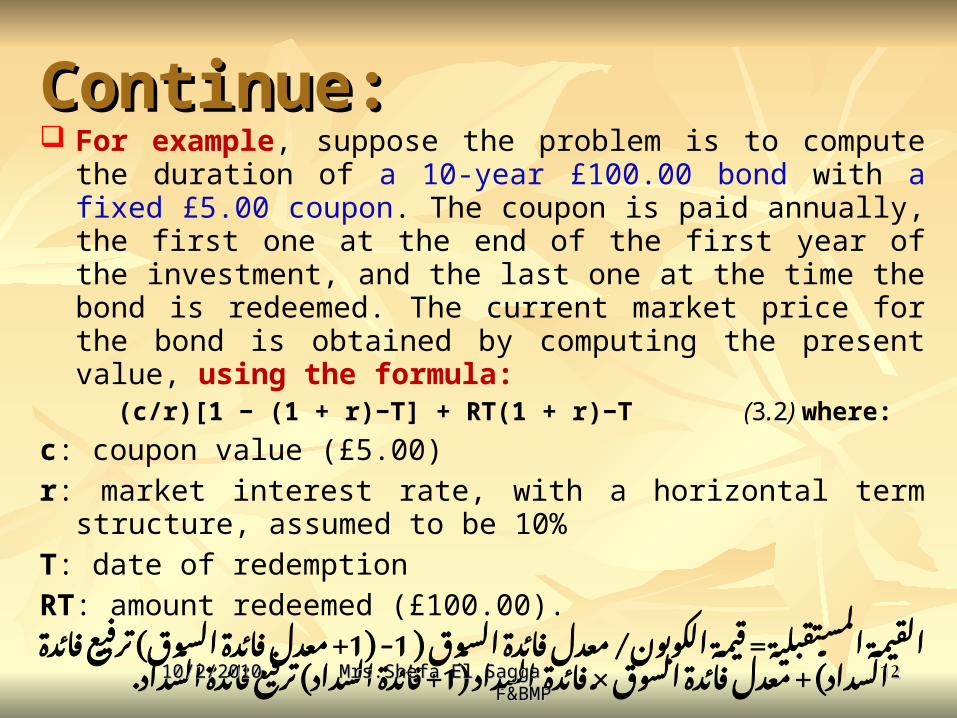
Continue:Continue: For example, suppose the problem is to compute the duration of a 10-
year £100.00 bond with a fixed £5.00 coupon. The coupon is paid annually, the first one at the end of the first year of the investment, and the last one at the time the bond is redeemed. The current market price for the bond is obtained by computing the present value, using the formula:
(c/r)[1 − (1 + r)−T] + RT(1 + r)−T (3.2) where:
c: coupon value (£5.00)
r: market interest rate, with a horizontal term structure, assumed to be 10%
T: date of redemption
RT: amount redeemed (£100.00).
) / = السوق فائدة معدل الكوبون قيمة المستقبلية (1القيمة -1 + + ( ( السوق فائدة معدل السداد فائدة ترفيع السوق فائدة معدل
السداد (× .1فائدة ( السداد+ فائدة ترفيع السداد فائدة
Mrs.Shefa El Sagga F&BMPMrs.Shefa El Sagga F&BMP 121210/2/201010/2/2010

Continue:Continue:In the example, In the example, the current market price of the bond is:the current market price of the bond is:
£100(1.1) −10 + £50[1 − (1.1) −10] = £50[1 + (1.1) −10] £100(1.1) −10 + £50[1 − (1.1) −10] = £50[1 + (1.1) −10]
= £69.277.= £69.277.
There is a cash flow associated with the bond, and the idea There is a cash flow associated with the bond, and the idea is to discount each cash flow to the present value. To is to discount each cash flow to the present value. To compute the duration, the formula from equation (3.1) is compute the duration, the formula from equation (3.1) is used:used:
Duration = 10[1 − (£5/£6.9277)] + (1.1/0.1){1 − [£100(1.1) Duration = 10[1 − (£5/£6.9277)] + (1.1/0.1){1 − [£100(1.1) −10/£69.277]} = 7.661 years.−10/£69.277]} = 7.661 years.Duration analysis has been widened to include other Duration analysis has been widened to include other assets and liabilities on a bank’s.assets and liabilities on a bank’s.
Mrs.Shefa El Sagga F&BMPMrs.Shefa El Sagga F&BMP 131310/2/201010/2/2010
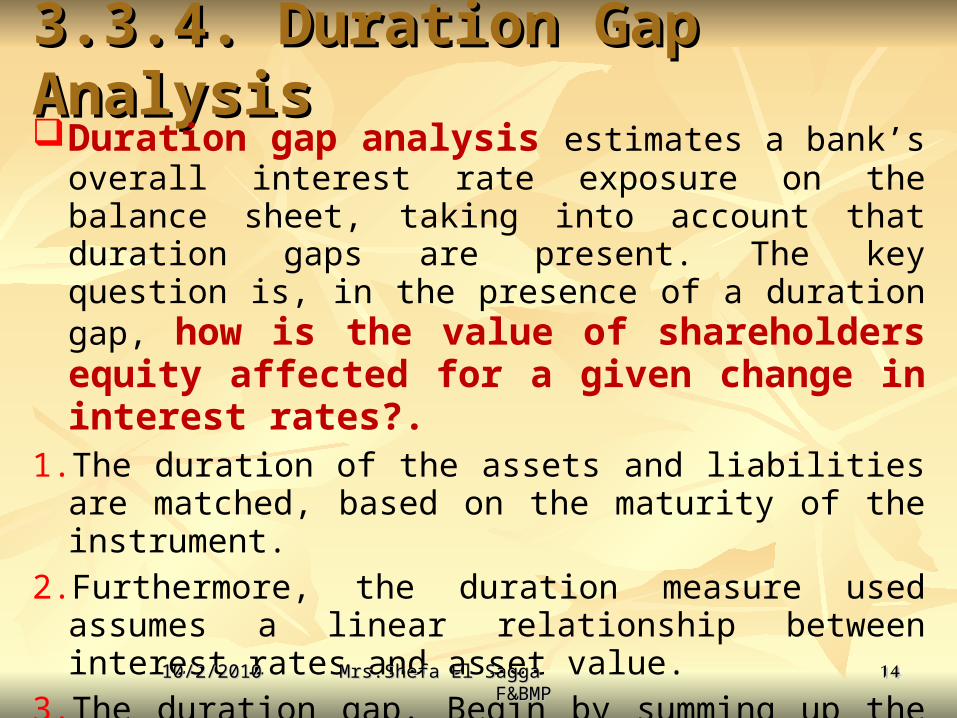
3.3.4. Duration Gap Analysis3.3.4. Duration Gap AnalysisDuration gap analysis estimates a bank’s overall interest
rate exposure on the balance sheet, taking into account that duration gaps are present. The key question is, in the presence of a duration gap, how is the value of shareholders equity affected for a given change in interest rates?.
1. The duration of the assets and liabilities are matched, based on the maturity of the instrument.
2. Furthermore, the duration measure used assumes a linear relationship between interest rates and asset value.
3. The duration gap. Begin by summing up the bank’s duration of, respectively, its assets and liabilities portfolio.
Mrs.Shefa El Sagga F&BMPMrs.Shefa El Sagga F&BMP 141410/2/201010/2/2010
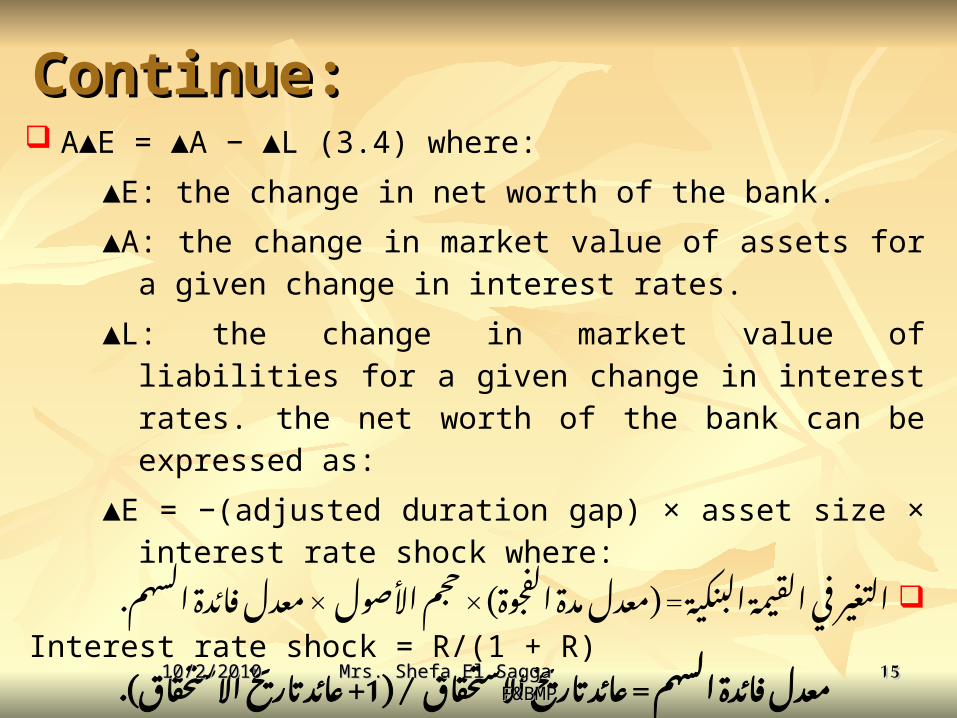
Continue:Continue: A▲E = ▲A − ▲L (3.4) where:
▲E: the change in net worth of the bank.
▲A: the change in market value of assets for a given change in interest rates.
▲L: the change in market value of liabilities for a given change in interest rates. the net worth of the bank can be expressed as:
▲E = −(adjusted duration gap) × asset size × interest rate shock where:
× × ( معدل = ( األصول حجم الفجوة مدة معدل البنكية القيمة في التغير. السهم فائدة
Interest rate shock = R/(1 + R)االستحقاق = / ) تاريخ عائد السهم فائدة تاريخ+ 1معدل عائد
Mrs. Shefa El Sagga F&BMPMrs. Shefa El Sagga F&BMPاالستحقاق(. 151510/2/201010/2/2010


