+ All Categories
Home > Documents > MS School District corporal punishment change 09 - Southern Echo

MS School District corporal punishment change 09 - Southern Echo

Date post: 11-Feb-2022
Category:
Upload: others
View: 4 times
Download: 0 times
Share this document with a friend
1
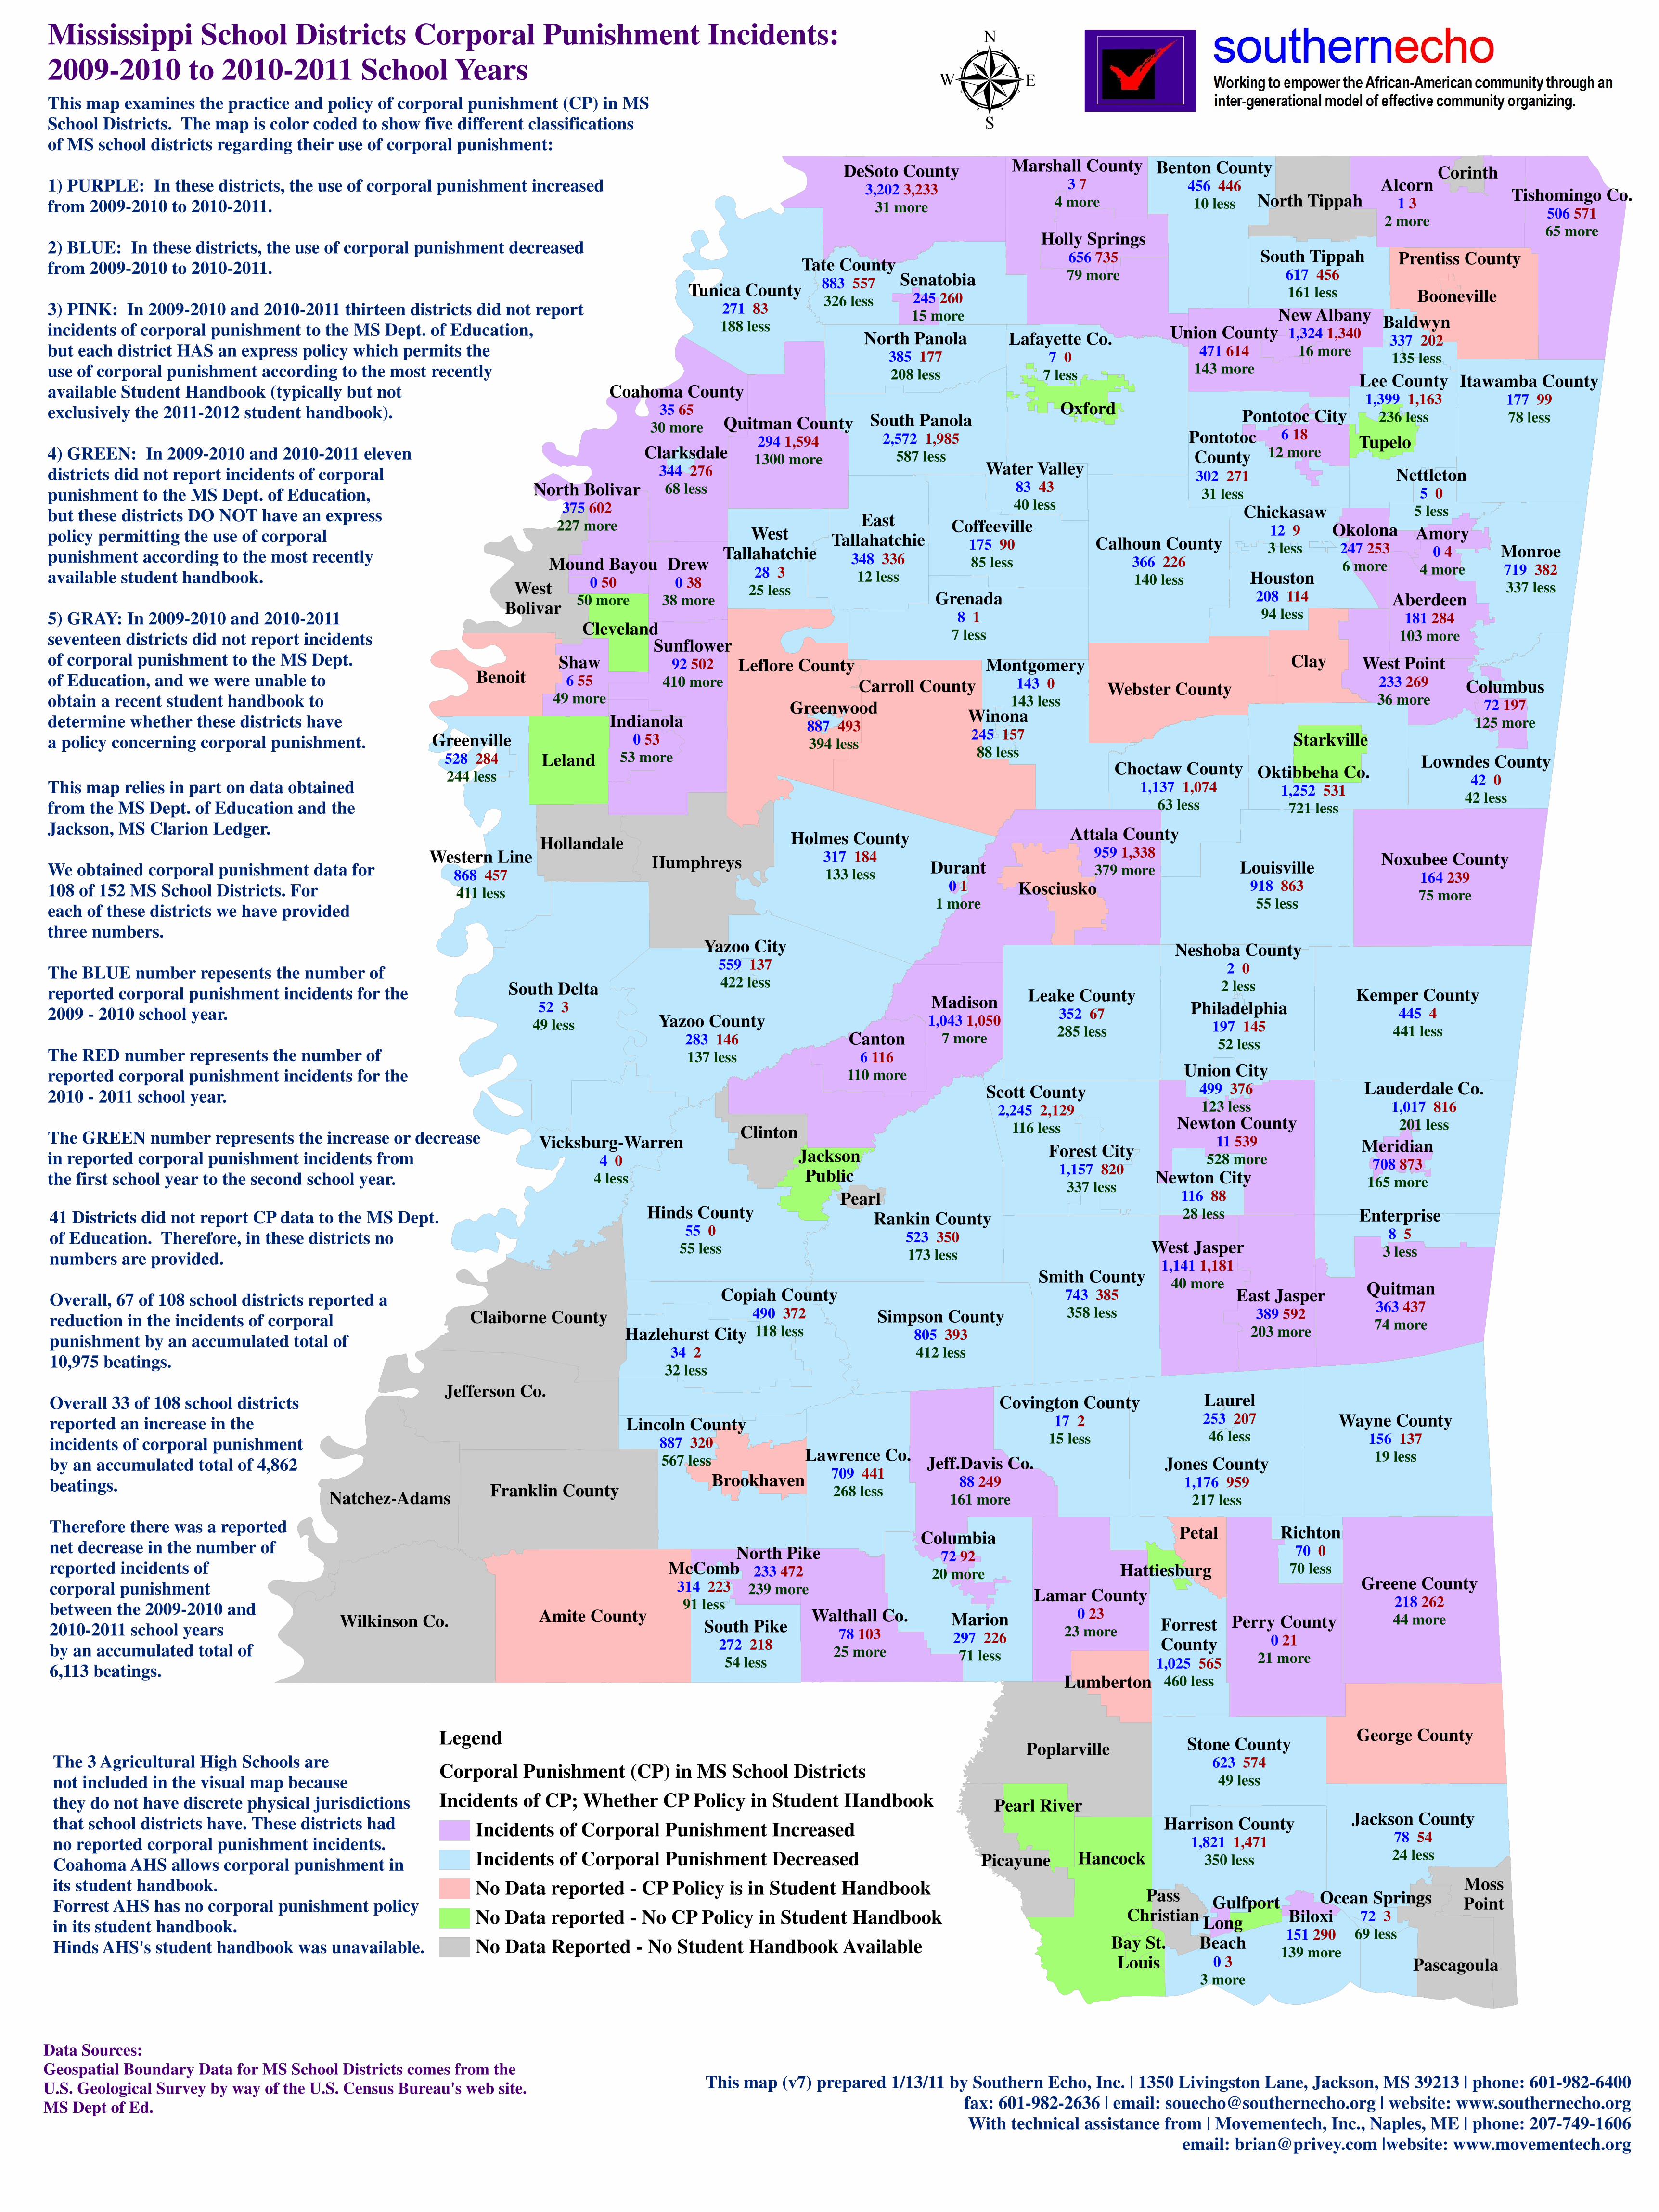
Amite County Wilkinson Co. Poplarville Carroll County Leflore County Jefferson Co. Benoit Franklin County George County Natchez-Adams Claiborne County Leland Webster County Prentiss County Petal Hollandale Clinton North Tippah Tupelo Hancock Humphreys Picayune Pascagoula West Bolivar Kosciusko Moss Point Clay Brookhaven Oxford Pearl River Starkville Cleveland Lumberton Jackson Public Pass Christian Pearl Corinth Gulfport Bay St. Louis Hattiesburg Booneville Madison 1,043 1,050 7 more Quitman 363 437 74 more Alcorn 1 3 2 more Greene County 218 262 44 more Noxubee County 164 239 75 more Perry County 0 21 21 more DeSoto County 3,202 3,233 31 more Walthall Co. 78 103 25 more Lamar County 0 23 23 more Drew 0 38 38 more Aberdeen 181 284 103 more Attala County 959 1,338 379 more Coahoma County 35 65 30 more Marshall County 3 7 4 more Jeff.Davis Co. 88 249 161 more Tishomingo Co. 506 571 65 more West Jasper 1,141 1,181 40 more East Jasper 389 592 203 more Newton County 11 539 528 more Union County 471 614 143 more Canton 6 116 110 more Quitman County 294 1,594 1300 more Sunflower 92 502 410 more West Point 233 269 36 more Shaw 6 55 49 more Holly Springs 656 735 79 more Indianola 0 53 53 more North Bolivar 375 602 227 more Amory 0 4 4 more North Pike 233 472 239 more Pontotoc City 6 18 12 more Columbia 72 92 20 more Okolona 247 253 6 more New Albany 1,324 1,340 16 more Meridian 708 873 165 more Senatobia 245 260 15 more Biloxi 151 290 139 more Long Beach 0 3 3 more Columbus 72 197 125 more Durant 0 1 1 more Mound Bayou 0 50 50 more South Delta 52 3 49 less Yazoo County 283 146 137 less Louisville 918 863 55 less Wayne County 156 137 19 less Rankin County 523 350 173 less Grenada 8 1 7 less Jones County 1,176 959 217 less Holmes County 317 184 133 less Kemper County 445 4 441 less Hinds County 55 0 55 less Smith County 743 385 358 less Leake County 352 67 285 less Calhoun County 366 226 140 less Simpson County 805 393 412 less Coffeeville 175 90 85 less Stone County 623 574 49 less Jackson County 78 54 24 less South Panola 2,572 1,985 587 less Itawamba County 177 99 78 less Harrison County 1,821 1,471 350 less South Pike 272 218 54 less South Tippah 617 456 161 less Lafayette Co. 7 0 7 less Lauderdale Co. 1,017 816 201 less Scott County 2,245 2,129 116 less Tunica County 271 83 188 less Vicksburg-Warren 4 0 4 less Neshoba County 2 0 2 less Oktibbeha Co. 1,252 531 721 less Tate County 883 557 326 less Lawrence Co. 709 441 268 less Marion 297 226 71 less Copiah County 490 372 118 less Western Line 868 457 411 less Benton County 456 446 10 less Lincoln County 887 320 567 less Lee County 1,399 1,163 236 less Lowndes County 42 0 42 less Monroe 719 382 337 less Choctaw County 1,137 1,074 63 less Pontotoc County 302 271 31 less North Panola 385 177 208 less Montgomery 143 0 143 less Forrest County 1,025 565 460 less Covington County 17 2 15 less East Tallahatchie 348 336 12 less Hazlehurst City 34 2 32 less Enterprise 8 5 3 less Houston 208 114 94 less West Tallahatchie 28 3 25 less Richton 70 0 70 less Newton City 116 88 28 less Nettleton 5 0 5 less Water Valley 83 43 40 less Forest City 1,157 820 337 less Baldwyn 337 202 135 less McComb 314 223 91 less Greenville 528 284 244 less Laurel 253 207 46 less Yazoo City 559 137 422 less Greenwood 887 493 394 less Philadelphia 197 145 52 less Union City 499 376 123 less Chickasaw 12 9 3 less Winona 245 157 88 less Ocean Springs 72 3 69 less Clarksdale 344 276 68 less Mississippi School Districts Corporal Punishment Incidents: 2009-2010 to 2010-2011 School Years This map (v7) prepared 1/13/11 by Southern Echo, Inc. | 1350 Livingston Lane, Jackson, MS 39213 | phone: 601-982-6400 fax: 601-982-2636 | email: [email protected] | website: www.southernecho.org With technical assistance from | Movementech, Inc., Naples, ME | phone: 207-749-1606 email: [email protected] |website: www.movementech.org Legend Corporal Punishment (CP) in MS School Districts Incidents of CP; Whether CP Policy in Student Handbook Incidents of Corporal Punishment Increased Incidents of Corporal Punishment Decreased No Data reported - CP Policy is in Student Handbook No Data reported - No CP Policy in Student Handbook No Data Reported - No Student Handbook Available Data Sources: Geospatial Boundary Data for MS School Districts comes from the U.S. Geological Survey by way of the U.S. Census Bureau's web site. MS Dept of Ed. This map examines the practice and policy of corporal punishment (CP) in MS School Districts. The map is color coded to show five different classifications of MS school districts regarding their use of corporal punishment: 1) PURPLE: In these districts, the use of corporal punishment increased from 2009-2010 to 2010-2011. 2) BLUE: In these districts, the use of corporal punishment decreased from 2009-2010 to 2010-2011. 3) PINK: In 2009-2010 and 2010-2011 thirteen districts did not report incidents of corporal punishment to the MS Dept. of Education, but each district HAS an express policy which permits the use of corporal punishment according to the most recently available Student Handbook (typically but not exclusively the 2011-2012 student handbook). 4) GREEN: In 2009-2010 and 2010-2011 eleven districts did not report incidents of corporal punishment to the MS Dept. of Education, but these districts DO NOT have an express policy permitting the use of corporal punishment according to the most recently available student handbook. 5) GRAY: In 2009-2010 and 2010-2011 seventeen districts did not report incidents of corporal punishment to the MS Dept. of Education, and we were unable to obtain a recent student handbook to determine whether these districts have a policy concerning corporal punishment. The 3 Agricultural High Schools are not included in the visual map because they do not have discrete physical jurisdictions that school districts have. These districts had no reported corporal punishment incidents. Coahoma AHS allows corporal punishment in its student handbook. Forrest AHS has no corporal punishment policy in its student handbook. Hinds AHS's student handbook was unavailable. This map relies in part on data obtained from the MS Dept. of Education and the Jackson, MS Clarion Ledger. We obtained corporal punishment data for 108 of 152 MS School Districts. For each of these districts we have provided three numbers. The BLUE number repesents the number of reported corporal punishment incidents for the 2009 - 2010 school year. The RED number represents the number of reported corporal punishment incidents for the 2010 - 2011 school year. The GREEN number represents the increase or decrease in reported corporal punishment incidents from the first school year to the second school year. 41 Districts did not report CP data to the MS Dept. of Education. Therefore, in these districts no numbers are provided. Overall, 67 of 108 school districts reported a reduction in the incidents of corporal punishment by an accumulated total of 10,975 beatings. Overall 33 of 108 school districts reported an increase in the incidents of corporal punishment by an accumulated total of 4,862 beatings. Therefore there was a reported net decrease in the number of reported incidents of corporal punishment between the 2009-2010 and 2010-2011 school years by an accumulated total of 6,113 beatings.
Transcript

Amite CountyWilkinson Co.

Poplarville

Carroll County

Leflore County

Jefferson Co.

Benoit

Franklin County

George County

Natchez-Adams

Claiborne County

Leland

Webster County

Prentiss County

Petal

Hollandale

Clinton

North Tippah

Tupelo

Hancock

Humphreys

Picayune

Pascagoula

WestBolivar

Kosciusko

MossPoint

Clay

Brookhaven

Oxford

Pearl River

Starkville

Cleveland

Lumberton

JacksonPublic

PassChristian

Pearl

Corinth

Gulfport

Bay St.Louis

Hattiesburg

Booneville

Madison1,043 1,050

7 more

Quitman363 437

74 more

Alcorn1 3

2 more

Greene County218 262

44 more

Noxubee County164 239

75 more

Perry County0 21

21 more

DeSoto County3,202 3,233

31 more

Walthall Co.78 103

25 more

Lamar County0 23

23 more

Drew0 38

38 more Aberdeen181 284

103 more

Attala County959 1,338

379 more

Coahoma County35 65

30 more

Marshall County3 7

4 more

Jeff.Davis Co.88 249

161 more

Tishomingo Co.506 571

65 more

West Jasper1,141 1,181

40 moreEast Jasper

389 592

203 more

Newton County11 539

528 more

Union County471 614

143 more

Canton6 116

110 more

Quitman County294 1,594

1300 more

Sunflower92 502

410 more

West Point233 269

36 more

Shaw6 55

49 more

Holly Springs656 735

79 more

Indianola0 53

53 more

North Bolivar375 602

227 moreAmory

0 4

4 more

North Pike233 472

239 more

Pontotoc City6 18

12 more

Columbia72 92

20 more

Okolona247 253

6 more

New Albany1,324 1,340

16 more

Meridian708 873

165 more

Senatobia245 260

15 more

Biloxi151 290

139 more

LongBeach

0 3

3 more

Columbus72 197

125 more

Durant0 1

1 more

Mound Bayou0 50

50 more

South Delta52 3

49 less Yazoo County283 146

137 less

Louisville918 863

55 less

Wayne County156 137

19 less

Rankin County523 350

173 less

Grenada8 1

7 less

Jones County1,176 959

217 less

Holmes County317 184

133 less

Kemper County445 4

441 less

Hinds County55 0

55 less

Smith County743 385

358 less

Leake County352 67

285 less

Calhoun County366 226

140 less

Simpson County805 393

412 less

Coffeeville175 90

85 less

Stone County623 574

49 less

Jackson County78 54

24 less

South Panola2,572 1,985

587 less

Itawamba County177 99

78 less

Harrison County1,821 1,471

350 less

South Pike272 218

54 less

South Tippah617 456

161 less

Lafayette Co.7 0

7 less

Lauderdale Co.1,017 816

201 less

Scott County2,245 2,129

116 less

Tunica County271 83

188 less

Vicksburg-Warren4 0

4 less

Neshoba County2 0

2 less

Oktibbeha Co.1,252 531

721 less

Tate County883 557

326 less

Lawrence Co.709 441

268 less

Marion297 226

71 less

Copiah County490 372

118 less

Western Line868 457

411 less

Benton County456 446

10 less

Lincoln County887 320

567 less

Lee County1,399 1,163

236 less

Lowndes County42 0

42 less

Monroe719 382

337 less

Choctaw County1,137 1,074

63 less

PontotocCounty302 271

31 less

North Panola385 177

208 less

Montgomery143 0

143 less

ForrestCounty

1,025 565

460 less

Covington County17 2

15 less

EastTallahatchie

348 336

12 less

Hazlehurst City34 2

32 less

Enterprise8 5

3 less

Houston208 114

94 less

WestTallahatchie

28 3

25 less

Richton70 0

70 less

Newton City116 88

28 less

Nettleton5 0

5 less

Water Valley83 43

40 less

Forest City1,157 820

337 less

Baldwyn337 202

135 less

McComb314 223

91 less

Greenville528 284

244 less

Laurel253 207

46 less

Yazoo City559 137

422 less

Greenwood887 493

394 less

Philadelphia197 145

52 less

Union City499 376

123 less

Chickasaw12 9

3 less

Winona245 157

88 less

Ocean Springs72 3

69 less

Clarksdale344 276

68 less

Mississippi School Districts Corporal Punishment Incidents:

2009-2010 to 2010-2011 School Years

This map (v7) prepared 1/13/11 by Southern Echo, Inc. | 1350 Livingston Lane, Jackson, MS 39213 | phone: 601-982-6400

fax: 601-982-2636 | email: [email protected] | website: www.southernecho.org

With technical assistance from | Movementech, Inc., Naples, ME | phone: 207-749-1606

email: [email protected] |website: www.movementech.org

Legend

Corporal Punishment (CP) in MS School Districts

Incidents of CP; Whether CP Policy in Student Handbook

Incidents of Corporal Punishment Increased

Incidents of Corporal Punishment Decreased

No Data reported - CP Policy is in Student Handbook

No Data reported - No CP Policy in Student Handbook

No Data Reported - No Student Handbook Available

Data Sources:

Geospatial Boundary Data for MS School Districts comes from the

U.S. Geological Survey by way of the U.S. Census Bureau's web site.

MS Dept of Ed.

This map examines the practice and policy of corporal punishment (CP) in MS

School Districts. The map is color coded to show five different classifications

of MS school districts regarding their use of corporal punishment:

1) PURPLE: In these districts, the use of corporal punishment increased

from 2009-2010 to 2010-2011.

2) BLUE: In these districts, the use of corporal punishment decreased

from 2009-2010 to 2010-2011.

3) PINK: In 2009-2010 and 2010-2011 thirteen districts did not report

incidents of corporal punishment to the MS Dept. of Education,

but each district HAS an express policy which permits the

use of corporal punishment according to the most recently

available Student Handbook (typically but not

exclusively the 2011-2012 student handbook).

4) GREEN: In 2009-2010 and 2010-2011 eleven

districts did not report incidents of corporal

punishment to the MS Dept. of Education,

but these districts DO NOT have an express

policy permitting the use of corporal

punishment according to the most recently

available student handbook.

5) GRAY: In 2009-2010 and 2010-2011

seventeen districts did not report incidents

of corporal punishment to the MS Dept.

of Education, and we were unable to

obtain a recent student handbook to

determine whether these districts have

a policy concerning corporal punishment.

The 3 Agricultural High Schools are

not included in the visual map because

they do not have discrete physical jurisdictions

that school districts have. These districts had

no reported corporal punishment incidents.

Coahoma AHS allows corporal punishment in

its student handbook.

Forrest AHS has no corporal punishment policy

in its student handbook.

Hinds AHS's student handbook was unavailable.

This map relies in part on data obtained

from the MS Dept. of Education and the

Jackson, MS Clarion Ledger.

We obtained corporal punishment data for

108 of 152 MS School Districts. For

each of these districts we have provided

three numbers.

The BLUE number repesents the number of

reported corporal punishment incidents for the

2009 - 2010 school year.

The RED number represents the number of

reported corporal punishment incidents for the

2010 - 2011 school year.

The GREEN number represents the increase or decrease

in reported corporal punishment incidents from

the first school year to the second school year.

41 Districts did not report CP data to the MS Dept.

of Education. Therefore, in these districts no

numbers are provided.

Overall, 67 of 108 school districts reported a

reduction in the incidents of corporal

punishment by an accumulated total of

10,975 beatings.

Overall 33 of 108 school districts

reported an increase in the

incidents of corporal punishment

by an accumulated total of 4,862

beatings.

Therefore there was a reported

net decrease in the number of

reported incidents of

corporal punishment

between the 2009-2010 and

2010-2011 school years

by an accumulated total of

6,113 beatings.

Recommended