On-Line Sampling and Analysis Systems using the X-Ray Multi-Stream Analyser (MSA) and associated documentation, are products of Thermo Electron Corporation
and shall in no way be reproduced or copied without prior written consent of Thermo Electron Corporation.
Thermo Electron Corporation reserves the right to make changes to the product and this document without notice.
On-Line Sampling and Analysis Systems using an X-Ray Multi-Stream Analyser (MSA)
Thermo Electron Corporation Applicable to Mark 4.2 MSA August 2003
A.C.N. 087 556 527
Thermo Electron Corporation Operating as:
Thermo Gamma-Metrics Pty Ltd A.C.N. 087 556 527 and Thermo Ramsey Pty Ltd A.C.N. 60 063 572 949
11 West Thebarton Road Thebarton 5031 Adelaide AUSTRALIA
(PO Box 292 Torrensville Plaza 5031 Australia) Telephone: +61 8 8150 5300 Facsimile: +61 8 8234 5882
Website: www.thermogammametrics.com.au
Thermo Electron Corporation 5788 Pacific Centre Blvd San Diego CA 92121 USA
1.2.1 Maximum Allowable Radiation Levels/Doses.............................................................. 1-3 1.2.2 Radiation Levels Around the Analyser.......................................................................... 1-3 1.2.3 General Rules for Reducing Radiation Exposure ........................................................ 1-6
5.5.1 Powering Up the MSA...................................................................................................... 5-9 5.5.2 Powering Up the Signal Analyser................................................................................. 5-11 5.5.3 Applying HV Bias to the MEP ........................................................................................ 5-14
5.9 CHECKING AND TEST ING THE MEP ELECTRONICS SET UP ... ...... . . . . . . . . . . . . . . . . . . 5-33 5.9.1 Connecting & Calibrating the MCA........................................................................... 5-33 5.9.2 Checking the Probe X-Ray Spectrum......................................................................... 5-37 5.9.3 Checking and Adjusting the SCAs .............................................................................. 5-40 5.9.4 Measuring the Probe Resolution.................................................................................. 5-43 5.9.5 Checking the Standard Count-Rates at the Computer .......................................... 5-44 5.9.6 Re-Checking Settings in the Slurry ............................................................................... 5-45
On-Line Sampling and Analysis System (MSA) Technical Manual 3.1 iv
7.2.3 Liquid Nitrogen Requirement of the MEP ................................................................... 7-13 7.2.4 MSA Controlling Electronics.......................................................................................... 7-14 7.2.5 Using the Operator Interface Panel............................................................................ 7-16 7.2.6 OI Panel Menu Options................................................................................................. 7-18 7.2.7 Signal Processing Electronics (Signal Analyser) ......................................................... 7-26
7.6.1 Data Communication Between Analyser and Computer ...................................... 7-35 7.6.2 Data Transfer to Plant Process Control Systems ........................................................ 7-36
8.4.1 Dismantling the Probe................................................................................................... 8-14 8.4.2 Reassembling the Probe............................................................................................... 8-15
On-Line Sampling and Analysis System (MSA) Technical Manual 3.1 ii
This page is intentionally left blank
On-Line Sampling and Analysis System (MSA) Technical Manual 3.1 iii
List of Figures Figure 1-1 Typical Radiation Levels Around an Analysis Tank with a MEP in Operation.....................1-4 Figure 1-2 Maximum Radiation Levels around the probe (MEP) when not in operation and shielded for
maintenance purposes. ...............................................................................................1-5 Figure 1-3 Maximum Radiation Levels around the Radiation Gauge (MEP)when unshielded and raised
on the hoist out of the Analysis Tank. ............................................................................1-5 Figure 1-4 MEP Source Holder Showing fitting of 43403 Shield ........................................................1-7 Figure 2-1 Multi-Stream Analyser .....................................................................................................2-5 Figure 2-2 Typical Configuration of an On-Line Analyser System with an MSA .................................2-6 Figure 4-1 Typical 6-Stream MSA Layout .........................................................................................4-8 Figure 4-2 Typical MSA showing Location of Electronic Control Enclosures .....................................4-9 Figure 4-3 Typical Installation Diagram for a 6-Stream MSA ..........................................................4-10 Figure 4-4 Dimensions and Weight of the MEP..............................................................................4-12 Figure 4-5 MSA Probe Carriage Assembly .....................................................................................4-13 Figure 4-6 Wiring Motor Cable – Umbilical Grade.........................................................................4-16 Figure 4-7 Piping and Instrumentation Diagram for a Typical 6-stream MSA. ................................4-27 Figure 4-8 “Example” Electrical Enclosure and Connections.........................................................4-31 Figure 4-9 Signal Analyser Chassis Layout Central Equipment Requirements ................................4-37 Figure 4-10 AIN Data Cable Termination ......................................................................................4-40 Figure 5-1 AM955 Converter (Data Interface) Unit...........................................................................5-7 Figure 5-2 Signal Analyser Chassis Layout .....................................................................................5-12 Figure 5-3 “Example” MSA Controller Chassis Layout.....................................................................5-13 Figure 5-4 Piping & Connection diagram for a typical 6-stream MSA...........................................5-17 Figure 5-5 MEP and Detector – Exploded View .............................................................................5-23 Figure 5-6 MEP Detector Components and Cable Connections ..................................................5-25 Figure 5-7 Completed MEP/Detector Assembly ............................................................................5-27 Figure 5-8 Fitting the MEP Source Holder and Shield .....................................................................5-28 Figure 5-9 Exploded View of the MEP Window Assembly...............................................................5-30 Figure 5-10 Typical Energy X-Ray Spectrum from a MEP ...............................................................5-34
Contents
On-Line Sampling and Analysis System (MSA) Technical Manual 3.1 iv
Figure 6-1 Example Regression Plot ............................................................................................. 6-14 Figure 6-2 Example plots of the difference between on-line and laboratory assays .................... 6-21 Figure 7-1 An Example of How to Calculate a MSA Zone and Sampler Mask .............................. 7-25 Figure 7-2 Metallurgical Sampler Assembly-Front Elevation.......................................................... 7-30 Figure 7-3 Metallurgical Sampler Assembly-Side Elevation........................................................... 7-31 Figure 7-4 Signal Analyser Chassis Layout .................................................................................... 7-39 Figure 7-5 Signal Flow Through the Signal Analyser....................................................................... 7-41 Figure 7-6 Showing jumper link on AM093/11............................................................................... 7-46 Figure 7-7 Exploded View of the MEP Window Assembly.............................................................. 7-56 Figure 8-1 Exploded View of the Components of an MEP............................................................ 8-13 Figure 8-2 Fitting the MEP Source Holder and Shield .................................................................... 8-14 Figure 8-3 The Sample Hose ....................................................................................................... 8-21 Figure 8-4 The sample hose correctly attached to cutter ........................................................... 8-21 Figure 9-1 An Example of how to Calculate a MSA Zone and Sampler mask ................................ 9-5 Figure 9-2 Signal Analyser Chassis Layout ...................................................................................... 9-8 Figure 9-3 Components of the Window Assembly ....................................................................... 9-14 Figure 9-4 Showing jumper link on AM093/11............................................................................... 9-16
Contents
On-Line Sampling and Analysis System (MSA) Technical Manual 3.1 v
List of Tables Table 3-1 Safety Yellow Paint Specification .....................................................................................3-2 Table 3-2 Equipment Standard Paint Specification .........................................................................3-3 Table 3-3 Mechanical Specifications..............................................................................................3-5 Table 3-4 Metallurgical Sampler Specification................................................................................3-6 Table 3-5 Typical Analysis Accuracies .............................................................................................3-8 Table 4-1 Recommended Cables for Interconnecting Devices ...................................................4-36 Table 5-1 Common Elemental Fluorescent X-Ray Energies ..........................................................5-38 Table 7-1 Variable Speed Drive Factory Settings ...........................................................................7-15 Table 7-2 Signal Analyser Card Function.......................................................................................7-40 Table 9-1 MSA Operator Interface Panel Error Messages ................................................................9-4 Table 9-2 Diagnostic LED Colours ...................................................................................................9-7 Table 9-3 Signal Analyser LEDs - Functionality..................................................................................9-9 Table 9-4 Window Rupture Circuit Status LEDs ...............................................................................9-15 Table 9-5 Fault Diagnosis for Metallurgical Samplers.....................................................................9-24
On-Line Sampling and Analysis System (MSA) Technical Manual 3.1 1-1
1 Warnings and Cautions
Please read this section which describes the any potential hazards associated with the analyser equipment. You will see these symbols throughout this manual.
Read this section BEFORE attempting to operate the in-stream analyser equipment.
Warnings and cautions, including for liquid nitrogen are identified throughout the manual by this symbol in the left margin:
Radiation hazard warnings and cautions are identified by this trefoil symbol in the left margin:
Contents
On-Line Sampling and Analysis System (MSA) Technical Manual 3.1 1-2
1.1 Liquid Nitrogen (LN2) Handling
The analyser uses a sensitive high resolution Solid State device, Liquid Nitrogen (LN2) is required to cool the unit. The analyser will not operate without LN2 and can be permanently damaged without it . Protective Clothing: LN2 is extremely cold (-196°C, -320°F) and will cause serious burns if allowed to come into contact with skin or eyes. ALWAYS use long leather gloves, a full-face mask and full cover clothing (long trousers and long shirt sleeves) when handling LN2. Storing the LN2 Container: Even though LN2 is an inert chemical, the storage container should not be kept in a confined space where personnel may be working because the container vents nitrogen gas that may deplete the oxygen level in the air in an enclosed area. To transfer LN2 to the MEP it is best to use a 10 litre transfer dewar that is fil led first from the main storage container then carried to the MEP requiring fil l ing. Transporting LN2: NEVER transport LN2 in the passenger compartment of a motor vehicle. Ensure LN2 transfer dewar(s) are properly restrained. Bulk LN2 Storage LN2 may be available from a local supplier in transport containers of around 160 litres called “FLE” which may be rented on an exchange basis.
Warning: 1. Always use LN2 of at least 99.5% purity. Lesser purity
increases the level of potentially explosive liquid oxygen levels inside the MEP Dewar.
2. Never use any coolant except LN2. The analyser probe must always be kept vertical whenever it has liquid nitrogen in it . This ensures LN will not spill , and also that LN is in good contact with the ‘cold finger’ that keeps the detector at LN temperature.
Warnings and Cautions Radiation Safety
On-Line Sampling and Analysis System (MSA) Technical Manual 3.1 1-3
1.2 Radiation Safety
For stability and long term reliability, the analyser uses a very small button radioisotope (disc of 8 to 15mm diameter) as a source of X-rays, instead of an X-ray tube. The part of the analyser (the probe) that contains the radioisotope is classified as an industrial Radiation Gauge by the International Commission for Radiation Protection (ICRP). A “trefoil” radiation warning sign must be attached to each analyser in the plant. The local radiation regulatory authority can provide details of requirements.
1.2.1 Maximum Allowable Radiation Levels/Doses
The ICRP has set two limits for radiation exposure; one for the general public and one for personnel who work daily with radiation and whose exposure is monitored. These levels have been adopted by many countries including Australia via the National Health and Medical Research Council (NHMRC). These levels are: 1. 1,000µSv per year maximum allowable radiation dose
for the General Public. 2. 20,000µSv per year maximum allowable radiation dose
for Radiation Workers (i .e. in an industrial environment).
The allowed radiation exposure may be received in several short high level bursts or as a low even rate throughout the year, eg. 1,000µSv per year is equivalent to 0.5µSv per hour for 40 hours per week for 50 weeks per year.
1.2.2 Radiation Levels Around the Analyser Because the probe is used in an industrial environment and classified as a Radiation Gauge , the maximum allowed levels of radiation around the analyser when the probe is in normal operation in the plant (i .e. around the Analysis Tank) is 500µSv per hour at any point 50mm from the external surface and 10µSv per hour at any point 1000mm from the external surface. Actual typical radiation levels around a probe in operation in an Analysis Tank are shown in Figure 1-1.
Radiation Safety Warnings and Cautions
On-Line Sampling and Analysis System (MSA) Technical Manual 3.1 1-4
Figure 1-1 Typical Radiat ion Levels Around an Analys i s Tank
wi th a MEP in Operat ion
When the probe is mounted in the operating position (i .e. lowered into the Analysis Tank), the radiation levels around the analyser are negligible because the source X-rays only penetrate about 5mm into the slurry or solution. The active window diameter is only about 20mm. When the radioisotope is mounted in the radiation gauge, the radiation levels on the surface of the gauge (probe) are low enough for safe handling in all operations. Typical radiation levels around the probe are shown in figures 1-2 and 1-3. The probe emits radiation only in the forward direction from the gauge head. However, i t is always advisable that radiation levels are kept to a minimum so it is recommended that suitable shields be placed on the probes whenever they are removed for extended periods of time. Shielding the radiation from the probe can be done by means of either:
1. Attaching the “standard biscuit” (supplied) by clipping it around the window of the probe head, or
2. Fixing the Insertion Guard to the face of the probe detector using two M3 x 12 countersunk screws supplied with the guard, refer to Figure 1-4.
Caution: Avoid looking directly at the source at less than 1 metre. Always use a telescopic mirror when inspecting the radioisotope source closely.
Warnings and Cautions Radiation Safety
On-Line Sampling and Analysis System (MSA) Technical Manual 3.1 1-5
<0.1
<0.1
<0.1 <0.1 <0.1
<0.1 <0.1
100
cm 5
50
100 50 5 <2 µSv/h
100 50 5
cm
Source Type: C m - 244 or Pu - 238 Maximum Source Activity of 100 mCi
Figure 1-2 Maximum Radiat ion Levels around the probe (MEP)
when not in operat ion and sh ielded for maintenance purposes.
<0.
<0.
1. <0. <0. 22 <2
10
cm 5
5
10 5 5 800 µSv/h
10 5 5
cm
1.
Figure 1-3 Maximum Radiat ion Levels around the Radiat ion Gauge (MEP)when unsh ie lded and raised on the hois t out of
the Analys i s Tank.
Source Type: Cm-244 or Pu-238 Maximum Source Activity of 100mCi
Radiation Safety Warnings and Cautions
On-Line Sampling and Analysis System (MSA) Technical Manual 3.1 1-6
Note: 1. The X-rays from the radioisotope sources used in
Thermo Electron instruments DO NOT make the slurry or solution radioactive. Excitation of the atoms in the sample is an extremely short process, lasting for less than 1 thousandth of a microsecond!
2. The radiation source remains active even if the analyser power is off.
3. Ask your RSO (Radiation Safety Officer) or contact the Company if you have any concerns.
1.2.3 General Rules for Reducing Radiation Exposure • Minimise the time spent near a source of radiation;
• Maximise the distance from the source of radiation;
• Use shielding between the source of radiation and
yourself.
Note: Some applications may require the probe to use two sources.
Warnings and Cautions Radiation Safety
On-Line Sampling and Analysis System (MSA) Technical Manual 3.1 1-7
Multi-Element Probe
Beryllium Window
Shield43403 M3x12
Csk Screw 57565 (2)
Source(3 possible positions)
Window Contact“Fingers”
F igure 1-4 MEP Source Holder Showing f i t t ing of 43403 Sh ield
Radiation Safety Warnings and Cautions
On-Line Sampling and Analysis System (MSA) Technical Manual 3.1 1-8
This page is intentionally left blank
On-Line Sampling and Analysis System (MSA) Technical Manual 3.1 Attachment 1
Section 1 – Warnings and Cautions Attachment 1
LN2 Material Safety Data Sheet
On-Line Sampling and Analysis System (MSA) Technical Manual 3.1 Attachment 1
Material Safety Data Sheet
Liquid Nitrogen This product evaporates to form a simple asphyxiant and is not classified as hazardous according to hazardous substances classification criteria of Worksafe Australia. IDENTIFICATION Product name: Liquid nitrogen Other name: Product code: 701, 702, 703, 704, 705, 706, 707, 711, 713 UN number: 1977 Dangerous Goods: 2.2 HAZCHEM code: 2RE Poisons schedule: None allocated Use: Low temperature heat transfer fluid, purge gas, inert atmospheres, semiconductor applications. Application method: Vaporised liquid distributed through pressure and flow controlled distribution systems. Physical Description/Properties: Appearance: colourless and odourless liquid. Boiling point (deg. C at 101.32 kPa): -195.8 Vapour pressure (kPa at 25 deg. C): No liquid phase. Relative density (0 deg. C, 101.3 kPa, Air = 1): 0.967 Flashpoint (deg C): Non-flammable Lower flammability limit (%): Non-flammable. Upper flammability limit (%): Non-flammable. Solubility in water (101.32 kPa, 20 deg. C): 0.0149 cm3 gas/cm3 Other properties: Storage pressure is regulated to process requirements, refer to operating instructions. Cryogenic liquid, critical temperature deg. C: -146.9 Critical pressure kPa: 3,400 Material compatibility: Inert, non-corrosive. Low temperature will change mechanical properties of some materials.
On-Line Sampling and Analysis System (MSA) Technical Manual 3.1 Attachment 1
HEALTH HAZARD INFORMATION Health Effects: Liquid will cause rapid freezing on contact and will rapidly evaporate to form a simple asphyxiant. Acute: Low temperatures created during evaporation may cause hypothermia. Skin may freeze to surfaces cooled by liquid and be torn on removal. Swallowed: Unlikely route of exposure due to rapid evaporation of liquid. Eye: Liquid can cause tissue freezing or frostbite. Skin: Liquid can cause tissue freezing or frostbite, cold gas may cause hypothermia. Inhaled: Low temperature gas when inhaled may induce an asthma attack in susceptible individuals. May replace oxygen in the inhaled air and cause asphyxiation. As the amount of oxygen inhaled is reduced from 21 to 14 volume % the pulse rate will accelerate and the rate and volume of breathing will increase. The ability to maintain attention and think clearly is diminished, muscular co-ordination is somewhat disturbed. As oxygen decreases from 14 to 10% judgement becomes faulty, severe injuries may cause no pain. Muscular effort leads to rapid fatigue. Further reduction to 6% may cause nausea and vomiting. Ability to move may be lost. Permanent brain damage may result even after resuscitation from exposure to this low level of oxygen. Below 6% breathing is in gasps and convulsions may occur. Inhalation of a mixture containing only nitrogen will result in unconsciousness from the first breath and death will follow in a few minutes. (adapted from Henderson and Haggard) Chronic: No known effects, not carcinogenic or mutagenic and no specific reproductive effects. First Aid: Rescue personnel are advised to monitor oxygen concentration when entering confined spaces and poorly ventilated areas. Self contained breathing apparatus is recommended. Swallowed: Not applicable. Eye: Immediately flush with tepid water in large quantities, or with sterile saline solution. Hold eyelids apart and irrigate with gentle flow for 15 minutes bathing entire eyeball. Seek medical attention. Skin: Cold Burns: Irrigate with tap or tepid water for 15 to 30 minutes. Apply sterile dressing and treat as thermal burn. Immerse large areas or limbs in tap or tepid water for 15 to 30 minutes. Do not apply any form of direct heat. Seek medical attention. Hypothermia: Move to warm place. Wrap in blanket, avoid direct heat. Seek medical attention. Summon ambulance recommend Hospital admission for observation. Inhaled: Remove from exposure. Check there is no obstruction to the airway if breathing is weak or has ceased and give artificial respiration, preferably using an oxygen resuscitator. Keep warm and rested. Seek medical attention. Further treatment should be symptomatic and supportive. First Aid Facilities: OxyViva™ , water and sterile dressings. Self-contained breathing apparatus for rescue personnel. Advice to Doctor: Treatment for asphyxia and cold burns.
Overview Glossary of Terms
On-Line Sampling and Analysis System (MSA) Technical Manual 3.1 Attachment 1
PRECAUTIONS FOR USE Exposure Standards: No Worksafe exposure standard. Liquid will evaporate at ambient conditions to form Asphyxiant in high concentrations. Engineering Controls: Refer to Australian Standard AS1894 for more detailed installation and operating recommendations. Obtain specialist advice before installing and operating cryogenic liquid equipment. Low temperature insulation is required for liquid storage and transfer. Equipment design and materials must allow for contraction at low temperature. Pressure relief valves must be used between points where liquid and cold gas can be trapped as high pressures will develop as liquid evaporates and gas warms. Uninsulated surfaces must be protected against skin contact. Connect all pressure relief devices to a safe location having good natural ventilation. Check for leaks prior to use. Ensure liquid supply valve is shut and equipment is depressurised and warmed to ambient temperature before commencing maintenance and repairs. Personal Protection: Avoid contact with escaping liquid and gas. Only experienced and properly trained people should use this product. Wear safety glasses, safety shoes, use leather or low temperature compatible protective gloves when operating valves. Follow equipment operating instructions. Flammability: Non-flammable product. SAFE HANDLING INFORMATION Storage and Transport: Commonwealth, State and Territory Dangerous Goods legislation contain requirements which affect cryogenic liquid storage and transport. Store: Refer to vessel operating instructions. Do not store near sources of ignition, oxidising agents, poisons, combustible material and flammable liquids. Portable liquid containers should be stored: upright, prevented from falling, in a secure area; below 45 deg C, in a dry, well ventilated enclosure constructed of non-combustible material with firm level floor (preferably concrete), away from areas of heavy traffic and emergency exits. Transport: Transport on open top vehicles in accordance with Australian Code for the Transport of Dangerous Goods. Shipping name: Nitrogen, refrigerated liquid Transport E.P.G. card: 2C3. Spills and disposal: Release of liquid to atmosphere will generate vapour fog clouds which can travel considerable distances and affect visibility. These clouds should be treated as asphyxiating atmospheres as the evaporated liquid will have displaced air. Refer to vessel operating instructions. In an emergency allow liquid and gas to escape to atmosphere. Monitor oxygen concentration in confined spaces. Contact nearest BOC Gases centre for guidance. Leak checking may be done by pressure drop test or soapy water at joints and outlets. Shut liquid and gas supply valves to stop leak if possible and safe to do so. Notify the nearest BOC Gases centre. Residual product will be disposed of under BOC Gases supervision. Fire/Explosion Hazard: Temperatures in a fire may cause liquid vessels and related equipment to rupture and internal pressure relief devices to be activated. Storage vessels may contain fine particle insulation materials or foam products which may be hazardous or release hazardous decomposition products in a fire. Call fire brigade. Cool vessels exposed to fire by applying water from a protected location. Do not approach vessels suspected of being hot. Evacuate the area if unable to keep vessels cool.
On-Line Sampling and Analysis System (MSA) Technical Manual 3.1 Attachment 1
This page is intentionally left blank
On-Line Sampling and Analysis System (MSA) Technical Manual 3.1 2-1
2 Overview
The On-Line Sampling and Analysis System manual contains technical information and procedures for operating and maintaining an on-line analysis system incorporating a Multi-Stream Analyser (MSA). The manual is organised into sections for easy accessibility by the personnel carrying out the work. The sections are designed to be stand-alone manuals for the purposes of installing, operating and maintaining the equipment. This section provides an introduction to the On-Line Sampling and Analysis System incorporating a Multi-Stream Analyser (MSA). It describes what the equipment looks like, i ts principle of operation, a glossary of terms, statutory requirements, training requirements and receiving and storage of the equipment on-site prior to installation. The Installation section covers activities associated with installing the equipment such as site preparation, util i ties required, trade personnel requirements, mechanical and electrical installation, start-up and testing. The Commissioning section covers the initial powering up and testing of the equipment prior to calibrating. The Calibration section covers the on-line calibration procedures for the equipment.
Introduction Overview
On-Line Sampling and Analysis System (MSA) Technical Manual 3.1 2-2
The Operation section covers the day-to-day use of the equipment, including start-up, shutdown, and routine operational and maintenance checks. The Maintenance section covers mechanical, pneumatic and electrical service activities. Disassembly procedures are provided for repair and maintenance. This section is to be used in conjunction with the Parts List Manual which provides part identification drawings. Recommended Spare Parts are listed in the Maintenance section. The Trouble Shooting section provides information to aid diagnosing the cause of a malfunction with the equipment. A separate stand-alone manual is provided for the controlling Software that is supplied with the equipment. That manual is also provided electronically in PDF format on the software CD supplied with the equipment.
2.1 Introduction
The Multi-Stream Analyser (MSA) incorporates an XRF on-line (or in-stream) analysis instrument that provides real-time, continuous on-line analyses of key metals and pulp density for control of mineral processing plants. The MSA enables a single Multi-Element Probe (MEP) to be used to measure up to 12 process streams on a time-sharing basis. The information is presented in graphical and numerical form to meet the needs of plant operators, metallurgists and managers. The MEP is a robust solid-state device and has been in use in mineral processing plants worldwide for many years. The MEP forms the basis of analysis in the family of wet sample on-line analysers. For example, dedicated single stream analyser (MEP or AnStat), Single and Multi-Stream Solution Analyser (SSSA and MSSA) and the Multi-Stream Analyser (MSA), that is detailed in this manual. Rather than multiplex the slurry through a single flow cell measurement zone, the MSA works by moving a probe between adjacent slurry streams, bought together in a single location. Refer section 2.3 for discussion of configuration options.
Overview Glossary of Terms
On-Line Sampling and Analysis System (MSA) Technical Manual 3.1 2-3
2.2 Glossary of Terms
ADAM Analogue Data Acquisition Module (4-20 mA input/output device)
AIN Historically this acronym comes from “Amdel Instrument Network”. Thermo Electron now owns and maintains the AIN protocol. It describes a simple fieldbus with single master and up to 31 slave devices using a two wire RS-485 bus.
AnStat Analysis and Sampling Station (a multi-stage slurry sampling tank designed in accordance with the laws of sampling theory. The last stage of the tank houses the MEP)
ISA In-Stream Analysis (name given to the on-line analysis system because it is based mainly on immersion probe technology)
LN2 Liquid Ni trogen (extremely cold inert l iquid for cooling the MEP) Interchangeable with LN.
LTR Live-Time-Ratio (the percentage of t ime the MEP electronics actually processes information)
MCA Multi-Channel Analyser (used for setting up SCAs for MEP Electronics)
MEP Multi-Element Probe (high sensitivity XRF analysis probe capable of measuring up to eight elements and slurry density simultaneously)
MSA Multi-S tream Analyser (on-line analysis equipment which uses just one MEP for measuring multiple slurry streams on a time-sharing basis (multiplexed)).
OI Operator Interface. Local display and keyboard for controlling the RLC
OLE Object Linking and Embedding OPC OLE for Process Control. Communication Protocol. Refer
Software Manual. RARP Regression Analysis Program (The Thermo Electron software
package for performing calibrations) RLC Remote Logic Controller (similar to a PLC but has proprietary
functionality for analysers)
RSO Radiation Safety Officer s .d. S tandard Deviation in counting statistics SCA S ingle-Channel Analyser (provided in the electronics (Signal
Analyser) associated with the MEP for setting multiple single measurement windows (channels))
WinISA The main software package that runs on the central computer, used for capturing and displaying assay data and configuring the system.
XRF X-Ray F luorescence
Typical Components and Configuration Overview
On-Line Sampling and Analysis System (MSA) Technical Manual 3.1 2-4
2.3 Typical Components and Configuration
A Typical 6-stream Multi-Stream Analyser (MSA) is shown in Figure 1-2. A typical configuration of the analysis system is shown in Figure 2-2. Typical In-plant Equipment includes: • MSA Frame to which the probe carriage, Analysis
Tanks, Signal Analyser, MSA Controllers and other associated equipment are attached to form a completely self-contained on-line analysis unit providing intermittent stream measurement with assay up-date times of nominally 8 minutes for a six stream MSA unit. To aid in maintenance of the probe a Service Bay is sometimes fitted at one end of the MSA unit.
• MEP (Multi-Element Probe) the analysis probe, mounted on a pneumatically operated hoist on the MSA Frame , and immersed into the slurry in an Analysis Tank for slurry measurement. A spray ring washes the probe as it raises, thus preventing contamination between streams.
• Analysis Tank is a specially designed tank (Analysis Zone) used to de-aerate and homogenously mix the slurry as it passes the probe; thus presenting a representative slurry sample to the measurement probe. Each MSA frame may contain up to 6 small (300mm wide) analysis tanks. Each analysis tank includes a Stirrer for mixing and a Water Spray for froth suppression. The water spray can be turned off via an isolation needle valve at the main water inlet of the MSA unit. A flanged outlet is provided in the analysis section for maintenance purposes. If included, a Metallurgical Sampler will be fit ted to the outlet section of each analysis tank in the MSA frame. The main advantages of using individual analysis tanks for each stream rather than re-directing flows from different streams into the same analysis tank are:
1. Analysis tanks can handle a very large dynamic range of flow rates.
2. No need for slurry de-multiplexing. 3. No cross-contamination between streams. 4. No emptying, fil l ing nor washing times. Probe is
washed during movement between streams. 5. Metallurgical Samplers can operate independently
of the ISA system, thus allowing shift composite samples to be taken.
Overview Typical Components and Configuration
On-Line Sampling and Analysis System (MSA) Technical Manual 3.1 2-5
6. The outlets can easily be re-directed back into the process. A possibility is to re-direct a number of process streams to a common sump.
• Metallurgical Sampler is located at the outlet to the Analysis Tank . Each Metallurgical Sampler has a separate timer, which has both manual and two types of automatic modes (shift and calibration mode) of operation selectable via the Operator Interface (OI) panel. Hence, they are ideally suited for both calibration purposes and the collection of shift composite samples.
• MSA Controllers . Electronic enclosures incorporating a Signal Analyser for processing the probe signals and transmitting the data via a RS-485 (AIN) to a central controlling PC, the Operator Interface (OI) panel and RLC for controlling and monitoring probe movement and interlocks.
• Primary Samplers (or stream splitters); are provided as part of the system or optionally provided by the Customer. Such samplers are required to limit the slurry stream flow rates to the MSA to less than 20m3/hr (nominally 5 – 10m3/hr) for the small (300mm wide) tanks and to less than 35m3/hr for the medium (400mm wide) tanks (nominally 5-20m3/hr).
Figure 2-1 Mult i -S t ream Analyser
Central Equipment includes: Controlling PC which is usually installed in the plant control room and runs the Thermo Electron WinISA software package on a Windows NT or 2000 platform. The central controlling PC can be interfaced to the Customer’s process control system using the Modbus protocol, either RS232 Serial or networked via TCP/IP (Ethernet) or using OPC (Object Linking and Embedding for Process Control). The software logs data from the MSA and displays the on-line assays, calculated from the MEP signals in the plant.
Typical Components and Configuration Overview
On-Line Sampling and Analysis System (MSA) Technical Manual 3.1 2-6
IN-P
LAN
T EQ
UIP
MEN
TC
ON
TRO
L R
OO
M E
QU
IPM
ENT
STR
EAM
SAN
ALYS
ERS
Tele
phon
eM
odem
Prin
ter
Col
our
Gra
phic
s M
onito
r
Mod
bus
Inte
rface
(RS-
232
Seria
l or T
CP/
iPne
twor
k co
nnec
tion)
or O
PC (n
etw
ork
conn
ectio
n)
RS-
232
toR
S-48
5C
onve
rter
IBM
Com
patib
le
Indu
stria
l PC
Win
ISA
Serv
er
Plan
tPr
oces
sC
ontro
lSy
stem
(DC
S/PL
C)
ELEC
TRO
NIC
SIN
TER
FAC
EU
NIT
SC
OM
PUTI
NG
EQU
IPM
EN
TPE
RIP
HER
ALS
1 2 3 4
Full
Flow
Full
Flow
Full
Flow
Full
Flow
Sign
alA
naly
ser
MSA
Con
trolle
r
6-St
ream
Ana
lyse
r
5 6
Full
Flow
Full
Flow
RS-
232
Para
llel P
ort
Mod
bus
Inte
rface
RS-
232
TCP/
IP N
etw
ork
Con
nect
ion
or O
PC N
etw
ork
Con
nect
ion
Not
e: C
ontro
lling
PC m
ay b
e pu
t on
Plan
t Net
wor
k
RS-
232
toR
S-48
5C
onve
rter
4-20
mA
Anal
ogue
Out
put/
Inpu
t Dev
ice
(AD
AM m
odul
e)(o
ptio
nal)
Oth
er P
lant
Inst
rum
enta
tion
(E.g
. On-
Pipe
Den
sity
gau
ges,
Flo
w M
eter
s,Le
vel S
witc
hes,
Par
ticle
Siz
e M
onito
rs, e
tc.
Net
wor
ked
Win
ISA
Clie
nt(s
)(O
ptio
nal)
Figure 2-2 Typical Conf igurat ion of an On-L ine Analyser Sys tem with an MSA
Overview Typical Components and Configuration
On-Line Sampling and Analysis System (MSA) Technical Manual 3.1 2-7
2.4 Operating Principle
2.4.1 Analyser The Multi-Stream Analyser (MSA) enables a single high performance analysis probe (MEP) to be applied to up to fifteen mineral processing streams on a time-sharing basis. The MEP is suspended on a pneumatic hoist so that i t can be lowered into any one of a number of small specially-designed analysis tanks mounted on a sturdy frame. The purpose of the MSA mechanism is to transport the probe between the analysis tanks (one analysis tank per stream) in minimum time. The MSA unit is modular in design so that further analysis tanks can be added. Typically one MSA module (frame) will contain up to six (6) 300mm wide (small) analysis tanks (less for 400 mm wide, medium size tanks) and so large MSA units such as a 12-stream unit will consist of two modular units (frames) bolted together. Metallurgical Samplers, if fi t ted, are located at the outlet to each of the analysis tanks (see photo left) . These samplers have both manual and automatic (shift and calibration) modes of operation. The vertical movement is produced by a pneumatic ram (hoist) which lifts the analysis probe out of the slurry and clear of the analysis tanks (see photo left). Horizontal movement is by three-phase motor and variable frequency AC drive (inverter). The motor is fit ted with a speed reduction gearbox and drives by a friction wheel on a track. Accurate horizontal positioning is achieved by feedback from proximity sensors that detect the probe carriage. One sensor per analysis tank is provided and they are clamped along a rail at the centre line of each analysis tank (see photo left). The probe can also be raised from the slurry and "homed" to a maintenance (service) zone by pushing a “Park Probe” button. The Remote Logic Controller (RLC) contained within the MSA Controller enclosures mounted on the MSA frame controls all of the functions required by the MSA unit (eg. probe movement, stream measurement time, frequency and sequence, metallurgical sampling, probe water sprays and stirrer operation) with user interaction obtainable via the Operator Interface (OI) panel located on the controller 's outside panel.
Statutory Licensing Requirements Overview
On-Line Sampling and Analysis System (MSA) Technical Manual 3.1 2-8
High level access through the OI to change the hardware configuration requires a password to be entered. Refer to the section on the RLC menu items for operational details. Low level access allows for viewing of status of the MSA. The controlling computer, located in the control room, also provides controlling software control over the stream measurement time (in integral seconds), frequency and sequence. The MSA unit makes no restrictions on the order that streams are selected although it will certainly take less time moving between adjoining analysis tanks than widely separated ones. In normal operation the computer issues commands to the MSA, via the RLC, to move to a particular stream where it will stay until instructed to move to another. Providing the MSA is not in manual operating mode, it will respond to the command immediately. The Multi-Element Probe (MEP) is the analyser part of the MSA and is an energy dispersive X-ray fluorescent (EDXRF) device with high sensitivity and selectivity and is capable of measuring up to eight elements and density simultaneously. The MEP uses a Liquid Nitrogen (LN2) cooled Si(Li) solid-state X-ray detector whose sensitivity enables the measurement of very low concentrations of elements, such as those encountered in tailings streams.
Each element in the slurry (or solution) emits fluorescent X-rays of an energy and intensity which is characteristic of that element and its concentration. Fluorescent and scattered X-rays from the slurry impinge on the detector to produce small electrical pulses that are shaped and amplified. The peak amplitude of the pulse is proportional to the energy of the incident X-ray. The scattered X-rays are used to provide measurements of the slurry density. The number of X-rays is proportional to the elemental concentration in slurry. Energy spectrum resolution is typically better than 200eV, measured on the FeKα peak. The analyser is calibrated for each stream against a suite of samples taken over a period of time to cover a wide range of plant operating variables and conditions in each stream of the MSA. The outputs from the analyser are sent on the AIN RS-485 data communication fieldbus to the controlling computer located in a clean, dust-free room in the plant (usually the control room). The computer logs the incoming data, computes the on-line assays using preset calibration equations and displays the assay information in tables and as trend graphs. Information may also be printed and distributed to a plant process control system.
Overview Statutory Licensing Requirements
On-Line Sampling and Analysis System (MSA) Technical Manual 3.1 2-9
2.4.2 Slurry Sampling The correct presentation of sampled slurry to on-line analysers is fundamental to the success of any on-line analysis system. It is a well known fact that the full flow sampling and analysis with dedicated measurement is the preferred method, however for the MSA, most streams will require sampling as flow rates will too high for this type of analyser. Refer section 3.2 for flow rate capacities. Slurry Sampling is usually done using Primary Samplers (as shown left), either Pressure (top) or Gravity (bottom) type.
2.5 Statutory Licensing Requirements
For protection of workers and the public, the use of radioisotope sources and radiation gauges is regulated by a government authority, which in all the States of Australia is the Department of Health or its equivalent. Similar regulations are in use in all countries and they are all based on recommendations of the International Atomic Energy Agency (IAEA).
Note: The AM282 Multi-Element probe (MEP) is classified as a Sealed Source Radiation Gauge . The onus is on the Customer to notify their local regulatory authority with details of the radiation gauges and radioisotopes to be used in their XRF analyser system to ensure compliance. The regulations normally provide for at least the following matters:
1. Registration of ownership of each radioisotope used with the controlling regulatory authority.
2. Responsibility of the owner for maintaining records of radioisotope details including location.
3. Responsibility of the owner for safe storage and safe usage of the radioisotope sources.
Sampled Flow
MainFlow
Sampled
Flow
MainFlow
Statutory Licensing Requirements Overview
On-Line Sampling and Analysis System (MSA) Technical Manual 3.1 2-10
4. Nomination of one person as a Radiation Safety Officer (RSO) to carry out the nominated duties in relation to safe working practices.
5. Instruction of personnel in correct use of radioisotope sources, and the issue to them of radiation monitoring devices when required by the regulations.
6. Notification to the controlling authority of the loss of any radioisotope, or of any incident such as mechanical damage or fire to the radiation gauge.
7. Ensure that radiation warning signs are prominently located and are maintained in a clean, intact and legible state.
As part of the Vendor Data Supply , the Company provides details of the radiation gauges and radioisotopes and this information is to be retained by the site RSO.
Overview Safety and Environment
On-Line Sampling and Analysis System (MSA) Technical Manual 3.1 2-11
2.6 Safety and Environmental
2.6.1 Probe Protection Devices In the event that any operating conditions are abnormal (eg. power, air supply, probe window rupture, etc.) the MEP pneumatic hoist will automatically raise the probe containing the radioisotope from the tank so as to prevent possible damage to the probe detector. The probe cannot be lowered into the tank until such time as the problem is rectified. A Window Rupture is also reported on the display screen of the computer. In the event that the probe runs dry of LN2 and warms up, a temperature device inside the probe automatically shuts down the High Voltage bias to the detector to minimise internal damage. Prior to running dry, a “Low Liquid Nitrogen” warning will be displayed on the computer screen once the LN2 level drops to and below 1 litre.
2.6.2 Safety Guards Safety Guards, with an Interlocked Door , are provided on the MSA frame to prevent injury from the moving probe. When the interlocked door is opened, the probe is raised and its movement stopped. The MSA reverts to “manual mode” and cannot be put back into “automatic (operational) mode” until the door is closed. When the interlocked door is opened, the stirrers can continue working to prevent the analysis tanks from sanding up i f manually requested using the “Stirrer Override” button, located inside the door. Two pneumatic air cylinders are used in the MSA unit; one large unit vertically mounted on the probe carriage hoist and a second small unit for the probe safety latch, also on the probe carriage hoist. Both of these air cylinders operate under automatic control; however they are completely enclosed behind the safety guards thus preventing any injury to operators. Because the safety guard door that allows access to these units is interlocked all movement, including the electrical and pneumatic operation, ceases when the door is opened and will only resume when the door is fully closed.
2.6.3 Radiation Protection The MEP containing the radioisotope only emits radiation in a forward direction from the probe window when the standard biscuit has been removed. Under normal operation with the probe lowered into the analysis tank, the tank itself and the slurry acts as a shield.
Overview Safety and Environment
On-Line Sampling and Analysis System (MSA) Technical Manual 3.1 2-12
When the probe is raised from the tanks during movement between streams, radiation shielding is provided by the strategically mounted surrounding metal work.
2.6.4 Environmental Protection By its nature most of the mechanical parts of the analyser system have to operate under the normally arduous environmental conditions that prevail in a mineral processing plant. The design minimises the number of moving parts thus exposed and specifies large safety margins and wear lifetimes on those that are. Electrical and electronic control equipment is environmentally protected to AS1939-1990 class IP66 (NEMA4) . Materials Specifications are given in chapter 3. Environmental operating conditions are: • Signal Analyser and controlling electronics: Ambient
Operating Temperature: -10 to +50°C. • Sun Exposure: Only a problem if operating
temperatures inside the Signal Analyser cabinet increase beyond that quoted above. In this case the Customer may need to install a sun shade over the MSA.
Note: The Company recommends that a roof be installed over the MSA unit if i t is to be installed outdoors, or if significant spillage is expected from above.
Caution: Caution IP rating may be compromised by improperly sealed glands or gland holes.
2.7 Training Requirements for Plant Personnel
During site commissioning the Company engineer will provide informal hands-on training in the operation, radiation safety and routine maintenance of the analyser system. Very detailed operation and maintenance procedures are provided in this manual.
Overview Training Requirements for Plant Personnel
On-Line Sampling and Analysis System (MSA) Technical Manual 3.1 2-13
Radiation levels around the MEP are very low; however, i t is usually a requirement of the regulatory health authorities that site personnel are licensed to handle radioisotopes and use radiation gauges. One site employee shall also be appointed as the Radiation Safety Officer (RSO). This implies that at least one site person must be formally trained in radiation safety and become suitably licensed. Your local regulatory health authority provides the formal training and licensing, therefore this cannot be done by the Company.
Note: Any site personnel who are required to remove the probe window and radioisotope source holder may be required to be licensed or supervised by the RSO. Check with your local authority. Any other operational or maintenance staff who will not be required to work with the actual radiation gauge (the MEP itself), do not need to be licensed; however, they must be demonstrated the radiation safety issues related to the equipment if required to work inside the MSA safety guards (e.g. to maintain stirrers). This is done by the Company engineer during commissioning of the equipment or it can be done by other trained and licensed site personnel. I t is the responsibility of the site RSO or other licensed and responsible personnel to ensure that the probe is adequately shielded whilst maintenance personnel carry out their work on the equipment. The standard biscuit used for standardising the probe also acts as a radiation shield for the probe. [Because the radiation level drops to essentially background within 1m of the front of the probe then shielding of the probe is sometimes not necessary]. The Company also holds formal Training Courses in operating and maintaining its analysers in Australia for i ts Customers. Additional Training Courses can also be held on-site upon request and these are usually from two to five days duration depending on the customer’s training requirements and the number of employees requiring training. Refer to our web site for further details.
Receiving and Storage of Equipment Overview
On-Line Sampling and Analysis System (MSA) Technical Manual 3.1 2-14
2.8 Receiving and Storage of Equipment
2.8.1 Receipt and Inspection Upon receipt of containers and crates, inspect for any obvious damage during transport. Take detailed notes and photographs of any noticeable damage and notify the Transport Company and Thermo Electron immediately. An Equipment List and schematic diagram of your system components is provided as an attachment to the Installation section of this manual. The items in the Equipment List should be checked off against the actual supply of equipment and packing lists to ensure that critical i tems have not been omitted. Notify Thermo Electron immediately if you think that some equipment may have been omitted from the consignment.
Note: Electronic equipment can sustain electrostatic damage without evidence of physical abuse.
2.8.2 Storage Prior to Installation Any equipment that is not required for initial installation, i .e. equipment which is only required for system testing and calibration by the Company engineer upon arrival on-site, should be left packed in its shipping crates and stored in a dry safe location away from direct sun, corrosive fluids and vibration. For example, the MEP detector and isotope, computer equipment, spare parts, test equipment and consumable items.
Warning: Any damage to or loss of equipment whilst stored on Customer premises may result in delays in commissioning the system and additional costs to the Customer.
Caution: If the equipment is to be stored on-site past 4 weeks after shipment, then the MEP detector must be removed from its packing crate and fi l led with LN2.
Overview Receiving and Storage of Equipment
On-Line Sampling and Analysis System (MSA) Technical Manual 3.1 2-15
2.8.3 Filling the MEP Detector with LN2 on Delivery As soon as the equipment arrives on-site, the MEP detector (containing the radioisotope) must be fil led with liquid nitrogen (LN2) to prevent possible damage occurring due to prolonged exposure to normal ambient temperatures. Refer to the unpacking and filling instructions in clause 2.8.4.
Warning: Always use LN2 of at least 99.5% purity. Lesser purity
increases the level of potentially explosive liquid oxygen levels inside the MEP dewar. Use only LN2, do not substitute LN2 with any other coolant.
Warning: The Company specifies on the instruction document
attached to the detector (and/or crate) the date by which the MEP detector must be fil led with LN2. Failure to comply with this requirement may void the warranty on the MEP detector. The detector dewar will require 10 to 11 litres of LN2 to fil l i t . Because the dewar is warm then the LN2 will boil off more rapidly initially and so it must be “topped up”. Use a torch or long black plastic cable-tie to check levels. Do not use a hollow dipstick.
Caution: The temperature of LN2 is very low; -196°C (-320°F).
Warning: Check the level of LN2 regularly for the first 24 hours of
cool-down and top up as required. Thereafter and when installed in the plant, i t will only need fil ling twice per week, providing it is not allowed to warm up, usually Mondays and Thursdays are ideal (refer to routine Maintenance).
Receiving and Storage of Equipment Overview
On-Line Sampling and Analysis System (MSA) Technical Manual 3.1 2-16
Warning: The more times the MEP detector is allowed to run dry of
LN2 the risk of detector failure increases exponentially. Thermal cycling is the most damaging form of non-physical probe abuse. Whilst the detector is in its metal stand it must have the foam plug inserted to prevent dirt from entering the dewar.
Note: It is not necessary to use the foam plug once the MEP detector is installed in its shroud in the plant. Keep the foam plug in a safe place for later use if the detector needs to be removed from its protective shroud for maintenance.
2.8.4 Unpacking & Filling MEP Detector with LN2
1. Lay the box horizontally as directed by markings. Remove banding and nails around the edge of the top panel and remove it . Carefully remove enough packing material to expose the equipment. There is only a single piece of equipment in the box.
2. Lift the unit out carefully and place it upright on the
base of its attached metal stand. Do not open, remove or otherwise interfere with the plastic bag containing silica gel at the bottom until installation time.
3. Remove any packing tape securing the cap of the dewar
and extract the foam plug from the top. Pour liquid nitrogen into the dewar. Do not use any other coolant. During this initial fi l l , because the unit is warm, considerable boil off can be expected so take care not to splash on skin or eyes. The dewar has a capacity of 11 litres but i t may require 12 to 15 litres for the initial fil l . Insert the foam plug when boiling subsides. This plug is only temporary until the unit is installed. It need not be fully inserted.
Overview Receiving and Storage of Equipment
On-Line Sampling and Analysis System (MSA) Technical Manual 3.1 2-17
4. After about one hour, check that violent boiling has
ceased and some LN2 remains. Also check that the unit is NOT too cold and possibly becoming covered with condensation or ice in the lower parts. The dewar should not be colder than about 5oC below ambient temperature. If the unit is very cold it may have suffered a vacuum failure in transit . Take note of its LN2 consumption using a dipstick. If i t consumes more than 5 litres in 5 hours, stop fill ing and allow it to return to room temperature and contact the Company for instructions.
5. If the unit is not sweating (condensing water) or icing
up one hour after initial fil l ing, top up the dewar with more LN2. Up to 2 li tres may be required. From this point one may begin the routine fill ing schedule (refer to clause 2.8.5). It should be stored in such a manner that i t will not be overturned.
Note: Refer Section 1 for MSDS for LN2.
2.8.5 Routine Filling Whilst in storage or operation the unit will consume LN2 at about 0.7 to 1.2 li tres each day. It is important to prevent total evaporation; hence the dewar must be topped up (at least) every 7 days. Before every routine fil l , check that some LN2 remains in the dewar. Use a torch and some clean wood doweling or black plastic cable-tie as a dipstick for this purpose, then top up with LN2. It is not necessary to recheck after an hour. The unit should be fil led as frequently as necessary to prevent it running dry. Please advise the Company if the unit appears to be consuming more than two litres per day.
Cleaning and Storage for Extended Plant Shutdown Overview
On-Line Sampling and Analysis System (MSA) Technical Manual 3.1 2-18
2.9 Cleaning and Storage for Extended Plant Shutdown
If the plant is to be shutdown for a long period of time then it may be decided by the owners to remove the radioisotope from the MEP for safe storage. This is not a requirement by the Company. Similarly it may be decided to move the detector with shielded source to a storage location which is more convenient for regular LN2 fil ling. Again, this is the owner’s decision. To remove the detector with its (shielded) source in place, follow the procedure in section 8.4. This provides for putting a radiation shield on the source holder. The detector should then be put into its metal stand that i t was originally supplied with, stored in a safe clean and dry place and be kept fil led at least once per week with LN2. The foam dewar plug must be inserted into the detector to keep dirt and moisture out. The place of storage may be on site near to the location of the FLE or other Liquid Nitrogen supply, or off site with a third party. It may be necessary to remove the radioisotope. Consult your Radiation Safety Office for advice. If the source (with shield attached) must be removed from the detector then unscrew the three M3 screws that fix the source holder into the detector. This shielded source holder then needs to be stored in a safe place that is classified as the site radiation store with controlled access. The site RSO is responsible for carrying out this task and ensuring that the radioisotope is properly stored.
Note: Replace the upper dewar cover and window after removing the detector to ensure the inside of the housing remains clean.
Warning: Failure to keep the MEP always cooled with LN2 even when not in use, may permanently damage it .
Overview Cleaning and Storage for Extended Plant Shutdown
On-Line Sampling and Analysis System (MSA) Technical Manual 3.1 2-19
Warning: If the radioisotope source is to be removed, it must be stored safely and the local radiation authority notified of its storage method and location.
The remaining components of the analyser system, i .e. electronics, computer equipment, etc should just be shut down with mains power tagged out (see photo left) to all in-plant equipment. Drain the analysis zones and wash down the analyser. In some situations it may be desirable to cover the equipment with tarpaulins or similar and/or take measures to prevent condensation or other water damage. It is recommended that an inventory of the stored equipment be maintained.
Cleaning and Storage for Extended Plant Shutdown Overview
On-Line Sampling and Analysis System (MSA) Technical Manual 3.1 2-20
This page is intentionally left blank
On-Line Sampling and Analysis System (MSA) Technical Manual 3.1 3-1
3 Specifications
This section details the standard specification of material used in fabricating the on-line sampling and analysis equipment. The section also provides other equipment specification information and including analyser typical accuracies.
3.1 Specification of Materials
The following surface materials and coatings are the Company’s standards used for in-plant equipment. Other materials and coatings may be used if requested.
3.1.1 Wetted Parts
Multi-Element Probes : Standard: Grade 316 Stainless Steel Optional: Grade 2RK65 Stainless Steel for high
chloride ion concentrations Linatex or equivalent Coating
On-Line Sampling and Analysis System (MSA) Technical Manual 3.1 3-2
3.1.3 Paint Specification
COLOUR:
Golden Yellow –No. 43331
USED ON:
All Mild Steel (usually moving parts and guards)
CLASS OF BLAST:
To AS1627-4 Class 3 (grit blast)
PRIMER: TYPE - INTERGARD high build
epoxy grey (International paint marine
coatings) THICKNESS - 100 microns OR (alternative only) TYPE - Epoxy Val Chem Zinc
Phosphate THICKNESS - 100 microns TOP COAT: TYPE - INTERFINE 629 (M245) (2 pack high gloss anhydride
catalysed acrylic finish coat) COLOUR - GOLDEN YELLOW TO
AS2700 No Y14 THICKNESS - 100 microns ** Average total thickness must be 150 microns. ** Minimum acceptable total thickness is 125 microns.
Table 3-1 Safety Yel low Paint Speci f icat ion
PROPERTIES:
1. Durable epoxy tank lining for continuous immersion requirements.
2. Wide chemical resistance to petroleum products, sea water and inert gas.
3. Resistance to caustic soda and solvents (suitable choice for the “coated tank” of many selective chemical tankers).
4. Top coat (Interfine 629) provides resistance to weathering in severe industrial environments such as tankage, handrails etc.
5. Top coat provides outstanding gloss and colour retention in severe environments.
Specifications Specification of Materials
On-Line Sampling and Analysis System (MSA) Technical Manual 3.1 3-3
COLOUR:
Sapphire Blue
USED ON:
All exposed Mild Steel
CLASS OF BLAST:
To AS1627-4 Class 3 (grit blast)
PRIMER: TYPE - Epoxy TFH684/THA044 (International paint marine
coatings) (1st Coat) hb Surface grey THICKNESS - 100 microns OR (alternative only) TYPE - Epoxy Val Chem Zinc
Phosphate (M290) (2 pack catalysed epoxy
primer) THICKNESS - 100 microns TOP COAT: TYPE - INTERFINE 629 (M245) (2nd coat) (2 pack high gloss catalysed
acrylic finish coat Part A – T7158, Part B – T7159)
COLOUR - White tinted “Sapphire Blue” Taubman
THICKNESS - 50 microns per coat (2 coats)
Table 3-2 Equipment Standard Paint Speci f icat ion
PROPERTIES:
1. Durable epoxy tank lining. 2. Wide chemical resistance to petroleum products, sea
water and inert gas. 3. Suitable for exposure to intermittent or sustained
wet and immersed conditions. 4. Top coat (Interfine 629) provides resistance to
weathering in severe industrial environments such as tankage handrails etc.
5. Top coat provides outstanding gloss & colour retention in severe environments.
Mechanical Specifications Specifications
On-Line Sampling and Analysis System (MSA) Technical Manual 3.1 3-4
3.2 Mechanical Specifications
Number of Streams 3-12 (intermittent measurement).
Sequence of Stream Any order or repetition pattern allowed, without time restriction
Measurement (resolution 1 second).
Re-positioning Time Typically 12 seconds for adjoining zones and 25 seconds between end zones (12 stream version).
Horizontal Drive TEFC 400 Volt three phase 0.37kW motor with 50:1 worm gearbox driving rack and pinion, Service factor: 2.3. Speed control by 0.75 kW AC inverter.
Guards Guards are provided all round as standard, including four hinged doors. One door is electronically interlocked to freeze all motion. The others are intended to be pad-locked as they are not used for routine access.
Vertical Drive The probe is raised by a self oiling pneumatic cylinder 500 mm stroke 100 mm diameter aluminium barrel with stainless steel rod. Thrust 3020 N at 600 kPa. Lowered under gravity by air release. Pneumatic safety latch prevents lowering on air failure.
Noise <80 dBA at 1m.
Proximity Sensors Schmersal IFLIS Inductive.
Controller Thermo Electron Remote Logic Controller (RLC) with I/O cards.
Water Clean plant water. 300 – 800 kPa at approximately 20 litres per hour, intermittently
Probe Wash Down Four self-clearing nozzles solenoid actuated as probe is retracted from slurry. Wash water is collected by the most recent stream analysed. Washing is inhibited during manual indexing of the probe.
Service Position A service bay, to which the probe will go when the PARK button is depressed. This service position is useful for filling the probe with LN2 or other maintenance work. It can be external to the MSA or any one of the analysing positions, with or without a tank.
Communications (Data) AIN compatible (EIA RS-485). Cable is screened twisted pair, maximum total length 1.2 km. Other communication options available.
Specifications Specification of Materials
On-Line Sampling and Analysis System (MSA) Technical Manual 3.1 3-5
Power (In-Plant) Standard factory selectable 380/415/440/460 Volts AC ±10% 3-phase 48-62 Hz ±2Hz (3 wire plus earth). Optional 525 available on request. Maximum Power Consumption: 3-stream MSA: 1.8kW 6-stream MSA: 2.9kW 9-stream MSA: 3.8kW with standard 250W stirrer motors
Air Instrument Quality Air (clean and dry to 0.1 microns with dew point <2°C).
Pressure nominally 600kPa (87psi) minimum 450kPa, maximum 800kPa.
Consumption: <50 litres per hour at working pressure. Secondary air filter built in.
MEP (Casing) 316 Stainless Steel (optional other steel for corrosive applications) with Linatex on immersion section.
“O” Rings Viton
Analysis Tank Standard 300mm wide (1-15m3/hr): 316 grade stainless steel, unpainted, 3.0 mm thick without rubber lining. Optional, painted 3.0 mm mild steel with rubber lining. Optional larger tanks can be specified for higher flow-rates: Standard larger sizes are 400mm (up to 20 m3/hr) and 600mm (up to 50m3/hr).
Coatings Refer to Materials Specification, section 3.1
Stirrers The Company supplied 3-phase 0.25kW (standard) or 0.75 kW Helical Gear, with impellers to suit 300mm or larger size tanks. All stirrers have individual lockable isolators. Other stirrers may be specified depending on the tank size. Specific Data Sheets are provided in Attachment 1.
Dimensions Refer to equipment drawings in the Installation section for dimensions.
Weights MEP complete (excluding hoist): 60 kg MSA (6-stream) static weight = 1950kg Weight varies depending on size of the unit. Refer to drawings in Installation section.
On-Line Sampling and Analysis System (MSA) Technical Manual 3.1 3-6
3.3 Metallurgical Sampler Specifications
This section is only applicable if a Metallurgical Sampler has been supplied with the equipment.
3.3.1 AM643-300/400 Metallurgical Sampler
Type Linear horizontal cutter
Operation Modes Manual by individual switch or Calibration or Shift modes of operation, selectable from an Operator Interface (OI) panel on the MSA.
Isolator Individual isolators on each sampler. Isolator switch also initiates manual operation.
Drive Electric.
Motor 90W DC with integrated reduction drive.
Stroke 300 or 400 millimetres.
Cutter Type B horizontal fixed opening, 10mm wide, 250mm wide, 250mm long. Wear resistant polyurethane, 95 Duro.
Speed Up to 330mm/sec – selectable by DC voltage taps. Acceleration and dynamic deceleration take place over approximately 10mm at each end of stroke whilst the cutter is out of the stream.
Power Variable DC voltage up to 180 volts, bipolar, as delivered by controller.
Stalling Force 150 Newtons (motor protected by controller).
Weight 30 kg
IP Rating IP56
Table 3-4 Metal lurgical Sampler Speci f icat ion
Specifications Analyser Accuracy Data
On-Line Sampling and Analysis System (MSA) Technical Manual 3.1 3-7
3.4 Analyser Accuracy Data
Measurement Accuracies of the analyser system are given in terms of the Relative Error (error in chemical laboratory assays are also given in terms of this error but usually at 2 standard deviations (s.d.) or 95% confidence, whereas the analyser is at 1 s.d.).
100 x Assay Mean
Deviation RMS = Error Relative (%)
RMS Error (error at 1s.d, also known as the RMS Deviation) is the absolute difference between the analyser assay measurement and the accepted “true” laboratory assay for a suite of samples.
−∑ 1N
) y - x ( = Error RMS
2ii
N
=1i
21
N is the number of samples . x i i s the chemical laboratory assay of the i t h sample . y i i s the assay f rom the analyser of the i t h sample us ing the cal ibrat ion equat ion .
The Customer must ensure that all care is taken so as that these errors are insignificant so that the RMS Error truly represents the accuracy of the on-line analyser. It is therefore recommended that the chemical laboratory assays have an accuracy of better than one third (1/3rd) of the expected analyser accuracy.
Analyser Accuracy Data Specifications
On-Line Sampling and Analysis System (MSA) Technical Manual 3.1 3-8
Typical Expected Accuracies are:
Assay Range Typical Accuracy(Rel Err) of Analyser (%)
Elements in Slurries (%metal): 0.05-0.2 4 - 6 0.2- 1.0 3 - 5
1.0 –10.0 2 - 4 10.0 –80.0 1 - 2
Elements in Solution (metal): Above 10 g/L 1 – 2
1-10 g/L 2 – 4 1 mg/L – 1 g/L 3 – 6
Table 3-5 Typical Analys i s Accuracies
With any XRF analysis, the accuracy depends on:
• Particle size distribution • mineralogy • matrix variations of an ore type
The Precision of the analyser is defined as the degree of agreement between replicate measurements of the same sample. The Precision is the same as Repeatability . The Precision depends on the variation in the count-rates due to the random nature of the X-ray emissions. For sealed radioisotope sources, the X-ray emission is very stable. Additionally the counting statistics are monitored and reported as the Statistical Error . So that Precision is NOT a limiting factor in the overall accuracy of the on-line analyser, the calibration equations used typically have a Statistical Error of less than one half the RMS Error (at 1s.d.). Detection Limit is the minimum concentration that can be distinguished from the background measurement. Because background measurements are low with the “clean” radioisotope X-ray source used in the analyser system, the detection limit is typically much lower than the concentration to be measured and hence is not a limiting factor in the overall accuracy of the analyser. Detection Limit (at 95% confidence) is 2 times the standard deviation of the average background measurement. Performance accuracies for your analyser are provided in Attachment 2, Performance Specification .
On-Line Sampling and Analysis System (MSA) Technical Manual 3.1 Attachment 1
Section 3 - Specifications Attachment 1–Stirrer Data Sheets
This page is intentionally left blank
On-Line Sampling and Analysis System (MSA) Technical Manual 3.1 Attachment 2
On-Line Sampling and Analysis System (MSA) Technical Manual 3.1 4-1
4 Installation
This section is written for those personnel carrying out the physical installation of the equipment in the Customer’s plant. It is intended to be used by the Customer’s tradespeople and engineering contractors and is written on the assumption that the work will be carried out without the presence of a Company engineer. For some contracts the Company engineer may be required to be present to supervise some or all of the installation phase and for such cases any additional requirements are also listed. Attachments to the end of this section contain the Equipment List , Foundation and Installation Drawings and Diagrams and the Installation Checklist . The Parts List manual also contains detailed drawings and parts information that may compliment the installation process.
Warning: Electronic equipment is susceptible to damage by static
electrical charge. Handle components with care.
Caution: When arc welding near the analyser, ensure that good
earthing is used to prevent damage to electronic components.
Resources & Services to be Provided by the Customer Installation
On-Line Sampling and Analysis System (MSA) Technical Manual 3.1 4-2
4.1 Resources & Services to be Provided by the Customer
It is the responsibility of the Customer to provide the following resources during the installation of the on-line sampling and analysis system unless otherwise specified in the contract.
Tradespeople:
• Fitters and welders to carry out plant modifications such as pipe work, flooring, platforms, etc in order to accommodate the analysis equipment.
• Fitters and welders to carry out the physical installation of the sampling and analysis system metalware (MSA frame, tanks, pipe work to/from the tanks, probe carriage, etc.).
• Electrical Technician to install the electronic enclosures, and/or carry out power wiring and terminations as necessary.
• Instrument Technician to install data communications cabling, air and water supplies and carry out terminations.
Project Responsible Officer:
• The Customer should allocate a person responsible for the overall project and the installation of the equipment. This person is to report back to the Company for clarifications and complete and return the Installation Checklist (refer to Attachment 1).
Note: The Customer shall complete the Installation Checklist and return it to the Thermo Electron Project Manager, before an engineer is sent to site to carry out commissioning and calibration. Additional services required to be provided by the Customer if a Company engineer is required to be on site to supervise the installation includes: Messing/Transport: Provide suitable accommodation, meals and local transport for the Company engineers while they are on-site to supervise the equipment installation. Where appropriate, a hire car should be provided.
Installation Special Tools Required for Installation
On-Line Sampling and Analysis System (MSA) Technical Manual 3.1 4-3
Communications: Provide telephone/facsimile/email service to Adelaide, South Australia, from the installation site.
Safety Induction: Provide site-specific safety induction training for the Company engineers carrying out site work.
Safety Equipment: Supply any additional site-specific safety equipment or clothing required as part of standard site safety procedures. Thermo Electron will supply Australian Standard safety helmets, glasses, clothing and boots for their engineers.
4.2 Special Tools Required for Installation
No special tools are required to install the on-line sampling and analysis system. All tooling requirements are standard international metric size.
4.3 Customer Scope of Work
Some contracts require the customer to fabricate their own sampling equipment. It is the responsibility of the Customer to ensure that their scope of work for the project is completed in time to carry out the physical installation. Other work to be completed by the Customer includes: Pipe Work & Sampling Equipment Provide all piping between the sampling equipment (if samplers are used, otherwise just re-direct slurry piping) and each Analysis Tank and all pipe work from the Analysis Tank outlets back to the process streams. Sampling equipment is to be installed by the Customer where required to lower stream flow-rates. Access Provide adequate space around the MSA unit for maintenance access. Typically at least 1 metre should be allowed on all sides. Drawings provided in Attachment 2 indicate access space required. Cover Over MSA It is recommended that a roof be installed over the MSA if i t is to be installed outside or under slurry tanks that may overflow.
Special Tools Required for Installation Installation
On-Line Sampling and Analysis System (MSA) Technical Manual 3.1 4-4
Customer Scope of Work Installation
On-Line Sampling and Analysis System (MSA) Technical Manual 3.1 4-5
Lighting Provide adequate lighting around the analyser and electronics. When placing lights be aware that the electronics enclosure doors open upwards and that operators will be required to routinely view the slurry flowing through the analysis tanks. Lightning around the service bay is also important. Maintenance Drain A blanked, flanged outlet is provided at the bottom of each analysis tank. A tank can be drained by removing its blanking plate. Alternatively the Customer may install a valve on some or all tanks so they can be more easily drained for maintenance. Slurry Pipe Connection Each tank is fit ted with flanged slurry inlets and outlets to which the Customer connects plant slurry lines. Attachment 2 details flange locations and sizes. Power Supplies Provide power supplies for in-plant and central control equipment (refer chapter 3 and section 4.10 for general specifications). Your specific power details are in Attachment 2 of this chapter. Instrument Air Provide instrument quality air for the pneumatically operated MEP hoist (refer chapter 3 for specifications and section 4.8 for details). Water Provide a clean water supply for the MSA unit for probe wash down and water sprays. (Refer to chapter 3 for specifications and section 4.9 for details). Data Cables Provide and run a screened twisted pair cable for the AIN RS-485 multi-drop network (bus). This runs between each analyser (MSA or other) and the AM955 RS-232 to RS-485 Converter near the WinISA computer. Other AIN compatible instruments may also be dropped onto this bus. In some cases other network technology such as copper or fibre optical Ethernet may be used. This will require adapters like a Lantronix CoBox, fibre transceivers etc. (refer chapter 4 for further details).
Special Tools Required for Installation Installation
On-Line Sampling and Analysis System (MSA) Technical Manual 3.1 4-6
Locate Mechanical Assembly The MSA is often shipped in a partially knocked down state to allow for i t to fit in a standard sea freight container. The end bays and door guards and overhead gantry must be assembled on site. Parts are labelled to allow easy assembly. This can be done by the customer prior to commissioning or under supervision of a Company engineer during installation. Control Room A clean, relatively dust free, office type environment is required for the central control equipment (computer, peripherals etc). The operating temperature should be in the range of 15-32°C and the operating relative humidity should be in the range of 20-80% non-condensing. Liquid Nitrogen Provide liquid nitrogen (LN2) at a rate of about 10 li tres/week for each MSA in the plant. Refer to specifications provided by your local supplier of LN2 as boil-off rates for liquid nitrogen can vary depending on the type of container supplied and transfer method. Arrangements must be made for the continued supply of liquid nitrogen during the operating life of the analyser. The probe must never be allowed to run dry of LN2.
Warning: Always use LN2 of at least 99.5% purity. Lesser purity
increases the level of potentially explosive liquid oxygen levels inside the MEP dewar. Use only LN2, do not use substitute coolants. DCS/PLC Comms (Optional) The analyser software can distribute data using the Modbus protocol or OPC to a plant DCS or PLC Process Control System. The Customer will need to provide the data or network cabling between the computer and the DCS/PLC. There is no extra optional software to purchase, the option is whether or not to configure it . Telephone Modem Line (Optional) Provide a dedicated phone line for remote support from the Company. It is recommended that this be a data/fax quality line wherever possible.
Dimensions and Mounting Installation
On-Line Sampling and Analysis System (MSA) Technical Manual 3.1 4-7
Networked Computers (Optional) For any additional plant computers requiring connection to the analyser control PC for displaying assay data, the Customer shall provide the services of the plant network administrator to securely connect these to the system, the onus is on the Customer to provide network security. Generally, the customer is responsible for supplying the additional computer. Often office computers (e.g. in the Shift Supervisor’s or Metallurgist’s office) are used.
4.4 Dimensions and Mounting
Warning: DO NOT install the MEP detector (shown left) . This
device is the LN2 cooled component of the analyser and shall only be installed under the supervision of a Company engineer during commissioning. I t must be kept fil led with LN2 in a safe dry location. DO NOT pour LN2 into the MEP casing shown in figure 4-5 when the detector is not installed.
4.4.1 Mounting the MSA Section 4.7 provides details of the sampling requirements and slurry line connections to the MSA unit and subsequent sections provide details of power, air, water and data (signal) connection. A typical 6-stream MSA layout and tank section is shown in Figure 4-1 and Figure 4-2. Supply terminations are indicated in Figure 4-3. The MSA unit can be installed on the ground level of the plant so that the slurry streams can gravitate to it . Although, the MSA unit can be installed anywhere in the plant, i t is preferred that i t be mounted on a raised platform so that discharges from each analysis tank can be collected into the sump(s) of pump(s) or into a pipe or launder for disposal or return to its main stream. Alternatively, the MSA can be mounted at ground level if most sampled streams are to be gravity fed to the analysis tanks. Installation drawings for your MSA are given in Attachment 2 show the dimensions and mounting points of your MSA unit and indicate the supply termination points.
Dimensions and Mounting Installation
On-Line Sampling and Analysis System (MSA) Technical Manual 3.1 4-8
PRIMARY GRAVITY SAMPLER
FROM PLANT
STIRRER
TANK SECTION
RETURN TOPLANT
METALLURGICALSAMPLER
CALIBRATE/SHIFT SAMPLE
PRIMARY PRESSURE SAMPLER
RETURN TO PLANT
Figure 4-1 Typical 6-St ream MSA Layout
Installation Dimensions and Mounting
On-Line Sampling and Analysis System (MSA) Technical Manual 3.1 4-9
#5 T
ANK
#4 T
AN
K
#3T
ANK
#2
TAN
K
#1T
ANK
Figure 4-2 Typical MSA showing Locat ion of E lectronic Contro l Enclosures
Dimensions and Mounting Installation
On-Line Sampling and Analysis System (MSA) Technical Manual 3.1 4-10
Figure 4-3 Typical Ins tal lat ion Diagram for a 6-St ream MSA
Installing the Probe Carriage and MEP Installation
On-Line Sampling and Analysis System (MSA) Technical Manual 3.1 4-11
Warning: DO NOT lift the MSA by its frame, instead fit the special “lifting lugs” (see photo top left) provided for each frame end (refer to MSA installation drawing in Attachment 2). Once the frame(s) are in place remove the “lifting lugs” and fit one “end plate” to each end of the complete MSA (viz., only 2 “end plates” are fi t ted at the extremities, see photo bottom left). The MSA unit is usually delivered complete with electronic enclosures as shown in Figure 4-2, already mounted. Depending on shipping requirements, the analysis tanks may not be already mounted and so these will require bolting onto the MSA frame as per your installation drawing in Attachment 2. Figure 4-3 shows a typical 6-stream MSA unit complete.
Note: If your MSA has more than one 6 tank frame module, remove the Cable Duct (square) end transport covers at the join of the MSA frames before mounting the frames side-by-side.
4.5 Installing the Probe Carriage and MEP
After mounting the tanks, the probe carriage (see photo left and figure 4-5) needs to be mounted on the guide rail . The probe carriage is heavy (around 200kg without shroud or probe) and will need to be slung and lifted with a crane.
Caution: Take care not to damage cabling at the top of the carriage when slinging.
Installation Installing the Probe Carriage and MEP
On-Line Sampling and Analysis System (MSA) Technical Manual 3.1 4-12
If the MEP casing (upper and lower probe shroud) have not been shipped as part of the probe carriage, then these parts now needs to be installed into the carriage. The MEP upper (stainless steel dewar cover) and lower (leg) shroud (see Figure 4-4 and photos left) may have been packed separately and so require mounting in the probe carriage. The black anaconda probe cable will already be connected at the base-plate as shown in the photo, however, the other end of the cable must be terminated in the cable termination box on the probe carriage (see photo bottom left). The connectors will not be able to be joined at this stage if the umbilical cable has not yet been installed (see section 4.6).
Note: The MEP is the rugged stainless steel/rubber lined outside casing for the detector. The detector fits inside this MEP casing often referred to as the upper dewar cover and the probe lower shroud (leg). The detector is not installed yet.
LIQUID NITROGEN FILLER CAP
DEWAR COVER
Weight 60kg
PROBE BASE
LOWER SHROUD
WINDOW ASSEMBLY
Figure 4-4 Dimens ions and Weight of the MEP.
Installation Installing the Probe Carriage and MEP
On-Line Sampling and Analysis System (MSA) Technical Manual 3.1 4-13
F igure 4-5 MSA Probe Carr iage Assembly
Installing the Probe Carriage and MEP Installation
On-Line Sampling and Analysis System (MSA) Technical Manual 3.1 4-14
4.5.1 Procedure Before proceeding, ensure that the probe carriage is securely mounted on the MSA frame (see photo left). The procedure for installing the probe is as follows:
The reinforced black polyurethane base-plate containing
the black anaconda probe cable is to be set in the frame and bolted into place (Four M8 stainless steel hex bolts with nyloc nuts).
If not already attached to the black base plate, the lower shroud is to be bolted to the under side of the base plate using the 6 retaining bolts and two curved plates (see photo left). The probe is usually mounted so that i ts window is facing the control unit side of the MSA. The probe window orientation can be changed by loosening the 6 retaining bolts. The detector should not be in place when doing this.
Fit the window assembly.
Connect the loose end of the Probe Cable to the grey termination box on the carriage (see photo left).
This cable is supplied by the Company and consists of flexible anaconda type conduit containing five cables. Check that the power is off and connect the following five cables to the respective connectors in the termination box (see photo and bottom left).
• BNC signal cable • 9-pin cable for low voltage and alarms • MHV bias cable • 2 earth cables (white and green)
Fit the upper dewar cover to the black base plate and
lock down with the 8 stainless dome-head nuts and washers provided. Close the filler cap at the top of the dewar to keep dirt and moisture out.
Note: To fit the dewar cover, you may need to manually move the probe carriage to one end of the MSA frame. To do so, remove the fly-wheel cover on the motor drive assembly at the top of the carriage and turn the fly-wheel by hand (see photo left). Do not force the carriage. Replace the fly-wheel cover promptly.
Installing the MSA Umbilical Cable Installation
On-Line Sampling and Analysis System (MSA) Technical Manual 3.1 4-15
4.6 Installing the MSA Umbilical Cable
The main control cable for supplying power, air and water to the probe carriage is called the MSA Umbilical Cable. It consists of a number of signal and power cables as well as the air and water l ines to the valves located on the probe carriage (see photo left). If not already assembled, connect the overhead gantries and attach the diamond cable trolley rail . Five cable trolley wheels are slotted onto the diamond rail (refer to the installt ion drawings in Attachment 2). These trolley wheels support the looped umbilical cable (see photo left). The MSA umbilical cable is normally packed attached at the controller enclosure, then coiled up in the first tank. It requires careful mounting on the cable trolley. Loop the cable onto the trolley wheels so that you have five even sized loops.
Warning: DO NOT unravel the umbilical cable. Loop it carefully onto the cable trolley wheels so that if falls naturally into the loops already present in the cable. Fix the cable to the MSA frame and the end of the trolley rail at the tank #1 end of the frame as shown in the photo below left . The motor cable now runs directly from its AC Drive to the motor without passing through any intervening terminals or junction boxes. Also its copper screen is grounded at the AC Drive end only. See the following Figure 4-6 showing connection at the AC Drive end in the MSA controller
Installing the MSA Umbilical Cable Installation
On-Line Sampling and Analysis System (MSA) Technical Manual 3.1 4-16
Connect new screened motor cable direct to AC Drive terminals as shown. Use minimumunscreened length and connect yellow/green
screen wire to earth terminal at top of AC Drive
Figure 4-6 Wir ing Motor Cable – Umbi l ical Grade
At the motor drive assembly end (see photo left) clamp the cable into the half-saddle (supplied) on the carriage to hold the cable. Position this saddle roughly as in photo so it clamps on the heatshrink protecting the flexible conduit. Connect the wires to the motor as per the labelling of phases U, V and W. Take care that screening braid is not exposed where the sheath is cut and make sure it cannot contact any terminals or metalware.
Caution: Incorrect wiring of the phases may prevent the motor drive assembly from moving, or may result in the motor driving in the wrong direction. Inside the larger junction box, attach the control wiring conduit and terminate the various conductors on their same-named terminals. There is an earth wire with a ring tongue which should be clamped to the mounting plate under a screw (see photo left).
Installing Slurry Samplers and Pipe Work Installation
On-Line Sampling and Analysis System (MSA) Technical Manual 3.1 4-17
Attach the remaining conduit (the one with rectangular plate) to the left hand underside of the horizontally mounted box using the gasket supplied. Assuming the probe cable has already been installed as in section 4.5 then couple up all five connectors and slide the sleeving over the coaxial ones to cover them totally (see photo left). Then put the lid on and tighten the cover screws. The signal cables for movement, air (blue tubing) and water (green tubing) are terminated in the right hand side vertically mounted grey box (see photo left). All power/signal cables inside the grey box are labelled as shown in the photo bottom left.
4.7 Installing Slurry Samplers and Pipe Work
The slurry sampling and transportation system of a multiplexed analyser system is often the highest maintenance cost and downtime component. The maintenance costs and downtime can be minimised by careful design and implementation of this system. The following guidelines provide a brief discussion of the main issues which should be considered when designing and building this system. The Company can provide more specific details and can provide the detailed design of the system if required. The most important points are: • The number of additional pumps required to transport
the slurry streams around the plant should be minimised. Use should be made of gravity flow and line pressure wherever possible to transport the slurry to the analyser unit. Return lines should be ganged together and returned to the process via gravity flow where possible - often they can be dumped into a couple of pre-existing pump sumps on the ground floor of the plant.
Installation Installing the Slurry Samplers and Pipe Work
On-Line Sampling and Analysis System (MSA) Technical Manual 3.1 4-18
• The distance from the main streams to the analyser should be minimised. This will reduce blockages and the need for pipe replacement.
• The samplers, pipe work and analyser should be readily
accessible in case of maintenance. The following points provide a step-by-step method of designing the sampling and slurry transport system. 1. Determine whether the full flow of each stream can
pass through the analyser unit. The following table provides the allowed flow-rate ranges for the various analysis tank sizes. In many plants it is advantageous to pass the whole stream through the analyser because it avoids sampling errors which are inherent in sampling a slurry stream. However, for large streams it will be necessary to use a sampler to continuously sample the stream to provide the required flow-rate to the analyser unit . Later sections provide details on the most common samplers which can be used in various applications. Note that for frothy streams like concentrates, the froth factor must be taken into account when calculating the flow-rate and working out the size of analyser tank which is suitable. We normally recommend a froth factor of 1.5-2 for concentrates. For example a concentrate stream with a flow-rate of 20 m3/h and a froth factor of 2 has an effective flow-rate of 40 m3/h so it would require a MSA-600mm tank for full flow analysis.
Equipment Type
Recommended Range (m3/h) (l/min)
MSA - 240 tank 0.5 - 4.0 8 - 70 MSA - 300 tank 1 - 15 17 - 250 MSA - 400 tank 5 - 20 80 - 330 MSA – 500 tank 10 - 35 166 - 580 MSA - 600 tank 15 - 50 250 - 830
Installation Installing the MSA Umbilical Cable
On-Line Sampling and Analysis System (MSA) Technical Manual 3.1 4-19
2. Determine what type of sampler is best for each stream in consultation with the Company. The type of sampler used and the position of the sampler will determine where the analyser must be placed in the plant (see the next point). Therefore it may be necessary to look at a number of different options for the location and type of the samplers in consideration of the location of the analyser before making a final decision.
3. The location of the analyser (both elevation and plan
position) is determined based on: a. Enabling gravity flow to and from the analyser
for as many as possible of the non pressure sampled streams and;
b. Minimising the length of all of the gravity flow lines to and from the analyser.
c. Minimising the number of extra pumps required in the sampling delivery system.
d. Access requirements for both operation and maintenance.
e. General cleanliness of the intended installation area e.g. excessive splashing from above can contaminate shift sampler.
4. The pipe work should be designed to minimise
maintenance. Design rules are provided in section 4.7.3.
Note: The most important considerations are that the sampler provides a truly representative and unbiased sample of the slurry stream and that the sampler is reliable and is easy to maintain and use.
Installing the MSA Umbilical Cable Installation
On-Line Sampling and Analysis System (MSA) Technical Manual 3.1 4-20
4.7.1 Primary Samplers There are several types of primary samplers available and the particular type selected depends on the application. For primary sampling of pipes that transport slurry there are basically two common types of primary sampler and these are the type usually supplied with the on-line analyser equipment, if full flows cannot be measured:
In-line Pressure Samplers that are normally installed vertically after the pump discharge.
The sample stream flow-rate from a pressure pipe sampler is a function of:
1. the internal diameter of the sample nozzle (which can be changed);
2. pressure in the main line at the sample outlet and the pressure drop between the sample outlet and the analyser.
The internal diameter of the sample nozzle and the pipe-work between this and the analyser must be selected so that the Pressure Pipe Sampler will provide the required flow-rate which must not be more than the maximum allowable through the analysis tank.
and
In-line Gravity Flow Samplers that are a fixed cutter sampler fit ted in horizontal or near-horizontal gravity flow lines. Representative samples are extracted through vertical cutters.
A gravity type sampler (horizontal fixed cutter or launder sampler) is normally installed on a near horizontal slurry pipe or launder which is carrying the full slurry stream. The outlet from the sampler flows under gravity to either the analyser or to a pump which then pumps it to the analyser.
This type of sampler should be used in all gravity flow situations in a pipe where the sample can flow directly down to the analyser or where a pressure pipe sampler cannot be installed. A gravity sampler generally has a 50mm (2") NB sample outlet (flanged) and so a pipe line with the same or larger NB size should be used.
Note: Primary samplers supplied by the Company are to be installed along with any associated pipe work by the Customer.
Sampled
Flow
MainFlow
Sampled Flow
MainFlow
Installation Installing the MSA Umbilical Cable
On-Line Sampling and Analysis System (MSA) Technical Manual 3.1 4-21
Primary samplers provided by the Company or manufactured under design recommendations from the Company will incorporate valves and fit tings for back flushing the sampler in the event that i t becomes blocked. If applicable, drawings of the Primary Samplers are in Attachment 2.
Note: To aid maintenance, i t is highly recommended that the customer fits valves to the flanged outlets at the maintenance drain of each analysis tank in the MSA.
4.7.2 Slurry Pipe Connections to the Analysis Tank The Customer is to provide the slurry pipe lines to and from the analysis tanks and provide and install any sampling equipment that may be required for these slurry lines. The inlet and outlet pipes and flange sizes on the tanks are shown in the drawings provided in Attachment 2. All slurry inlet pipes (both horizontal and vertical) should discharge below the slurry level in the inlet section of the analysis tank, this avoids splashing that may generate air bubbles, particularly in frothy slurries. This inlet discharge pipe is already fitted in MSA tanks with flange type compatible with table ‘D’ Australian Standard and ANSI, or as specified in Attachment 2 .
4.7.3 Guidelines for Slurry Sampling Pipe Work If Primary Samplers or additional pipe work to transport the samples to the analyser are to be installed, the Company recommends the sampling pipe work is installed in accordance with our recommendations below.
Note: The Company highly recommends consultation with its engineers during the design of the sampling system to be used with the on-line analyser system as incorrect sampling system design may result in poor performance of the on-line analyser.
Installing the MSA Umbilical Cable Installation
On-Line Sampling and Analysis System (MSA) Technical Manual 3.1 4-22
Pipe Work Design Pipe work from the sample point to the analyser and from the analyser back to the process should be designed to minimise blockages and maintenance. The main requirements are:
1. To supply a sufficient flow-rate of slurry to the analyser.
2. The transport velocity must be high enough to avoid sanding.
3. Line/piping diameter must be large enough to pass the largest object in the stream.
4. Must be reliable with minimal maintenance. Pipeline Size The size of pipes is determined by the flow-rate required, the velocity required to avoid sanding, the pressure or head available to drive the slurry and the maximum particle size that needs to be transported. As a general rule of thumb, the minimum pipe size for pressure lines should be 3 times the maximum particle size going to the grinding circuit . For example, if this maximum particle size is 16mm, then the line size should be 3x16 = 48mm or 50mm NB. Slurry Velocity For Pressure Sample lines, the minimum slurry velocity in the line must be at least twice the settl ing velocity of the densest, largest particle of solids in vertical l ines. As a general guide, most base metals plants require a minimum line velocity of 1m/s. To allow for surging of the plant and for pump wear, a minimum of 1.5 m/s is normally used in designing the pipe work. With velocities above 1.5 m/s in small l ines, head loss increases rapidly so always keep line velocities as low as possible to minimise pumping power and to reduce wear. For gravity flow lines, the velocity should be at least 0.3 m/s to avoid settling and blockages. These lines should have the maximum possible slope to ensure this. The velocity of flow required to transport the slurry in the sample line depends on the particle size, the specific gravity, the percent solids (dilution) and the shape of the particles.
Installation Installing the MSA Umbilical Cable
On-Line Sampling and Analysis System (MSA) Technical Manual 3.1 4-23
A minimum slope of 5 degrees will usually cater for most products. However, the Company recommends the Customer performs test work or models their particular application to determine the minimum slope required for their particular product.
Installation of Pipe Lines The pipe work should be designed to avoid settling and blockages and should be self draining on plant shutdown. Sagging should be avoided. Not more than half a pipe diameter is recommended. The lines from a pressure sampler should reach the highest point soon after the sampler and then go steadily downhill from that point to the analyser unit . The line from a gravity sampler should drop vertically initially and then only go steadily downhill to the analyser. In all l ines avoid bends as much as possible and do not use sharp or small radius bends - only use long sweep bends. Particular care must be taken with supporting of non rigid pipe like HDPE (high density polyethylene).
Warning: Avoid tight bends in slurry pipe lines, as they will cause
regular blockages. Siphoning In some cases unwanted siphoning may occur so this should be engineered out if necessary. Sampling Pipe Line Length The sample line length should be minimised, particularly for coarse streams (i .e. , P8 0 +150 micron). Sampler Back Pressure The sample line should have less back-pressure due to friction and head losses than in the main line. This is required to ensure that a stagnation zone does not occur just upstream of the sample cutter in the main line, in which case the sampled stream would not be representative of the full slurry stream. This means the sample line must not:
1. rise as high as the main line (applies to Pressure Samplers only);
Installing the MSA Umbilical Cable Installation
On-Line Sampling and Analysis System (MSA) Technical Manual 3.1 4-24
2. have any constriction which has a smaller diameter than the diameter of the sample point i tself - the pipe diameter should preferably be slightly larger than that of the ID of the point of sampling but not so big that the flow-velocity decreases to a point where settling may occur;
3. have sharp bends (to minimise friction losses, wear and blockages) and should preferably have line-of-sight straight sections with a minimum number of curves with the largest reasonable radius of curvature.
Sampler Flushing Point For Pressure Samplers, a water injection point (pipe stub with fitt ing) should be provided just downstream of the sampler so that the l ine can be cleared by back-flushing with high pressure water in case of blockage. A valve is required on the stub and also on the sample line downstream from the stub. The pressure sampler design includes a flushing valve option. If a Gravity Sampler does not contain an inspection port which can be used for clearing the sampler i tself, then a water injection point (pipe stub with fitt ing) should be provided just downstream of the sampler so that the line can be cleared by back-flushing with high pressure water. A valve is required on the stub and also on the sample line downstream from the stub. The gravity sampler design includes a flushing valve option.
Note: Avoid using a valve to limit flow volume.
Installation Pneumatics
On-Line Sampling and Analysis System (MSA) Technical Manual 3.1 4-25
4.8 Pneumatics
Two pneumatic air cylinders are used in the MSA unit; one large unit vertically mounted on the probe carriage hoist and a second small unit for the probe safety latch, also on the probe carriage hoist (see photo left). Both of these air cylinders operate under automatic control; however they are completely enclosed behind the safety guards thus preventing any injury to operators. Because the safety guard door that allows access to these units is interlocked then all movement, including the pneumatic operation ceases when the door is opened and will only resume when the door is fully closed.
4.8.1 Air Requirement
Instrument quality compressed air is required at all t imes by the MEP probe hoist. Because the probe hoist acts as a safety device to protect the probe in the event of window rupture, a reservoir air supply is incorporated into the hoist design. In the event of failure of the air supply to the hoist, the probe will be raised from the slurry. Failure is deemed to have occurred if the air pressure drops below 450 kPa, controlled by an in-line pressure switch in the carriage assembly. Air Pressure Nominally 600 kPa (minimum 450 kPa, maximum 800 kPa)
Note: The Customer is to provide an air regulator if required. Air Specification Clean dry air to 0.1 microns and dew-point less than 2°C. Air Consumption Less than 50 litres per hour.
Note: The MSA will cease operation if an air failure or pressure drop to <450kPa occurs. An “AirF1” message will be displayed on the Operator Panel (OI) panel.
Pneumatics Installation
On-Line Sampling and Analysis System (MSA) Technical Manual 3.1 4-26
4.8.2 Air Connection A schematic diagram of the hoist air system and connections points are shown in figures 4-3 and 4-7. The photo left shows the air connector point where the blue tube is fitted.
Note: The Customer will need to provide the external air l ine and a male fitt ing in BSP or NPT standard for connection. Air Isolation Isolation is via a ball valve located at the air connection point as shown in your MSA installation drawing in Attachment 2.
Note: The hoist will raise automatically when the compressed air line is first attached to this system. It cannot be lowered until the pressure in the system reaches 450 kPa and the 24 volt power supply is present (i .e. Electronic Controller is turned on). One air connection from the main umbilical cable is required on the underside of the left side vertically mounted grey box (see photo left). The other blue tubing air l ines (see photos middle bottom) on the probe carriage assembly should already be connected. Check that they are by pulling gently on the tubing.
Installation Pneumatics
On-Line Sampling and Analysis System (MSA) Technical Manual 3.1 4-27
Figure 4-7 P iping and Inst rumentat ion Diagram for a Typical 6-
s t ream MSA.
Installation Water Requirement
On-Line Sampling and Analysis System (MSA) Technical Manual 3.1 4-28
4.9 Water Requirement
4.9.1 Water Requirement A clean water supply is required for washing the probe and suppressing froth. One water spray is supplied per analysis tank in each MSA. A spray ring surrounds the probe and sprays wash water on the probe as it is raised from the analysis tank.
Warning: A very dirty plant water supply may block the water sprays, particularly for probe washing, and incorrect probe measurements may result . Water Pressure 300 to 800 kPa Water Isolation Each supply to the analysis tanks and the probe washing solenoid have an isolating needle valve control. These are located at the water connection point – refer to MSA drawing provided in Attachment 2 and photo left. Water Consumption 10 to 20 litres per hour, depending on the number of tank water sprays in use.
4.9.2 Water Connection Plumb to the solenoid bank on the MSA frame via a ½ inch BSP fitting – refer to MSA drawing in Attachment 2 and photo shown left.
Note: There are no water pressure sensors on the MSA, therefore there are no “low water pressure” warnings. Visual inspection is required occasionally to ensure proper water spray operation (refer to section 8, Maintenance).
Installation Analyser (In-Plant Power Requirement and Connection
On-Line Sampling and Analysis System (MSA) Technical Manual 3.1 4-29
4.10 Analyser (In-Plant) Power Requirement and Connection
4.10.1 3-Phase Power Requirement Three phase (3-wire + earth) mains power supply is used for the in-plant analyser. Figure 4-3 shows the supply connection point to the MSA.
Warning: DO NOT power-up the electronics without the supervision
of a Company engineer. I t is the Customer’s responsibili ty to inform the Company of their mains voltages. The following voltages are supported: Three Phase 380/415/440/460 V at 48 to 62 Hz, optional 525 V. Tolerance The 3-phase supply will require a stabilised voltage constant to within ±10% and a frequency constant to within 2.0Hz because the associated electronics will be powered from this supply also, via an internal voltage transformer (to standard 240 volt 1-phase) and 6A MCB (Miniature Circuit Breaker). Voltage to earth shall not exceed
32 t imes the line to line voltage.
Three Phase Earthing No special requirements are necessary due to the electronics being housed in “Faraday” screening metal boxes. Nominal maximum impedance to earth of 1 ohm is recommended. A neutral conductor is not required. Maximum Power Consumption 3-stream MSA with standard 250W stirrers = 1.8kW 6-stream MSA with standard 250W stirrers = 2.9kW 9-stream MSA with standard 250W stirrers = 3.8kW (Refer to manufacturer 's specification for non-Company supplied stirrer motors). Current variation: 5-15 amp
Installation Analyser (In-Plant) Power Requirement and Connection
On-Line Sampling and Analysis System (MSA) Technical Manual 3.1 4-30
Note: Allow an extra 500W per stirrer if using 750W stirrers in larger tanks. Power Failure In the event of a power failure, the MEP will be automatically raised from the slurry by the pneumatic hoist . When power resumes, the MSA will preform a self-test, then resume normal operations automatically provided there were no problems prior to the power failure (such as air pressure fail) .
4.10.2 3-Phase Power Supply Termination Power cable is to be drawn through the steel inlet on the underside of the main controller shown in figures 4-3 and 4-8 (installation drawings for your MSA in Attachment 2). Terminate the power wiring in the controller as indicated in Figure 4-8 and as per your installation drawings in Attachment 2. All internal wiring is pre-wired by the Company with the exception of MSAs with 2 frames, which will require cables from frame 1 (tank 6) of the MSA to be drawn through the duct and terminated as per the associated wiring terminal numbers in the 2n d frame. Wires and screw terminals are numbered for ease of termination. This termination may be carried out under the supervision of a Company engineer or the Company can provide assistance if required. Use of a “cable snake” is recommended and length of tube is suppled for this purpose.
Installation Central Equipment Required
On-Line Sampling and Analysis System (MSA) Technical Manual 3.1 4-31
F igure 4-8 “Example” E lectr ical Enclosure and Connect ions
Central Equipment Required Installation
On-Line Sampling and Analysis System (MSA) Technical Manual 3.1 4-32
4.11 Central (Computer) Equipment Requirements
The central equipment supplied is to be installed in a clean dry room such as an operator control room or a specialised control equipment room. No physical mounting of the central equipment is required, only sufficient desk-top space so that the computers and keyboards are readily accessible. The printer and the RS-485 to RS-232 Converter unit are to be sat as close a possible to the master computer.
Warning: DO NOT unpack and install the computer equipment and
peripherals. This will be done during Commissioning by the Company Engineer.
Note: Provision must be made for the plant operators to view and access on-line display screens either on the master computer or on additional networked PCs or via a connection to a process control system screen. A Company supplied computer will have the operating system and WinISA software already loaded. Otherwise, the software will also need to be loaded first, before it can be configured and this will be done by the Company engineer on-site, during Commissioning .
4.11.1 Single-Phase Power Requirement and Connection Power Requirement 110 - 240V, 50-60 Hz single-phase stabilised. Some Company supplied systems include an Uninterruptible Power Supply (UPS), if not, i t is recommended the customer provides UPS power for the central equipment.
Installation Central Equipment Required
On-Line Sampling and Analysis System (MSA) Technical Manual 3.1 4-33
Warning: Unstable power may cause intermittent operational
problems with the computer. In such cases the Customer should provide conditioned power or at minimum an Uninterruptible Power Supply (UPS). Minimum Number Power Outlets Six (6). Generally a 6-way surge protected distribution board will be supplied with the central equipment when the Company supplies the central equipment.
Maximum Power Consumption Computer/Monitor: 850 VA Printer: 115 VA (intermittent) Data Interface Unit: 60 VA Modem: 20 VA (allow for extra capacity if two computers are used) Termination Standard Australian Power Plugs
Note: All Company supplied central equipment will have standard Australian power plugs. The onus is on the Customer to provide adaptors or power cables suitable for their country.
Instrumentation (Data) Cabling Installation
On-Line Sampling and Analysis System (MSA) Technical Manual 3.1 4-34
4.12 Instrumentation (Data) Cabling
The field components of the on-line analyser system and other instruments communicate with a master ISA computer over the AIN, a robust industrial data communications network based on the EIA standard RS-485. The hardware and software protocol specifications pertaining to the AIN have been developed by the Company.
Each device connected to the AIN is called a node. Some instruments are (internally) two nodes. At least one node will be a master interface which connects the AIN to the Thermo Electron WinISA computer system. The master interface may be a simple (AM955) RS-232 to RS-485 converter located near the computer or it may be one or more Ethernet to RS-485 “thin servers” (e.g. COBOX) located at points where the AIN and a plant-wide network (LAN) overlap. As a third possibility, the master interface may be quite remote from the WinISA computer, being linked back to it by some other media such as fire optic cable or spread-spectrum wireless technology. Due to the wide variety of devices that are available from many different vendors, this document will not attempt to describe how to connect any one of them. Suffice to say, any suitable device will have three terminals nominated for RS-485 use. Refer to the manufacturer’s li terature for connection details.
Note: The Customer must provide and run a screened twisted pair data cable using the guidelines given below. Details specific to your installation are provided in Attachment 2.
Note: In-Plant analysers must communicate with the master ISA computer which in turn interfaces to the plant PLC or DCS. Direct communication from Thermo Electron in-plant analysers to DCS is not possible.
Installation Instrumentation (Data) Cabling
On-Line Sampling and Analysis System (MSA) Technical Manual 3.1 4-35
Note: Although there are other manufacturers of RS232 to RS485 converter units, the Company strongly advises against using these in-place of the AM955.
4.12.1 General Specification for the Data Cable The physical arrangement or topology of the data network is that of a l inear multi-drop two wire bus which winds its way around the plant, starting and ending with a terminating resistor. Essentially the data cabling requires a single twisted pair and a third wire preferably in the form of a metallic screen as in screened twisted pair (STP) cable. This section mainly refers to the actual installation of the copper wiring between the devices. Ideally two pairs should be laid so as to allow an extra pair as a spare or for future expansion options of the equipment. Therefore, i t is recommended that two (2) pair, twisted pair cable with an overall screen is installed although one pair is adequate. The screen is to be connected to the common terminal at the RS-485 “Data” connector provided on the Thermo Electron equipment. The common terminal of field devices are isolated from earth and provide a signal reference for the RS-485 transceivers. Conductor Size Each conductor of the twisted pair cable should have a minimum diameter of 0.5 mm (about 0.2 mm2). Heavier cable is often used for durability. Industry standard STP (Screened Twisted Pair) cabling as frequently used for 4-20mA current loops is generally quite suitable. Refer to the cable specification section following. Maximum Length The total length of the AIN bus from termination resistor to termination resistor can be up to 1.2 km using the cables recommended below. Maximum number of Devices (Nodes) Due to electrical loading constraints, there should not be more than 32 nodes (or devices if they are a single node) on any one network segment. This number includes the master computer interface. Note that some Thermo Electron analysers actually have two nodes, this includes MSAs. This is not the case for MEPs used in dedicated and skid mount configurations.
Instrumentation (Data) Cabling Installation
On-Line Sampling and Analysis System (MSA) Technical Manual 3.1 4-36
Note: There can only be one ‘master’ device addressing or controlling the ISA devices. If your want to have two ISA computers in a “Hot Backup’ configuration you must either: 1. Unplug the AM955 and move it the other computer
when it becomes the master, or: 2. Use a CoBox. Refer to the Software Manual for
configuration details. The absolute limit, based on logical addresses available, is 253 nodes.
4.12.2 Recommended Cable Specification for Data Network Instrumentation cable, with two twisted pairs, overall screened, conductors of about 0.5 mm2 (7/0.30) are recommended. Individually and overall screened, steel wire armoured cables, and larger conductors are also suitable. This cable can be supplied by Olex Dekoron, MM Cables, Pirelli , and others, where equivalent.
Manufacturers Code Cable Description Olex Dekoron MM Cables Pirelli
Two pair, overall screened. IEC183AA002 B5002 CS PE0 02C Two pair, individual and overall screened.
IED183AA002 B5002 ESCS PE0 02IC
Two pair, overall screened, steel wire armoured
IEG183AA002 B5002 CS SWA PE0 02CA
Two pair, individual and overall screened, steel wire armoured.
IEH183AA002 B5002 ESCS SWA PE0 02ICA
Table 4-1 Recommended Cables for Interconnect ing Devices
4.12.3 Terminating the Data Cable
Two 20mm diameter holes for data cable entry (and exit for data cable extension) are provided on the left hand underside of the right side control enclosure on the MSA (see Figure 4-8). This controller also contains the Signal Analyser (see photo left) where the data cable is to be terminated. The data cable is to be drawn through the cable entry hole and into the enclosure then terminated at the 3-way screw type terminals provided in the top right hand corner of the Signal Analyser (Refer to Figure 4-9).
Installation Instrumentation (Data) Cabling
On-Line Sampling and Analysis System (MSA) Technical Manual 3.1 4-37
Figure 4-9 S ignal Analyser Chass is Layout Central Equipment
Requirements
Instrumentation (Data) Cabling Installation
On-Line Sampling and Analysis System (MSA) Technical Manual 3.1 4-38
Note: The data cable is an extension of the cable installed for other analysers if more than one analyser unit is being installed in the plant. The last instrument (device) on this network must be terminated with a 120 ohm resistor at the “Data Out” terminal. Cable Termination The data terminations on Thermo Electron equipment consists of a terminal block with three connection points. Usually all three terminals are duplicated so that only one wire has to be inserted in each terminal. In some cases the terminal blocks are of the removable plug type. Consistent labelling is used and assuming the cable used has black and white insulated conductors, terminals should be wired as follows at all devices:
White
D+
Black
D-
Screen
S, SCR, or COM
Termination Resistor In order to prevent degrading signal reflections, each end of the AIN bus should be terminated with a 120 ohm 0.25 watt non-inductive resistor, connected across the D+ and D- conductors. Suitable resistors are included with the Thermo Electron equipment already fitted to the appropriate terminal blocks. There must be no more than two resistors on the bus. Surplus resistors should be discarded. Figure 4-10 shows how and how not to terminate the bus. Stubs Any piece of cable which forms a T-junction with the bus is called a stub. Although in practice the bus is usually made up of several sections of cable joined in series, the bus should effectively appear as one continuous length of cabling and there should be no stubs on the bus exceeding 5 metres in length (see Figure 4-10).
Connect Data “In” wires here
Connect Data “Out”wires here terminatewith 120 ohm resistor as shown
OR
Installation Instrumentation (Data) Cabling
On-Line Sampling and Analysis System (MSA) Technical Manual 3.1 4-39
Shared Cables If the AIN is to be incorporated with other wiring in a multi-pair cable for all or part of i ts length the following must be taken into account. Firstly, all circuits in the cable must be paired, screened or coaxial and carrying only low level signal such as data, phone, current loop or other instrument signals. If the AIN pair is separately screened from the rest of the cable then the connection method is self evident. Otherwise, i t will be necessary to provide for the third AIN (common) wire. This can be done by dedicating another pair for the purpose or if a triple (three wires twisted together) is available, this may be used quite successfully. Take care that the screen is not grounded or connected to the overall screen at any point.
Instrumentation (Data) Cabling Installation
On-Line Sampling and Analysis System (MSA) Technical Manual 3.1 4-40
The AIN Bus1200m (max)
120R 120RSTP Cable
AIN Devices (32 Max)(Master may be in any position)
Example of correct wiring of the AIN bus
Note that any node can be in any position on the bus. This includes the masterinterface (eg AM955 or a Cobox). These are often at one end but that is not required.Such nodes may not have IN and OUT terminals, however the conductors are simplyconnected in parallel in that case.
Any stubs must notexceed 5m in length
120R 120R
Showing a stub on the AIN
Termination resistorsmust be at both ends!
120R 120R
Wrong termination of the AIN
Figure 4-10 AIN Data Cable Terminat ion
Installation Instrumentation (Data) Cabling
On-Line Sampling and Analysis System (MSA) Technical Manual 3.1 4-41
4.12.4 High EMI (Noise) Environments Where known sources of high frequency electromagnetic interference (EMI) exist (eg. electrostatic and magnetic separators and variable speed drives or “inverters”) in the plant i t is recommended that some form of overall screening is used in addition to the shield included in the AIN cable. This overall screen can optionally take the form of screwed or flexible metal conduit, steel wire armour (SWA) or an overall copper braid or aluminium foil (with drain wire). It must not be connected to the inner screen. In all cases the outer screen must be grounded and firmly connected to the outside of the equipment enclosure. The explanation for this is that we have to avoid carrying noise currents inside the enclosure where they may radiate and thus induce noise into the sensitive circuits therein. The RS-485 interface is optically isolated to 2000 volts but radiated noise carried along the outer conduit or screen should not be allowed to enter the enclosure.
4.12.5 Proximity to Power and High Voltage Cables
Due to high noise immunity of the data network, as explained above, EMI from adjoining cables will not generally affect communication on the bus. Never-the-less the user has to take into account the possibility of abnormal noise sources and local wiring regulations in regard to insulation and/or separation of high and low voltage cables. Such considerations may require that the data cables are laid in a separate duct or cable tray, and about 1m apart, or that a higher quality cable is used such as the SWA cable listed in Table 1.
4.12.6 Use of Fibre Optic Cable Where there is l ikely to be an extremely high level of EMI consider using optical fibre for some or all of the AIN segments. There are a number of third party products able to extend an RS-485 network using either one or two fibres. The Company is able to provide these products or indicate how you may obtain them. Lantronix Cobox Adaptors are available with copper or fibre optic E thernet to RS-232/485 functions. They allow the WinISA Server computer to communicate with the In-Stream Analyser controllers in the plant over the plant network. A network connection using copper wiring (10base-T) with RJ45 connectors or ST type Fibre Optic connectors must be made to the In-Stream Analyser controller enclosure, where it is terminated at the Cobox. The Cobox communicates in turn with the In-Stream Analyser using RS-485. Various configurations can be tailored at the time of ordering the ISA System.
Instrumentation (Data) Cabling Installation
On-Line Sampling and Analysis System (MSA) Technical Manual 3.1 4-42
On-Line Sampling and Analysis System (MSA) Technical Manual 3.1 4-43
Section 4 - Installation Attachment 1 – Equipment Data Sheets
CONTENTS
Equipment List
Installation Checklist
This page is intentionally left blank
On-Line Sampling and Analysis System (MSA) Technical Manual 3.1 4-45
On-Line Sampling and Analysis System (MSA) Technical Manual 3.1 5-1
5 Commissioning
This section is written for those personnel carrying out the post-installation and pre-calibration inspection, testing and set-up of the equipment in the Customer’s plant. It is intended to be used by the Company engineer along with plant personnel. During this stage significant hands-on training can be obtained by plant personnel. The work carried out usually takes between 1 and 5 days, depending on the size of the analyser system and includes mostly the tasks in the order shown below: 1. Inspecting the physical in-plant installation work and
advising of any required modifications, particularly with the sampling tanks, stirrer mounts and pipe work.
Note: It is important that any installation modifications are completed without delay; otherwise significant delays in the commissioning and calibration can lead to extra costs for lost t ime on-site. 2. Confirming power supply voltages and connections
with the site electrician before powering up. DO NOT power up here.
3. Checking MEP and hoist cable terminations.
4. Confirming air supply and connection with site personnel.
5. Confirm water supply and connection with site personnel.
Commissioning
On-Line Sampling and Analysis System (MSA) Technical Manual 3.1 5-2
Note: The MEP bias will not ramp up and the MEP cannot be electronically lowered on the hoist until the computer is powered up and communicating with the analyser. 6. Setting up, powering up and configuring the computer
and its software and completing AIN Data Cable terminations. Refer to section 5.3 for further details.
Note: It is most important that the data cable has been laid prior to the commissioning phase, between the in-plant equipment and the computer, even if not actually terminated. 7. Powering up the in-plant equipment with the site
electrician present. Refer to section 5.5 for further details.
8. Adjusting hoist air pressure settings if required. Refer to section 5.6 for further details.
9. Check MSA safety interlocks.
10. Installing the MEP detector into the analyser and topping up with LN2. Refer to section 5.6 for further details. Only install the probe when you are sure the safety interlocks work.
11. Calibrating LN2 Sensor electronics. Refer to section 5.8 for further details.
12. Checking and testing the MEP electronics operation against factory settings with a standard. Factory settings are provided in Attachment 2. Refer to section 5.9 for further details.
13. Adjusting MEP electronics settings to suit plant slurry properties and customer requirements where needed. Refer to section 5.9 for further details.
14. Stability testing the system against a standard overnight or for about 12 hours. Refer to section 5.10 for further details.
15. Where fit ted, checking the operation of the Metallurgical Samplers. Refer to section 5.11 for further details.
Commissioning Resource to be Provided by the Customer
On-Line Sampling and Analysis System (MSA) Technical Manual 3.1 5-3
The following sections provide procedures and details for most of the required work.
5.1 Resources to be Provided by the Customer
1. (Usually) Plant Metallurgist should be available intermittently throughout commissioning phase to;
a) Ensure/advise on plant operation
b) Receive training from TGM engineer – operation/maintenance/calibration
c) Assist TGM engineer with calibration of the MSA
d) As required by TGM engineer
e) After commissioning- maintain calibration / often the “perceived owner” / develop a plan or algorithm for effective plant control using the MSA’s assays.
2. Met Lab facilit ies and personnel
3. Assay lab facilit ies and personnel
5.2 Special Tools & Equipment Requirements
The following special i tems are required:
1. Toolbox containing special tools and consumable items necessary for the analyser (Attachment 1).
(With every analyser system a toolbox is supplied which contains essential consumable items and special tools needed to commission and maintain the analyser system.)
2. Multi-Channel Analyser (MCA) with Australian power cable/plug and BNC signal cable.
(An MCA is required to set up the signal analyser electronics but is not always supplied with the analyser as it is an expensive piece of equipment that is used infrequently. The Company Engineers carry an MCA.)
NORLAND 5500 MCAO FF O N
VIKING INSTRUMENTS
VERTICAL SCALE
HORIZONTAL SCALE
CURSOR
ZERO ULDLLD
AMP GAIN
INPUT
SE TUP COMPUTE PROG + 7 8 9
OPTIO NS DISP LAYGOESINTO==> - 4 5 6
CONT CANCEL CLEARNUM X 1 2 3
RU N TERM ÷ EX P 0 .
CONVGAIN
OFFS ET
AMPDIRE CT
Mechanical Checks Commissioning
On-Line Sampling and Analysis System (MSA) Technical Manual 3.1 5-4
5.3 Mechanical Checks
The following important mechanical inspection checks must be done on the MSA before proceeding with installing the MEP detector: • Check that the probe carriage is sitt ing on the guide
rails properly. All carriage rollers must be touching the guide rails (see photos left). There are 4 x 75mm diameter wheels and one larger driven wheel.
• Check that there is clearance between the rear of the probe carriage and the guide rails. The carriage frame must not touch the guide rails – only the rollers (see photo left).
• Check that the cable trolley rail is fit ted as per the installation diagram in Attachment 2 and that all cable hooks are installed.
• If not already fitted, fit the umbilical cable onto the cable trolley by looping the cable evenly from the end tank first through to the probe carriage. If i t has been fitted, check that i t is looped correctly and if not fix it now before proceeding as any undue flexing of the cable may damage it (see photo left).
• Visually check that no cables, air or water l ines will obstruct the movement of the probe and carriage.
• Check that the air supply if correctly connected at the inlet and the pressure is at least 450 KPa. Do not open the ball valve yet. Check that the blue plastic airlines have been fitted to the air solenoid connectors on the probe carriage (see photo left). Try pulling on them to ensure that they won’t come out. If they do then they haven’t been fitted properly and it must be fixed. Check the Air Reservoir drain ball valve is closed If all air connections are okay then it is safe to open the ball valve (see photo left). The probe will raise so do not get in the way of i t . The air pressure should now be indicated by the gauge on the top of the air cylinder on the probe carriage (see photo top left).
• Check that the analysis tanks are evenly spaced along the MSA frame and bolted down to the frame too.
Commissioning Mechanical Checks
On-Line Sampling and Analysis System (MSA) Technical Manual 3.1 5-5
• Check the alignment of the each proximity sensor on the guide rail . Each sensor should be centrally located within the width of its analysis tank (see photo left). There is one sensor per tank and then an extra one on each end of the guide rail to sense when the probe reaches the extremities (these are the limit switches). If a service bay has been supplied, then another sensor will be centrally positioned within that space.
• Check that each stirrer has been mounted correctly so that i ts impellor does not touch the bottom or sides of the tank. Also check that the impeller is bolted on firmly to its shaft to prevent i t fall ing off in the slurry.
• Check that water has been plumbed to the MSA water inlet at the ball valve on the bottom of the manifold (as shown in photo left). Also check that the green plastic water l ines have been correctly connected at the solenoid on the probe carriage and again at the carriage spray ring and the tank water sprays. Pull on the green plastic l ines to check that they have been connected properly, if not then fix before turning on the water supply.
• Check that the “End Plates” have been bolted to the end of the MSA frame (see photo left) . These are essential to prevent the probe carriage “falling” off the end of the guide rail if a major carriage drive fault occurs.
• Turn the stirrer shafts by hand to check that they operate clear of obstruction. Check the four grub screws are tight onto the collar using a 3mm Allen key. If the stirrer motors have a breather, check they are open.
Setting up the Computer and Data Cable Terminations Commissioning
On-Line Sampling and Analysis System (MSA) Technical Manual 3.1 5-6
5.4 Setting up the Computer and Data Cable Terminations
All central equipment is packed separately from the main equipment and should not have been unpacked during the installation phase. Whether or not i t has, i t is most important that the packing list supplied with the crate/box be checked off against the actual supply. This must be done by the Company engineer in the presence of the Customer. Once all equipment is accounted for, the computer, monitor, printer, modem and data interface unit shall be unpacked and set-up on a table or bench in the area allocated by the Customer. Connect up all components and power them up. The computer, if supplied by the Company, will already be configured for the analyser system. If not, the software will have to be loaded and configured before commencing in-plant equipment power up. Follow the procedures in the Software manual . Terminate the AIN RS-485 data cable in the control room via the “RS-485” screw type terminal in the back of the Converter unit (refer to figure 5-6). Also, check that the data cable has been properly terminated (no crossed over wires) in the Signal Analyser out in the plant too. Connections should be D+ to D+, D- to D- and SCRN to SH. Note that SCRN, SH and COM are interchangeable names. The Converter unit is then linked to the computer using the supplied 2 metre RS-232 shielded cable.
Commissioning Setting up the Computer and Data Cable Terminations
On-Line Sampling and Analysis System (MSA) Technical Manual 3.1 5-7
Figure 5-1 AM955 Converter (Data Inter face) Uni t
Powering Up the In-Plant Equipment Commissioning
On-Line Sampling and Analysis System (MSA) Technical Manual 3.1 5-8
5.5 Powering Up the In-Plant Equipment
Essential checks before powering up:
• The mains power terminations are correctly installed and correct voltages are supplied (check with the plant electrician).
• The (orange) mains power switch in the Signal Analyser (left) is turned off.
• Ensure that all the cards and modules inside the MSA control units are firmly in place.
• Turn off the Bias switch (see photo left) on the Bias supply module in the Signal Analyser.
• The lockable Mains Isolator is turned bottom on the front panel main MSA Controller (see photo left) . The door must be closed to do this.
• The probe shroud is firmly mounted in the probe carriage and the carriage is sit t ing correctly on the guide rails.
• The “End Plates” are firmly bolted on each end of the MSA frame (see photo left) .
Warning: If the end plates are not in place when the probe starts moving horizontally, i t could fall off the end if a proximity sensor fails.
• Ensure the MSA umbilical cable is free to move along its guide rail .
The electrician can now switch the mains power to the MSA (Refer section 5.5.1).
Commissioning Powering Up the In-Plant Equipment
On-Line Sampling and Analysis System (MSA) Technical Manual 3.1 5-9
5.5.1 Powering Up the MSA On powering-up the MSA, a “Position Test” needs to be performed. To do this, at the OI panel (see photo left), select the menu option <AutoMode> to put the MSA into automatic control. Make sure the interlocked guard door is closed. The probe will now move horizontally through the zones. This automatic procedure self-tests that the MSA lateral movement and position sensing components (proximity sensors, l imit switches, etc), probe movement, carriage drive motor, etc. , are working. If a failure is detected an error message will be displayed on the operator interface OI panel and at the computer “Failed to Position Test” or similar specific message. Refer to Chapter 9, Trouble Shooting for details.
Note: If the MSA has lost i ts operational embedded code (ANI Code) then it will not perform a position test but will instead display a message on the OI panel indicating that i t is trying to down-load the required code from the controlling computer. If this happens then check that the computer is powered up and the WinISA Server is running (see section 5.3 and below). If a “WndRpt” message is displayed on the OI panel of the MSA then check that the Alarmed Window Assembly is properly fit ted in the MEP and that all cables terminations on the detector and in the Signal Analyser Chassis are firmly connected. The 2 wire fingers on the contact assembly (see photo left) must make contact with the rear of the window assembly. The window must also be inserted so that it is flush with the head. If the MSA does not go into a “Position Test” when powered up then the RLC may have lost i ts firmware configuration, in which case you will need to follow these steps; 1. Re-enter the RLC Zone Mask (<ZneMask>) for your
MSA (this is provided on installation by the Company or it can be found in the section covering the OI RLC menus) in chapter 7, Operation .
2. If you have metallurgical samplers then you will also need to enter the RLC masking for these by selecting the menu option (<SMPMask>).
3. Re-enter the available zones, i .e. the zones, 1 to 12 that you want to measure (<ZneAvail>, see OI RLC menu section) in chapter 7, Operation .
Powering Up the In-Plant Equipment Commissioning
On-Line Sampling and Analysis System (MSA) Technical Manual 3.1 5-10
4. Check the (Service Bay) has been correctly set, usually it is the last zone. If you prefer a different zone, enter it here. Note: If your application code is an earlier version number than M221, the service bay default is 99, which is past the forward limit switch. If you have pre M221 code and no dedicated service bay past the forward limit switch, you must enter a valid stream (zone) number as the service bay, otherwise a position test may fail with the message ‘stuck at last zone’. Check the application code version in the <Debug> screen on the OI.
5. If you want the MSA to resume normal operation automatically after a power failure, check now that <AutoStart> has been set to YES. Now select <Automode>.
6. Re-set the RLC (<ResetRLC>), the MSA should then perform a “Position Test”, if not turn off then on the MSA power. If a “Position Test” is stil l not possible, then check the OI panel display for any error messages. If an error message is displayed that indicates there is information being down-loaded then this means the RLC is obtaining its embedded code (ANI code) from the ISA computer, of course this can’t happen if the computer is down, or the data line between the MSA and computer (or converter unit) is faulty, in which case the RLC will try indefinitely to obtain the ANI code it requires so check the ISA computer and data comms (AIN).
Note: When ANI code (application code) is being downloaded from the computer the TXEN, RXD and TXD LEDs will flash on the AM955 converter unit (see figure 5-6). Also the LEDs on the AM092 card in the signal analyser will flash at the same time as the AM955 unit (see Figure 5-2).
Commissioning Powering Up the In-Plant Equipment
On-Line Sampling and Analysis System (MSA) Technical Manual 3.1 5-11
5.5.2 Powering Up the Signal Analyser
The Signal Analyser is the probe control electronics and its electronics chassis is mounted in the top right hand corner of the Controller (see Figure 5-3 and photo left). Providing the probe BIAS switch is OFF then power up the Signal Analyser by pressing the POWER button (see photo left). The orange coloured POWER button and the red LN TEST button to its right should light up initially then extinguish after about 15-20 seconds. If the LN TEST button does not extinguish of its own accord within the first minute, and there is LN2 in the probe, then the LN2 Sensor needs to be adjusted and this procedure follows in section 5.8. The Bias cannot be applied to the probe when this LED is red. For normal operation, no red lamps (eg LN TEST , WR TEST or HOIST RESET ) should be on provided the computer is running; however, if the probe is fully raised then the HOIST RESET button will be li t red and will only extinguish when the probe is lowered into the slurry. There may be other red LEDs on depending on the reason for the hoist being raised.
Note: If the WR Test button is l i t red then check the WR circuit continuity and check that the metal (wire) fingers on the bottom of the detector, see Figure 5-8, are making proper contact with the inside edge of the Window Assembly.
Powering Up the In-Plant Equipment Commissioning
On-Line Sampling and Analysis System (MSA) Technical Manual 3.1 5-12
Figure 5-2 S ignal Analyser Chass is Layout
Commissioning Powering Up the In-Plant Equipment
On-Line Sampling and Analysis System (MSA) Technical Manual 3.1 5-13
Figure 5-3 “Example” MSA Contro l ler Chass is Layout
Powering Up the In-Plant Equipment Commissioning
On-Line Sampling and Analysis System (MSA) Technical Manual 3.1 5-14
Note that on power up the red LEDs on the AM092 card in the Signal Analyser may blink for a few minutes while i ts memory chip retrieves the latest application code from the computer. Once finished, the TX (second from top) and RX (third from top) LEDs on the AM093 card (shown left) should flash about every minute. This is normal operation.
Note: If the four red LEDs continue to blink in unison for many minutes then check the data communication cable and terminations between the in-plant equipment and the computer. Also check the AIN code being used in the software too (refer to the Software User Manual).
5.5.3 Applying HV Bias to the MEP Providing the mains power is on at the Signal Analyser and the LN TEST button is not li t red then, switch the power to the MEP ON by setting the following switches in the Signal Analyser:
BIAS VOLTAGE on the AM963 (shown left) to ON PROBE/INJECT to PROBE
The BIAS ON LED should light red as the bias voltage comes up initially at 30 volts. This is enough to start up a normal detector and within 5-10 seconds the OPTICAL RESET LED should light. It may be either red or green or alternating both colours. The BIAS ON LED should begin to blink red as the bias is slowly increased to the voltage set on the dial to (-)500 volts. Wait until both LEDS turn green . The OPTICAL RESET may settle to a flashing or flickering green, depending on incident X-ray intensity. Now it may be assumed that the bias is stable at the operating potential. Once both LEDs are green the electronics and MEP are operating normally and you are ready to proceed with other system checks and testing.
Commissioning Powering Up the In-Plant Equipment
On-Line Sampling and Analysis System (MSA) Technical Manual 3.1 5-15
Warning: If the Bias LED stays red then the detector pre-amp/voltage feed-through may have moisture in it . The moisture will normally dry out after a few hours or overnight, providing the LN2 fill ing cap is clamped down and the foam Dewar plug is removed. If i t does not dry out then follow the “drying out” procedure in the Maintenance section .
Warning: If the Optical Reset LED stays red then there may be improper cable wiring or termination thus causing noise pickup which will overload the signal processing OR the detector may have been damaged in transit . Check wiring terminations first and if i t cannot be fixed, contact the Company.
Testing and Adjusting the Pneumatic Hoist Commissioning
On-Line Sampling and Analysis System (MSA) Technical Manual 3.1 5-16
5.6 Testing and Adjusting the Pneumatic Hoist
The purpose of the hoist is to raise the probe from the slurry to prevent damage to the detector in the event of a window rupture as well as to allow maintenance on the probe such as window cleaning and changing. The hoist pneumatic system layout is schematically shown in figure 5-9.
5.6.1 Testing The pneumatic hoist will have been factory tested but after installation in the plant (and assuming the air line is connected and providing the correct pressure and the electronics is powered up) its operation should be re-tested. The regulator gauge mounted on the probe carriage (see photo left) should indicate there is air pressure available. The reserve Air Reservoir has stored sufficient air to raise the hoist (if i t is less than 450kPa sufficient air pressure has not yet been achieved, so check the supply line pressure and the pressure switch setting (see section 5.6.2). If the probe has not been mounted into the analyser yet, the window self test circuit will prevent the probe from lowering. To test the hoist operation you will need to temporarily override the self test circuit by fit t ing an AM185 Dummy Diode Plug to the “LV/Alarm” plug on the Signal Analyser, or select <ForceRly> on the OI, forcing relay number 204 open. Ensure the probe is centred over a zone or parked. Now the hoist platform can be lowered by selecting at the OI panel, the menu option key <MoveProbe> then select <down>. A rushing sound will be heard as air from the Air Reservoir is released from the solenoid. You may also hear a clunk noise as the automatic safety catch releases to allow the hoist to lower. The platform should lower smoothly onto an air cushioned rest. Now raise the probe by selecting at the OI panel, the menu option <up> key. When the probe is in the raised position the hoist will sit above the automatic safety latch.
Note: If the movement is not smooth or is too slow go to the section “Hoist Adjustments, section 5.6.2”.
Commissioning Testing and Adjusting the Pneumatic Hoist
On-Line Sampling and Analysis System (MSA) Technical Manual 3.1 5-17
F igure 5-4 P ip ing & Connect ion diagram for a typical 6-s t ream
MSA
Testing and Adjusting the Pneumatic Hoist Commissioning
On-Line Sampling and Analysis System (MSA) Technical Manual 3.1 5-18
Take note that the reed switch sensors come on at the top (see photo left) and the bottom of the air ram when the probe is in the raised or lowered position respectively. These sensors indicate to the RLC and computer that the probe is either fully raised or fully lowered i.e. normal status. If sensor does not light, then an error message will be displayed (see Chapter 9, Trouble Shooting). The probe hoist should now be operating correctly. If you forced relay 204 or fitted an AM185 Dummy Diode Plug, this must be removed before continuing.
5.6.2 Hoist Adjustments
Hoist Speed Control The air regulator regulates air pressure to the hoist ram and also controls the hoist speed. It is manually adjustable by pulling the handle up on top of the regulator body beside the gauge (see photo left). The regulator is normally factory set to 450kPa. It also minimises the air consumption. Pressure Switch This switch is located on the probe carriage on top of the regulator (see photo left) and is factory set to 400kPa so it does not normally require adjustment. The pressure switch monitors the incoming line pressure. If adjustment is necessary, in order to make the pneumatic system operate, the following procedure should be followed. The pressure switch is adjusted by rotation of the screw with a screwdriver. The switch is factory set to operate at fail between 350-400kPa falling and recovery at 400-450kPa rising. To check and/or readjust this, proceed as follows: 1. Raise the probe. 2. Check that plant air pressure is available above
450kPa Maximum is 800kPa. 3. Isolate air into Hoist Controller enclosure by turning
off the ¼” ball valve before fil ter (see photo left). 4. Connect a multimeter across the contacts in the
pressure switch and check for closed circuit (pressure above 450 kPa).
5. Gradually decrease the pressure in the system by releasing air from the air reservoir using the ½” ball valve on the bottom. Watch the multimeter until the contacts open. This should happen between 400 and 350 kPa.
6. Close the ½” ball valve on the air reservoir and slowly
Commissioning Installing the MEP Detector
On-Line Sampling and Analysis System (MSA) Technical Manual 3.1 5-19
increase the pressure in the system by opening the ¼” ball valve air inlet. Watch the multimeter until the contacts close. This should happen between 450 and 450 kPa.
7. Adjust the pressure switch by rotation of the screw until 5 and 6 are achieved.
Note: An alternative to using a multimeter is to monitor the OI <Status> to see “AirF1” (Air Failure) or “AirOK”, although this requires a second person.
Note: Never decrease the air pressure switch cutoff below a pressure that will be insufficient to raise the probe.
8. Restore the air receiver and supply line connections.
Note: Override buttons are fit ted to the solenoid valves (mounted near the top of the yellow plate in the photo left) can be used to “manually” move the probe up or down when the electronics is off or the probe is not installed.
Installing the MEP Detector Commissioning
On-Line Sampling and Analysis System (MSA) Technical Manual 3.1 5-20
5.7 Installing the MEP Detector
Check first that the probe carriage is firmly mounted (see photo left) and that the main umbilical cable has been looped onto the guide rail correctly.
Warning: If the cable is not slung correctly then excessive pressure may be exerted on the cable and split or break it . Using the OI, move the probe carriage to the service bay and check that i t lowers. If i t does lower, refer to section 5.6.1for override instructions. Remove the Upper Dewar cover, if i t has been installed, as it is heavy and easier to remove when the probe is down. Check that air has been connected at the valve (as per section 5.3) and turn the supply on. The Air Reservoir (blue tank in photo left) on the probe carriage will fi l l with air and because the electronics is not turned on at this stage, the hoist will automatically raise. When fully raised, isolate the air into the hoist by turning off the isolation ball valve at the air connection point see section 5.3 and photo left). Then dump the air from the Air Reservoir by opening the ball valve on the bottom of it (see photo). The hoist will lower slightly (approximately 20mm) and sit on the automatic safety latch. If the hoist continues to lower then there is a fault with the safety latch, and this will need to be repaired, contact the Company.
Caution: When air is connected and turned on, the hoist probe carriage will automatically raise, if there is no probe installed.
Commissioning Installing the MEP Detector
On-Line Sampling and Analysis System (MSA) Technical Manual 3.1 5-21
Caution: Check that the probe or moving part of the hoist frame, when lowered, will not hit the sides or bottom of the Analysis Tanks, nor will i t hit any stirrers. Doing so may cause damage to the probe.
Caution: Check that the MEP cable is flexible enough to allow the probe to be lowered otherwise the cable may stretch and tear.
Note: The MEP detector will have been shipped in a separate crate and should have been unpacked and kept safe in its metal stand fil led with LN2. Install the MEP detector into the probe shroud (refer to figure 5-1) as follows:
1. With the probe hoist up (the probe carriage can be down if i t is parked in the service bay) and the base-plate and lower shroud already fitted, remove the AM232 Window Assembly (left) from the lower shroud by winding the two square head bolts anti-clockwise with the spigot tool provided in the tool box. The window must be removed even if the lower shroud has not yet been fitted to the base-plate.
2. Check the condition of the Mylar (plastic) window
and the O-ring on the AM282 Window Assembly and replace as necessary (see Figure 5-9). Check that the window is not torn, scratched, or crinkled. Follow the procedure provided in chapter 8, Maintenance . Check that the O-ring is not split or damaged and that i t is lubricated lightly with Vaseline (from the tool box).
Warning: Installing the detector with the Window assembly fitted can tear and damage the backup window.
Installing the MEP Detector Commissioning
On-Line Sampling and Analysis System (MSA) Technical Manual 3.1 5-22
3. If already fitted, remove the Dewar cover (left) by removing the dome nuts that fix it to the black base plate.
Warning: DO NOT lower the probe if there is slurry flowing through the tank.
WINDOW ASSY
SOLID STATE DETECTOR
LN SENSOR
SOURCE
PREAMPLIFIER
WINDOW RUPTURE
END PLUG
LOCATING BLOCK
LOCATING SPRING
LOWER SHROUD ASSY
SIGNAL BNC
PREAMP POWER
IN-LINE FILTER
RETAININGBOLT
WINDOW
BIAS
SPIGOT TOOL
LN DEWAR
LN FILLER COLLAR
LN SENSOR
DEWAR PLUG
DEWAR COVER
WINDOWALIGNMENT TOOL
Figure 5-5 MEP and Detector – Exploded View
4. The detector/dewar is normally delivered with the
radioisotope source in place (this is indicated by the presence of the insertion guard shield). If the radioisotope source has been delivered separately then insert the source holder with shield before continuing with inserting the detector into the MEP lower shroud. Refer to chapter 8, Maintenance for details.
Commissioning Installing the MEP Detector
On-Line Sampling and Analysis System (MSA) Technical Manual 3.1 5-23
Caution: Fitting or removing the radioisotope source holder and shield is a specialised task and shall be supervised by the Company engineer.
Warning: A white plastic cover will be fixed in place of the source holder if the isotope has been delivered separately (see photo left). This must be removed first and stored in a safe place for future use. The purpose of this cover is to protect the delicate central beryllium window which if broken will release the vacuum and severely damage the detector. Beryllium is toxic . Avoid touching the Beryllium window. The hoist usually needs to be lowered to allow clearance between the base plate and overhead trolley gantry to fit the probe. If the carriage is in the last zone or end park bay there may be sufficient clearance from the umbilical diamond rail . In any case it is important that you are able to install the probe without ti l t ing too much, as Liquid Nitrogen might spill . Therefore the carriage must be positioned either in the park bay or in an empty analysis zone with no slurry flowing. Without a window assembly the interlocks on the RLC will not allow the hoist to be lowered, so to override use a screwdriver to press the override button on the solenoid as shown in the photo left . (Alternatively, use an AM185 Dummy Diode plug on the Signal Analyser, and press the Park Probe button).
5. Lift the detector unit upright onto the MEP base-plate (reinforced black polyurethane, see photo left) in the hoist carriage. DO NOT lower it into the MEP lower shroud at this stage, just rest i t on the base-plate and go to 6. (All packing including polythene bags, tape and Silica Gel should have been removed from the detector unit . Also check that the vacuum pump-out valve is unobstructed - the metal plug with a central threaded hole should be visible, i t must not have a plastic cap or any adhesive tape over it . See Figure 5-6.)
Installing the MEP Detector Commissioning
On-Line Sampling and Analysis System (MSA) Technical Manual 3.1 5-24
6. Get an assistant to connect the four cables (MHV/BNC/D9/Level Sensor) to their appropriate receptacles on the upper face of the preamplifier. Ensure that the larger coaxial connector that carries the bias voltage goes to the larger coaxial receptacle, marked MHV Bias. There is a short extension (400mm) from the MHV bulkhead connector. The required cables are shown in Figure 5-6. Wind the cables around the neck of the probe then gently lower the detector into the shroud. Twist i t gently to get i t to go to the square bottom. Ensure the four cables are not squashed by the collar and are fed up through the gap in the collar.
4 HOLES M6 x 12 DEEP EQUISPACED ON 66.7 PCD
LIQUID NITROGEN DEWAR11.2 LITRE VOLUME
SIGNAL BNC400mm
PREAMP POWER400mm (D9)
LN SENSOR1100mm
IN-LINE FILTER
COLLAR
PUMP VALVE
BIAS MHV BULKHEADFEMALE CONNECTOR
SOURCE HOLDER3 HOLES M3x4
Figure 5-6 MEP Detector Components and Cable Connect ions
7. Swing the retaining arm across the collar and
tighten the nut on the base plate (see photo left). Ensure cables are not caught and the dewar cover neoprene gasket (black) can be positioned properly to form a waterproof seal.
Commissioning Installing the MEP Detector
On-Line Sampling and Analysis System (MSA) Technical Manual 3.1 5-25
8. Ensure ‘conform-a-sleeve’ is fit ted over the MHV and signal cables (see photo left) to insulate the connectors from the grounded metal plate. Do the same in the grey termination box, if i t hasn’t already been fitted (see photo left).
9. Once the detector is positioned, check the spacing
between the base of the detector and the white plastic “locating block” in the bottom of the lower shroud leg (see and photo left). It should be about 3 to 4mm so that the beryllium window of the detector is centred to the Mylar window of the Window Assembly when fitted. Note that i t may be easier to do this later when the probe is raised on its hoist. Loosen the M4 Allen Head bolts in the side of the collar to adjust the probe height, if needed.
10. Check that the four vent holes (small pin holes)
on the polyurethane LN2 filler AM249/10 (usually coloured red) are not obstructed. These holes allow the venting of very dry LN2 vapour into the probe cavities to keep moisture out and prevent pressurising the probe dewar when the LN2 fil l ing flip-top lid is closed.
11. Re-fit the MEP upper (stainless steel dewar
cover) shroud. This bolts onto the top of the black base-plate using the stainless dome head nuts and washers provided by the Company. Open the flip-top lid and check the LN2 fil ler (red) is not deformed.
12. Top up the probe with LN2, if i t is not full.
Installing the MEP Detector Commissioning
On-Line Sampling and Analysis System (MSA) Technical Manual 3.1 5-26
13. Clamp shut the LN2 filling cap (left) on the
dewar cover using the triangle clamp provided. This cap prevents excessive LN2 boil-off and keeps the detector inside dry as in point 10. Do not adjust the clamp to be excessively tight as the neoprene gasket can be deformed beyond its elastic recovery limit, which can cause a leak.
14. Turn on the air supply (open the ball valve) and
wait for the hoist to raise the probe. Alternatively, press the ‘Raise Hoist’ button. The whole assembly should now look like that in Figure 5-7, except the window assembly stil l needs to be installed.
Caution: If there is slurry flowing in the analysis tank when carrying out this procedure then the air must be connected first and the hoist raised so that slurry doesn’t enter the probe.
IN-LINE FILTER
BERYLLIUM WINDOW
SOURCE HOLDER
WINDOW ASSEMBLY
CABLE ASSEMBLY
LN2 DEWARX-RAY DETECTOR
LN2 SENSOR CABLE
MEP UPPER SHROUDASEMBLY(DEWAR COVER)
LN SENSORLN FILTER CAP
F igure 5-7 Completed MEP/Detector Assembly
Commissioning Installing the MEP Detector
On-Line Sampling and Analysis System (MSA) Technical Manual 3.1 5-27
15. Once raised, gently push the detector (push on the
source holder shield or pull on the top of the probe) backwards and release to check that i t returns to its original position. There is a leaf spring attached to the inside of the lower leg for this purpose. If the detector does not spring back, remove the detector and check for the “locating spring” (see Figure 5-5 and photo left).
16. Check that the three M3 screws holding the
source holder in place in the detector are tight then remove the source shield by unscrewing the two M3 screws. Figure 5-8 shows how the source holder and shield are fit ted. The photo left shows the un-shielded source holder mounted in the detector.
Caution: Fitting or removing the radioisotope source holder and shield is a specialised task and shall be supervised by the Company engineer in the first instance. Thereafter only the trained and licensed plant personnel shall carry out the procedure.
Multi-Element Probe
Beryllium Window
Source Holder634048
Shield43403
M3x12 Csk Screw 57565 (2)
Source(3 possible positions)
M3x10 Csk Screw 57564 (3)
Window Contact“Fingers”
Figure 5-8 F i t t ing the MEP Source Holder and Sh ield
Installing the MEP Detector Commissioning
On-Line Sampling and Analysis System (MSA) Technical Manual 3.1 5-28
17. Smear a very small amount of petroleum jelly
around the O-ring on the AM282 Window Assembly and refit . Figure 5-9 shows an exploded view of the window assembly. Clip the Standard Biscuit to the probe head (shown left). If necessary, fi t a cable t ie around the standard clip so it can’t fall off if knocked.
Note: If there is more than one probe in the plant, ensure you are using the correct standard biscuit . If there is a chance of slurry splashing, i t is suggested that a plastic bag be fitted over the lower probe to prevent contamination of the measurements.
Caution: Handle the window from underneath and work from the back of the probe to prevent unnecessary low-level radiation exposure. The whole probe assembly on its hoist will now look like that in the photo left . Note that the hoist will be raised if air is turned on.
18. Remove the Window Rupture circuit bypass, if done at Step 4, by either removing the AM184 Dummy Diode plug and replacing the D9 cable or by selecting <FreeRelay> on the Operator Interface and freeing Relay 204.
Commissioning Installing the MEP Detector
On-Line Sampling and Analysis System (MSA) Technical Manual 3.1 5-29
Figure 5-9 Exploded View of the MEP Window Assembly
Calibrating the LN2 Sensor Commissioning
On-Line Sampling and Analysis System (MSA) Technical Manual 3.1 5-30
5.8 Calibrating the LN2 Sensor
If the LN TEST button has extinguished then the LN2 Sensor is already calibrated to the electronics and there is no need to follow this procedure. If the LN TEST button has not extinguished then the probe safety (Low Liquid Nitrogen Warning) circuit will not work if the sensor has not been calibrated. In some older analysers bias cannot be applied to the probe in this case. Refer to Figure 5-2 to locate the buttons and cards.
5.8.1 Functional Description of the LN2 Sensor Circuit The Liquid Nitrogen Level Sensor gives a high or low indication of the level of Liquid Nitrogen in the probe dewar. If the level is low, the Signal Analyser gives a Liquid Nitrogen Low WARNING, which usually means there is 1 litre or less Liquid Nitrogen in the dewar (i .e. less than about 10%). Two red LEDs are located on the AM092/10 card in the Signal Analyser, one above the ribbon cable and one below. They are named SNSSC (above) and SNSOC (below), which are acronyms for Sensor Short Circuit and Sensor Open Circuit, although the LEDs can have different meanings under other circumstances. For instance, when they display the LN2 Level Sensor reading the SNSSC LED indicates volts measured on the Level Sensor multiplied by 1 and the SNSOC LED indicates volts multiplied by 0.1, viz. if the SNSSC LED flashes 7 times and the SNSOC LED flashes 5 times this indicates 7.5 volts on the Level Sensor. Nominal readings are 7.5 volts in LN2 or 8.2 volts in air (i .e. when LN2 level is low), but the AM092/10 card can read anywhere from 0 to 12 volts, where 0 (or close to 0) indicates a short circuit and 12 (or close to 12) indicates open circuit . Under normal operating conditions, the SNSOC LED on the AM092/10 card lights if the reading is more than 1 volt above the stored value, and the SNSSC LED lights if the reading is more than 1 volt below the stored value. It is possible to store almost any value in the AM092/10 card’s memory, even a value measured with a faulty LN2 Level Sensor, such as open circuit , short circuit or empty of Liquid Nitrogen. For this reason it is important to check the reading before storing it .
Commissioning Calibrating the LN2 Sensor
On-Line Sampling and Analysis System (MSA) Technical Manual 3.1 5-31
5.8.2 Procedure for Calibrating the LN2 Sensor Familiarise yourself with this procedure before starting.
1. Ensure the probe dewar is full of Liquid Nitrogen.
2. Press and hold the “LN Test” button. Do not release the button until step 6. It is the left red push-button located on the panel above the top row of cards in the Signal Analyser (see photo left – square orange button is the power).
3. The “LN Test” button will l ight within a few seconds. The Signal Analyser then proceeds to measure the LN Sensor value, which takes a few seconds.
4. Now observe the number of flashes of the two red LEDs that are located on the AM092/10 card, one above the ribbon cable (SNSSC = volts x1) and one below (SNSOC = volts x0.1). Diagnosis is:
VOLTS INTERPRETATION 7.0 or less Short c i rcui t , need to repair LN Sensor 7 .1 to 7 .9 Normal , OK to Store - go to Step 5 8 .0 to 8 .5 Go to Procedure Step 1 8 .6 or more Open ci rcui t , need to repair LN Sensor
or cable
5. When the SNSSC and SNSOC LEDs have ceased flashing, the top LED on the AM092/10 card (STF1) will l ight. If the reading indicated by Procedure step 4 was not OK, release the “LN Test” button and resolve the problem.
6. Provided the reading indicated from step 4 was OK you now have the opportunity to store the value into AM092/10 memory. Do this by pressing the “WR Test” red push-button (the middle one) twice quickly while the STF1 LED is li t . If you are too slow, go back to step 1.
7. Release the “LN Test” push-button. The Signal Analyser will take a few seconds to measure the LN Level Sensor and compare the reading to the value you just stored. If i t is Normal the “LN Test” lamp will go off.
Warning: If the probe completely dries out of LN2 , a separate temperature sensing safety device (RTD) inside the detector will cause the Bias to shutdown automatically and on-line assay data will cease.
Checking and Testing the MEP Electronics Set Up Commissioning
On-Line Sampling and Analysis System (MSA) Technical Manual 3.1 5-32
5.9 Checking and Testing the MEP Electronics Set Up
Once the equipment is powered up and operational, the factory settings are to be checked using the Standard Biscuit supplied with the equipment. Factory settings are supplied in Attachment 2. Performing these checks will confirm if the probe and electronics are operating normally.
Warning: After switching on the probe for the first t ime or after an extended period it can take about an hour for the detector to settle down and operate in a stable manner, thus affecting the resolution. Therefore it is best to wait for 1 to 2 hours before performing these tests. A Multi-Channel Analyser (MCA) is used to check the X-ray spectrum from the analyser, measure the probe resolution and to make adjustments to the Single Channel Analysers (SCAs) which define the region of interest around the energy spectrum peaks for measurement on-line. An MCA is a complex, expensive and delicate instrument and could not be expected to operate reliably in the plant environment for very long. For this reason, an MCA is not built into the Signal Analyser, but a commercial MCA may be connected temporarily in order to view the X-ray spectrum and to check SCA settings relative to that spectrum. Different makes of MCA may be used and so it is necessary to calibrate the MCA to the Signal Analyser electronics. This procedure is done in the factory, but i t should be rechecked if a different MCA is used on-site and the reference settings updated (refer Attachment 2).
5.9.1 Connecting & Calibrating the MCA Overview and Connecting the MCA In a multiple SCA system such as the Signal Analyser i t is most important to provide for the setting of the SCA limits LL and UL relative to the appropriate spectral features. Furthermore, i t is advantageous to be able to observe the X-ray energy spectrum in a conventional graphical form (a typical X-ray energy spectrum for a MEP is shown in Figure 5-10).
NORLAND 5500 MCAO FF O N
VIKING INSTRUMENTS
VERTICAL SCALE
HORIZONTAL SCALE
CURSOR
ZERO ULDLLD
AMP GAIN
INPUT
SE TUP COMP UTE PROG + 7 8 9
OPTIO NS DISPLAYGOE SINTO==> - 4 5 6
CONT CANCEL CLEARNUM X 1 2 3
RUN TERM ÷ EXP 0 .
CONVGAIN
OFFS ET
AMPDIRECT
Commissioning Checking and Testing the MEP Electronics Set Up
On-Line Sampling and Analysis System (MSA) Technical Manual 3.1 5-33
MEP ENERGY X-RAY SPECTRUM
0
250
500
750
1000
1250
1500
1750
2000
2250
2500
1.00
0
3.00
0
5.00
0
7.00
0
9.00
0
11.0
00
13.0
00
15.0
00
17.0
00
19.0
00
21.0
00
Energy (KeV)
Cou
nts
PuLγ Coh
PuLβ Coh
PuLα CohBrKαAsKα
CuKβ
CuKα
FeKβ
FeKα
Figure 5-10 Typical Energy X-Ray Spectrum from a MEP
The main purpose of the AM994 MCA Access Module in the Signal Analyser is to convert the probe signal into a form that should suit most MCAs (MCAs of different manufacture vary considerably in their input circuit characteristics). The AM994 MCA Access Module has a RUN/TEST switch to enable user access to the test mode functions described here. It must be kept in the position RUN except when the system is under test. This prevents erroneous data being sent to the computer because it over-rides all the monitor functions. During all setting-up operations this switch is set to TEST . The signal must go directly to the MCAs Analog-to-Digital Converter (ADC) circuit. Many commercial MCAs are provided with pulse-shaping amplifiers ahead of the ADC. The pulse output of the Signal Analyser is already optimised for an ADC and any further shaping or amplification will only produce errors. Every MCA is different, of course, but one should find a menu selection, switch, PCB jumper link or links or a separate input on the instrument which will enable DIRECT or HIGH LEVEL input signals to bypass the in-built amplifier. The correct connector may be labelled ADC IN or similar. Consult the MCA manufacturer 's handbook for details. Attachment 3 provides additional details on using the MCA if one was purchased with your system.
Checking and Testing the MEP Electronics Set Up Commissioning
On-Line Sampling and Analysis System (MSA) Technical Manual 3.1 5-34
The MCA is connected to the BNC socket, marked MCA on the AM994 MCA Access Module (shown left), using a coaxial cable of up to 5 m in length and 50 ohms or greater impedance. Calibrating the MCA Internally, the range of pulse heights presented to the SCAs is 0-10 volts positive. The LL and UL potentiometers (shown left) may be set to any point in this range. An internal test signal is generated and this can be injected into the SCAs in lieu of the probe signal. The amplitude of this signal is also variable from 0 to 10 volts using the calibrated 10-turn REF VOLTS dial. Most MCAs are designed to accept an input voltage less than 10 volts (e.g. 0-8 V, 0-8.192 V, 0-4 V etc.) at the ADC. In order to accommodate these possibili t ies, a screwdriver adjusted potentiometer (MCA CAL) is provided. Using the internal reference signal, which also appears on the MCA, the user may easily set the internal max voltage (10 V) to any suitable channel on the MCA (say channel 2000). This will not upset any of the other settings in the Signal Analyser box. Once the potentiometer is set i t will not need adjusting unless a different MCA is used or the AM994 MCA Access module is replaced. To calibrate the MCA follow these steps: 1. Connect a Multi-channel Analyser (MCA) to the
AM994/.. MCA Access module in the Signal Analyser via a coaxial cable of up to 5m in length (connection of the MCA is discussed above). The single-phase power outlet provided with the MSA enclosure is to provide power for the MCA.
Note: Ground loop currents may be caused though the mains power if the MCA is on a different circuit to the Signal Analyser, so use of the supplied power outlet is recommended.
Caution: Check the mains power supply of your MCA is set the same as the Signal Analyser. In an MSA, this is usually 240VAC or 110 VAC.
Commissioning Checking and Testing the MEP Electronics Set Up
On-Line Sampling and Analysis System (MSA) Technical Manual 3.1 5-35
2. Set the following switches:
RUN/TEST to TEST PROBE/INJECT to INJECT BIAS VOLTAGE to ON BIAS VOLTAGE potentiometer to probe's rated
voltage. press button SPECTRUM press button ACQUIRE to il luminate its red LED
3. Switch on the MCA and prepare it to operate in Pulse
Height Analysis (PHA) mode (refer to the instruction manual for the MCA or Attachment 3).
4. Set the REFERENCE VOLTS dial to about 500 divisions
(5 volts) and collect a spectrum on the MCA. Injected reference pulses should appear on the MCA screen as a needle-like peak.
5. Increase the REFERENCE VOLTS dial to 1000 divisions
(10 volts). This level on the MCA corresponds to the upper limit of X-ray energies that the Signal Analyser will be able to process. The output of the Signal Analyser to the MCA can be altered so that this level corresponds to the top end of the MCA scale by adjusting the MCA CALIBRATE potentiometer on the MCA Access module. For example if one has a 2048 channel MCA it should be set to around channel 2045. This gives a 1:1 correspondence between different MCAs. Such adjustment is optional of course and does not affect the accuracy ultimately achieved. Never the less there is merit in using most of the available channels over which to spread the spectrum.
Note: In a plant where several probes are installed it is useful to calibrate all of them precisely the same, so that the various peaks appear at the same MCA channel for each probe.
6. On completion the TEST/RUN switch must be returned to
the RUN position and the PROBE/INJECT switch returned to PROBE put the system back on-line if no further adjustments are to be made.
Checking and Testing the MEP Electronics Set Up Commissioning
On-Line Sampling and Analysis System (MSA) Technical Manual 3.1 5-36
5.9.2 Checking the Probe X-Ray Spectrum The spectrum of the probe must be measured with the standard biscuit in place so as to check, and adjust if necessary, the Gain of the AM001 Linear Amplifier, and the LL and UL SCA discriminator settings. These are factory set but they may have altered during shipment, so you will now check the spectrum and SCA settings against those factory settings. The spectrum of a probe shows the distribution of energy of the X-rays in the detector. The spectrum is a plot of intensity of the X-rays on the 'y ' axis versus their energy on 'x ' axis (refer to Figure 5-10). Attachment 2 contains a copy of your probe(s) spectrum. The spectral peaks coincide with the X-ray energies of the elements in the standard (or slurry) sample. Common elemental X-ray energies are given in Table 5-1 Common Elemental Fluorescent X-Ray Energies. A full list of energies is provided in Attachment 3.
Commissioning Checking and Testing the MEP Electronics Set Up
On-Line Sampling and Analysis System (MSA) Technical Manual 3.1 5-37
For lower X-ray energies Plutonium-238 or Curium-244 sources are usually used for excitation. At higher energies (> about 13 keV) Americium-241 sources are used.
Table 5-1 Common E lemental F luorescent X-Ray Energies
Checking and Testing the MEP Electronics Set Up Commissioning
On-Line Sampling and Analysis System (MSA) Technical Manual 3.1 5-38
The procedure for plotting the spectrum is as follows: 1. Open the Signal Analyser unit . It is assumed that the
bias voltage is on (Bias LED will be li t yellow/green, see powering up the equipment section 5.5.1).
2. Connect a Multi-channel Analyser (MCA) to the
AM994/.. MCA Access module in the Signal Analyser via a coaxial cable of up to 5m in length.
3. Switch on the MCA and prepare it to operate in Pulse
Height Analyser (PHA) mode (refer to instruction manual for your MCA or Attachment 3).
4. Set the following switches:
RUN/TEST to TEST PROBE/INJECT to PROBE press button SPECTRUM press button ACQUIRE to il luminate its red LED.
5. Switch the MCA to COLLECT mode. An X-ray
spectrum should now appear on the MCA screen. A typical spectrum was shown in Figure 5-10 and your probe's spectrum is given in Attachment 2. That spectrum is what you should now see on the MCA screen. If the spectrum is different then proceed to step 6, otherwise proceed to the section on adjusting the SCAs.
6. If the X-ray spectrum doesn't span the 10 volt range
(MCA screen width) set during MCA calibration, then the Gain of the AM001 Linear Amplifier (shown left) may need adjusting, but before doing so proceed to the section “Adjusting the SCA LL and UL Discriminators” to see if these are set okay, in which case you won’t need to adjust the Gain; otherwise adjust the Gain and then proceed to the section on adjusting the SCAs. After adjusting the Gain, clear the spectrum from the MCA screen and begin collecting again.
Note: Once set, the Gain of the Linear Amplifier, AM001 card, should not need any further adjustment unless the detector or AM001 card is replaced.
Commissioning Checking and Testing the MEP Electronics Set Up
On-Line Sampling and Analysis System (MSA) Technical Manual 3.1 5-39
5.9.3 Checking and Adjusting the SCAs During factory testing the SCA UL and LL discriminators are set with the standard biscuit in place. These levels should be checked on-site initially with the standard and adjusted if necessary and then re-checked in the slurry before performing a stability test. The following procedure provides for checking and minor adjustments only. For new SCAs settings another procedure follows this one. Collect a spectrum on your MCA by setting the following switches:
RUN/TEST to TEST PROBE/INJECT to PROBE press button SPECTRUM
then put the MCA in COLLECT mode.
Collect a spectrum for about 60 seconds so that all the peaks are easily visible. Then in turn press the press MARK button on each SCA twice. The first t ime you press this button the LL discriminator will be displayed and then on the second press the UL will be displayed. These settings are displayed as an injected spike at the marker voltage settings on each SCA (reference volts). The discriminators should sit in the valley either side of a wanted spectral peak or Region of Interest (ROI). They should normally not sit partially up the peak and they should not overlap with neighbouring SCA LL or UL discriminators (i .e. , neatly in the skirts of the peaks without overlapping). If the discriminators are sitt ing satisfactorily around the required peaks then there is no need to do any further adjustment and you can proceed to “Measuring the Probe Resolution”. Otherwise, if a discriminator needs some adjustment to align it properly around the peak then hold depressed the MARK button for LL or UL, which ever is required and whilst holding this button insert the small screw driver into the LL or UL trim pot (again which ever is being adjusted) and turn the trim pot screw very slightly either clockwise for right movement or anti-clockwise for left movement on the spectrum displayed on your MCA (make sure the MCA is sti l l in COLLECT mode) until the injected discriminator marker spike sits where you want it to be.
Checking and Testing the MEP Electronics Set Up Commissioning
On-Line Sampling and Analysis System (MSA) Technical Manual 3.1 5-40
Repeat this for all discriminators that require a small amount of adjustment. When complete, collect a fresh spectrum and re-check the SCA discriminators before proceeding to “Measuring the MEP Resolution”.
Note: Adjustment to SCAs or Gain will directly affect the slurry calibration if already commenced. Recording Reference Volt Settings Once the SCAs have been checked or re-set i t is advisable to make a record of the limits of each channel relative to the internal REFERENCE potentiometer on the MCA Access module. This is done by setting the switch PROBE/INJECT to INJECT and then scanning this potentiometer from 0 to full scale and noting the positions at which LL<<UL LEDs light on each SCA (when the LED is on it indicates that pulses are being accepted by that SCA). The limits are found from the potentiometer positions at which the LED just comes on and just goes out.
Note: Record the new reference volt settings and all other settings in the data sheets provided in Attachment 2. The procedure to set up new SCAs is as follows: 1. With the standard biscuit attached collect a fresh
spectrum on the MCA over a period about 200 seconds) to get a good outline of the spectral features. Follow the procedure given above for collecting a spectrum on the MCA.
2. Move the MCA's cursor across the screen and note
down the lower and upper limits of each peak which is required. As an example , for a typical copper-lead-zinc ore, these SCA channels would normally be used:
SCA1. iron (FeKα) SCA2. iron (FeKβ) SCA3. copper (CuKα) SCA4. zinc (ZnKα) SCA5. zinc (ZnKβ) SCA6. lead (PbLα) SCA7. background SCA8. Lα scatter (compton+coherent) SCA9. Lβ scatter (compton+coherent)
Commissioning Checking and Testing the MEP Electronics Set Up
On-Line Sampling and Analysis System (MSA) Technical Manual 3.1 5-41
The limits should be set well down on the skirts of each peak but they should not overlap into another peak or extend over the background. Symmetry is usually desirable too. 3. The channels (SCAs) are now set up in the following
manner.
Press and hold the MARK button on first SCA
The lower limit marker of channel number 1 will appear on the MCA screen. Markers appear as a narrow peak 1 to 3 channels wide, similar to the INJECT signal used earlier. This marker can be adjusted so that i t corresponds to the level chosen in 2 above, by adjusting the LL potentiometer on the front of this SCA module. Note that if the button is released and re-pressed, the upper level marker will appear on the screen. The upper and lower level markers alternate with subsequent re-pressing of the button. The upper level discriminator is set by the above procedure except that the UL potentiometer on the SCA is adjusted. The other SCAs can then be set up in a similar manner. As the markers are moved around they will obliterate any part or the spectrum over which they pass. This may necessitate that the spectrum is erased and collected afresh. With practice and vertical full scale of 16K or 32K one can minimise this effect and hence the need to refresh the spectrum. Once the SCAs have been checked or re-set i t is advisable to make a record of the limits of each channel relative to the internal REFERENCE potentiometer on the MCA Access module. This is done by setting the switch PROBE/INJECT to INJECT and then scanning this potentiometer from 0 to full scale and noting the positions at which LL<<UL LEDs light on each SCA (when the LED LED is on it indicates that pulses are being accepted by that SCA). The limits are found from the potentiometer positions at which the light just comes on and just goes out.
Note: Record the new reference volt settings and all other settings in the data sheets provided in Attachment 2.
Checking and Testing the MEP Electronics Set Up Commissioning
On-Line Sampling and Analysis System (MSA) Technical Manual 3.1 5-42
5.9.4 Measuring the Probe Resolution The X-ray spectral resolution of the probe should remain relatively constant for a given probe. A significant change in the resolution of the probe indicates a definite problem with the probe or Signal Analyser and so it is very important that the probe’s resolution be measured during commissioning. Also it will indicate if any damage has occurred to the probe detector during shipment. The resolution of the probe is measured as follows: 1. Connect the MCA to the MCA Access module of the
Signal Analyser and set the switches:
TEST/RUN to TEST press ACQUIRE button press SPECTRUM button
and collect a spectrum on the MCA over a period of about 300s.
2. Move the MCA cursor to one of the high spectral peaks
(normally FeKα) and note its peak position (C0) on the MCA scale and the number of counts in this channel.
3. Divide the counts at channel C0 by 2 to get the half
peak height and find the MCA channels (C1 and C2) on either side of the peak for which this number corresponds. The actual half peak value may be in between two channels so estimating the partial channel position (interpolation) of these points will give greater accuracy.
4. The resolution is expressed in terms of the Full Width
Half Maximum (FWHM) of the peak and is given by the following equation:
C2 - C1 FWHM resolution = Ep x
C0 Where Ep is the actual energy of the X-rays. Some common X-ray energies are: FeKα = 6403 eV ZnKα = 8638 eV CuKα = 8047 eV PbLα = 10549 eV
The resolution will normally be measured on the FeKα peak. The FWHM resolution of this peak should be between 160 and 220 eV. A problem is indicated if the resolution increases to greater than 270 eV. Record the value, the date and the peak on which it was measured.
FW HM
C1 C0 C2
Half Peak Height
Peak Height
Commissioning Checking and Testing the MEP Electronics Set Up
On-Line Sampling and Analysis System (MSA) Technical Manual 3.1 5-43
Note: Use a ‘clean’ peak where possible to avoid erroneous resolution comparisons eg. MnKβ can ‘overlap’ FeKα . However, C2 and C1 are not as easily found. The point at which we require is somewhere between two channels i .e. , consider the following example: Peak (C0) is at channel 555, counts 5000 Therefore, half C0 counts is 2500 However, closest we can get to C1 is 2360 counts at channel 546 and 2580 at channel 547. Similarly C2 is 2620 counts at channel 562 and 2400 counts at channel 563. We need to estimate the exact channel for both C1 and C2 where half the peak counts are 2500. Calculating C1: Low Channel: Channel 546, 2360 counts High Channel: Channel 547, 2580 counts C1=546+((2500-2360) / (2580-2360))=546.636 Calculating C2: Low Channel: Channel 562,2620 counts High Channel: Channel 563,2400 counts C2=562+((2500-2620) / (2400-2620))=562.545 Generally for C1 & C2, =Low Channel+((1/2 peak counts – Low Channel counts) / (High Channel counts – Low Channel counts)) Therefore, the probe resolution is: 6403*(562.545-546.636)/555=183.5eV
5.9.5 Checking the Standard Count-Rates at the Computer When all test work is completed always restore the RUN/TEST switch to RUN . This position overrides most of the controls on the front panel of the Signal Analyser and minimises erroneous results due to indiscriminate tampering or wrongly set controls. As long as this switch is on TEST , a warning message will be displayed at the computer.
Checking and Testing the MEP Electronics Set Up Commissioning
On-Line Sampling and Analysis System (MSA) Technical Manual 3.1 5-44
Note: Leave the Standard Biscuit in place at this stage. Now check that the standard count-rates are being transmitted each minute to the computer by selecting the count-rates tabular screen which will display a table of channels containing raw count-rates that are being transmitted from the probe. Providing only minor adjustments were done to the SCAs, the 1-minute count-rates should look close to those given in the data sheets in Attachment 2, i .e. , the factory numbers. If completely new SCA settings were found then the numbers will be different but the main number to check is the Live-Time-Ratio (LTR) which is displayed in the first column. This number is usually around 0.75 to 0.95 but many be as low as 0.65 in some cases. Also check that numbers are appearing in each channel (there are usually 9 SCA channels). If numbers are appearing and look to be correct (in comparison to the size of the peak in the spectrum) then proceed to re-checking the settings in the slurry.
If there is no data being displayed then check the following:
1. Software configuration (refer to the Software Manual).
2. Data cable connections and data interface unit. 3. Reboot the computer and watch the data interface
unit to see if the receive and transmit LEDs flash then wait at least 5 minutes to see if data appears.
5.9.6 Re-Checking Settings in the Slurry Once the whole system has been tested as above and has shown to be operating as expected with the standard biscuit in place then the biscuit can be removed and the probe can be immersed into the slurry, an XRF spectrum collected and the SCA settings adjusted (if necessary) in the slurry.
Commissioning Checking and Testing the MEP Electronics Set Up
On-Line Sampling and Analysis System (MSA) Technical Manual 3.1 5-45
To do this follow these steps: 1. Collect a spectrum and look for any steep noise
shoulder at the start of the spectrum decreasing exponentially. If there is one then it should not extend to under the first peak of interest. i .e. , i t should not extend to under the FeKα if that is the first peak required to be measured. If i t does then the detector may be microphonic, so check for any excessive vibrations at the analyser mounting and then consult the Company.
2. Remeasure the probe resolution in the slurry and record
this value in the data sheets in Attachment 2. If the probe is very microphonic then the resolution will be degraded too.
3. Collect a spectrum for about 300 seconds and check the
upper level and lower level SCA markers sit neatly around the peaks of interest (i .e. , in the valleys and not on the shoulders). Sometimes one or more peaks may be higher (in which case they may also broaden slightly), or lower, so the SCA channel markers will have to be broadened or tightened to suit . Record the new settings in the setup sheets in Attachment 2.
4. If you identify any new peaks in slurry not already
measured by an SCA, and that are not present in the standard biscuit, further investigation is recommended. By calibrating the MCA for energy and using the X-ray Energy Table (0), decide if the peaks are important. Consult the Company if you are unsure. It may be possible to re-assign an SCA to measure a new peak of interest .
Note: Be aware of the approximate slurry concentrations and plant conditions whilst making these checks and/or adjustments. Sometimes MSA’s measure both tails and concentrate streams, so the SCAs must be checked in both. 5. Once all settings are okay in the slurry (viz. , probe
resolution and SCA settings then proceed with Stability Testing the system (section 5.8).
Note: SCA settings must be finalised prior to standardising and commencing calibration.
Stability Testing (Standardising) Commissioning
On-Line Sampling and Analysis System (MSA) Technical Manual 3.1 5-46
5.10 Stability Testing (Standardising)
The probe(s) must be stability tested before calibration begins. This testing serves two purposes, one is to performance test the system to ensure that the probe and electronics are stable and secondly to provide the reference mean count-rates (standard counts) required for source decay compensation. The standard counts are used in calibration as well as in trouble shooting the system. The procedure is done with the standard biscuit in place and for up to 12 hours or overnight where possible. The following procedure shows how to measure the standard count-rates and run a stabili ty test . 1. Raise the probe from the slurry by pressing the orange
“Park Probe” button on the rear of the MSA unit (see photo left). If the probe parks over an analysis tank on your MSA, then press the green “Raise Probe” button to lift the probe clear of the tank.
2. Wash and dry the probe head and window. If the window is scratched or dirty after cleaning it should be replaced, because a dirty window will adversely affect the standard counts you obtain. Observe safe radiation working practices.
3. Check the biscuit is clean, then place the standard biscuit on the probe. Make sure that the correct standard for that probe is used otherwise the standard count-rates will be worthless. If there is l ikely to be slurry splashing onto the probe then wrap a plastic bag around the probe leg but do not seal t ightly if the ambient air is very humid.
4. Go to the computer and select the WinISA Client “Control Panel” then “connect to” to the probe to be standardised. Select ‘stop measurements’ then “attach standard” then “start measurements”. The stabili ty test button will l ight green on the “Control Panel” to indicate that the probe is in fact in standardise mode. Repeat this for each probe to be standardised. Refer to the Software Manual for additional details.
5. Bring up the count-rate tabular display and wait at least 5 minutes for the first count-rates to appear (default counting time is 300 seconds in standardise mode). If they don’t appear then check you are configured properly for standardise mode. Refer to the Software Manual for further details.
6. Leave the probe for about 12 hours, if possible, or at least overnight.
Commissioning Stability Testing (Standardising)
On-Line Sampling and Analysis System (MSA) Technical Manual 3.1 5-47
Note: Assays are not produced when a probe is in standardise mode. 7. At the end of the standardising period go to the
computer and open the WinISA Client “Control Panel” then “connect to” to the probe to be taken out of standardise mode. Select “stop measurements” then “detach standard”. Repeat for each probe.
8. Go to the probe and remove the standard biscuit and
return the MSA to normal operation by releasing the “Park Probe” button.
9. Return to the computer and select ‘start measurements’
on the WinISA Client Control Panel to restart the measurement cycle. The machine will now start and be returned to normal operation using the normal analysis time. After a short t ime the stream cycle light will come on. The Control Panel can be closed now if desired.
10. Run the “Stability” software program to produce a
tabled summary of the standard count-rates and stabili ty statistics. The Software Manual provides details for running this program, where to find the data base files and how to interpret the data. If the standard count-rates fail the stabili ty test then investigate why before proceeding with calibration . This may require repeating the standardising procedure.
11. If the standard count-rates pass the stabili ty test
select the “Apply” button on the summary panel in the stability program and the mean count-rates will automatically be entered into the software configuration as the “Standards”. If this is the first t ime standards have been entered you may see a warning that the new standards don’t agree with the previous standards whose values will be (1), you should “Apply” anyway.
Note: If the stabili ty test reports any unstable channels, the reason should be investigated before you apply the standards. Refer to Chapter 9, Trouble Shooting. 12. You are now ready to start calibration but first check
that your Metallurgical Samplers (if fi t ted) work
Commissioning Testing the Metallurgical Samplers
On-Line Sampling and Analysis System (MSA) Technical Manual 3.1 5-48
correctly (refer section 5.11).
Testing the Metallurgical Samplers Commissioning
On-Line Sampling and Analysis System (MSA) Technical Manual 3.1 5-49
5.11 Testing the Metallurgical Samplers
If the Company supplied cross-cut Metallurgical Sampler has been fit ted at the overflow of the analysis tank (see photo left) then it needs to be set-up and tested for the 2 modes of automatic operation before Calibration begins: • Auto (for shift sampling) • Auto for Calibration (computer controlled) • Manual Cut The sampler modes are configured at the OI panel (see photo bottom left) or at the switches ( left). The manual cut is user selectable at the sampler switch (see photo left). Set the Sampler Switch to “Auto” for shift or calibration sampling. Samplers can be locked ‘off’ for maintenance if required.
5.11.1 Calibration-Mode Set the Sampler Switch to “Auto”. Control over the samplers is via the OI panel on the MSA unit , with the exception of the calibration sample time period and the number of sample cuts required in any given sampling period (this is defined in the software on the controlling computer, refer to the Software Manual). By selecting the Smp-Mode OI menu option, the user can select the "calibration" mode (see photo below left). The user should also refer to the section on using the OI panel, in chapter 7 Operation. In "calibration" mode a sample will automatically be taken from the next stream (zone) which is selected from the OI panel. The corresponding probe count-rates will then be stored automatically in a file for that stream name called “CalibrationData.dbf”. The number of sample cuts taken whilst the probe is in the zone depends on the "number of cuts per sample" defined in the computer configuration software and this is turn will depend on the measurement time period which is usually 5-minutes. Check that the “calibration” mode works for all MSA streams and make adjustments to the sampler cutter speed and number of sample cuts taken where necessary to control the volume of sample collected (refer to section 5.11.3).
Testing the Metallurgical Samplers Commissioning
On-Line Sampling and Analysis System (MSA) Technical Manual 3.1 5-50
5.11.2 Shift Sample Set the sampler switch to “Auto”. Select the sampler number and mode at the OI panel and then select “shift”. To do this press the “↓” arrow, then the F4 <MenuMode> key and type password 416 then press ‘Enter’. Press “↓” until you see F1 <SelSmplr>. Press F1 until you see the sampler number you wish to test. Press F2 <SmpMode> then “→” arrow for Shift Mode, then ‘Enter’. There are two further modes for shift samples; one is the "standard shift" mode which provides the operator with a composite shift sample that is collected over a plant shift (configured in the computer) with sample cuts being taken at regular t ime intervals pre-set by selecting <Smp-Time> at the OI (this sample cut interval need only be set once per stream). The other mode provides shift samples composed of samples which are cut randomly within a pre-set t ime interval in case cyclic plant behaviour is suspected. The user is prompted to pre-set a minimum time required between such samples so as to avoid the possibility of two samples being taken very close together. Ask the plant supervisor what sample intervals are required over their shift and set the sampler t ime accordingly. Make sure the “shift” setup in the computer software. Test that all streams work in “shift mode”. Adjust the number of samples (i .e. Volume of sample per shift) taken by changing the sampler “time between cuts”.
5.11.3 User Adjustments Adjustments required to optimise the sample volume can be made by changing the speed of the sample cutter. This affects all samplers. Setting the Sample Cutter Speed Sample cutter speed should be set to match the flow rate through the sampler. Optimum sampler speed is a balance of the amount of sample required at the end of each shift and the frequency of cuts required to obtain a represent-ative sample. The Sample Cutter Speed Control (photo left) is a 6 position switch mounted on the AM664 in the enclosure. Each position has its own speed (zero is off).
Note: If a sampler is requested to operate and the speed is set to zero, i t will cause a sampler timeout fault , which can be reset by pressing the white ‘Reset’ button on the relevant sampler reversing module.
Commissioning Testing the Metallurgical Samplers
On-Line Sampling and Analysis System (MSA) Technical Manual 3.1 5-51
Setting the Time Between Cuts for Shift Samples (Auto Mode) To change the volume of sample collected over a shift, adjust the time between samples for that stream. Calibration Sampling The number of sample cuts in the calibration sampling period defined in the WinISA software can be user set to provide suitably sized samples. If no user defined number is set then the default number of cuts is 15 and the calibration sample time is 5 minutes total per sample. The Software Manual provides details of how to set the calibration sample cuts. Calibration samples can only be taken if the sampler switch is set to “Auto”, and a calibration sample is requested at the OI.
Warning: Depending on local regulations, access to the inside of the MSA controller may be restricted to licensed electrical workers. There are no exposed terminals inside which can be easily touched by humans. All internal components comply with AS1939-1990 IP20 however, take care not to use a tool such as a screwdriver in live terminals.
Caution: The mains terminals remain live with the door mounted switch in the OFF position.
5.11.4 Tests to be Performed To test the Metallurgical Samplers you will need a bucket then follow these steps. 1. To test the manual “Cut” function put a bucket at the
sample outlet, set the sampler selector switch to “Cut”. The cutter should move in one direction only and cut sample into the bucket. Selecting “Cut” again will move the sampler in the opposite direction, again cutting sample into the bucket. The volume of sample will depend on the cutter speed (see 5.11.3) and the slurry flow rate.
Testing the Metallurgical Samplers Commissioning
On-Line Sampling and Analysis System (MSA) Technical Manual 3.1 5-52
2. Shift samples . Set the time between samples to a short
period for test purposes and then check with the site metallurgical laboratory as to the shift sample timing they require and reset the timer after testing. Set the sampler selector switch to “Auto” and check that the sampler cuts are as per your selection. If problems occur during testing, refer Chapter 9 Trouble Shooting .
3. To test the calibration sampling function, perform the
following;’ a) Set the sampler selector switch to ‘Auto’. b) On the OI select the stream number and put i ts
sampler in ‘Calibration Mode. The MSA will continue with normal measurement sequence and timing until i t arrives at the selected stream. The WinISA computer will change the sampler to calibrate mode. This also means the counting line will change to the calibration counting time (user selectable but default is 5 minutes) and the sampler will be armed.
c) Watch the sample-outlet nozzle and count the number of cuts taken in the measurement period. With the default setting at 15 cuts in 5 minutes, cuts should be taken every 20 seconds.
d) Check the amount of sample collected in the bucket. Sample Size must be manageable by the site metallurgical laboratory for sample preparation and sufficient for the assay laboratory. Usually around 2 to 5 kilograms is satisfactory. If the volume requires changing, the number of cuts should be increased or decreased for this stream in the WinISA software. It is not recommended to take less than 10 cuts or more than around 60 cuts per sample. Maximum is l imited by the cutter speed.
If all of the tests fail then check the sampler wiring and electronic cards. There should not be any ‘Red’ overload LEDs on the sampler cards located in the main MSA controller (see photo left) . If the calibration sample fails then check the computer software configuration. For example, there may be too many cuts requested to fit into the calibration counting time. Refer also the WinISA User Manual and Chapter 9, Trouble Shooting .
Commissioning Testing the Metallurgical Samplers
On-Line Sampling and Analysis System (MSA) Technical Manual 3.1 5-53
This page is intentionally left blank
On-Line Sampling and Analysis System (MSA) Technical Manual 3.1 5-54
Section 5 – Commissioning Attachment 1–Consumables & Tools List
CONTENTS
List of Specific Tools and Consumables As Supplied with the Analyser
On-Line Sampling and Analysis System (MSA) Technical Manual 3.1 5-56
Section 5 – Commissioning Attachment 2–Test Data Sheets
CONTENTS
MEP/Signal Analyser Set-Up Details (Form-042)
MEP Detector/Channel Settings (Form-052)
MEP X-Ray Spectrum
Commissioning Checklist – MSA (Form-178)
On-Line Sampling and Analysis System (MSA) Technical Manual 3.1 5-58
Section 5 – Commissioning Attachment 3–MCA
CONTENTS
Pocket MCA Operation – Technical Note 24
On-Line Sampling and Analysis System (MSA) Technical Manual 3.1 6-1
6 Calibration
This section provides the basic information needed to calibrate an on-line analysis system incorporating a Multi-Element Probe (MEP). It assumes that a Metallurgical Sampler is fi t ted to each analysis tank of the MSA. If not, then you will need to follow this procedure but instead manually cut a sample yourself from the overflow weir under the inspection cover of the tank. It covers the physical taking of calibration samples from the in-plant analyser. The software manual should be used in conjunction with this manual for specific details about calibrating the analyser using the WinISA regression analysis software program (RARP).
6.1 Overview
The analyser system must be calibrated when it is first installed and commissioned in the plant. Calibration involves the taking of at least 30 samples from the stream to be calibrated. These samples are then chemically assayed in a laboratory either on-site or elsewhere and the assays are then correlated with the corresponding count-rates from the probe that were measured during the period that the sample was taken, usually this is 5 minutes.
Note: The analyser should be standardised before calibration
begins. Follow that procedure in the Commissioning section.
Overview Calibration
On-Line Sampling and Analysis System (MSA) Technical Manual 3.1 6-2
To obtain calibrations for the analyser system, count-rates measured from each MEP (stream) of the system are correlated with analysed mineral content and density using a multiple linear regression analysis software program. When a suitable calibration is obtained its performance is checked by comparing the calculated values against the observed assays for subsequent samples, using statistical and plotting routines. The “line of best fi t” to the data is determined by the method of least squares for a number of selected functions. The results are obtained as a plot of calculated values for each dependent variable against the values obtained by analysis. Calibrating an on-line analyser system involves the following steps:
• Equipment & resources needed for calibration.
• Taking a suite of approximately 30Calibration Samples from each analysis point (stream) where a probe has been installed.
• Preparing the samples, fil tering and drying.
• Chemically assaying the Calibration Samples .
• Entering the Data into Calibration Files for analysis with the RARP software program.
• Running regressions to find the best Calibration (Assay) Equations, including interpreting the results.
• Using the Calibration (Assay) Equation on-line.
• Checking the accuracy and reliability of the calibration equation.
Each of these steps is covered in this section.
6.2 Equipment & Resource Requirements
The following items are required for calibrating an on-line analyser system:
• 20 or more clean buckets of at least 10 litre capacity, with lids. Each bucket must be weighed, without its l id, to 0.1g accuracy and the weight written in permanent pen on the bucket.
Calibration Equipment & Resource Requirements
On-Line Sampling and Analysis System (MSA) Technical Manual 3.1 6-3
• Efficient on-site Sample Preparation Facilit ies and personnel to handle at least 30 samples per analyser (stream) to be calibrated over a period of up to 2 weeks, depending on the plant variations and scope of work. Typically, up to 10 samples per stream per day will be taken. For example a system comprising three analyser streams will require at least 90 samples in total to be taken in a period of up to one (1) week then further samples would be taken to check the calibration accuracy and reliabili ty.
• Equipment and resources required for sample preparation shall include:
- pressure fi lters - weighing scales to at least 0.1 g accuracy and
capable of weighing up to 5 kg (wet) samples - efficient sample drying ovens or lamps - sample trays and sample bags - log-book for sample information and tracking - personnel to prepare the samples
Note: The %solids of each sample must be measured with an accuracy of better than ±0.1 %solids using the wet and dry weights method.
• Chemical assaying facili t ies, either on-site or off, to provide chemical assays for all required elements from all the calibration samples. The total turn-around time including sample preparation must not be more than 48 hours so as to minimise the time required to calibrate the analyser system. Usually analysis would be required for between 20 and 40 calibration samples daily. Because the analyser accuracy is dependent on the chemical assays then the error associated with the chemical assays (and sample preparation) of the samples must be as small as possible.
Note: Chemical assay accuracy must be better than one third of the expected accuracy of the on-line analyser (at 1s.d.) to avoid contributing to the apparent errors of the analyser. i .e. an expected analyser accuracy of 5% relative error at 1s.d. will require a chemical assay accuracy of about 3% at 2s.d., or 95% confidence.
Taking Calibration Samples Calibration
On-Line Sampling and Analysis System (MSA) Technical Manual 3.1 6-4
6.3 Taking Calibration Samples
Some software configuring is needed to enable on-line measurements from the analyser to be automatically appended into the calibration data file for each stream to be calibrated during calibration sampling. The file type and name is “Calibration.DBF” for every stream and they are found in the directory folder created during initial set-up for each stream. This fi le also contains the standard count-rates and these are updated each day that calibration data is added to the file. I t is important that standard count-rates are obtained before starting calibration and that these are entered into the software data base so that they can be automatically added by the software to the “Calibration.DBF” files during the calibration phase. Chapter 5, Commissioning details the standardisation procedure.
Note: Please read the instructions in the software configuring section of the Software Manual before attempting to take samples. To obtain a calibration that will work for all plant conditions the samples must cover the complete range of plant operating conditions where possible however this is not normally possible nor practical during the commissioning visit and may take many weeks or months. Hence, during the commissioning and calibration period plant personnel are trained in all aspects of the calibration process so that they can continue maintaining and updating the calibrations where necessary. For correlation, the samples must correspond with the timed measurements of the analyser itself. The measurement is usually performed for five minutes and this is taken care of by the built in calibrate mode of the analyser. The procedure follows.
Calibration Taking Calibration Samples
On-Line Sampling and Analysis System (MSA) Technical Manual 3.1 6-5
6.3.1 Taking Samples 1. Place a clean and dry tared bucket at the Metallurgical
Sampler outlet of the analyser. 2. Ensure the sample selector switch is set to “Auto“
(see photo left). Then go to the OI panel and select the menu option <SelSampler> (see OI panel photo left) then select the sampler number that you want sample to be taken from. Now select the sampler mode <SmpMode> and set to “calibrate”. Select “yes” to the question “change bucket” (see photo bottom left). When the probe next visits the zone, computer starts i ts next counting (measurement) period for that stream you will see the “Taking Sample” message.
Note: Be aware of the probe sequence when requesting calibration samples. 3. A pre-defined number of sample cuts will be
automatically taken over the measurement period (normally 5 minutes). This number is defined in the in the WinISA software. Should there be too much or too lit t le sample collected, you may choose to alter the number of cuts (from the WinISA software configuration, default is 15 cuts) or the speed of the sample cutter. The latter is set on the “sampler speed selector switch” located inside the main MSA Controller. In most cases the laboratory will require at least 100 grams of solid for assaying.
4. When the sampling or measurement period is finished
the OI panel will display “Sample Taken” and the sampler will revert to “off” mode. If the analyser has been set up to take shift samples then ensure the sampler selector switch is left set to Auto (i.e. do not turn it off) and select <SmpMode>, “shift” and replace the shift sample bucket
5. At the end of the period the number of cuts taken by
the sampler will be checked by the software. If all is okay the calibration sample count-rates will be saved automatically in the calibration data fi le (Calibration.DBF) for that stream.
Taking Calibration Samples Calibration
On-Line Sampling and Analysis System (MSA) Technical Manual 3.1 6-6
6. Record the end time (± 1 minute is accurate enough), date and sample stream name. If you have more than one bucket in the plant, take care not to confuse buckets!
7. Place the lid on the bucket and carefully take the
sample to the laboratory without spilling or otherwise contaminating or changing the nature of the sample. Record sample details in the log sheet in the metallurgy lab.
You will now have a single composite sample which is representative of the sample flowing through the analyser during the calibration measurement period. The sample will normally contain between 1 and 5 litres depending on the flow-rate, the opening of the sample cutter (10mm is standard), the speed and frequency of cutting the stream, and the sampling period.
6.3.2 Rules for Calibration Sampling 1. The complete set of calibration data must cover all of
the range of conditions which occurs in the stream. For example, the samples must cover the whole range of elemental concentrations, mineralogy and matrix variations as well as variations in the density of the solution. If the samples do not cover these ranges, then the analyser may not give accurate results when these conditions are met in the future.
2. It is important to keep in mind that the calibration
equation has been made for the particular operating conditions covered by the samples in the data set. If a new set of conditions is encountered, the accuracy of the analyses from the calibration equations will deteriorate. In other words, accurate analyses can only be expected when interpolating within the range of conditions represented by the calibration data.
It is generally (theoretically) accepted that you can safely extrapolate about 30% of the range on either side of a particular calibration without too much error. The extent to which you can extrapolate depends on the correlation coefficient of the calibration equation so that if the CC is > 0.99, you can safely extrapolate 70% of one whole range either side of the present calibration range (see Correlation Coefficient later in this chapter). Set the limits of the assay equation appropriately. If CC is <0.9, extrapolation is not recommended (refer to section 6.5.6).
Calibration Assaying the Calibration Samples
On-Line Sampling and Analysis System (MSA) Technical Manual 3.1 6-7
3. Calibration samples must be collected and analysed with the maximum of care to avoid contributing to errors in the calibration equations. A poor result from the regression analysis should not be blamed on the analyser without a thorough investigation of all of the procedures used in obtaining the calibration data.
Note: If the equations are giving inaccurate results, additional
calibration samples should be taken and added to the calibration data set and new calibration equations should be found which cover the new operating conditions.
6.4 Assaying the Calibration Samples
Each sample must be chemically assayed for the required metal concentrations (by %weight) and its percent solids calculated.
1. The “%solids” of the sample is best measured by the wet and dry weights method so to start with, the sample must be accurately weighed in the bucket before it is dried. Don’t forget to take the bucket lid off if the bucket weight was measured without the lid on, otherwise leave it on. Try to use the same weighing scales as used to weigh the empty buckets.
2. Weigh a number of clean filter papers, if using a pressure fil ter to fi lter the samples and write the weight to 1 decimal place on the outside edge of the paper. It is best to use very fine fil ter paper, especially where fine mill ing is carried out as there may be a large percentage of slimes in the samples to be filtered.
3. Filter the sample to remove most of the water. This is best done in a pressure fil ter as it is far quicker and more efficient, but the method chosen will depend on what gives the best result for the particular slurry. If there is a large amount of slime in the sample (evident if the fi l trate is collected) then collect the fil trate from each sample and pour it back on top of the filter cake so as to minimise errors in the final assay that may be due to slimes loss.
4. Dry the sample: Put the fi l ter cake (sample and paper) onto a metal tray or dish and place in an oven or under heat lamps to speed up the drying process. However, care must be taken to ensure that the oven (or lamps) is not so hot that the minerals oxidise.
Definition of Terms Used in Calibrating Calibration
On-Line Sampling and Analysis System (MSA) Technical Manual 3.1 6-8
5. Weigh the dry sample and then calculate the %solids remembering to subtract the bucket, tray and fil ter paper weights. Make sure that the samples are at ambient temperature before weighing so that air currents due to the heat from the sample will not distort the measured weight.
6. Assay the samples in the normal manner in the laboratory. Sampling and analytical errors by the laboratory must be less than one third the expected accuracy of the analyser otherwise these errors will contribute significantly to the total error of the calibration. Assays that the MSA is not required to produce are not required from the assay lab either.
7. Enter the laboratory assays into your regression assay file as soon as you can. Refer to the calibration section of the Software Manual for details on how to create these data base files.
6.5 Definition of Terms Used in Calibrating
6.5.1 Measurement Time Regression Analysis uses the measurement time in calculating the reproducibility error in the assays (due to the reproducibility of the count-rates) for each equation. The reproducibility of the count-rates is dependent on the measurement time. The assay reproducibility is calculated at one standard deviation and is displayed in the output file as the "Stats Error", meaning the Statistical Error . The measurement time is normally 300 seconds (5 minutes), but if you use a different measurement period, you can enter this into the regression program so it calculates stats error correctly. The use of the measurement time arises with all nucleonic measurement equipment because the reproducibility of the measurements improves as the square root of the counting time. This means that if the count-rate averaging time is increased by a factor of 4, the reproducibility of the result will improve by a factor of 2. The “Stats Error” is used to evaluate whether the accuracy of the instrument is l imited by the reproducibility of the count-rates or whether it is l imited by some other factor.
Calibration Definition of Terms Used in Calibrating
On-Line Sampling and Analysis System (MSA) Technical Manual 3.1 6-9
If i t is l imited by the measurement t ime, then the time may be increased to improve the results. In practice, if the "Stats Error" is larger than half of the RMS Error (see definition in section 6.5.5), increasing the measurement time of the instrument should significantly improve the RMS Error. On the other hand, if the "Stats Error" is much less than half of the RMS Error, the measurement time of the instrument may be decreased without significantly reducing the accuracy or reproducibility of the measurements. This would give a higher throughput of samples with the instrument. As an example of changing the measurement time, assume that the measurement time is 100 seconds, the RMS Error calculated by the regression program for a particular equation is 0.035% Cu and that the Stats Error is 0.008% Cu. In this case the “Stats Error” is much less than half of the RMS Error. This means that the measurement time can be decreased without adding significantly to the RMS Error. We are allowed to increase the “Stats Error” to half of the RMS Error which in this case is 0.017%Cu (i.e. double the present value). Increasing the “Stats Error” by a factor of 2 means decreasing the measurement time by a factor of 4 to 25 seconds. Making this change would be highly beneficial because it would allow the operator to measure up to 4 times as many samples on the instrument in the same time without significantly affecting the accuracy of the results.
Note: For very low concentration measurement, increasing the measurement time may not improve the statistical error because the concentration is below the detection limit of the analyser.
6.5.2 Standard Count-rates
The calibration equation always uses normalised count-rates. The count-rates are normalised by dividing the actual (on-line) count-rates in each channel for each sample collected, by the standard count-rate for each particular channel. The standard count-rates are automatically inserted into the calibration data file each day that calibration samples are taken. Source decay is automatically compensated for, providing source details have been entered into the
Definition of Terms Used in Calibrating Calibration
On-Line Sampling and Analysis System (MSA) Technical Manual 3.1 6-10
WinISA software configuration (refer to the Software Manual for details). The standard count-rate in each column of the “Calibration.DBF” file is used as a divisor for all subsequent count-rates in that column until a new standards line is encountered. Hence, all count-rates from the samples are normalised with respect to the count-rates from the reference sample. The use of the standard line allows for long term changes in the performance of the instrument due to such factors as source decay and detector efficiency. When the performance of the instrument changes the count-rates for any sample will change in the same ratio as the count-rates for the reference sample (standard). Hence, the ratio of the count-rates from the samples to the count-rates from the reference standard is always constant, independent of all other factors. The data file may contain as many standard lines as required to compensate the data for changes in the efficiency of the instrument detector over t ime. Normally, Thermo Electron instruments are stable for very long periods of time (i .e. years) so only a few standard lines are required throughout the file (or for each new day when calibration samples are taken).
Note: Note that assays are not expressed as a ratio and so no standards need to be entered into the assay file.
6.5.3 Calibration Data Each data line in the Calibration Data.DBF file corresponds with the measurement of one calibration sample. Each line begins with the sample's identification, consisting of a string of up to 8 alpha-numeric characters. A Date/Time stamp is also included in each sample line. Then follows the count-rate data columns for each channel of the Signal Analyser. The first cell is left blank for each sample, this is where the sample’s identification must be entered. Standards lines will be inserted in between the calibration data lines. Each date change will show a new standards line when calibration samples are actually taken on that day.
Calibration Definition of Terms Used in Calibrating
On-Line Sampling and Analysis System (MSA) Technical Manual 3.1 6-11
6.5.4 Assay Data Each data line in the “Assay.DBF” file corresponds with the laboratory assays for that sample. Each line begins with the sample's identification which MUST be the same as that used in the Calibration Data.DBF file for that stream. Enter lab assay values and sample id’s using the RARP regression program Refer to the Software Manual for details on setting up your assay data base files.
6.5.5 RMS Error RMS Error is the standard deviation between the chemical laboratory assays and the instrument assays for a suite of samples and is calculated by:
−∑ 1N
) y - x ( = Error RMS
2ii
N
=1i
21
where N is the number of samples.
xi is the chemical assay of the ith sample. yi is the assay from the instrument of the ith
sample using the calibration equation. In general, the equation chosen will have the lowest RMS Error of all possible equation forms (see other rules also). The RMS Error is also known as the analyser Calibration Error . This error is comprised of the following errors: • Stats error (as described in section 6.5.1) • Particle Size Error • Mineralogy Error • Segregation Error • Sampling Error of the analyser • Laboratory Errors in sample preparation and analysis • Other Instrument Errors such as electronic
instability, dirty windows, etc The Total Calibration (RMS) Error is the square-root of the sum of the squares of all these errors.
6.5.6 Correlation Coefficient
This coefficient is a measure of the linear relationship between the ISA predicted values and the laboratory results. The correlation coefficient is dependant upon the range of the calibration assays and the RMS error: As the range increases, CC → 1 As the RMS Error decreases, CC →1
Running a Regression Calibration
On-Line Sampling and Analysis System (MSA) Technical Manual 3.1 6-12
If the correlation coefficient approaches 1, then you can safely extrapolate the ISA predicted assay values beyond the range of the calibration data set. CC < 0.9 do not extrapolate beyond data range CC > 0.95 can extrapolate 30% of range on either side CC > 0.98 can extrapolate 50% of range on either side CC > 0.99 can extrapolate 70% of range on either side The limits for each assay equation should be set according to these criteria. However, i t is always recommended that additional calibration samples be taken that “fit” the real operating range.
6.5.7 Relative Error The Relative Error is defined as the RMS Error divided by the mean assay often expressed as a percentage. For a good calibration, the Relative Error should be less than 10% and may be as low as 1% or less. In general the higher the mean assay the lower the Relative Error.
6.6 Running a Regression
Following is a general description of the Regression Analysis Program (RARP) that is used to find the best calibration equation for producing reliable accurate on-line assays from your analyser. The exact form of the best calibration equation depends on a range of factors such as the mineralogy, matrix and particle size of the material which is to be measured. Therefore, each analyser has to be individually calibrated over the range of ore blends and operating properties so that i t will give the best possible measurement accuracy. To find the best form of the calibration equation, the regression program cycles through all valid combinations of equations based on the data from the suite of calibration samples. This information is then presented to the user who can then compare/reiterate or choose a particular equation terms. The best equation should be chosen based on a comparison of the RMS Error, Correlation Coefficient, Relative Error and the Number of Terms used in the equation.
Calibration Running a Regression
On-Line Sampling and Analysis System (MSA) Technical Manual 3.1 6-13
For each stream to be calibrated, the program uses the “Calibration Data.DBF” file for that stream to obtain the count-rate data and also uses the assay data base file that was created by the user entering the laboratory assays. The Software Manual provides further details on using the RARP program. Regression program should be run on the WinISA server computer so chosen assays can be easily ‘Applied’ to the WinISA server configuration. If you run a regression on another computer, equations must be manually entered into the WinISA server configuration, using either the WinISA Delphi Client Configuration Wizard or the WinISA Panel.
6.6.1 Deleting Samples in the Regression The user can delete some samples from a particular equation. The program allows the user to do this inter-actively by either: 1. Looking at the table of the residuals and selecting
the point(s) with the highest residuals.
2. Looking at a plot (example in Figure 6-1) of the calculated assays versus the actual laboratory assay. The plot helps you to see if there are any sample points which do not seem to fit the same relationship as the rest of the samples (i .e. one or two points are a long way from the calibration line formed by the other samples). In this case, the sample(s) in question may be incorrect in some way - either the data may have been entered incorrectly into the data fi le, the assay for the sample may be wrong, the sample may have been contaminated etc. Whatever the reason, the cause should be investigated and corrected if possible.
3. Using the equations with samples already eliminated automatically by and presented to the user by the software program. It is recommended though that the user also manually checks the form of the equation and samples eliminated to ensure that the best possible equation is chosen.
Running a Regression Calibration
On-Line Sampling and Analysis System (MSA) Technical Manual 3.1 6-14
Figure 6-1 Example Regress ion P lot
The user can also reduce the range of the observed assays to obtain “better” equations in the operating range expected. When all of the required samples have been deleted, the user can re-evaluate the regression and then print a copy of the result or post the equation chosen to the software configuration, by selecting the “Apply” button in the regression software(RARP), for immediate on-line use.
Note: Normally no more than 10% of the sample points can be deleted without investigating further into the reason why so many samples don’t ‘fit’ the regression line.
6.6.2 General Rules for Choosing the Best Equation It is a good idea to consult your plant metallurgist regarding concentration range and desired accuracy. They may also provide useful hints about correction terms based on mineralogy and/or ore blending and/or plant operating condition. Other important rules which must be observed when choosing the best calibration equation for a particular application are as follows:
Calibration Running a Regression
On-Line Sampling and Analysis System (MSA) Technical Manual 3.1 6-15
1. Always make sure that the fundamental form of the equation is included when running the program. The fundamental equation relates the assay to the single most significant term. For example, the single most significant term in a calibration for %Cu is the copper count-rate (viz. CuKa). The results for the more complex equations can be compared to the results for the fundamental equation to see if there really is an improvement. Extra terms are often needed to cover different mineralogical forms.
2. Always look at the plot for the fundamental equation form. If the plot shows one or two bad points on this graph, i t is a strong (but not conclusive) indication that these data points are in error. If the same points are bad on the graphs for the more complex forms of the calibration equation and for other assays, then you can be much more certain that there is an error in the data for these points and hence you can eliminate them completely from the data set.
3. Always ensure that the coefficient of the fundamental term has the correct positive or negative sign. In general, the fundamental metal count-rate term in an equation will be positive in sign.
For example, in a calibration for %Cu, the coefficient of the copper count-rate term should always be positive. In a density calibration, however, the coefficient of the scatter count-rate must always be negative in sign. If the sign is not correct, look at the data fi le to see if there is an error.
4. In general, all calibration equations should be based on at least 20 individual sample points. An initial calibration can use fewer samples as long as the number of terms is l imited. The following table shows the maximum number of terms that are permitted for use in a calibration equation based on the number of sample points in the data set:
On-Line Sampling and Analysis System (MSA) Technical Manual 3.1 6-16
Note: In general you should not need to use more than 4 independent terms in a calibration equation. 5. If the plot of the results of the best regression
equation shows that there are a small number of sample points which do not fit the calibration as well as the majority of other points (see Figure 6-1), you may want to delete them from the data set and re-run the regression. This will normally improve the calibration equation and may even give a better equation with fewer terms. Sometimes, one or two points are so far from the other points that there is l ikely to be an error in the data entered into the file and it and should be checked.
6. Before deleting each point, first check that all of the data for this point has been entered into the data fi le correctly. If i t is correct, then investigate further to find the cause of the problem. For example, you may want to have a couple of the samples including this one re-assayed. It is best if you can correct the data in this manner. After trying unsuccessfully to correct the data, you may then delete the point(s).
7. Statistically, you may only delete up to 10% of the total number of sample points. If more than 10% need deleting to make the regression acceptable, there could be a problem with either the sampling method or analytical (chemical) accuracy. Eliminate all errors of this type before proceeding with the calibration. This is very important to ensure that the analyser is calibrated with the best possible accuracy.
8. Look for a 10% relative improvement in RMS Error before deciding to remove one more sample point, or to use an equation with one more term.
9. Ensure that Statistical Error is less than half the RMS Error.
10. In summary, look for: - low RMS Error - low Stats Error (1/2 RMS or less) - High Correlation Coefficient (>0.9) - Fewer terms (must include fundamental) - Positive fundamental term (except %solids where
fundamental term is negative)
Calibration Running a Regression
On-Line Sampling and Analysis System (MSA) Technical Manual 3.1 6-17
- Look for a 10% relative improvement in RMS Error before deciding to remove one more sample point, or to use an equation with one more term.
Calibration Checking the Calibration Accuracy
On-Line Sampling and Analysis System (MSA) Technical Manual 3.1 6-18
6.7 Checking the Calibration Accuracy
After the system has been calibrated, i t should be checked periodically to ensure that the calibrations are producing the correct results particularly since initial calibration equations are only as effective as the range of ore types and operating conditions encountered during the initial calibration. This will require the building-up of data from calibration samples to cover as full a range as possible. Based on the results of the checking, it may be necessary to up-date the calibration (assay equation) and the procedure given here for checking the calibration accuracy should be followed. Once or twice per week the on-line assays from the analyser should be compared with assays from the laboratory to ensure that i t is giving the correct results. It should be noted that i t is best to take a calibration sample as a comparison sample over a 5-minute interval instead of using shift composites or 2 hourly grab samples. There are several reasons for this: 1. Shift composite samples average out the normal
fluctuations in the performance of the plant so they only give a fairly superficial comparison. The MSA analysis tanks operates largely independent of flow rate whereas a shift sample will be affected by flow rate fluctuations.
2. Sometimes the shift composite sample is not a true average of the performance of the plant over the shift . This can occur if there is a major disturbance in the operation in the plant between times when sub-samples of the composite were taken.
3. A sample taken over the measurement period from the stream being analysed corresponds exactly with the slurry which the probe was measuring over the same time period.
If you wish to use plant shift samples for the comparison, more care should be taken in interpreting the comparison between the shift results and the corresponding results from the on-line analyser such as comparing %solids, and monitoring flow rate fluctuations throughout the shift . If the analyser is consistently displaying assays that are significantly different (outside the statistical normal distribution, see section 6.8) to the shift samples then extra calibration samples should be taken and new equations generated to fine-tune the calibrations. Additional samples are taken and assayed exactly as per the procedures given earlier in sections 6.3 and 6.4.
Comparing Check Samples with On-line Assays Calibration
On-Line Sampling and Analysis System (MSA) Technical Manual 3.1 6-19
6.8 Comparing Check Samples with On-line Assays
The most useful method is as follows: 1. At the computer note the corresponding on-line assays
for each sample from the each analyser, at the (finish) time the sample was taken. This can be done by checking the tabular assays screen, or using the “Assay.DBF” file located in the same folder as the Calibration Data.DBF file. This option must be selected either during installation of the WinISA Delphi Client or set up in the WinISA Delphi Client ‘Options’ menu.
2. Record the laboratory and on-line assays and their difference.
3. Repeat steps 1 and 2 until at least 20 samples have been taken, and whilst running the same calibration equations for the stream being checked (otherwise your ISA reading may vary too much).
4. Plot the difference between the two assays, for each sample as you obtain the data, on a graph versus time (see example graphs below). This graph should contain the results for all of the previous samples and so you will build up a graph that indicates the performance of the on-line analyser over a long period of time.
5. The plot of the difference should show a small scatter about zero such that around 67% of your check samples should fall within 1RMS and around 95% within 2RMS as per a statistical normal distribution (see normal distribution curve). The scatter for the samples taken should be about the same size as the RMS error from the initial calibration (see Stream 1 data in Figure 6-2). In this case, the calibration is good and the analyser is operating correctly. Deviations from the ideal graph described above indicate a problem and a description of various symptoms and remedies is given with each graph (see Stream 2 & 3 data in Figure 6-2).
Note: The error in the analyser assay value is always ±The Total Calibration Error . A check sample that is analysed in the laboratory has an error ±The Total Lab Error. Hence, the difference between the two assay readings then has a total error of ±(Total Calibration Error + Total Laboratory error). In a well maintained system, this condition is true for 67% of the suite of check samples taken. 95% will be within a multiple of 2 times this total error. If the check sample is added to
Comparing Check Samples with On-line Assays Calibration
On-Line Sampling and Analysis System (MSA) Technical Manual 3.1 6-20
the calibration, the total error is then inclusive of lab error.
Calibration Comparing Check Samples with On-line Assays
On-Line Sampling and Analysis System (MSA) Technical Manual 3.1 6-21
Stream 1: An occasional point a long way from zero, with most points (at least 68%) within ±1RMS. This indicates that the analyser is working okay but occasionally something unusual happens that gives a sample assay difference that is much larger than usual. Check that the probe window is clean each time a sample is taken and that sample collecting, preparation and analysis is consistent. Also check that the water sprays are either consistently off or on depending on the requirement at the time of calibration, and that the stirrer is operating correctly. Stream 2: Most samples were initially within ±1RMS which indicated that the analyser was working okay but then after a period of time there is a definite drift away from the normal operating range. 1) This may indicate that the probe source has decayed significantly and that source decay has been removed from the software. Check software configuration, re-measure the standard count-rate and up-date files. A decrease in probe detector efficiency could also cause this effect and standardising will overcome this. Also check that the probe set up parameters (eg. bias, SCAs, gain, etc). 2) Change in one type (i.e. mineralogy or blending). 3) Stirrer impellor wear. 4) Dirty MEP primary window. Stream 3: Most samples were initially within ±1RMS which indicated that the analysis system was working okay but then after a period of time there is a definite scattering of the samples which indicates that there is a problem with the analysis system. Check the probe window (for cleanliness) probe set up, measure the probe resolution, check the probe spectrum and perform a stability test over at least 24 hrs. If any of these checks is abnormal then follow the procedures given in this manual to locate. and fix the problem.
Figure 6-2 Example plots of the di f ference between on-l ine and laboratory assays
Stream 1 Check Samples
-4
-3
-2
-1
0
1
2
3
4
0 2 4 6 8 10 12 14 16 18 20 22 24 26 28 30
Time
Diff
eren
ce (R
MS)
Stream 2 Check Samples
-4
-3
-2
-1
0
1
2
3
4
0 2 4 6 8 10 12 14 16 18 20 22 24 26 28 30
Time
Diff
eren
ce (R
MS)
Stream 3 Check Samples
-5
-4
-3
-2
-1
0
1
2
3
4
5
0 2 4 6 8 10 12 14 16 18 20 22 24 26 28 30
Time
Diff
eren
ce (R
MS)
Comparing Check Samples with On-line Assays Calibration
On-Line Sampling and Analysis System (MSA) Technical Manual 3.1 6-22
An alternative method is to calculate the RMS Deviation on the suite of check samples that you have taken and re-calculate this each time a new check sample is added. To use this method you will need to take at least 20 check samples. The RMS deviation that you calculate on your check samples should be close to that obtained for the calibration, which is the assay equation that is being used at the time of taking the check samples. If not then there is a problem with the operation of the analyser and some further checks need to be done as per the remedies given with the graphs above.
On-Line Sampling and Analysis System (MSA) Technical Manual 3.1 7-1
7 Operation
This section is written for those personnel who will oversee the daily operation of the equipment. It includes a description of the components of the system and more particularly the purpose of the electronic cards and modules. This section may be used in conjunction with section 5, Commissioning and section 6, Calibration as most of the procedures required to keep the on-line analyser operating efficiently and reliably are given in those sections.
The on-line sampling and analysis equipment provides measurement of mineral slurry for the determination of elemental assays and percent solids. The analyser uses a solid-state Multi-Element Probe (MEP) that can measure up to eight elements and percent solids simultaneously. The Multiplexing part of the analyser enables just one probe (MEP) to be used to “cost-effectively” measure more than one stream. The in-built sampling system provides for representative sampling of the slurry for analysis as well as metallurgical accounting samples. The system components are described in detail along with a description of function and purpose of each electronics module and card.
Safety & Environmental Protection Operation
On-Line Sampling and Analysis System (MSA) Technical Manual 3.1 7-2
7.1 Safety & Environmental Protection
7.1.1 Safety Mode In the event that any operating conditions are abnormal (eg. power, probe window rupture, etc.) the probe will be automatically lifted from the slurry by its pneumatic hoist to prevent possible damage to the probe’s detector if a window rupture occurs. The probe can not be lowered until such time as the problem is rectified. The MSA unit will also automatically change to “Manual Mode”, preventing it from moving up, down or laterally. Safety sensing circuits mean that the problem must be fixed before the MSA can be put back into automatic operation (i .e. “AutoMode”).
Note: There are two types of manual mode: 1) ‘man’ where another event such as WR, air fail or
EMstop occurs. When the event is cleared or repaired, the MSA will return to “Auto Mode”.
2) ‘Man’ where manual mode is selected at the OI. To return the MSA to “Auto Mode” it must be selected at the OI.
A "Mains Isolator" switch is provided on the MSA unit (see photo left). An Emergency “Stop” latching press button is located on the MSA (see photo left) . Pressing and turning this button into its lock position freezes all operation of the MSA unit, including stirrers and samplers. The probe will also freeze in whatever position it was when the “Stop” button was pressed, i .e. i t IS NOT “homed” to the raised position. The MSA unit control will also revert to “manual mode” and so operation cannot resume until the “Stop” button is released. Stirrer Overload Circuits are provided for each stirrer motor inside the main MSA Controller (see photo left) . If a stirrer overloads and "trips-out" then it must be reset manually. The MSA RLC will recognise this state and prevent the probe from measuring this stream (zone) until the problem is fixed. This condition is one of a range of abnormal operating conditions (MSA status') which may be encountered (see section on MSA status and error messages).
Operation Safety & Environmental Protection
On-Line Sampling and Analysis System (MSA) Technical Manual 3.1 7-3
Air Pressure Failure. The RLC also monitors the status of the air pressure and in the event that the air pressure fails or fluctuates significantly (to below about 400 kPa, depending on the setting of the pressure switch) the analysis probe will be automatically lifted from the slurry and a warning will be displayed at the computer to inform the operators that there is a problem. An air failure message will also be displayed on the OI panel and the MSA will revert to “manual mode”. When air pressure is restored and the next move command is sent then (in "AutoMode") the MSA will resume normal operation. Probe Window Rupture. The probe window status is also monitored by the RLC and reported as either "Window OK" or Window Rupture" at the OI panel. Whilst operating in "AutoMode" a "Window Rupture" alarm message will also be displayed at the computer if a window rupture is detected. If a window rupture is detected the probe will be automatically raised from the slurry and control will revert to “manual mode”. The MSA will not resume operation until such time as the problem is fixed. Safety Guards, with an Interlocked Gate (see photo left), are provided on the MSA frame to prevent injury from the moving probe. When the interlocked gate is opened, the probe is raised and its movement stopped. The MSA reverts to “manual mode” and will not return into “AutoMode (operational)” until the gate is closed. When the interlocked gate is opened, the stirrers can continue working to prevent the analysis tanks from sanding up by pressing the “Stirrer Override” button (shown in the photo left) . When the gate is open a message “Gd Open” will be displayed on the OI panel status display.
7.1.2 Radiation Shielding The MEP containing the radioisotope only emits radiation in a forward direction from the probe head when the standard biscuit has been removed and the isotope is exposed. Under normal operation (immersed in the analysis tank) the slurry and tank act as a shield thus shielding any radiation from the probe when the probe is moving up, down or laterally, shielding is provided by the built-in metal plate and samplers. Further details on radiation are provided in chapter 1, Warnings and Cautions.
Safety & Environmental Protection Operation
On-Line Sampling and Analysis System (MSA) Technical Manual 3.1 7-4
7.1.3 Environmental Protection By its nature most of the mechanical parts of the analyser system have to operate under the normally arduous environmental conditions that prevail in a mineral processing plant. The Thermo Electron design minimises the number of moving parts thus exposed and specifies large safety margins and wear lifetimes on those that are. Electrical and electronic control equipment is environment protected to AS1939-1990 class IP66 . Materials Specifications are given in chapter 3.
7.1.4 Starting and Stopping Except in an emergency, the MSA should only be stopped and started from the OI panel at the unit i tself by selecting the “Manual” and “automatic” operating mode. In “manual mode” the MSA unit WILL NOT respond to any “move” commands from the ISA computer. The probe will however be raised from the slurry in the event of a window rupture. To re-start the MSA unit the “automatic” operating mode must be selected at the OI. The MSA operation can also be stopped by opening the interlocked gate. The mains power can be locked out at the Mains Isolator switch on the front panel of the main MSA controller (see photo left). On powering-up the MSA, the MEP will automatically move through a “Position Test”. This automatic procedure self-tests that the MSA position sensing components (proximity sensors, l imit switches), probe movement, motor status, etc., are working. If a failure is detected an error message will be displayed on the OI panel status line menu (see next section and chapter 9, Trouble Shooting). MSA Status. On power-up the OI panel will always display the status of various components of the MSA unit which are under the control of the RLC (eg. stirrers, probe, air , l imit and proximity switches, etc). The RLC will also detect any such component failure or abnormality during normal operation of the MSA unit and report i t to the computer as well as display it in the “status” message line on the OI panel (see photo left). If the MSA does not go into a “Position Test” when powered up then the RLC may have lost i ts firmware configuration, in which case you will need to follow these steps;
Operation Safety & Environmental Protection
On-Line Sampling and Analysis System (MSA) Technical Manual 3.1 7-5
1. Re-enter the RLC Zone Mask (<ZoneMask>) for your
MSA (this is provided on installation by the Company or it can be found in the section covering the OI RLC menus) in chapter 7, Operation .
2. If you have metallurgical samplers then you will also need to enter the RLC masking for these by selecting the menu option (<SMPMask>).
3. Re-enter the available zones, i .e. the zones, 1 to 12 that you want to measure (<ZneAvail>, see OI RLC menu section) in chapter 7, Operation .
4. Check the (Service Bay) has been correctly set, usually this is the last zone. If you prefer a different zone, enter i t here.
5. If you want the MSA to resume normal operation automatically after a power failure, check now that <AutoStart> has been set to YES.
6. Select <Automode>, the MSA should then perform a “Position Test”, if not turn off then on the MSA power. If a “Position Test” is sti ll not possible, then check the OI panel display for any error messages. If an error message is displayed that indicates there is information being down-loaded then this means the RLC is obtaining its embedded code (Application code) from the ISA computer, of course this can’t happen if the computer is down, or the data line between the MSA and computer (or converter unit) is faulty, in which case the RLC will try indefinitely to obtain the Application code it requires so check the ISA computer and data comms (AIN).
Note: When application code is being downloaded from the computer the TXEN, RXD and TXD LEDs will flash on the AM955 converter unit (see figure 5-6). Also the LEDs on the AM092 card in the signal analyser and on the AM777 controller will flash at the same time as the AM955 unit (see Figure 5-2 for details of the AM092 card and Figure 5-3, module A3, for the location of the AM777).
Safety & Environmental Protection Operation
On-Line Sampling and Analysis System (MSA) Technical Manual 3.1 7-6
7.1.5 Sampler Control A sampler selector switch is available for each Metallurgical Sampler fi t ted on the MSA. These switches are located near the sampler cover i tself (see photo left) .
7.1.6 Power Failures
On a power failure, the MSA probe will be raised from the analysis tank that i t was measuring at the time of failure. On resumption of power, the MSA unit will continue operation according to the ISA computer sequence, provided the <AutoStrt> option at the OI panel has been set to "yes”. If this option was set to "no" then the MSA unit will revert to "manual mode" and thus not continue its normal operation until i t is reset to "AutoMode" at the OI panel and the next "move" command is received from the ISA computer. If the ISA computer fails, whether it be a power failure or shutdown of the server software, the MSA unit will stop operating, and the probe will hold its current position (usually down in the last zone measured). The MSA will remain in “Automode” awaiting further instruction. The MSA will only continue automatic (normal) operation upon resumption of the computer power and server software program. The controlling server software will automatically re-start after power resumption if setup at the computer to start up on boot as a service.
Operation Multi-Stream Analyser (MSA)
On-Line Sampling and Analysis System (MSA) Technical Manual 3.1 7-7
7.2 Multi-Stream Analyser (MSA)
7.2.1 Basic Operation MEP The MSA util ises the Multi-Element Probe (MEP) for measuring up to twelve (12) streams on a time-sharing basis using a separate analysis tank for each stream to be measured (refer to section 7.2.2). Probe Washing A probe water spray is built-in to wash the probe between measurements so that stream cross-contamination doesn't occur. This water spray can be started and stopped by selecting the OI menu option, <PrbSpray> . However, this spray must always be on during normal operation of the MSA unit. Probe Movement Probe (MEP) movement is controlled by the in-built RLC, however the computer controlling software is configured with the stream measurement time, sequence and frequency. Movement of the probe is actuated by a "move" command received from the computer, provided the MSA is in "AutoMode" of operation. If the MSA is in "manual mode" then movement of the probe can only be done by manually selecting appropriate menu options from the Operator Interface (OI) panel. The MSA unit can only resume its configured movement pattern when set to the "AutoMode". • AutoMode: In this “remote control” mode, the probe
will move according to instructions from the computer. i .e. , the computer is configured with the measurement time (in integral seconds) for each stream and the sequence in which the streams are to be analysed. The MSA software is configured during commissioning of the MSA on-site. The "AutoMode" of operation is selectable from the OI panel on the MSA unit. For safety reasons, switching into automatic from manual at the remote computer is disallowed.
Multi-Stream Analyser (MSA) Operation
On-Line Sampling and Analysis System (MSA) Technical Manual 3.1 7-8
• Manual Mode: In "manual mode" the computer control is overridden and control of the probe movement is solely from the OI panel on the MSA itself i .e. “local control”. In this mode the probe will not move until told to do so from the OI panel. To move the probe up or down or an arbitrary distance left or right, use the <Move Probe> menu option on the OI. Note that this will not allow you to lower the probe unless it is positioned over a tank or in the service bay (where fitted). To move the probe to a specific zone, choose Sel Zone and enter the zone number. A list of the OI menu options is provided in a later section in this chapter. There are two types of manual mode;
1. “man” made with a lower case ‘m’ where another
action such as Window Rupture, Air Pressure Failure, Emergency Stop or Guard Open have occurred. The RLC reverts from ‘Auto’ mode to ‘man’ mode when the fault/condition occurs, and automatically returns to ‘Auto’ mode when the fault/condition clears. Selecting ‘Auto’ mode at the OI will not return the MSA to Auto mode until the fault/condition clears.
2. “Man” mode with an uppercase ‘M’ where the user
has selected Manual Mode at the Operator Interface. The MSA will remain in Manual mode regardless of power being turned off and on, or any fault or other condition clearing. It will only return to ‘Auto’ mode if selected at the OI, and if there are no other faults or conditions that might cause the MSA to be in ‘manual’ mode.
Operation Multi-Stream Analyser (MSA)
On-Line Sampling and Analysis System (MSA) Technical Manual 3.1 7-9
• Park Probe: When first installing the MSA, a probe
"park" position (service bay) should be allocated to the MSA if a separate maintenance bay is not attached. This means the MSA unit is configured so that when the “Park Probe” button (see photo left) is pressed the probe will be automatically raised from the slurry (if i t was measuring at the time) and moved to the zone that was allocated as the service bay. If a maintenance bay is included with the MSA unit then the probe will automatically move into this bay when the “Park Probe” button is pressed. If i t doesn't then you may have to tell i t that a maintenance bay is attached by allocating the "park" position (zone) as this bay. To allocate a "park" zone (service bay) the operator must select the <ServcBay> menu option at the OI panel then enter the zone number (eg "6"). Parking the probe is generally used when maintenance on the probe is required. This may include LN2 fi l l ing, window changing, etc.
Whenever the probe is parked, the MSA control will always revert to "manual mode" and therefore, the probe will not move under instructions from the computer until such time the “Park Probe” button is released. If the control does not automatically revert to the computer (automatic mode) then re-select the "AutoMode" at the OI panel again. • Raise Probe : An additional “Raise” button (see photo
top left) is provided to allow the operator to raise the probe from the slurry after parking. The probe can then be washed off easily and maintenance performed, including changing the window assembly.
Analysis Tanks Each stream to be measured by the MSA is directed through its own analysis tank (zone). Standard MSA analysis tanks are designed to take no more than 15 m3/hr slurry flow either as a full-flow stream or a sampled stream. Sometimes these tanks will not take the specified maximum flow if there is excessive frothing such as is the case with concentrate streams. It is important that the slurry flow-rates are maintained at the tank design levels throughout the operating life of the MSA as significant changes in the slurry presentation to the probe may result in the calibrations becoming unreliable, thus providing incorrect on-line assays. It is particularly important that any primary (and secondary) sampling equipment used to provide the sampled flows to the analysis tanks be maintained.
Multi-Stream Analyser (MSA) Operation
On-Line Sampling and Analysis System (MSA) Technical Manual 3.1 7-10
Each analysis tank contains a stirrer for which an independent on/off isolator switch is provided on the controller side of the MSA frame (see photo left). It is important, whilst slurry is flowing, that these stirrers are kept operating otherwise the analysis tank may sand up. A failure of a stirrer will be registered by the RLC, an error will result and the probe will not visit that zone again until the problem is fixed. A water spray is also included in each tank of the MSA unit. They are manually operated (on/off) by a needle valve (one per spray) located on the rear of the MSA frame (see photo left). A main water isolation valve is also located here which will shut off all water supply to the MSA unit. The purpose of tank water spray is to break down excessive froth, particularly in concentrate streams. It is important that a water spray is kept operational if that analysis tank’s spray was used during calibration of that stream. Metallurgical Samplers Metallurgical Samplers, if fi t ted to the outlet side of the analysis tank (see photo left), have both automatic control (configured at the OI panel) for the purpose of taking shift composite samples and calibration samples, or local manual control (operator controlled) for taking spot samples (this is via the sampler isolator switch mounted near each sampler, see photo left). Control over the samplers is via the OI panel on the MSA unit, with the exception of the calibration sample time period and the number of sample cuts required in any given sampling period (this is configured in the computer software). By selecting the <Smp-Mode> OI menu option, the user can select one of the four sampler operating modes; "manual", "calibration", "standard shift" or "random shift". The user should also refer to the later section on using the OI panel. • Manual Cut: The user can select <Cut>at the sampler
switch to actually take a sample and so can be used to take a metallurgical spot sample from any one of the MSA streams (zones), even if the probe isn't measuring that stream.
Operation Multi-Stream Analyser (MSA)
On-Line Sampling and Analysis System (MSA) Technical Manual 3.1 7-11
• Calibration Mode: In "calibration" mode a sample will automatically be taken from the next stream (zone) which is selected from the OI panel and the corresponding probe count-rates will then be stored automatically in that streams “CalibrationData.dbf” fi le at the computer. The number of sample cuts taken whilst the probe is in the zone depends on the "number of cuts per sample" defined in the computer software configuration and this is turn will depend on the measurement time period. This only applies if the MSA unit is in itself operating in "AutoMode".
• Shift Mode: There are two further modes for shift
samples; one is the "standard shift" mode which provides the operator with a composite shift sample that is collected over a plant shift (configured in the computer software) with sample cuts being taken at regular t ime intervals pre-set by selecting <Smp-Time> at the OI (this sample cut interval need only be set once).
“Random Shift” mode provides shift samples composed of samples which are cut randomly within a pre-set t ime interval. The user is prompted to pre-set a minimum time required between such samples so as to avoid the possibility of two samples being taken very close together.
7.2.2 Operation of the MEP
The MEP uses a low-energy radioisotope X-ray source and a Si(Li) solid-state X-ray detector whose high selectivity and sensitivity enables the measurement of very low concentrations of elements, such as those encountered in copper tailings streams. The probe is capable of measuring elements down to calcium in the table of atomic elements and can measure up to eight elements and solution density simultaneously.
Multi-Stream Analyser (MSA) Operation
On-Line Sampling and Analysis System (MSA) Technical Manual 3.1 7-12
The MEP uses the radioisotope source to excite fluorescent X-rays from elements in a mineral slurry or solution (details of the radioisotope used in your probe are stamped on the radiation label on the probe and are also given in the Data Sheets provided in Attachment 2 in chapter 5). Each element in the sample emits fluorescent X-rays of an energy and intensity which is characteristic of that element and its concentration. The fluorescent and back-scattered X-rays from the solutions impinge on the detector to produce small electrical pulses that are amplified and transmitted to the Signal Analyser electronics unit for processing. The voltage of the electrical pulse is proportional to the energy of the incident X-ray. The number of X-rays is proportional to the elemental concentrations in slurry. The scattered X-rays are used to provide measurements of the density. Fluorescent X-ray energies for the most commonly analysed elements are given in chapter 5, Commissioning . The X-ray energy spectrums for the MEP(s) installed in your plant are provided in Attachment 2 in chapter 5, Commissioning .
Note: Radioisotope sources used in the probes have a recommended working life (RWL). Usually this is between 5 and 15 years. The RWL DOES NOT imply that the isotope cannot be used after that period. It means that the local radiation authority may require a wipe test on the source after that period to check the source’s integrity so that it can continue to be used for its application. Check with your Radiation Safety Officer (RSO) or local radiation authority.
Operation Multi-Stream Analyser (MSA)
On-Line Sampling and Analysis System (MSA) Technical Manual 3.1 7-13
7.2.3 Liquid Nitrogen Requirement of the MEP
The MEP detector needs a continuous supply of liquid nitrogen LN2 (to keep it below 100 Kelvin while it is operating). Refer to section 2.8.3 and Routine Maintenance section 8.1.2 for LN2 fil l ing requirements. This low temperature is required to reduce the thermal energy of the electrons in the detector and FET so that their contribution to the electronic noise of the system is minimal.
Warning: If the bias voltage is applied to a detector that is not sufficiently cooled, i t may be seriously damaged. Never use any other form of cooling other than LN2. There are devices in the probe which offer some protection against “warming up”; a l iquid nitrogen sensor in the dewar which detects when the level decreases to less than about one li tre and a resistance thermal sensor (RTD) which monitors the detector 's temperature and automatically shuts down the bias supply if the temperature increases above about 140 Kelvin (-133oC). The bias supply is automatically restored after refill ing the probe dewar when the temperature returns to normal. Safety issues with safe handling of LN2 are provided in section 1, Warnings and Cautions.
Warning: The more times the MEP detector is allowed to run dry of
LN2 the risk of detector failure increases exponentially. The detector 's LN2 dewar is encased in a heavy stainless steel dewar cover (upper shroud). This cover protects the detector dewar, minimising LN2 losses and microphonic noise effects due to plant vibrations. The clip-down lid for LN2 fill ing must always be closed properly to ensure that the nitrogen gas boil-off flows down the inside edge of the shroud to keep it free of moisture. The gas exits the shroud by way of the electrical conduit. Do not leave the foam plug inserted as this is for transport only to prevent dirt from entering the dewar . In the event that the probe completely runs out of LN2, turn off the power and allow it to warm up to room temperature. This will take about 24 hours.
Multi-Stream Analyser (MSA) Operation
On-Line Sampling and Analysis System (MSA) Technical Manual 3.1 7-14
Do not apply extra heat to attempt to speed up this process. Several days without LN2 cooling will usually have no detrimental effect (although it is best to minimise the number of warm-ups, to maximise detector life). After refill ing, the probe should be left for two to four hours before applying the bias voltage so that the unit has time to cool down and re-establish a working vacuum.
7.2.4 MSA Controlling Electronics There are two main MSA Controllers in an MSA unit, one of which incorporates the RLC (see photo left) as its stand alone embedded logic control element. The RLC is l inked to the Operator Interface (OI) panel mounted on the outside panel of the enclosure. The RLC looks after all the details of operating the MSA such as probe movement, st irrer operation and the Metallurgical Sampler operation. Under normal operation the MSA is run in "AutoMode" which means the probe movement and stream measurement time and sequence are determined by the user defined configuration in the computer software. "Manual mode" can only be selected from the OI panel. The MSA executable module (Application code) is down-loaded to the RLC via the RS-485 data cable from the computer on initial start-up. If a modem is connected to the computer, up-dates of this module can be down-loaded to the Client 's MSA from the Company head office. This controller also contains a single phase AC power outlet for connecting a Multi-Channel Analyser (MCA) during setting up and testing. The Signal Analyser chassis is also mounted inside this controller cabinet. The other Controller contains the stirrer overloads, miniature circuit breakers (MCBs), sampler cards and the mains supply terminals (see photo left). An AC variable speed motor drive is also mounted inside this enclosure. This is factory set and the settings used are shown in Table 7-1.
Operation Multi-Stream Analyser (MSA)
On-Line Sampling and Analysis System (MSA) Technical Manual 3.1 7-15
Allen Bradley AC Drive Parameter Settings – Model 160
Parameter Number Parameter Name Default Value MSA Setting
30
Accel Time
10.0s
1.2s
31
Decel Time
10.0s
0.4s
35
Base Frequency
60 Hz
50 Hz
36
Base Voltage
460 V
400 V
38
Boost Select
4
8
42
Motor Overload Current
115%
1.1 A
50
Restart Tries
0
2
61
Preset Frequency 0
3 Hz
0 Hz
62
Preset Frequency 1
20 Hz
30 Hz
63
Preset Frequency 2
30 Hz
40 Hz
64
Preset Frequency 3
40 Hz
50 Hz
Note: All other parameter settings are default
Table 7-1 Var iable Speed Dr ive Factory Set t ings
Multi-Stream Analyser (MSA) Operation
On-Line Sampling and Analysis System (MSA) Technical Manual 3.1 7-16
7.2.5 Using the Operator Interface Panel
The Operator Interface (OI) panel located on the outside of the RLC MSA Controller has a membrane keypad and a LCD display of 2 lines and 40 characters. It also has Run and Attention LED indicators (see photo left). This OI panel enables user interaction with the MSA unit via the RLC. In both "automatic" and "manual" modes of operation the user has access to all the OI functions available with their pass code level of access (see later) which must be entered at the menu <MenuMode>. The (AM894) OI panel is shown schematically below.
Menu items can be of two types, "Display Only" or "Enter Data". All types are selected via the function keys. Selecting a "Display Only" i tem will display a message (usually a status report) on the top line. Selecting an "Enter Data" item will display a message which will generally contain the current value of a data item, the allowable limits and a request to enter a new value. New values to be entered are generally numeric. As the numeric keys ( <0> <1> <2> <3> <4> <5> <6> <7> <8> <9> ) are pressed, the new value is evaluated and displayed. If i t is greater than the upper limit, the key is ignored. In some cases, numerated values are entered by using the arrow keys. In these cases, the user is informed of this option. <DEL> This key will delete the least significant digit of the current value. During the "Enter Data" sequence, pressing the <Del> with no data entered key will abort the sequence and return to the menu at any time. The direction keys are usually ignored in this mode.
Operation Multi-Stream Analyser (MSA)
On-Line Sampling and Analysis System (MSA) Technical Manual 3.1 7-17
<ENTER> When the desired numeral or arrow has been typed, pressing the <Enter> will have this value accepted and return to the main menu. <F1>, <F2>, <F3> and <F4> are the Function Keys. Start-Up Menu. Upon start-up, the OI panel will display a status line at the top (see photo left) and a selection of 4 menu options directly above the function keys (<F1> <F2> <F3> <F4>). To select a menu option press the <F..> key immediately below the menu item you wish to access. The menu would now normally break down into a lower level of a further 4 menu items (these are discussed further below). The <UP> & <Down> keys are used to move between the various menu levels. There are seven (7) levels of OI menu and these are: <StatsDsp><StirsDsp><ProxStat><SelSmplr> <DebugDsp><ZonesDsp>< ><MenuMode> <SelSmplr><Smp-Mode><Smp-Time><Take Cut> <AutoMode><Sel Zone><MovePrbe>< > <PrbSpray><ZneAvail><ServcBay><AutoStrt> <Open Rly><CloseRly><ForceRly><Free Rly> <ResetRLC><ZoneMask><Smp Mask><Rst Data>
Note: Menu levels 3 to 7 are access-restricted, and so require a password to be entered upon selecting <MenuMode> to proceed further.
Multi-Stream Analyser (MSA) Operation
On-Line Sampling and Analysis System (MSA) Technical Manual 3.1 7-18
will display the main status display on the top line. This display will typically appear as: ‘Auto RunMde WndOK AirOK Rdy123456789ABC’ The fields are as follows: Man/Auto for manual or automatic operating mode. GdOpen/RunMde/EMStop to indicate whether the MSA is in “Run Mode” or if the "Emergency Stop" button has been pressed, or if the interlocked guard door is open. The EMStop message has preference. WndRpt/WndOK indicates the status of the probe window rupture. AirFl/AirOK indicates the air pressure level. Before a self test has been performed, the next field (ie. the rest of the line) will show "PositionTestReq". Once it has begun it will display, "PositionTesting". Once a self test has been performed the next field shows which zones are ready (ie. no errors positioning & stirrers going). If an error occurs, it is displayed in this field. Typical messages are : ‘ErrRaisingPrb x’,’RevLsNotFound x’,’StuckAtLstZne x’, ‘ZoneNotFound x’,’ZnePositionErrx’,’FailedToLower x’, ‘InvalidZneRqstx’ where "x" is the zone at which the error occurred. It is one of the following letters "R123456789ABCFP" (R=Reverse Limit Switch, F=Forward Limit Switch, P=Park limit switch, A=zone10, B=zone11 and C=zone12). If the “Park” button has been pressed the message “Parked, Latched” will be displayed. Last fields indicate which zones are ready (Rdy), numbered 1 to C. Any zones that aren’t ready will be indicated by a blank field. A zone must be defined in the zone mask, see <ZoneMask> and available, see <ZneAvail> before it can be ready for analysis. Turning off a stirrer will render a zone ‘not ready’.
<StirsDsp> is used to display which stirrers are running and which units are in overload condition. A typical display might be: ‘Stirrer Run 12345__89ABC O/L_____67_____’ The presence of the “O/L” label does not mean there is an overloaded stirrer unless the stirrer number is also given.
<ProxStat> is used to display the state the proximity sensors are reading. A typical display is: ‘Zone R12*4567__ABCFPuD Dwn Fwd Stop 2340’ The fields are as follows: Zone. An "*" in this field, indicates that the probe is at that zone (ie. in this case in or above zone 3). The "_" indicates that zone 8 & 9 have not be found or configured. The lower case "u" indicates that the probe is not "up" (a "U" would indicate this). The "D" implies the probe is "Down". If the probe is not positioned at a zone, either an "r” or ‘f” indicating reverse or forward carriage drive motor will appear between "Zone" and "R123..." (eg. ZonerR12*.... implies the probe is to the reverse of position 3). If the probe carriage-drive motor is in overload condition (and hence the probe cannot move) the previous display will be replaced with the following message: ‘Probe MotorOverload ‘ Dwn This second field reflects the vertical position of the probe. It is one of 'Hld','Up ','Dwn','u?d' (ie. "Hld" indicates "Probe Held" (e.g. when the “Raise” button is pressed) & "u?d" indicates an error). Fwd The third field reflects the horizontal movement of the probe. It is one of 'Stn', 'Fwd', 'Rev', 'r?f' to indicate stationery, moving forward, reversing and action not know (which implies an error). Stop The fourth field reflects the current probe motor speed. It is one of 'Stop','Slow','Fast','Trbo' to indicate stationery, slow, fast and top speed. In last group the state of the sprays are reflected by either an "Spry" (for when the sprays are on) or the position of the probe. The last zone the probe was at, the current position and the next position. An internal state (for debug) is displayed in the last position.
<SelSmplr> show the current state of a sampler. Each time it is pressed, the next valid sampler state is displayed. The display is described later.
Operation Multi-Stream Analyser (MSA)
On-Line Sampling and Analysis System (MSA) Technical Manual 3.1 7-19
Menu Level 2
<DebugDsp><ZonesDsp>< ><MenuMode> <DebugDsp>
displays a bit map of the actual low level RLC input/output states. They are for factory use only. The first field displays the version number of the application code (eg M123 implies Moving type code, version 1.23).
<ZonesDsp> will display the available zones are set by the user (see later). A typical display is as: ‘ZneAvl 1234_S789__C AutoStart ‘ The fields are as follows: ZneAvl is a list of which streams are currently active. In the above example, zones 5,10 & 11 have been declared (by the user) not to be active. The 'S' indicates that zone 6 has been declared to be the service zone and it has been confirmed during a Position Test. A lower case ‘s’ would indicate that the zone has been entered as being the service bay (see <SrvcBay> but it has not been confirmed during position testing. Upon a “Park” request, the probe will move to this zone. NoAutoStart/AutoStart to indicates whether auto-start on power up is requested.
<MenuMode> is used to access more secure levels of the menu. The question, 'Enter "Menu Mode" Pass Code', is asked. The menu has three levels of access. By default the “PassCodes” are 416,417 & 418. At level 1, only first 3 levels (out of a total of 7) are available. Level 2 has 5 lines. At level 3 all are available.
Note: The “Pass Codes” should not be easily accessible for use. Doing so may cause unwanted tampering with the RLC settings.
Multi-Stream Analyser (MSA) Operation
On-Line Sampling and Analysis System (MSA) Technical Manual 3.1 7-20
Displays a sampler status and is used to select a metallurgical sampler to operate on. As it is pressed the sampler number in the following display "Sampler 1 Mode Off Period 0 mins" is incremented for each valid sampler. Sampler modes are “Off” for shift samplers and “Cal” for Calibration samples. "RShft" implies random shift mode is selected. For each sampler installed the mode (Off,Manual,Calibration,Shift) is displayed. If "Shift" is selected the operator is asked if they want random cuts for which an answer of "yes" will prompt them to enter the minimum time between random samples. For a sampler in standard shift mode, only the number of minutes between cuts is displayed. If random cuts in a time period has been selected, the minimum time allowed between sample cuts is also displayed. Further details are given under <Smp-Mode> below. <Smp-Mode> is used to change the mode of a sampler. The question asked is 'Smp Mode (v=Off ^=Man <=Cal >=Shft)'. If Shift mode is selected the question "Take Random Samples (^=Yes,v=No) is asked. If random cuts are required, a further question "Min. time between samples (minutes)" is asked. After a mode change is made, a request to the change the bucket is made. Its form is 'Change Bucket & Continue (^=Yes,v=No). For calibration mode, the following messages are displayed depending on the status: or if a failure occurs “Calib Sample Failed” 'Waiting Bucket Change','Ready to take Samples',' Taking Sample Cuts ',' Calib Sample Taken'. They reflect the status of the calibration sample for that zone. <Smp-Time> is used to change the sampler cut time when in shift mode. The question asked is 'Sampler Period (Minutes)' e.g. if you have an 8 hour shift then you may want to take a cut every 30 mins, then 16 sample cuts will be taken over the shift period. <Take Cut> is used to take a cut with the currently selected sampler.
Note: <TakeCut> does not need to be used to take a manual cut, instead use the Sampler Switch (see photo left), “cut” selector.
Note: The Sampler Switch (see photo left) overrides the settings in the Operator Interface menus. To isolate the sampler, simply switch it to ‘off’, where it can also be “locked out”.
Note: The Sampler Switch must in ‘Auto’ for shift and/or calibration sampling.
Operation Multi-Stream Analyser (MSA)
On-Line Sampling and Analysis System (MSA) Technical Manual 3.1 7-21
Menu Level 4
<AutoMode><Sel Zone><MovePrbe>< > <AutoMode>
is used to put the system into automatic operating mode (i.e. under remote computer software control). The MSA will only move to streams in "automatic mode". The question 'Select Mode (^=Automatic,v=Manual)' is asked. <Sel Zone> is used to move the probe to a particular zone to sample. The question asked is 'Enter Stream to Select (1,2,3,….) '. <MovePrbe> is used to move the probe horizontally & vertically. When selected the following message is displayed '<=Rev >=Fwd ^=Up v=Down Del=Stop'. Pressing the direction keys will send the probe in the direction requested. The probe will NOT move horizontally if it is not clear of the zones. The <Enter> key is used to exit this option. The key will function when the MSA is in “ManualMode”.
Note: <SelZone> or <MovePrbe> can be done in either Auto Manual mode, however in Auto your request may be overridden by the remote ISA computer at any time.
Multi-Stream Analyser (MSA) Operation
On-Line Sampling and Analysis System (MSA) Technical Manual 3.1 7-22
is used to operate the probe wash sprays. The question asked is 'Probe Spray (^=Start,v=Stop)' The probe wash spray will remain on until an overriding request is made. <ZneAvail> is used to select which zones are available for analysing. The question 'Zone Numbers to change (1..12,0=All)' is asked, upon which the desired zone is entered. Then the new state is requested via the 'Zone Status (^=Online v=Offline)' question. <ServcBay> is used to select which zone is to be used as a service bay when a park request is received. The question 'Service Bay (1..12,0=ParkBay)' is asked <AutoStrt> is used to select the auto start on power on. The question asked is ('Auto Start on PowerUp (^=Yes,v=No)'. If ‘No’ is selected the MSA will power up in manual mode. If ‘Yes’ is selected the MSA will power up in auto mode but only if it was in auto mode prior to the power failure and/or there were no problems that cause ‘man’ mode, such as window rupture.
Warning: The MSA will not automatically analyse the zones (streams) required unless it has been told that the zone is available using <ZneAvail>.
Warning: The MSA will not automatically perform a position test on power up nor re-start analysing after a failure unless the <AutoStrt> option is set to “yes”.
Operation Multi-Stream Analyser (MSA)
On-Line Sampling and Analysis System (MSA) Technical Manual 3.1 7-23
Menu Level 6
Note: This menu level is not normally used outside the factory.
is used to open a particular relay. The question asked is 'Relay to Open (10-17, 20-27, 30-37)'. The relay number is expressed via the number on a particular board. Some examples are, 10 implies relay 0 on module 1, 31 implies relay 1 on module 3, 48 implies all relays on module 4, 170 implies high order relay 0 on module 1 (ie. 17 mod 16), 330 implies low order relay 0 on module 1 on the second bus. <CloseRly> is used to close a particular relay. The question asked is 'Relay to Close (10-17, 20-27, 30-37)'. <ForceRly> is used to force a relay or input to a particular state. The first question asked is 'Relay to Force (10-17, 20-27, 30-37)' followed by 'Which way (v=Open, ^=Closed)'. <Free Rly> is used to free a relay from being forced. The question asked is 'Relay to Release from being Forced.
Multi-Stream Analyser (MSA) Operation
On-Line Sampling and Analysis System (MSA) Technical Manual 3.1 7-24
is reset the RLC. The question asked is 'Reset RLC ? (^=Yes,v=No)'. If three resets occur without a power off, the application will be aborted and all setup parameters lost. This menu option is normally only used during factory set-up and testing. If extra analysis tanks (zones) or metallurgical samplers are installed on-site then this menu option can be used. <ZoneMask> is used to select the number of zones installed. The question asked is 'Zones Built (octal)'. The top line will display the current setting. A typical message is 'Zones 123456______ Samplers 123456______' which implies that zones and samplers 1 to 6 are installed. The new number must be entered as a base 8 number. Typical zone mask numbers are: 17==> Streams 1,2,3 & 4 are installed 7==> Streams 1,2 & 3 are installed 77==> Streams 1 to 6 are installed 7777==> Streams 1 to 12 are installed 37==> Stream 1,2,3,4 & 5 are installed (see example in Figure 7-1) The RLC MUST perform a position test if a change is made, usually this would be initiated by cycling the MSA main power switch. <SMP Mask> is used to select the number of metallurgical samplers installed. The question asked is 'Samplers Installed (octal)'. The answers MUST be entered as a base 8 number (ie. 17==> Streams 1,2,3 & 4 are installed ; 7==> Streams 1,2 & 3 are installed). See example in Figure 7-1. The RLC must perform a position test, usually this would be initiated by cycling the MSA main power switch. <RST Data> is used to reset the RLC data base (eg. samplers installed). The question asked is 'Reset All Save Data RLC (^=Yes,v=No)'. This is currently only available for Unix ISA Software Systems.
Warning: The MSA will not operate if the zone mask has been wiped out of RLC memory. In this case re-enter the zone mask using this menu option <ZoneMask> at the OI panel. You will then need to tell the RLC which zones (streams) are actually available by selecting <ZneAvail> option at menu level 5.
Warning: The metallurgical samplers will not operate if the sampler mask has been wiped out of RLC memory. In this case re-enter the sampler mask using this menu option <SmpMask>at the OI panel.
Operation Multi-Stream Analyser (MSA)
On-Line Sampling and Analysis System (MSA) Technical Manual 3.1 7-25
Note: After re-entering RLC data, the MSA will need to be put back to “AutoMode” at menu level 4 and restarted by cycling the MSA main power switch so that i t performs a new “PositionTest” otherwise it will stay in “ManualMode” and not re-start under computer control.
Zone1 no tank
Zone 2
Zone 3
Zone 4
Zone 5 no tank
Zone 6 no tankelectronics enclosure electronics enclosure & OI
1 2 3 4 5 6 R F
Reverse Limit Switch
Forward Limit Switch
Top View Layout of MSA Forward direction when standing at the OI side of the MSA
Reverse direction when standing at the OI (operator interface) or sample outlet side of the MSA
Zone Mask: Prox sensors corresponding to zones built: F 6 5 4 3 2 1 R 0 if not built, 1 if built for zone mask : 1 1 1 1 1 1 In this example probe sensors exist for position 1, ------- ------- 5 and 6 even though there are no tanks 7 7 Sampler Mask: 0 if not built (ie no tank and /or no sampler), 1 if built: 0 0 1 1 1 0 In this example there are only samples for zones ------- ------- 2, 3 and 6. 1 6 Converting masks to Octal (base 8): 000 0 001 1 010 2 011 3 100 4 101 5 110 6 111 7
Prox Sensors:
Figure 7-1 An Example of How to Calculate a MSA Zone and
Sampler Mask
Multi-Stream Analyser (MSA) Operation
On-Line Sampling and Analysis System (MSA) Technical Manual 3.1 7-26
7.2.7 Signal Processing Electronics (Signal Analyser)
Signal pulses from the detector in the analysis probe (MEP) are amplified in that probe and pass via a screened anaconda cable to the Signal Analyser (see photo left) . Here they are shaped, amplified, sorted and counted before transmission to the WinISA computer over the AIN bus (RS-485) or TCP/IP network. The Signal Analyser is mounted inside the larger MSA control enclosure (see photo bottom left). The basic functions of the Signal Analyser electronics are:
• MEP termination.
• Pulse height shaping and sorting into channels. Each channel representing an energy range in the X-ray spectrum. The Signal Analyser outputs up to 8 elemental and 1 backscatter signal channel from the analysis probe.
• Supply of stable fil tered DC low voltage power and “bias” to the probe.
• Support the alarm circuits (eg. window rupture, low LN2, detector temperature (RTD) alarm circuit failure).
• Test facili t ies (eg. Multi-Channel Analyser (MCA) connection for setting the channels on the Single-Channel Analyser 's (SCAs) in the Signal Analyser).
• A network interface to an RS-485 multi-drop bus (AIN) controlled and monitored by a remotely located computer running one the WinISA software package. Alternatively the network may be implemented in Ethernet (TCP/IP), shared with other plant-wide applications, but ultimately “connected” to such a computer.
Sampling System Operation
On-Line Sampling and Analysis System (MSA) Technical Manual 3.1 7-27
7.3 Sampling System
7.3.1 Sampling System Function To ensure that the analyser system provides the best possible accuracy, i t is very important that the probe measures a truly representative sample of the whole slurry stream and that most of the entrained air has been removed from the slurry. These conditions are satisfied by the specially designed structure called an Analysis Zone.
7.3.2 Slurry Effects The analyser probe 'sees' and measures a relatively large proportion of the slurry stream which is passing through the Analysis Zone and this ensures that the assays provided by the ISA system are representative of the whole slurry stream. The volume of slurry 'seen' by a probe depends on the volume that the probe 'sees' at any one time and the velocity of the slurry (or how quickly that volume of slurry is replaced). The sample “seen” by the analysis probe is about 5mm deep (X-ray penetration) by 20mm diameter. Although the proportion of the stream actually measured by the probe seems small in absolute terms, i t is a much higher proportion of the total stream than is taken for manual process control samples and it is a more representative sample because the slurry is homogeneously mixed in the specially designed Sampling System.
A stirrer is normally always required in the analysis tank to ensure that a well mixed representative sample is presented to the analysis probe. The MSA is supplied complete with a stirrer (where required) and the stirrer 's operation is controlled from the front panel of the MSA Controller.
Sampling System Operation
On-Line Sampling and Analysis System (MSA) Technical Manual 3.1 7-28
7.3.3 Metallurgical Sampler
If the Company supplied cross-cut Metallurgical Sampler has been fit ted at the overflow of the analysis tank (see photo left and Figure 7-2, Figure 7-3) then it needs to be set-up and tested for the 3 modes of operation before Calibration begins: • Auto (for shift sampling) • Calibration (computer controlled) • Manual Cut The first two sampler modes are configured at the OI panel (see photo middle left). Calibration-Mode The manual cut is user selectable at the sampler switch (see photo left). Set the Sampler Switch to “Auto”. Control over the samplers is via the OI panel on the MSA unit, with the exception of the calibration sample time period and the number of sample cuts required in any given sampling period (this is defined in the software on the controlling computer, refer to the Software Manual). By selecting the Smp-Mode OI menu option, the user can select the "calibration" mode (see photo left). The user should also refer to the section on using the OI panel, in section 7.2.6 . In "calibration" mode a sample will automatically be taken from the next stream (zone) which is selected from the OI panel and the corresponding probe count-rates will then be stored automatically in a file for that stream name called “CalibrationData.dbf”. The number of sample cuts taken whilst the probe is in the zone depends on the "number of cuts per sample" defined in the computer configuration software and this is turn will depend on the measurement time period which is usually 5-minutes. Check that the “calibration” mode works for all MSA streams and make adjustments to the sampler cutter speed and number of sample cuts taken where necessary to control the volume of sample collected (refer to section 5.11.3).
Operation Sampling System
On-Line Sampling and Analysis System (MSA) Technical Manual 3.1 7-29
Shift Samplers Set the sampler switch to “Auto”. Select the sampler number and mode at the OI panel and then select “shift”. There are two further modes for shift samples; one is the "standard shift" mode which provides the operator with a composite shift sample that is collected over a plant shift (configured in the computer) with sample cuts being taken at regular t ime intervals pre-set by selecting <Smp-Time> at the OI (this sample cut interval need only be set once per stream). The other mode provides shift samples composed of samples which are cut randomly within a pre-set t ime interval in case cyclic plant behaviour is suspected. The user is prompted to pre-set a minimum time required between such samples so as to avoid the possibility of two samples being taken very close together. Ask the plant supervisor what sample intervals are required over their shift and set the sampler time accordingly. Make sure the “shift” setup in the computer software. Test that all streams work in “shift mode”. Adjust the number of samples taken by changing the sampler t ime in order to control the volume of sample in the bucket at the end of a shift .
Note: A (white) reset button is provided on the AM987 Sampler Reversing Module inside the Sampler Controller . In the event that the sampler "trips out", try pressing this reset button (see photo left).
Sampling System Operation
On-Line Sampling and Analysis System (MSA) Technical Manual 3.1 7-30
Figure 7-2 Metal lurg ical Sampler Assembly-Front E levat ion
Operation Sampling System
On-Line Sampling and Analysis System (MSA) Technical Manual 3.1 7-31
Figure 7-3 Metal lurgical Sampler Assembly-S ide E levat ion
WinISA Computer Operation
On-Line Sampling and Analysis System (MSA) Technical Manual 3.1 7-32
7.4 WinISA Computer
The Thermo Electron analyser system uses a Personal Computer (PC) with either a Windows NT4 Server or Windows 2000 Professional operating system. These PCs are usually maintainable by local specialists. Industrial-grade computers are usually provided for harsh dusty operating conditions. The computer interrogates the analyser at fixed intervals usually of 60 seconds. The WinISA software logs count-rates and calculates elemental assays and density from the calibration equations generated as per the procedure given in section 6, Calibration . In conjunction with 1-sample (usually 1 minute) assays, sample average (usually rolling 5 = 5 minutes), hourly, shift and daily assay averages are also calculated and all assay information is presented to the operators as colour trend graphs and tables on the computer’s colour monitor and any networked “Client” computers that may be set up in the plant or offices by the plant network administrator. The WinISA computer can also calculate recoveries of mineral concentrate based on the on-line measurement of concentration of mineral in the feed, concentrate and tails streams of each process circuit . All of the assays are stored on the hard disk in the computer as historical data files for later retrieval for plant trending purposes. An optional A4 colour printer provides (automatic) hard-copy print-outs of assay data at preset t imes each day. The Software Manual provides much detail about the WinISA computer and software.
Operation MSA Software Program
On-Line Sampling and Analysis System (MSA) Technical Manual 3.1 7-33
7.5 MSA Software Program
The MSA object incorporated into the WinISA software is capable of performing sophisticated stream multiplexing by controlling a stream-switching device. The stream-switching device controllers, called RLCs (Remote Logic Controller) used in the MSA unit is a type M (Moving). Moving type RLCs actually move a probe between several analysis-zones (or streams): The probe is raised, carried horizontally to the new position, then lowered into the next stream. Stream-switch sequencing is controlled by the software computer but low level MSA control (such as raising and moving the probe) is controlled by the RLC. The WinISA software communicates with both the RLC(s) and the Signal Analyser(s) that are connected to the MSA unit. The RLC(s) and the Signal Analyser(s) may either be connected to the same RS-485 network (AIN) or via two separate serial l ines (normally only one AIN serial l ine is attached to the MSA unit and any other Thermo Electron in-plant instrumentation is "hung" on this l ine. The computer software controls the stream-switching and collects count-rate data from the Signal Analyser(s) only over the time when the probe is positioned, then switches to the next stream, and so on. The count-rates, assays, exceptions, such as window ruptures, etc. and notices of metallurgical samples for each stream are also presented to the computer software. Which streams are to be analysed, the sampling sequence and measurement time are all configured in the WinISA Software MSA objects. The Software Manual provides details of how to configure the software for an MSA.
7.5.1 Error Messages Each RLC has 12 status-words, which can be accessed by the computer software. The client programs interpret the status bit mapped words and display the appropriate error, however, they are discussed her in full . The following operational status-words are sent: 1. The probe’s position. The range is 1-12. If a probe is
between positions (analysis tanks or streams), the latest traversed position is recorded.
2. For the probe’s vertical position: 0 = bottom, 1 = middle, 2 = top.
3. Requested position, if in transit , 0 otherwise. 4. Bit-map of positions that are OK, so position 1 = 1,
position 2 = 2, position 3 = 4, position 4 = 8, …..,
MSA Software Program Operation
On-Line Sampling and Analysis System (MSA) Technical Manual 3.1 7-34
position 12 = 2048. If, for example, positions 1, 2, 3 and 5 are OK, the result is 1 + 2 + 4 + 16 = 23.
5. Bit-map of positions (zones) with horizontal-positioning failure. If the MSA stil l attempts to recover, the position will be OK, but after 3 positioning attempts, the position will cease being OK.
6. Bit-map of positions (zones) with vertical-positioning failure.
7. Bit-map of positions (zones) with vertical-positioning failure due to air-pressure fluctuation.
8. Bit-map of positions (zones) which are temporarily inactive (due to a stream being deactivated.
9. Bit-map of positions (zones) which are skipped because the attached condition is not satisfied.
10. Bit-map of positions (zones) which are not OK due to a problem in the RLC (such as a faulty proximity sensor or stirrer).
Serious problems inhibiting the MSAs normal operation include the following 10 status’ . A value of 0 means that the RLC (and hence MSA) is functional. The following are added up: 1 - Power failure 2 - Air pressure failure 4 - Limit-switch failure 8 - Positioning (proximity) sensor failure 16 - Probe failed to raise, sti ll in slurry 32 - Probe window-rupture (WR) 64 - RLC does not respond or is disconnected 128 - RLC in manual mode 256 - The Emergency-Stop switch is pressed 2048- Door is open (interlocked safety guard door) The following problems, though requiring attention, do not inhibit the RLC operation: 512 - Drive Motor in Overload Condition - One or more of the stirrers is in overload condition Any changes will not take effect until the end of the measurement period unless priority is given to take effect immediately or after the end of the sequence cycle. This is software configurable. Refer to the Windows ISA Software User Manual for error and status messages and configuring details.
Operation Data Communication & Interfacing
On-Line Sampling and Analysis System (MSA) Technical Manual 3.1 7-35
7.6 Data Communication & Interfacing
Here we are concerned with data flow into the WinISA computer from the field devices over the AIN bus and also data transfer from WinISA to other computers or systems outside of the ISA system.
7.6.1 Data Communication Between Analyser and Computer This section describes the most common method of communication used in current practice. Other methods including Ethernet and fibre optic segments may optionally also be used, however the AIN protocol sti l l applies and a conversion to a serial format is sti l l required at one or both ends. Data from the probe’s Signal Analyser is captured by the WinISA computer over the AIN fieldbus using RS-485 signals. Similarly, commands to control the signal analyser and the remote sampling are placed on this fieldbus. The RS-485 signals from the analysis probe electronics in the plant are usually (exception is CoBox) interfaced to a serial port on the WinISA computer using an RS-232 to RS-485 Converter (AM955 module pictured left) . The AIN protocol is master/slave using variable length ASCII data packets with a check-sum. The WinISA computer always retains the role of bus master to eliminate any possibility of a bus conflict (two devices simultaneously on the bus). The computer will only ever relinquish “Mastership” to a second identical computer (if present) running as a hot backup when for some reason it is deemed necessary to do so. Packets of data representing count-rates at selected energies together with other information, such as stream identification, status and alarms, are read in by the WinISA computer at the end of each analysis period and converted to assays by calibration-derived equations. This end user information is presented numerically or graphically by the WinISA computer and is available for transfer to other devices. At the physical l ink (hardware) layer the AIN consists of a three wire unbiased EIA RS-232 bus (a single screened twisted pair cable (plus one spare)) l inking up to 32 AIN devices over a maximum cable length of 1200 metres. For large systems up to eight AIN busses can be supported by the WinISA software with up to 32 devices on each. Each bus will require a serial port and a RS-232 Serial Line. chapter 4, Installation provides detail about this type of data communication.
Data Communication & Interfacing Operation
On-Line Sampling and Analysis System (MSA) Technical Manual 3.1 7-36
7.6.2 Data Transfer to Plant Process Control Systems Interfacing to a plant Process Control System (PCS), to provide assay and alarm transfer, can be provided by the following three (3) ways: 1. Ethernet TCP/IP Ethernet Network. The Thermo Electron WinISA computer is provided with a network card and TCP/IP protocol as standard supply. The onus is on the client to provide the plant network and associated security. A Company supplied WinISA computer will be factory configured for TCP/IP networking using either “Modbus TCP” or “OPC” (Object Linking and Embedding for Process Control). Otherwise consult with the Company. 2. Serial RS-232 (or RS-422 or RS-485, though its best to specify this at the time of ordering) serial l ink. The Thermo Electron WinISA Software provides for interfacing to various process control systems using the Modbus protocol (Modicon PLC). Details for configuring the WinISA software for this data communication can be found in the dedicated section in the Software Manual . The Thermo Electron WinISA software can emulate a Modicon Programmable Logic Controller (PLC) and it responds to or initiates a subset of commands from/to another Modicon PLC in a Master/Slave relationship.
Note: WinISA Modbus functionality is l imited to conformance class ∅ (function codes 3 & 16) of Open Modbus/TCP Specification-Schneider Electric. With the WinISA computer as a slave , all WinISA assays, flag-assays and input-device alarms/warnings are available on request from the Master Modicon PLC. The WinISA computer will abide by the Modbus Protocol responding to READ HOLDING REGISTERS (03). The WinISA computer will reply to all other function codes with the unimplemented error code. It is important that the PLC polling frequency and response timeouts be set to no faster than 1 second intervals. This is because WinISA under Windows NT/2000 is not a "Real Time" operating system and cannot guarantee a fixed response-time as some responses may be lost at higher polling frequencies. Remember Assay Updates are usually only once per minute anyway.
Operation Data Communication & Interfacing
On-Line Sampling and Analysis System (MSA) Technical Manual 3.1 7-37
As the master , all WinISA assays and hardware alarms/warnings and status are sent to a designated slave holding-register. The transfer occurs over an RS-232 (or RS-422 or RS-485 with optional drivers) serial l ine using the Modbus Protocol with either Remote Terminal Unit (RTU) or ASCII framing, or over TCP/IP port 502 using the Open Modbus/TCP protocol. The WinISA computer will send its data via the PRESET MULTIPLE REGISTERS (16) function code. For serial l ine connections the Baud-rate is user configurable and may be any one of 110, 300, 600, 1200, 2400, 4800, 9600 and 19200. Transmission mode is either, Remote Terminal Unit (RTU), ASCII or TCP. With RTU framing the character format is 8 data bits plus 1 stop bit . With ASCII framing the character format is 7 data bits, plus 1 parity bit (either even, odd or no parity), plus 1 stop bit . Each holding register represents either an assay value, or up to 16 packed flags of input device alarms/warnings. The user may choose which data is to be transferred and to which holding register i t is assigned. Data type for assay values is user selectable (refer to the Software Manual for details). The base address where assays begin is 1. This is normally referred to as Register 40001; however, a fixed offset can be applied to the base address (eg. Offset = 100, first register = 40101). The device identifier for the WinISA computer is configurable and can be set to any address in the range 1 - 99. ISA-device alarms/warnings and status signals from in plant ISA hardware can also be sent to the PLC/DCS. The Software Manual details the error/warning and status words used in WinISA. Any combination of status and error bits can be read by the DCS/PLC. 3. Analogue 4-20mA signals. The Company can supply ADAM modules to provide 4-20mA output for each assay of interest. If more than eight assays are to be transmitted, it is normally more economical to use a serial l ink.
Signal Analyser Circuits Operation
On-Line Sampling and Analysis System (MSA) Technical Manual 3.1 7-38
Note: ADAMs are common positive, not fully isolated.
7.7 Signal Analyser Circuits
The probe Signal Analyser electronics is mounted in the right hand side of the right hand side controller of the MSA (see photo left). In the description of the Signal Analyser electronics that follows, every printed circuit board (PCB) or module is introduced, with emphasis on its relationship to other modules and the system as a whole.
7.7.1 Chassis Layout The Signal Analyser chassis layout is shown in Figure 7-4 and photo left , so the user can identify the position of these modules or cards. The aim of this section is to give the user a general understanding of the functions of the components and so along with section 9, Trouble Shooting , be able to diagnose faults and wrong adjustments. It is not intended that faults are traced to the electronic component level, but i t should be possible to locate the offending module and then replace it with one from your spare parts.
Operation Signal Analyser Circuits
On-Line Sampling and Analysis System (MSA) Technical Manual 3.1 7-39
Figure 7-4 S ignal Analyser Chass i s Layout
Signal Analyser Circuits Operation
On-Line Sampling and Analysis System (MSA) Technical Manual 3.1 7-40
Signal Analyser cards and their function are as follows:
Function Slot Part No.
Description
LV Supply for Cards & MEP U4 AM056 24V Supply/Ref. Card Low Voltage Supply for logic U5 AM059 Low Volt Supply Card LV Supply for SCA Cards U6 AM351 12V Supply Clock HV Supply to Probe U9 AM062/02 Bias Supply Card Pulse amplifier & shaping U1 AM001/91 Linear Amplifier Card Analogue Signal Processing U2 AM002/91 Pulse Validation Card Gate clock of when busy U3 AM091/03 Live-Time Clock Card Pulse Sorting U11-U19 AM990/10 SCA Module Squaring pulse for SCA,MCA & test functions U10 AM994/01 MCA Access Module Bias Supply Controller U20 AM963/20 Bias Control Module RS-485 Output/WR Alarms + 24V Hoist Supply Control U7 AM093/11 Comms Adaptor Plant network (AIN) comms + LN2 Sensor Control/Alarm U8 AM092/10
Network Interface Card
Table 7-2 S ignal Analyser Card Funct ion
Note: U1, U2 etc refer to the Signal Analyser PCBs by their position in the chassis in Figure 7-4. U1 is at top left, in connector (slot) J1, progressing left to right and down to U20 in slot J20 at bottom right.
7.7.2 Signal Flow A "positive staircase waveform" signal from the probe enters the Signal Analyser and is routed through to the AM001/91 Linear Amplifier, in chassis position U1, and the AM002/91 Pulse Validation Card, in position U2. This pair of cards is referred to as the Analogue Signal Processor (ASP). Figure 7-5 shows schematically the flow of signal. Each step in the waveform is produced by an X-ray or gamma-ray interaction with the Si(Li) crystal in the probe and will have a height of the order of a few millivolts. The height of each step is proportional to the energy deposited in the crystal by the corresponding X-rays. Several t imes each second the signal exhibits a large negative transition as the detector 's field-effect transistor (FET) gate is discharged by flashing it with light. This transition is called the optical reset and is sensed by the Signal Analyser which is designed to ignore any following output from the probe for that brief period until the probe and its amplifiers recover to stable operation. The signal then continues from this pair of cards to the AM994/01 MCA Access Module from where it is sent in parallel to the AM990/10 SCAs (Single-Channel Analysers). Up to
Operation Signal Analyser Circuits
On-Line Sampling and Analysis System (MSA) Technical Manual 3.1 7-41
nine (9) SCAs are fit ted to the chassis. Refer to Figure 7-4.
mepsaflow
Figure 7-5 S ignal F low Through the S ignal Analyser
7.7.3 Auxiliary Cards
Auxiliary cards and modules in the Signal Analyser are:
• AM062/02 Bias Supply Card (U9) which supplies the High Voltage for the probe.
• AM963/20 Bias Control Module which safeguards the detector and FET against sudden increases in High Voltage.
• AM091/03 Live Time Clock Card which provides a correction for the loss of counts due to the finite signal processing time of the ASP circuit.
• AM092/10 Network Interface Card (U8) contains a microprocessor and forms the main communication pathway onto the RS-485 Network (AIN). It also monitors the liquid nitrogen level and cryostat temperature, signals alarms, sends warnings for any abnormal switch settings and controls the bias shutdown.
• AM093/11 Comms Adaptor Card (U7) monitors the window sensor for moisture leakage and loss of circuit continuity. It also converts data generated by the AM092/10 card to RS-485 compatible signals for
Signal Analyser Circuits Operation
On-Line Sampling and Analysis System (MSA) Technical Manual 3.1 7-42
transmission to the WinISA computer. This data contains count-rates, l ive-time and alarm/warnings.
Signal Analyser Card Functionality Operation
On-Line Sampling and Analysis System (MSA) Technical Manual 3.1 7-43
7.8 Signal Analyser Card Functionality
7.8.1 AM001/91 Linear Amplifier The probe signal enters the Signal Analyser via a BNC (coaxial) connector at the bottom left of the chassis and is routed to the AM001/911 Linear Amplifier Card in position U1 (top left edge connector). The AM001/91 is responsible for converting the positive going steps on the probe waveform to pulses and amplifying and shaping them to a near Gaussian format. One very important function of this card is to detect the very beginning of the positive step in the so-called “fast amplifier” to enable pile up detection. It also maintains a zero volt baseline in conjunction with the AM002/91 card.
7.8.2 AM002/91 Pulse Validation
Operating in conjunction with U2 (AM002/912 Pulse Validation Card), the AM001/91 amplifies and shapes the incoming probe signal and compensates for spurious effects such as pile-up, overloads and resets. This pair of cards is often referred to jointly as the “Analog Signal Processor” or ASP. The output signal from the ASP consists of positive pseudo-Gaussian pulses (referred to ground). The amplitude of these pulses is proportional to X-ray energy and may have a maximum of 10 volts. Other important signals from the ASP are a strobe pulse to indicate which signal pulses are valid and when (in the time domain) to sample their amplitude and also a live-time clock signal to enable so-called dead time correction. Note that the OVERLOAD LED on AM001/91 may be seen to flicker faint red under normal conditions because a small percentage of pulses in any spectrum will exceed the operational l imit of the ASP (without harm, of course). Note that the AM001/91 and AM002/91 pair together shape the pulse with a 9µs time constant. Whilst this produces excellent resolution, sometimes they cannot handle the high count-rate required for certain source/slurry combinations although resolution is traded off in these cases. In such cases a shorter t ime constant may be chosen, for example AM001/91-4 (4 µs) or AM001/91-2 (2 µs).
1 Later versions of cards are identified by incrementing the second digit in the suffix of the AM number, eg. AM001/91.
Such units are fully backwards compatible and will generally conform to this description, with identical or improved specifications.
2 As already noted, AM002/90 may be replaced by AM002/91 etc.
Signal Analyser Card Functionality Operation
On-Line Sampling and Analysis System (MSA) Technical Manual 3.1 7-44
The corresponding AM002 card must always be used, i .e. AM002/91-4 goes with AM001/91-4 etc. Do not mix and match these cards!
7.8.3 AM994/01 MCA Access Module The Gaussian signal pulse and its strobe are passed to the AM994 MCA Access Module. This module is named thus because it carries most of the circuits necessary to connect in an MCA (Multi-Channel Analyser) and view the spectrum and SCA settings. As far as the signal is concerned it more-or-less routes straight through to the SCAs.
It does pass through a sample-and-hold and a linear gate circuit , however. These circuits ensure that the signal is presented to both the SCAs and MCA in a standardised manner (essentially square pulses) which allows operation with various brands of MCA with lit t le, or no, dependence on their various input circuits. The AM994 MCA Access Module performs a monitor function over the SCAs and interacts with them to aid in setting up. This only applies as long as the TEST/RUN switch is set to TEST. None of the controls on the SCAs (excluding screwdriver adjustments) or those of the AM994 itself, are functional if this switch is on RUN. The AM994 has an INJECT mode which may be used to select a dummy input signal in lieu of the probe derived pulse. The amplitude of the injected pulse is variable over the full range of the SCAs (0-10 V) using the 10-turn potentiometer labelled REF VOLTS. It has a rate of precisely 5 kHz, but unlike the probe signal is essentially non-random in amplitude or time. (A more detailed discussion of the AM994 is given in the section 5, Commissioning).
7.8.4 AM990 Single-Channel Analyser (SCA)
The signal from the AM994 (which goes to all SCA inputs in parallel) again consists of an analog pulse (0-10 V) and a separate strobe pulse (TTL). Now, however, the signal pulse has a guaranteed flat top, due to the sample-and-hold. The strobe transition occurs in the centre of this flat region, well away from ringing and other signal distortions. The task of the SCA is thus greatly simplified (most desirable because its circuit has to be duplicated nine times). Two trim-pots on each of the AM990 SCA modules determine the voltage (in the range of 0-10 V) of the lower level LL and upper level UL of the SCA channel.
Operation Signal Analyser Card Functionality
On-Line Sampling and Analysis System (MSA) Technical Manual 3.1 7-45
These trim-pots are accessible only through holes in the front panel of the SCA modules. These holes are intentionally small to discourage unauthorised tampering. When a strobe pulse arrives with an amplitude between the LL and UL voltages and a strobe transition also occurs, the SCA will sample the pulse's flat top and recognise it as being in channel. It will then cause a count to be sent to the AM092/10 card for storage. The resulting count-rate data is then transmitted via the AM093/11 card onto the AIN RS-485 line. Setting the UL and LL discriminators (voltages) is discussed in section 5, Commissioning .
7.8.5 AM092/10 Network Interface Card
The AM092/10 card has a 16 bit embedded microprocessor which forms the main communication pathway onto the Multi-drop RS-485 network (AIN). There are also nine 16 bit high speed (hardware) counters, various memory and logic devices and provision to read the chassis serial number for device identification purposes (this device identification is used by the WinISA software and is referred to as the device number). The counters accept conditioned nuclear pulses originating in the MEP connected to the signal analyser. The microprocessor reads these counters periodically on the fly and when interrogated by the WinISA computer (network master) will reply by issuing a packet of serial ASCII characters to the AIN. This packet conforms to a protocol laid down by the Company and contains count-rate, alarm and status information as well as a check-sum. A major feature of the AM092/10 is that i t is capable of reloading its own executable application code from the AIN, and storing it in capacitor backed CMOS memory (which lasts approximately one month if the Signal Analyser power is off). Working in conjunction with the software program (WinISA) the Network Interface card will automatically load or reload the latest version of application program resident on the central hard disk, which means that updating and distribution of new application code is made very simple. If re-load is required the four red LEDs on the AM092/10 card flash in unison, then during loading indicate “fil ling” of the card’s CMOS memory. The AM092/10 card also monitors the liquid nitrogen level and the cryostat temperature, signals alarms, sends warnings for any abnormal switch settings and controls bias shutdown.
Signal Analyser Card Functionality Operation
On-Line Sampling and Analysis System (MSA) Technical Manual 3.1 7-46
Note: The application code must reside in the AM092/10 cards’ memory before the signal analyser functions work. Refer to the Software Manual for details of the AIN code.
7.8.6 AM093/11 COMMS Adaptor The COMMS Adaptor Card (AM093/11) monitors the window sensor for moisture leakage and loss of circuit continuity. I t converts data generated by the AM092/10 card to RS-485 or RS-232 compatible signals for transmission over the AIN to the WinISA computer. This data contains count-rates, l ive-time and alarm information. A jumper link on this card (see Figure 7-6) must be in the position “SAMPLER” for use in MSA systems.
AM093/11 Card
F igure 7-6 Showing jumper l ink on AM093/11
7.8.7 Functionality of Signal Analyser Support Cards
The remaining circuits of the Signal Analyser perform the various supporting functions of delivering power to the probe and protecting it from damage in abnormal circumstances. These are very important functions because the safety, reliability and long-term performance of the probe are very much dependent on them. The following sections describe the functionality of these cards.
Link must in po sition"SAM PLER
A M0 93 /11 Car d
Link must in po sition"SAM PLER
A M0 93 /11 Car d
Link set to ‘SAMPLER”
Operation Signal Analyser Card Functionality
On-Line Sampling and Analysis System (MSA) Technical Manual 3.1 7-47
7.8.8 AM062/02 Bias Supply It is necessary to supply a bias voltage to the semiconductor detector in the probe. This voltage must be negative (related to ground), moderately stable and almost totally free from ripple and sudden changes. The current drain is minuscule and so RC filters with large R-values are adequate. This means, however, that high quality insulation is needed for all cables and connectors carrying bias voltage and that this insulation must be kept dry. The bias voltage is generated by the AM062/02 Bias Supply Card that plugs into the right most slot of the top row (U9) of the signal analyser chassis. This is a switching supply which derives its input power from the +15 V supply and runs at approximately 25 kHz. The function of the AM062/02 is to develop a potential between 0 V and -1000 V in proportion to an input reference voltage which may be between 0 V and +5.00 V. This reference voltage is set by a 10-turn potentiometer on the AM963/20 Bias Controller module.
Caution: Take care not to come in contact with the High Voltage that exists on this card. Allow two minutes after switching off for the charge on the fil ter capacitors to drop to a safe level, before touching or unplugging the card.
7.8.9 AM963/20 Bias Controller
The AM963/20 Bias Controller is designed to safeguard the expensive semi-conductor detector and its associated expensive FET. It is important that the bias voltage is not increased too fast on initial switch on because a sudden increase in bias can permanently damage the FET. Also a failure of the optical reset system will allow the FET gate voltage to rise to avalanche point and possibly destroy the FET. This situation can come about by failure of the 24 volt supply, for example, as well as numerous other things. The AM963/20 is designed to reduce the bias to a safe 30 volts if the normal reset rate is interrupted for any reason. After any interruption to the bias voltage such as due to a power failure the AM963/20 will restore the bias to its preset level (on the 10-turn dial), providing the normal periodic reset signal is received from the probe. I t does this by setting the bias to 30 volts when the LN2 level sensing circuit signals OK, and waiting for resets to commence.
Signal Analyser Card Functionality Operation
On-Line Sampling and Analysis System (MSA) Technical Manual 3.1 7-48
Providing the reset rate is greater than one every 5 seconds and less than 500 per second, the bias is ramped up toward the selected value at approximately 10 volts per second. It is normal for the reset rate to increase dramatically as the bias increases. The actual reset rate is monitored by the AM963/20. This module will temporarily pause the bias ramping process if the reset rate exceeds 500 per second and resume ramping when it drops slightly below this rate. If the rate climbs to 1000 per second and exceeds it for more than one second the bias is reduced instantly to the safe 30 volt point. A bicolour LED indicates the exact status of the bias supply as follows:
1. The LED is off when, and only when, the bias supply is
completely shutdown. This means that zero bias energy is being delivered although some residual charge on the bias cable may be present and this will take a minute or more to bleed away. This situation exists when the BIAS switch is off or the LN2 level sense circuit is indicating the LN FAIL status.
2. When the LED first l ights it will be red as the 30 volt
bias level is established as a feeler to see if the detector responds with resets.
3. If resets do not appear the AM963/20 will remain
indefinitely at 30 volts with the red LED on. This condition may indicate that there is moisture on the pre-amp and HV electronics in the probe itself. This will require “Drying out of the Probe”, and this procedure is given in section 8, Maintenance .
4. As resets are registered in the range 1..500 per sec., the
LED will be seen to flash (stil l red) about once every second as the bias is slowly increased.
5. If a pause is necessary (because the reset rate is too
high), the LED will resume a steady red for the duration of the pause and continue flashing as the ramp recommences.
6. When the end point voltage is reached (i .e. as set on
dial) the LED will change to a steady green. At this point the warning signal to the central WinISA computer is turned off and the live time clock is enabled.
Operation Signal Analyser Card Functionality
On-Line Sampling and Analysis System (MSA) Technical Manual 3.1 7-49
7. Now the bias is held steady but the AM963/20
continues to monitor reset rate. I t will return it to the restart value (30 volts) if reset rate goes outside the range 0.2 to 1000 per second. This situation will be indicated by a warning signal at the WinISA computer accompanied with zero live-time, and the BIAS LED will be red. Unless action is taken to power down the probe the AM963/20 will resume restart as soon as acceptable reset rate is restored.
8. A second bicolour LED labelled OPTICAL RESET is
mounted above the 10-turn dial. This LED normally flashes green almost continuously (less frequently if the radioisotope source is absent or shuttered, or the probe is out of the stream). This LED indicates two different things about the incoming probe signal:
• COLOUR
The colour green indicates that the gross count-rate is within the maximum allowable rate for the ASP fitted. If the count-rate is too high it goes red.
• FLASH
I t flashes once for each reset transition detected in the probe signal. The colour of the flash may be red or green depending on 1 above. At high reset rates the flashes will merge into an unsteady glow.
Because each reset also registers one or more counts, albeit outside the spectrum, it is possible that the OPTICAL RESET will turn red momentarily during the bias ramp-up stage but this is of no consequence. Should it turn red during normal operation it may indicate one of the following problems:
• The radiation level (X-ray flux) is too high, or
• An excess of electrical noise is being generated in the probe. This may be due to the loss of LN2 cooling or a degraded vacuum or ageing Si(Li) detector or FET and will show some effect on the spectral performance of the probe.
• One of the two cards AM001/.. or AM002/.. is defective.
• Electromagnetic Interference (EMI or RFI). This can be checked by ensuring the fil ter under the dewar is present and OK. Also look for possible sources of EMI nearby eg. variable speed motor drives, etc.
Signal Analyser Card Functionality Operation
On-Line Sampling and Analysis System (MSA) Technical Manual 3.1 7-50
The OPTICAL RESET LED is actually driven by the ASP and has no electrical connectivity with the bias generating or controlling circuits. I t is located on this panel only so that i t will be observed more easily.
7.8.10 AM091/03 Live-Time Clock
Along with the SCA count-rates and other data, Live-Time information is sent to the WinISA Computer. The reason and need for this signal is to provide a correction for the loss of counts in the ASP during the periods of time that i t is busy processing an earlier received pulse or is otherwise engaged. The ASP delivers a logical status signal to the AM091/03 Live-Time Clock Card (U4). This card carries a stable quartz crystal oscillator which, in the event of zero incoming counts (Live-time = 100%), generates a regular signal of one cycle in approximately 8.4 seconds. As the incoming count-rate increases this clock signal slows down. For example, if the ASP is spending 30% of its t ime busy or dead then the live-time is 70% and the outgoing live-time clock will be one cycle in 8.4/0.7 = 12.0 sec. The central computer is programmed to normalise all 9 (max) count-rate channels from the same signal analyser against this clock before further processing. In this way the effects of changing count-rates in one part of the spectrum do not influence the apparent count-rate in other parts.
7.8.11 Power Supply Cards
Several regulated low voltages are required by the various modules and the probe. The PCBs which regulate these voltages are recognisable by their heat sinks. The high current +5 volts regulator is mounted directly onto the transformer panel along with its fil ter capacitor.
Cleaning and Replacing the Probe Window Operation
On-Line Sampling and Analysis System (MSA) Technical Manual 3.1 7-51
7.9 Cleaning and Replacing the Probe Window
Normally, the probe windows do not need regular cleaning because the flow of the slurry past the probe keeps the probe surfaces clean and polished. However, in some streams, particularly where the pH is high (>10) a precipitation may occur which then requires regular cleaning to remove the scale.
Note: Scaling or precipitation on the probe window will change the count-rate measurement so it is important that regular window cleaning be implemented for such situations. The frequency of cleaning will depend on the extent of the scaling problem and will vary from one plant and one stream to another. When a severe precipitation problem occurs on the window of the probes such that cleaning is required on a shift basis, a solution to the problem may be to replace the window material type with one that is more resistant to a precipitation build-up. Such materials may be PTFE (Teflon), Kapton or PEEK. Consult the Company for further information. If changing the window type doesn’t provide a solution then they must be cleaned more regularly.
Note: Always re-standardise the probe if the window material type is changed. Even though the slurry will normally keep the windows clean, there is no often need to worry about the windows being worn away - the probe windows are very tough 50 micron Mylar (polyethylene plastic) and will often last for at least 3 and perhaps 6 months, in even the most abrasive slurries. Scratches can harbour contaminants which may affect the probe’s readings and can compromise the window’s integrity. Therefore the primary (slurry contact) window should be replaced if i t shows signs of contamination and/or scratches that cannot be easily cleaned off.
Cleaning and Replacing the Probe Window Operation
On-Line Sampling and Analysis System (MSA) Technical Manual 3.1 7-52
If the window is physically ruptured or torn then the backup window may be ruptured also. In this case, slurry may have entered the probe. The insides of the probe and the detector then need to be thoroughly cleaned. This type of rupture is very uncommon and can normally be completely avoided by using screens to remove tramp material from the process streams.
7.9.1 Cleaning the Probe Window The frequency of window cleaning varies enormously depending on the rate of build-up. In rare cases, the windows have to be cleaned once every shift while in other cases, they only need to be cleaned once per week or even less. Cleaning the window is a simple task and should take about two minutes to perform. The best way to find out how often the window must be cleaned is to spot check the window over a period of a few days. The procedure following is step by step instructions of how to clean the probe window. Items required to clean the window are: • Bucket of water or water hose. • Dilute acid (eg. hydrochloric). A concentration of 5%
acid is usually best. Choose the acid that removes the precipitation easiest. Note that acid is only required if water alone doesn't remove the build-up.
• Cloth or paper tissue for wiping the window. • Tongs to hold the cloth with (these are supplied in the
Tool Box). • Small mirror or piece of polished steel so that you can
view the window. A telescopic mirror is supplied in the Tool Box.
Warning: If using HCl acid, do not use more than 5% concentration, otherwise damage may occur to the 316 grade stainless steel probe parts and window wear will increase too.
Operation Cleaning and Replacing the Probe Window
On-Line Sampling and Analysis System (MSA) Technical Manual 3.1 7-53
The procedure for cleaning the probe window is as follows:
1. Remove the probe from the slurry (analysis tank) by pressing the “Park” button then the “Raise” button (see photo left) to secure the probe for maintenance.
2. Wash the window by pouring water over it and the
probe head and wipe with tissue or soft cloth using the long handled tongs provided.
3. Use the mirror to inspect the window for any signs
of a build-up of precipitation - the window should be perfectly transparent to l ight – if i t isn’t then it may be scratched and must be replaced (see replacing the window in section 7.8.2). If i t is sti l l dirty then use the dilute acid.
4. When the window is clean, put the probe back into
operation by releasing the “Park” button. It may take a minute or so for the probe to move.
Caution: To avoid exposure to the low level radiation, you should be careful to ensure that no part of your body can be 'seen' by the radioactive source. Remember, if you can see the source, the source can see you!
7.9.2 Replacing the Probe Window The following procedure is a step by step instruction of how to change out the window of the probe. When you have had some practice at changing the windows, you should be able to perform the whole procedure in about 5 minutes. If a WR has occurred then an alarm message will be displayed on the WinISA computer. The probe will also be raised from the slurry and you will have lost your on-line assay readings. Before starting the procedure, the following tools and items should be collected:
• The socket driver for removing the window assembly (via square head bolts).
• A bucket of water or hose for washing the probe head if necessary before removing the window assembly.
Cleaning and Replacing the Probe Window Operation
On-Line Sampling and Analysis System (MSA) Technical Manual 3.1 7-54
• Some material (t issue or soft cloth) for drying the probe head and window assembly after washing.
• A container of petroleum jelly or equivalent for lightly lubricating the window assembly O-ring.
• A small mirror is also useful. The window of the probe can be inspected using the mirror without exposing you to any radiation.
• A set of laboratory tongs is useful for holding items in front of the probe to avoid exposing your hands to the radiation.
• Spare window assembly (pictured). All the above items are in the Toolbox supplied with the equipment (refer to Attachment 1 in Chapter 5). The procedure for changing the window is as follows:
1. Go to the analyser that indicated a window rupture (there is no need to turn off the power, nor the bias voltage). The probe will already be raised on its hoist. The MSA will be in “manual mode” so move the probe to an accessible end of the MSA by using the <ProbeMove> command on the OI panel.
2. Wash all of the stainless steel of the probe head and
the window. This can be done without exposing any part of you to the radiation.
Note: Whilst the MSA is in “manual mode” it will not respond to any move commands from the controlling computer. Opening the guard door also puts the MSA in manual mode and stops any automatic movement. Remember to press the stirrer override button so that the tanks don’t sand up.
Caution: Do not expose yourself, or anyone else, to the X-ray radiation emitting from the probe.
3. Dry the probe head and window assembly using a soft cloth or paper tissue and the tongs.
4. Remove the Window Assembly by turning the two
square head captive bolts with the spigot tool. The bolts will drive the flow cell outward from the front.
Operation Cleaning and Replacing the Probe Window
On-Line Sampling and Analysis System (MSA) Technical Manual 3.1 7-55
5. Swap the spare Window Assembly directly into place whilst the old one is taken to a clean work area for window refitting. The O-ring in the spare window assembly may need a light greasing with petroleum jelly.
6. Tighten the two square head bolts to secure the
window assembly so that i t is flush with the head.
7. The MSA may now be put back into “automatic” control. To do this, close the guard door, the “Guard Open” message at the OI panel will disappear, then select <Auto Mode> at the OI and wait a minute or so and the MSA should start under “Automatic Control” from the computer.
8. Replace the main (broken) primary window in the
window assembly immediately, in a clean and dry room, so that i t is ready for the next time a window change is required. Also replace the alarmed (backup) window too if i t is broken or crinkled. The procedure follows:
7.9.3 Replacing the Primary Window
The procedure for replacing the plastic slurry content window is simply a matter of unscrewing the eight countersunk screws (see photo left) of the backup window ring (AM233/20) and fitt ing a new 58.8 mm diameter disc of 50 micron thick clear Mylar window, in place of the old one. These windows are supplied in the Tool Box and can be re-ordered from the Company when your stock is low. Figure 7-7 shows an exploded view of the Window Assembly. Also remove any dirt or other debris or corrosion during this process. The O-ring should be very lightly greased with petroleum jelly. The rotational orientation of this ring is unimportant in this product.
Cleaning and Replacing the Probe Window Operation
On-Line Sampling and Analysis System (MSA) Technical Manual 3.1 7-56
AM232 - ALARMED WINDOW ASSEMBLY
BRASS SCREWS (8)
TE-91 - BACKUP WINDOW ASSEMBLY
STAINLESS STEEL WINDOW SEALING RING
MYLAR PRIMARY WINDOW
O-RING** Apply petroleum jelly TGM part no. 55035 to o-ring.
O-RING** Apply a very thin smear of petroleum jelly (TGM part no. 55035 to o-ring prior to assembly).
44844.dwg
Figure 7-7 Exploded View of the MEP Window Assembly
Backing Up Data Operation
On-Line Sampling and Analysis System (MSA) Technical Manual 3.1 7-57
7.10 Backing Up Data
In case of software file corruption or complete computer hardware failure i t is most important that regular back-ups are done so that data and files can be restored if such events occur. It is particularly important to do a backup each time changes are made to the analyser software configuration and in particular when changes are made to the assay equations after adding calibration data. Copies of critical files can be done to another folder in the directory tree on the computer or across the plant network to another computer. More importantly though, a retrievable copy to 3.5”Diskette, tape drive or CD, should be done. It is recommended that full backup of the GM Minerals folder be done at least once per month (this will back up both data and configuration). The user should refer to the Software Manual for further details on backing up, including live automatic backups of data and/or configuration of the WinISA Software.
On-Line Sampling and Analysis System (MSA) Technical Manual 3.1 8-1
8 Maintenance
The Thermo Electron on-line system has been designed to minimise routine maintenance. All bearings, drive and stirrer gear motors are grease lubricated for l ife and thus are maintenance free. Air equipment, including cylinders and solenoid valves are lubricated for life and require no routine maintenance. The air l ine fil ters are fit ted with automatic drains to release any water trapped in them. To maintain the system in good working order, a Preventative Maintenance Schedule is recommended herein. However, as plant conditions can vary considerably, this plan should be taken as a guide only. The commissioning report may contain additional maintenance recommendations. In addition, the Company recommends each site records all maintenance performed on their analyser system and develops a program to suit their particular application. Attachment 1 provides a list of recommended start-up spares. Attachment 2 provides a list of recommended one (1) year’s operational spares. The Parts List Manual provides a complete l ist of all parts and assemblies used in the analyser system.
Preventative Maintenance Schedule Maintenance
On-Line Sampling and Analysis System (MSA) Technical Manual 3.1 8-2
8.1 Preventive Maintenance Schedule
8.1.1 Daily Maintenance (Usually performed by plant operators, approx. duration is 5-10 minutes per analysis stream)
• Inspect the analysis tanks to ensure that they are
functioning correctly and slurry is flowing freely (i .e. , no sanding or blocking) look for slurry flowing over the “overflow weir” in the tank. Check/unblock primary sampler/sample delivery lines if necessary. Report excessive slurry flow or surging.
• Check that stirrers and water sprays, if used, are
working correctly. If a stirrer appears to be under-agitating, check for wear/damage or trash material .
• Check that the metallurgical samplers are working and
change shift sample buckets at the end of each shift . • Check that on-line assay data is being displayed
correctly on the computer screen. If not, then check for alarm/warning messages and investigate why. If a Window Rupture alarm is displayed then check that the probe is raised out of the slurry and replace the probe window as soon as is practically possible (refer to the operational procedure in chapter 7, Operation).
8.1.2 Weekly Maintenance (Approx. duration is 40 minutes per MSA)
• Fill the probe dewar with Liquid Nitrogen (LN2). This
must be done routinely and preferably the same day of the week each week. Mondays and Thursdays are good days for plants operating with regular 5/2 weekends. Keep a log-book of fil l ing times and approximate amount used each time. Monitoring the LN2 usage will indicate the condition of the probe detector over the long term and hence indicate when probe evacuation is required.
• Take one or two calibration style check samples per
stream. These should be compared to the MSA readings at the same end time, then added to the suites of calibration data.
Maintenance Preventative Maintenance Schedule
On-Line Sampling and Analysis System (MSA) Technical Manual 3.1 8-3
• Check the operation of the probe water spray ring and
the froth depressant water spray in each analysis tank where they are being used. Failure of any of the probe water sprays may cause cross-contamination or incorrect readings if i ts a froth spray that has failed, clean or replace as necessary.
• Wash the analyser with a low pressure clean water hose
to prevent slurry build-up. Particular attention should be made to cleaning moving parts, including the guide wheels on the moving carriage, metallurgical sampler cutter and nozzle, stirrer motor/gearbox, shaft and impellor.
• Check the cleanliness and condition of the probe
window. Clean and replace as necessary (procedures are provided in chapter 7, Operation).
• Check the condition of the Proximity Sensors. Clean if
covered heavily in slurry. Note: The MEP will use 0.6-1.2 li tres of liquid nitrogen per day as long as there is a good vacuum inside the detector chamber. This volume does not account for LN storage and handling losses. As time passes, the vacuum inside the detector chamber may deteriorate and the liquid nitrogen usage will consequently increase due to gas-conducted heat losses. After several years, this loss of vacuum may begin to affect the performance of the probe by degrading the resolution of the detector and thus changing the standard count-rates. At this stage, the probe must be re-evacuated. the Company will provide assistance with re-evacuation.
Preventative Maintenance Schedule Maintenance
On-Line Sampling and Analysis System (MSA) Technical Manual 3.1 8-4
8.1.3 Monthly Maintenance
(Usually performed by plant maintenance personnel, approx. duration of each task is 5-10 minutes per unit)
• Ensure the hoist air cylinder (ram) is operating
correctly. Check the protective boot and replace as necessary.
• Check the operation of the safety latch on the hoist. To
check this raise the hoist, close off the air supply and open the air bleed valve on the air reservoir. If the hoist lowers fully then the latch is not working. Also the latch can be heard clunking when raising and lowering the probe.
• Check the condition of the probe carriage guide rollers,
if worn replace. The probe carriage should move both vertically and horizontally in a smooth operation.
• Apply general purpose grease to moving parts as per
lubrication schedule in section 8.2. • Check the operation of the limit switch activator arms
(These are fit ted on the metallurgical samplers). If they are sticking, either replace or lubricate with light oil (see lubrication schedule in section 8.2).
• Check the operation of all Metallurgical Samplers by
requesting a manual cut. If a sampler is sticking, remove the cover, clean the slide rails and apply anti-seize grease (Refer to lubrication schedule in section 8.2). Do not use general purpose grease in place of anti-seize grease. Also check the condition of the sample outlet hose and replace if necessary.
Maintenance Preventative Maintenance Schedule
On-Line Sampling and Analysis System (MSA) Technical Manual 3.1 8-5
• Initiate a WinISA directory back up. Use the DAT tape
or CD-R or in a suitable network location as appropriate. Instructions are provided in the WinISA manual (This task would normally be performed by the site network/computer administrator).
8.1.4 3-Monthly Maintenance
(Usually performed by the metallurgical technician, approx. duration of each task is 20-30 minutes)
• Re-standardise the analyser. The Standard Biscuit is to
be attached to the probe head for this (shown left in photo). The procedure should be carried out by the metallurgical technician who is responsible for calibrating the analyser. The procedure is given in chapter 5, Commissioning .
• From the standard measurements, check the probe Live-
Time ratio (LTR) against the last measurement. This number is displayed on the computer count-rates table as the first channel value for each probe.
Preventative Maintenance Schedule Maintenance
On-Line Sampling and Analysis System (MSA) Technical Manual 3.1 8-6
The Live Time Ratio (LTR) of the MEP gives an indication of some electronic problems which may be developing in the detector. In normal operation the LTR will remain fairly constant and will usually have a value greater than 0.5. It will never exceed 1.0 (100%) of course and will only approach that value when the probe is out of the pulp. The operating live time may possibly change by up to 5% as the count-rates in the detector vary during normal probe operation. If the LTR begins to decrease markedly, i t may indicate that there is an increase in microphonic noise or that the vacuum in the detector chamber is deteriorating.
Note: By keeping a record of the standard count-rates, LTR and the rate of LN2 usage, i t is possible to anticipate when the probe will require maintenance. For example, if the probe is beginning to use more liquid nitrogen, then the Company should be notified and arrangements made to re-evacuate (pump down) the probe. If the count-rates are beginning to change as well, then the probe should be serviced as soon as possible.
Warning: If LN2 usage suddenly increases to 3 or more litres per day it can be assumed that a major vacuum leak does exist or has temporarily existed at some earlier t ime. The most likely cause of this is LN2 coming in contact with the lower part of the detector unit from carelessness during fil l ing with LN2 which can freeze and harden the O-rings, which may leak until warm again, or cause major physical damage to the probe. It is undesirable to allow the probe to operate at this high rate of LN2 consumption and it will have to be allowed to warm up and be re-evacuated as a matter of some urgency. During warm-up there is a slight risk of a pressure build-up in the dewar as gas trapped in the activated carbon cryosorbant is released. This may expel the plug from the pump-out port. There must be no obstruction to the plug being ejected because this will prevent possible damage to the dewar by over-pressure.
Maintenance Preventative Maintenance Schedule
On-Line Sampling and Analysis System (MSA) Technical Manual 3.1 8-7
8.1.5 6-Monthly Maintenance
(Usually performed by plant maintenance personnel, approx duration of each tank is 15-20 minutes per item)
• Remove (if necessary) stirrer shafts from the motor and
check the condition of the impellers. If replacing an impeller, ensure it is the same diameter as the original and cut to size if necessary. When re-installing a stirrer, make sure it does not foul the moving carriage when lowering the probe before re-applying power. The impeller must also clear the bottom of the tank and the probe. An impeller too close (<10mm) to the bottom of the tank may wear a hole in the tank over time. If the impellor is too close to the probe it will cause increased wear rate of the impellor and the probe, and is l ikely to result in microphonics which will cause the probe to read erroneously.
• A grease nipple is fi t ted on the idler pulley shaft
located on the left hand side underneath each metallurgical sampler (photo left). Apply one shot of general purpose grease (do not over grease). See lubrication schedule in section 8.2.
• Drain and clean out, or replace the air fi l ter (located
with the air isolator valve). • Check the condition of the probe window and replace if
i t is discoloured, scratched or crinkled. The level of window cleaning required may be reduced or increased depending on the slurry type and condition, this will be determined during the commissioning of the ISA system. If the window becomes too stained the transmission may be reduced which will consequently change the count-rates used for assay calculation. If the window becomes too scratched pin holes may developed in the window which will allow moisture to ingress the probe. Therefore, a window should be replaced as soon as it shows signs of severe staining or wear. Under normal operating conditions a window will last 3 to 6 months (This task would normally be performed by plant personnel who are licensed to work with radiation gauges).
Preventative Maintenance Schedule Maintenance
On-Line Sampling and Analysis System (MSA) Technical Manual 3.1 8-8
8.1.6 12-Monthly Maintenance or Plant Shutdown
(Usually performed by Plant Maintenance personnel, minimum duration of each task is 20 minutes)
• Drain the analysis zones and wash out any accumulated
rubbish. Check for wear on the rubber lining if used, and reline or repair if required.
• Check for wear on the sample cutters, replace if worn. • Check Metallurgical Sampler cutter carriage bushes and
belt for wear. Replace if required, or tighten belt where necessary (see photo left).
• Inspect the analysis tank and associated pipe work,
sample cutters, etc. for signs of wear and tear and replace any worn parts. If replacing an impeller, ensure it is the same diameter and type as the original and cut to size if necessary.
• Check that the stirrer is working and that the impeller
has not been worn away. The slurry should be well mixed to avoid segregation of the slurry. However, the mixing should not be so turbulent that air is entrained. Segregation of the slurry may cause erroneous assay data. Also check that the stirrer impeller or shaft is not hitting the probe nor the bottom of the tank, otherwise a hole may appear in the bottom of the analysis tank through wear.
• Remove the actuator on the water solenoid valve,
(green supply line) and check its rubber diaphragm for wear. Replace as necessary (see photo left).
• If the probe hoist air cylinder (pneumatic ram) is
sticking, strip it down, clean and apply pneumatic grease before re-assembling.
• Check the neoprene gasket in the top of the dewar cover
is able to make a good seal. Often if the turnbuckle is too tight when closed, the lip of the dewar cover can deform the neoprene beyond the point of elasticity, and a groove will remain.
Cleaning the Probe after Slurry Penetration Maintenance
On-Line Sampling and Analysis System (MSA) Technical Manual 3.1 8-10
8.2 Lubrication Schedule
All bearings and stirrer gear motors are grease lubricated for life and thus require no routine maintenance. Air equipment, including the hoist cylinder and solenoid valve are lubricated for life and require no routine maintenance. Other lubrication/greasing requirements are: • Apply general purpose grease to any moving parts as
required. • A grease nipple (see photo left) is fit ted on the idler
pulley shaft located on the left hand side underneath each metallurgical sampler (if fit ted). Apply one shot of general purpose grease (do not over grease).
• Check the operation of the limit switch activator arms
on the metallurgical samplers (if fit ted). If they are sticking, either replace or lubricate with light oil (eg CRC, WD-40, Shell DWF).
• Check the operation of all Metallurgical Samplers. If a
sampler is sticking, remove the cover, clean the guide rods and apply the recommended lubricant.
The recommended lubricant is Rocol MHT available at outlets in most industrial regions. In some countries it is identified as Molybond GA-50 Anti-Seize Compound. It can be ordered from Thermo Gamma-Metrics in a 125 gm tube as part number 55038. • Should an oil seal fail on a stirrer motor/gearbox,
replace the seal and top up the oil . Seal and oil type will depend on the type of st irrer, and is indicated in the identification plate on the stirrer.
Note: Viscous Organic grease is not recommended.
Lubricant and Brush
Maintenance Drying Out The Probe Preamplifier
On-Line Sampling and Analysis System (MSA) Technical Manual 3.1 8-11
8.3 Cleaning the Probe after Slurry Penetration
In the event of a window rupture where slurry has penetrated through the back-up window and into the insides of the lower probe, i t is necessary to clean out the slurry and wash the components, including the source, in pure alcohol (eg. ethanol or methanol), flush with distil led water then dry thoroughly with warm air. A separate procedure for drying the preamplifier circuits on the detector is given in section 8.5 as this procedure may need to be done from time to time even if slurry hasn’t entered the probe.
Note: Inbuilt safety devices will have registered a fault if slurry has penetrated the probe, and the MSA will revert to “Manual” control so that i t cannot continue to lower into analysis zones.
Warning: Permanent damage may result if very hot air is used on the electronic components in the lower probe. This cleaning and inspection must only be carried out by an authorised plant officer (i .e. a person authorised to use and handle radioisotopes and radiation gauges, an RSO) who should inspect the probe and remove any signs of slurry (or water). Once the components are clean and dry, replace the window assembly. A detailed description of how to replace a broken probe window is given in chapter 7, Operation . I t is then important to regularly (every 3 to 6 months) inspect the beryllium window on the front surface of the radioisotope source for signs of corrosion. Corrosion of the beryllium window appears as a white powder on the dark grey beryllium. If slurry has entered the probe and is known to be of a corrosive nature then the isotope should be inspected more often for signs of white crystalline build-up on its casing as many isotopes used also have a Beryllium window. If corrosion of the source is evident, the head should be sealed immediately in a plastic bag until a wipe test can be
IN-LINE FILTER
BERYLLIUM WINDOW
SOURCE HOLDER
WINDOW ASSEMBLY
CABLE ASSEMBLY
LN2 DEWARX-RAY DETECTOR
LN2 SENSOR CABLE
MEP UPPER SHROUDASEMBLY(DEWAR COVER)
LN SENSORLN FILTER CAP
Preventative Maintenance Schedule Maintenance
On-Line Sampling and Analysis System (MSA) Technical Manual 3.1 8-12
performed on the source by the appropriate authority. In most cases the appropriate authority will be the government regulating radiation authority.
Caution: Use a mirror to inspect the radioisotope source to avoid exposure to the X-rays from the source during this procedure.
Maintenance Dismantling and Reassembling the Probe
On-Line Sampling and Analysis System (MSA) Technical Manual 3.1 8-13
8.4 Dismantling and Reassembling the Probe
The following procedures for dismantling and assembling the Multi-Element Probe (Figure 8-1) rarely need to be performed. Loading and unloading the radioisotope is a specialised task and must only be carried out by trained and licensed personnel (eg. the site RSO or the Company engineer).
Caution: Before proceeding, make sure the Signal Analyser is turned OFF (see photo left) and the probe is raised on its hoist and parked at one accessible end of the MSA frame. Optionally, turn off the mains power at the MSA controller switch on the outside panel (see photo left).
WINDOW ASSY
SOLID STATE DETECTOR
LN SENSOR
SOURCE
PREAMPLIFIER
WINDOW RUPTURE
END PLUG LOCATING BLOCK
LOCATING SPRING
LOWER SHROUD ASSY
SIGNAL BNC PREAMP POWER
IN-LINE FILTER
RETAININGBOLT
WINDOW
BIAS
SPIGOT TOOL
LN DEWAR
LN FILLER COLLAR LN SENSOR
DEWAR PLUG
DEWAR COVER
WINDOWALIGNMENT TOOL
Figure 8-1 Exploded View of the Components of an MEP
Dismantling and Reassembling the Probe Maintenance
On-Line Sampling and Analysis System (MSA) Technical Manual 3.1 8-14
8.4.1 Dismantling the Probe 1. Ensure that the probe power and bias voltage switches
are both switched off in the Signal Analyser. 2. Remove the Window Assembly by rotating the two
square head captive bolts at the rear. Action should be taken to avoid radiation exposure before and after the window is removed.
Caution: Handle the window from underneath and work from the back of the probe to prevent unnecessary low-level radiation exposure.
3. Before removing the detector from its casing the source shield (Insertion Guard) (shown left) must be fixed in place over the radioisotope using two M3 screws (refer to Figure 8-2). This serves to protect the protruding spring window contacts from damage when the detector/dewar assembly is being lifted out of the shroud. It also acts as a biological radiation shield.
Multi-Element Probe
Beryllium Window
Shield43403 M3x12
Csk Screw 57565 (2)
Source(3 possible positions)
Window Contact“Fingers”
Figure 8-2 F i t t ing the MEP Source Holder and Sh ield
4. Remove the dewar cover after removing the eight hex
dome nuts around the flange. Lift the cover straight off.
Maintenance Dismantling and Reassembling the Probe
On-Line Sampling and Analysis System (MSA) Technical Manual 3.1 8-15
5. Remove the BNC plug from the LN sensor at the top of
the dewar. 6. Loosen the curved metal clamp on the black plastic
base (see photo left) and rotate to free the detector.
7. Disconnect the three cables from the plugs under the dewar and the data cable from the fil ter unit . Take note of how the cables are fixed and dressed so they may be restored later (see photo left) .
8. Now the handle may be used to lift the complete
detector/dewar assembly and withdraw it from the shroud. It may be easier if two persons perform this task. The detector may become stuck if i t is not withdrawn vertically. If this occurs, twist the detector slightly until i t comes out smoothly.
9. If the probe is to be removed for longer than a few
minutes, replace the dewar cover and the window to ensure the inside of the housing remains clean.
8.4.2 Reassembling the Probe Reassembly is essentially the reverse of above. Detailed assembly procedures are given in the Installation chapter of this manual. Pay particular attention to the cables. They must pass through the gap in the pivot flange, and wrap under the dewar such that they do not become trapped under the flange. When the detector assembly is properly positioned its centre should coincide with the window assembly centre +/-2.0mm. Also check that the bottom of detector can be pressed back against i ts spring and will return about 10mm. When the probe is completely reassembled, the Signal Analyser power may be turned back on. Check that the probe Bias Ramps up and that the Bias and Optical Reset LEDs turn green, if so then all is now okay and the MSA may be put back into “AutoMode”, under computer control. If the Bias supply and/or Optical reset LEDs are not normal, and you are sure that cleaning and drying (see section 8.5) has been done properly, then consult with the Company immediately.
Dismantling and Reassembling the Probe Maintenance
On-Line Sampling and Analysis System (MSA) Technical Manual 3.1 8-16
Drying Out The Probe Preamplifier Maintenance
On-Line Sampling and Analysis System (MSA) Technical Manual 3.1 8-17
8.5 Drying Out The Probe Preamplifier
On rare occasions moisture may have accumulated on the feed-through circuits and electronics (pre-amp and HV filter) mounted on the probe detector. If so, then the symptoms discussed in the Trouble Shooting section 9 will be evident and the following maintenance procedure is required to dry-out the detector components. This procedure must also be followed if cleaning is required after slurry has entered the probe through a broken window. Before commencing this procedure check the following:
• Probe is near full of liquid nitrogen.
• All cables connectors are clean and correctly connected.
• The radioisotope X-ray source has not been disturbed.
• The liquid nitrogen consumption rate has not changed greatly. A large increase in liquid nitrogen consumption indicates that the vacuum has failed and the detector unit needs to be pumped down. In this circumstance contact the Company immediately.
This procedure should be attempted in the order as presented as the steps progress from easy to hardest depending on how severe the case. 1. If possible, leave the probe, with the dewar full , sealed
for one or two days in its shroud, without the foam plug , just shut the stainless steel dewar cover. In cases where only a small amount of condensation has occurred, circulation of the totally dry liquid nitrogen gas around the detector will usually dry out the preamplifier very effectively (see schematic left) . Allow 1 to 2 days (of course this means the MSA will be off-line during this time). Otherwise,
2. If the probe is located in a convenient location, remove
the window assembly and shield the radioisotope using the shield provided as in section 8.4. Using a domestic hair dryer (or warm air gun), gently warm the detector unit by blowing heated air upwards through the opening left where the window assembly was removed. Continue this for about 30 minutes making sure that the detector does exceed 50ºC. If you can hold your hand on the metal then the temperature is okay. Remove the shield, replace the window assembly and retest the probe.
Drying Out The Probe Preamplifier Maintenance
On-Line Sampling and Analysis System (MSA) Technical Manual 3.1 8-18
Warning: Permanent damage may result if very hot air is used on the electronic components in the lower probe. If the probe bias stil l will not ramp up then, 3. For severe cases where procedure 2 doesn't work, or
slurry/water has ingressed past the window into the shroud, remove the probe detector from its shroud, using the procedure given in section 8.4. Shield the radioisotope and the take the detector to a clean work area then follow these steps:
a) If the dewar contains liquid nitrogen (this is usually the
case) mount and secure the detector unit vertically (use the metal stand that the detector was shipped in, see photo left).
b) Locate the preamplifier. This is the area where the
probe cable connectors attach. Undo the two small cross head screws that secure the pre-amplifier cover (see photo below left).
Warning: Do not remove any further screws or bolts as most of them secure vacuum seals. If any of these are disturbed severe damage to the detector unit will occur. c) Slide the cover tube up to expose the preamplifier. d) Using a domestic hair dryer or similar warm heat
source, blow warm air into and around the various parts of the preamplifier for three minutes or so. If there is slurry present, wash the preamplifier in pure alcohol (ethanol or methanol only) then distilled water before drying.
e) Replace the pre-amplifier cover and reinstall the
detector into its probe shroud. In a moist climate this should be done quickly before new moisture condenses.
Note: If after testing, the probe bias will sti l l not ramp up then contact the Company immediately.
Storage of Equipment for Extended Plant Shutdown Maintenance
On-Line Sampling and Analysis System (MSA) Technical Manual 3.1 8-19
8.6 Storage of Equipment for Extended Plant Shutdown
If the plant is to be shutdown for a long period of time then it may be decided by the owners to remove the radioisotope from the MEP for safe storage. This is not a requirement by the Company. Similarly it may be decided to move the detector with shielded source to a storage location which is more convenient for regular LN2 fil ling. Again, this is the owner’s decision. To remove the detector with its (shielded) source in place, follow the procedure in section 8.4. This provides for putting a radiation shield on the source holder. The detector should then be put into its metal stand that i t was originally supplied with, stored in a safe clean and dry place and be kept fil led at least once per week with LN2. The foam dewar plug must be inserted into the detector to keep dirt and moisture out. The place of storage may be on site near to the location of the FLE or other Liquid Nitrogen supply, or off site with a third party. It may be necessary to remove the radioisotope. Consult your Radiation Safety Office for advice. If the source (with shield attached) must be removed from the detector then unscrew the three M3 screws that fix the source holder into the detector. This shielded source holder then needs to be stored in a safe place that is classified as the site radiation store with controlled access. The site RSO is responsible for carrying out this task and ensuring that the radioisotope is properly stored.
Note: Replace the upper dewar cover and window after removing the detector to ensure the inside of the housing remains clean.
Warning: Failure to keep the MEP always cooled with LN2 even when not in use, may permanently damage it .
Storage of Equipment for Extended Plant Shutdown Maintenance
On-Line Sampling and Analysis System (MSA) Technical Manual 3.1 8-20
Warning: If the radioisotope source is to be removed, it must be stored safely and the local radiation authority notified of its storage method and location.
The remaining components of the analyser system, i .e. electronics, computer equipment, etc should just be shut down with mains power tagged out (see photo left) to all in-plant equipment. Drain the analysis zones and wash down the analyser. In some situations it may be desirable to cover the equipment with tarpaulins or similar and/or take measures to prevent condensation or other water damage. It is recommended that an inventory of the stored equipment be maintained.
8.7 Replacing the Sample Hose
When the sample hose (part number 34890) requires replacement take care to isolate the Sampler controller to prevent the cutter from moving. Remove the four hex nuts retaining the flange clamping ring. Undo the hose clamp at the top end of the hose. Remove and discard the old hose.
Maintenance Storage of Equipment for Extended Plant Shutdown
On-Line Sampling and Analysis System (MSA) Technical Manual 3.1 8-21
Convex side toface upwards
Remove 4 nutsand SS flange
Figure 8-3 The Sample Hose
Now insert a new hose from the outside. Make certain that the convex profile on the hose flange is facing up and inwards (i .e. toward the cutter) as shown in Figure 8. Slip the hose clamp over the top of the hose and slide the hose over the cutter spigot tube. You will need to push it fully on until i t touches the cutter plate at the bottom as in Figure 8-4. Fit the clamp ring and replace the four hex nuts. Position and tighten the hose clamp. Make sure the hose has no major kink and is not overstretched. Switch the Sampler controller back on and perform several manual cuts. Check the hose runs smoothly without kinking or straining.
Figure 8-4 The sample hose correct ly at tached to cut ter
On-Line Sampling and Analysis System (MSA) Technical Manual 3.1 8-22
Section 8 - Maintenance Attachment 1–Recommended Start Up
Spares
On-Line Sampling and Analysis System (MSA) Technical Manual 3.1 8-23
Section 8 - Maintenance Attachment 2–One Year Operational
Spares
On-Line Sampling and Analysis System (MSA) Technical Manual 3.1 9-1
9 Trouble Shooting
This section is written for those personnel who will oversee diagnosing electronic faults with the analyser system. It is intended to provide a guide to diagnosing where the fault may be. A description of the electronic cards and modules and their function in the analyser is provided in chapter 7, Operation, so these chapters may be used in conjunction to locate and repair a fault . The on-line analyser system is designed in a highly modular form so that faults can quickly be isolated to a particular circuit board or sub-assembly. The board or sub-assembly can then be replaced with a spare from the spare parts kit so that down time for the system is minimised. This chapter provides a description of diagnostic LEDs used on the electronic cards. Procedures in the following sections should help to quickly isolate the problem to one or two circuit boards or sub-assemblies. At that stage, we recommend that you interchange spare boards from the spare parts kit to fix the problem. The faulty component should then be sent back to the Company for repair or replacement (refer to chapter 10, Service and Warranty).
Some Basic System Mechanical Checks Before Proceeding Troubleshooting
On-Line Sampling and Analysis System (MSA) Technical Manual 3.1 9-2
9.1 Some Basic System Mechanical Checks Before Proceeding
Because sometimes a loss of on-line assays can be attributed to a mechanical failure, it is important to carry out these basic system checks before proceeding with identifying any electronic problems in the system. Go and inspect the MSA in the plant and check the following: 1. The status display (<StatsDsp>) on the OI panel some
typical error messages that will stop the MSA operation (hence stop producing assays) are given in Table 9-2.
MSA Operator Interface Panel Error Messages (refer to Figure 9-1)
Field/Error Message (“x” is the zone
or stream number) Description/Cause/Remedy
‘PositionTest Req’ A self (positioning) test must be performed. Check that the MSA is in “Auto RunMde” and select the <AutoStrt> option in menu level 5 so that a position test will start on power up and after fixing a failure, the MSA will restart. Check the <ZoneMask> (at menu level 7) has been entered and the “Zones Available” have been configured (at menu level 5).
‘ErrRaisingPrb x’
Check the probe carriage hoist. If the Hoist Ram is sticking it may not be able to raise the probe properly. Clean the Ram as required, see maintenance. Check for jamming of rollers and other mechanical parts. Check that the Up/Down sensor switches on the hoist are working. Replace if failed. May be seen in conjunction with ‘AirFl’ message in <StatsDsp>??
‘RevLsNotFound x’
The message implies the Reverse Limit Switch (ie. The prox. Sensor) has not registered the probe moving past it. This can be caused by a very dirty prox. Sensor face, dirty metal plate on the back of the probe carriage, mechanical failure of the probe carriage to move past this sensor so check the movement of the probe and remove dirt from the guide rail. Otherwise, put the MSA into manual mode and try manually moving the probe to that sensor by turning the fly-wheel on the drive assembly). If all fails check for 24V supply to the prox. Sensor itself, or check the RLC input card in the MSA controller and change out as necessary.
‘StuckAtLstZne x’
The probe is not responding to commands to move to another zone or it does not have programmed any other zones. Check…..
‘ZoneNotFound x’
Either the prox. Sensor for that zone has failed (check 24 v) or it just did not register the probe carriage because the metal plate on the back of the cartage is either very dirty or the face of the senor is dirty. Clean as necessary. Also check that you have defined your available (online) zones under the menu option <ZneAvail> at menu level 5.
‘ZnePositionErr x’ During the “Position Test”, the probe could not position
Troubleshooting Some Basic System Mechanical Checks Before Proceeding
On-Line Sampling and Analysis System (MSA) Technical Manual 3.1 9-3
MSA Operator Interface Panel Error Messages (refer to Figure 9-1)
itself at the zone indicated. This may indicate a prox. Sensor failure…..
‘FailedToLower x’ Ram problem, air failure or lower limit switch failure???
‘InvalidZneRqst x’ The zone number doesn’t exist. If it is supposed to then enter it at <ZneAvail> at menu level 5.
‘Parked,Latched’ The “Park” button has been pressed and the probe will be sitting in that zone defined as the service bay.
‘WndRpt’
This message under <StatsDsp> indicates a window rupture. The probe will also be raised on the hoist. Park (??, is it possible to do this?) the probe and change out the window assembly.
‘AirFl’
This message under <StatsDsp> indicates the air pressure supply has dropped below the supply requirement or has ceased altogether. Check supply, if okay then check pressure valves and switches on the probe carriage. Also check blue supply lines on the MSA.
‘Stirrer Run---------O/L x’ Any zones shown in x, indicate that the stirrer for that zone has failed through overload. Check….
‘Probe MotorOverload’ The probe carriage drive assembly motor is in overload. Check….
‘CalibSampleFailed’
This may be caused by; a. Too many sample cuts requested for the available
time (of the calibration sample). b. Sampler problem, refer Table 9-5.
‘Sampler Not Installed’ When selecting samplers, is there a message that indicates that samplers have not been configured, in which case a manual sample must betaken.
“AirFl” indicating the air pressure has dropped too low. “ManMode” something has caused the MSA to drop out of
“AutoMode” and into Manual Control (try putting it back to “Auto” by selecting the option <MenuMode> then entering your pass code and then select <AutoMode>. If it works and the probe starts operation, then you have fixed the problem. If the MSA doesn’t start operation then check for other indicative errors on the OI panel, such as “AirF1” or the following;
a. “GuardOpen” interlocked gate has not been shut properly, or may even be wide open, shut the gate.
b. “WndRpt” indicate you have a broken window in the probe which needs to be changed out. Follow the procedure given under the chapter Operation.
c. “EMStop” someone has pressed the “Stop” button. Do not release until you check why this has been pushed.
d. “Park” the probe has been parked for assumingly probe maintenance. Check why before proceeding to release the “Park” button
e. “Position TestReq” the MSA has been reset,
Some Basic System Mechanical Check Before Proceeding Troubleshooting
On-Line Sampling and Analysis System (MSA) Technical Manual 3.1 9-4
MSA Operator Interface Panel Error Messages (refer to Figure 9-1)
possibly through power failures or misappropriate menu entries. Try powering off then on the MSA. On power up it should do a position test, if not, then check that the zones are actually available. If not, then the zone mask may have been destroyed and needs to be re-entered (see section 7.2.6, using the OI panel menus). Also observe any other message lines that appear on the OI panel. For example, the next one.
f. “RevLSNotFound” this means the probe missed “seeing” its end proximity sensor. Manually move the probe passed this sensor by turning the fly-wheel on the drive assembly.
Once the probe is in front of the suspect sensor, close the guard and put the MSA into “AutoMode”. It should then continue moving, if not check the “ZoneMask”, “ZoneAvailable” settings. If all this fails to get the MSA operational then proceed to checking the electronics.
Troubleshooting Some Basic System Mechanical Checks Before Proceeding
On-Line Sampling and Analysis System (MSA) Technical Manual 3.1 9-5
Zone 6 no tank
Zone 5 no tank
Zone 4
Zone 3
Zone 2
Zone 1 no tank
F 6 5 4 3 2 1 R
Forward Limit Switch
Remove Limit Switch
Electronics Enclosure Electronics Enclosure & OI
Forward direction when standing at the OI side of the MSA
Reverse direction when standing at the OI or sample outlet side of the MSA
Zone Mask:
Sampler Mask:
Proximity sensors corresponding to zones built: F 6 5 4 3 2 1R0 if not built, 1 if built for zone mask: 1 1 1 1 1 1In this example proximity sensors exist for position 1: ------ -------5 and 6 even though there are no tanks 7 7
0 is not built (ie no tank and/or no sampler), 1 if built: 0 0 1 1 1 0In this example there are only samples for zones ------ ------2, 3 and 6. 1 6
Converting masks to Octal (base 8):
000 0001 1010 2011 3100 4101 5110 6111 7
TOP VIEW LAYOUT OF MSA
F igure 9-1 An Example of how to Calculate a MSA Zone and Sampler mask
ISA Assays Differing from Shift/Check Samples Troubleshooting
On-Line Sampling and Analysis System (MSA) Technical Manual 3.1 9-6
9.2 ISA Assays Differing from Shift/Check Samples
For problems with the on-line assays consistently reading different to the shift or check sample assays and assuming you are stil l getting assay readings from the analyser, check the following before proceeding with electronics diagnosis;
• Check the cleanliness of the probe window. A dirty window will change the count-rate measurements and hence the on-line assay reading.
• Put the standard biscuit on the probe (refer to Standardising in chapter 5, Commissioning) and measure the standard for 2 or 3 five-minute periods. The standard measurements obtained should not be too different to those being used in the calibration equation and should be stable.
• If the standards are very different and unstable then measure for a few hours and check the time period since they were last measured. If i t is up to a year or more since last measured then enter the new standards values into the software data base and then re-check the on-line assays readings to see if they are more acceptable.
• If the standard count-rates were measured more recently and are now very different don’t apply them. There may be an electronic problem and you will need to proceed further in this chapter to find the fault.
Troubleshooting Diagnostic LEDs
On-Line Sampling and Analysis System (MSA) Technical Manual 3.1 9-7
9.3 Diagnostic LEDs
To allow rapid fault finding, many of the circuit boards contain diagnostic Light Emitting Diodes (LEDs) like those shown in the photo left . The general messages given by the LEDs are:
Colour Status Message Green Lit or Flashing All is Running Normally* Amber Lit or flashing All is Running Normally* Red Flashing or flickering Usually a non-fatal problem –
Investigate when convenient Red Permanently &
Brightly Lit Fatal Problem – Investigate Immediately
Table 9-2 Diagnost ic LED Colours
Observing the LEDs at various points in the system allows you to very quickly find the general area of the problem. There are some exceptions to these general messages. For instance, the red overload LED on the AM001/91 Linear Amplifier card will generally flash faintly most of the time. This is quite normal. Also a number of red LEDs will i l luminate for a few minutes after power is first applied to the unit. Figure 9-2 shows a schematic layout of cards and modules in the MEP Signal Analyser chassis. A description of each of the numbered LEDs follows in Table 9-4.
* The absence of illumination of a green or amber LED or lamp may itself be an indication of a fault in some cases. Often these colours are used for data or state indicators and hence may go on, off or flicker as a result of some activity or data traffic.
Diagnostic LEDs Troubleshooting
On-Line Sampling and Analysis System (MSA) Technical Manual 3.1 9-8
Figure 9-2 S ignal Analyser Chass is Layout
Troubleshooting Diagnostic LEDs
On-Line Sampling and Analysis System (MSA) Technical Manual 3.1 9-9
Card No.
Card Description
LED No.
LED Description
Normal Operating Status
Fault Status
AM001/91 Linear Amplifier Card 1 Overload Flickers Red Solid Red indicates too many counts and/or high energy noise
AM002/91 Pulse Validation Card 2 3 4 5 6
Count High Count Too Busy Busy Live
Off Flickers Green Off Orange Green
L2&L3 monitor incoming pulse rate (Red if too high). L4&L5 monitor outgoing validated pulses (L4 Red if high, L5 off).
AM091/03 Live-Time Clock Card 7 “T” Off Not used AM056 24V Supply/Ref. Card - AM059 Low Volt Supply Card - AM351 12V Supply Clock - AM093/11 Comms Adaptor 8
Off Flickers Green Flickers Green Flickers Green Orange
Red if break or short in Window Rupture (WR) circuit. Off for >60 seconds if no data comms to PC Off if no comms Off if no comms
AM092/10 Network Interface Card 13 14
Self Test Fail LN Low
Off Off
Red if fault with LN level circuit Red if LN less than 1 litre (and LN test lamp ON)
AM062/02
Bias Supply Card
15 16
S/C LN Sensor O/C LN Sensor
Off Off
Red is a short circuit in LN sensor circuit Red is an open circuit in LN sensor
AM994/01 MCA Access Module 17 18
Acquire Spectrum Test Mode
Off Off
No fault condition No fault condition
AM990/10 SCA Module (slots 11-19) 19-27 SCA Counts Flickers Green Off indicates no signal
AM963/20 Bias Control Module 28
Optical Reset
Flickers Green
Red indicates too many resets. Off may mean fault with detector or cabling.
29 Bias Green (Blinking Red on Ramp Up)
Solid Red indicates moisture on the preamp. Off means Bias switch off or may indicate fatal problem with Bias supply or detector or cabling.
Table 9-3 S ignal Analyser LEDs - Funct ional i ty
Troubleshooting Locating a Fault with the Analyser
On-Line Sampling and Analysis System (MSA) Technical Manual 3.1 9-10
9.4 Locating a Fault with the Analyser
This procedure assumes that no on-line assays are being displayed, or that they are very different to expected values. If incorrect values are being displayed then check the probe window condition and the standard count-rates before proceeding any further.
1. Check if the WinISA Server computer is actually running (green ISA icon on taskbar) and if so open the WinISA Client Control Panel and check that the software is connected to the probe in question and measuring (refer to the Software Manual for further details). If the computer is not running or the measurement cycle has been stopped, restart either or both, open the tabular count-rate display screen and wait a few minutes for data to appear. Other diagnostic warnings/alarms may be viewed on the Client window, otherwise if there isn’t any data proceed to 2.
2. The LEDs on the AM093/11 Network Interface card (photo left) in the Signal Analyser are particularly useful for indicating the state of the communication link between the Signal Analyser and WinISA computer. Every minute the WinISA computer will interrogate the Signal Analysers and in doing so the green and orange LEDs on the AM093/11 will flash momentarily. This effect indicates that all communication is proceeding normally. The LEDs on the AM955 converter (near the computer, photo left) will flash as the same time. If any of these LEDs are not flashing then proceed to 3. If they are flashing then proceed to 6.
3. Check that the cable between the AM955 converter unit (and the ISA computer) is connected properly.
4. Check the continuity of the RS-485 data cable between the AM955 and the Signal Analyser and check the terminations on each end.
5. If all terminations and continuity are okay then fully shutdown the computer then re-boot. This will reset the serial communication ports. If this fails follow the procedure in 9.4.1 to check that there is actually data coming out of the Signal Analyser.
Troubleshooting Diagnostic LEDs
On-Line Sampling and Analysis System (MSA) Technical Manual 3.1 9-11
6. Alarms and Warnings on the WinISA Computer can be viewed using: 1. Autoclient 2. WinISA Client, Control Panel 3. Server Monitor A Window Rupture alarm indicates that the window is broken or there is moisture inside the window assembly (refer section 9.4.2). The probe will actually be raised on the hoist and the OI panel will indicate that the MSA has dropped into “Manual Mode” (go and check). Remove and replace the probe window immediately (see section 7.9.2)
An “Alarm Circuit Failure” indicates a fault with the WR test circuit (refer section 9.4.3) and again the probe will be raised from the slurry and so count-rates will cease.
A Low Liquid Nitrogen warning followed later by a Bias Fail alarm indicates the probe has run out of LN2 and must be fil led immediately (refer to section 9.4.4). Allow a few hours for the probe to cool down before it returns to normal operation.
A “LN Self Test Failure” indicates a fault with the LN test circuit (refer to section 9.4.5).
If there are no apparent alarms then proceed to 7.
7. Check the status of LEDs in the Signal Analyser (refer to Table 9-4). An abnormal status will help indicate where a problem is. If there are no abnormal LED status’ then proceed to step 8. If there is a fault status indicated then use the LED and card/module descriptions provided herein and in chapter 7, Operation to help diagnose the cause of the problem. Some LED fault status’ may indicate a fault with the MEP detector and if so then proceed to step 9.
8. Check the sett ings in the Signal Analyser electronics (refer section 9.4.6). If any of the SCA settings or the Gain setting have been adjusted incorrectly then count-rate information will be incorrect and hence the assay readings too. You will need to have kept a log book of any real changes to settings made in the past. If a service has been done by the Company then any changes too settings will be recorded in the service report. If all settings are okay and no abnormal LED status’ are evident from step 7 then it is most l ikely that you do not have any electronic
Diagnostic LEDs Troubleshooting
On-Line Sampling and Analysis System (MSA) Technical Manual 3.1 9-12
problem but instead a dirty window or calibration range problem.
Troubleshooting Diagnostic LEDs
On-Line Sampling and Analysis System (MSA) Technical Manual 3.1 9-13
9. Check the MEP detector operation and that the X-ray spectrum and probe resolution are okay. Refer to section 9.4.7. You will need an MCA for this. If you do not have one on-site then contact the Company.
9.4.1 Checking the Signal Analyser Data Communication
To determine if there is a problem with the data communications out of the Signal Analyser set the following switch in the Signal Analyser box.
PROBE/INJECT to INJECT
And vary the REFERENCE potentiometer on the MCA Access module so that pulses are injected into one of the channels. The pulse frequency is exactly 5kHz (5000 counts/second).
The computer should display a number which is 5000 divided by the Live Time Ratio (LTR). The other channels can be checked in the same manner. This procedure not only checks the Signal Analyser but can also be used to diagnose problems in the computer components. Open the Raw Counts tabular screen and check whether the numbers are displayed correctly on the computer. If not, then check the following:
1. No counts at all , see section 9.4, steps 1-5 2. Incorrect count-rate; swap AM092, then AM091,
then AM994, then SCA cards. 3. Then swap AM093 card, then AM955, then check
computer software (WinISA configuration).
9.4.2 Window Rupture Alarm The sensor for Window Rupture (WR) is a circular electrode between the main (primary) window and its backup window (both windows are made of thin polyester (Mylar) film). Figure 9-3 shows the components of the Window Assembly. A conductivity measuring circuit in the Signal Analyser continually monitors this electrode for leakage current and will trigger the alarm condition, which is reported to the WinISA software, if this exceeds a pre-defined limit. Furthermore, because the electrode and it 's connecting wiring are intentionally exposed (not insulated on all sides) in the bottom part of the probe any moisture that enters the probe through a leak, other than at the window, will also register an alarm.
Diagnostic LEDs Troubleshooting
On-Line Sampling and Analysis System (MSA) Technical Manual 3.1 9-14
The WR alarm condition causes the probe to be automatically raised from the slurry and so count-rates to the computer will cease (the software reports the hoist up status as fatal). An alarm is sent to the WinISA computer which displays an alarm message. The AM093/11 Comms Adaptor Card monitors the window rupture circuitry. The conductivity sensing voltage is alternating (i.e. AC) to prevent de-plating and unnecessary corrosion of the electrode.
AM232 - ALARMED WINDOW ASSEMBLY
BRASS SCREWS (8)
TE-91 - BACKUP WINDOW ASSEMBLY
STAINLESS STEEL WINDOW SEALING RING
MYLAR PRIMARY WINDOW
O-RING** Apply petroleum jelly TGM part no. 55035 to o-ring.
O-RING** Apply a very thin smear of petroleum jelly (TGM part no. 55035 to o-ring prior to assembly).
44844.dwg
Figure 9-3 Components of the Window Assembly
Note: If the Mylar film in the TE-91 Backup window is damaged, do not attempt to repair i t . Replace with one from the spares kit or toolbox.
Troubleshooting Diagnostic LEDs
On-Line Sampling and Analysis System (MSA) Technical Manual 3.1 9-15
Causes of moisture inside the probe which may trigger a Window Rupture Alarm include: • Broken primary (front) window. Replace immediately . • Leaking Window Assembly. Remove Window Assembly
and replace O-ring and re-seat backup window ring if necessary.
• Leaking square head bolts. Remove the square head bolt assembly on the back of the probe head. Clean, check, lubricate and replace the O-rings if necessary.
• Condensation. Poor circulation of dry Nitrogen gas or vacuum deterioration inside the detector resulting in excessive boil-off . Check that the foam plug is not inserted in the dewar and monitor the LN2 usage . Check the four small breather holes are clear in the AM249/10 (see photo left). Refer to chapter 8, Maintenance for further details.
9.4.3 Window Rupture Circuit Self Test
The Window Rupture or moisture sensing system is continually tested for circuit failure. The window circuit on the AM093/11 card does not differentiate between genuine Window Rupture and short circuit.
Window Status W/R Test Lamp Hoist Reset (1) Lamp
AM093/11 STF LED
Heal thy Off Off Off Window Rupture On On On Window Circui t Short Circui t
On On On
Window Circui t Open Circui t
Off & s tays Off when pressed*
On On
* note an S220 appl icat ion code bug means this but ton wil l never l ight when pressed.
(1) Hois t Reset lamp not appl icable to MSA, hois t funct ion is control led by RLC.
Table 9-4 Window Rupture Circui t Status LEDs
Note that the self test will detect the window assembly being removed and will raise the probe, if not already up, except if the probe is parked and/or if the guard door is open and/or if the Emergency Stop is pressed. The MEP will not resume normal operation until the window assembly is properly re-fitted. The self-test is very thorough in-as-much as i t verifies the proper operation of the complete circuit from the actual conductivity electrode (a pair of concentric metal r ings around the window perimeter) through the interconnecting conductors, plugs and sockets to the actual data register which signals the alarm to the outside world.
Diagnostic LEDs Troubleshooting
On-Line Sampling and Analysis System (MSA) Technical Manual 3.1 9-16
The key to this is the pair of silicon diodes are mounted in the backup window itself and connected electrically in parallel with the conductivity electrode. These diodes have no effect on the normal operation of the electrode but allow the system to confirm that the WR circuit is complete and functional down to the electrode itself. To test the diodes use a multimeter (DVM) having a “diode test” capability. This should indicate approximately 1.2V across them in one direction. If the WR STF LED is on and there is no apparent window rupture then check the continuity of the whole WR circuit. The white wire under the upper dewar cover (on the black base plate) is part of this circuit so check connection there and back to the Signal Analyser via pin 3 on the 9-pin “Detector” connector at the bottom of the Signal Analyser chassis. The complete circuit including return earth can be checked by measuring between pins 1 and 3 on the D9 plug with a digital volt meter on “diode test”. Otherwise, replace the AM093/11 card with one from your spares. Remember to check the jumper link. A jumper link on this card (see Figure 9-4) must be in the position “SAMPLER” for analysers fit ted with an in-built Metallurgical Sampler and it must be set to “BUTTON” for analysers using the AM101 calibration button.
AM093/11 Card
Figure 9-4 Showing jumper l ink on AM093/11
Link must in po sition"SAM PLER
A M0 93 /11 Car d
Link set to ‘SAMPLER” if system has a Met Sampler, otherwise set to ‘BUTTON’’
Troubleshooting Diagnostic LEDs
On-Line Sampling and Analysis System (MSA) Technical Manual 3.1 9-17
9.4.4 LN2 Monitor The liquid nitrogen (LN2) monitor consists of a Zener diode which is suspended in the LN2 dewar. It is positioned such that a WARNING will be sent to the WinISA Computer when there is less than one litre of LN2 left . The LN TEST push-button near the power switch in the Signal Analyser chassis will also be il luminated, red. If the LN2 supply is not replenished within a few hours of a “LN Low” warning occurring then the probe dewar will eventually run dry. This will in turn allow the cryostat (detector) electronics to heat up. A second sensor, a Resistance Temperature Device (RTD) actually inside the cryostat will detect this temperature rise and shut down the bias supply to the detector once the temperature has risen above -140oC (133 Kelvin) resulting in a BIAS FAIL alarm. This means that no count-rate data will then be transmitted to the WinISA computer and so the assays calculated for that stream will suddenly change to unusual values, or cease altogether. The Live Time Ratio (LTR) will drop to zero (check this in the Client Tabular Screens). The AM092/10 Network Interface Card monitors the low liquid nitrogen and temperature sensors and informs the WinISA computer if one or other of the tests fails. The AM092/10 card has five LEDs (refer to section 9.2) which together with the lamp in the LN TEST button allow diagnosis of several abnormal conditions (see tables 9-2 and 9-3). The RTD is connected to the signal analyser via pin 5 of the 9-pin detector connection at the bottom of the chassis.
9.4.5 LN2 Circuit Self Test The LN2 Monitor system is virtually fail-safe and self-testing. The AM092 card automatically checks the LN2 level sensor every 20 minutes. If the LN2 sensor fails or becomes disconnected a warning is signalled. Manual checking, which is not necessary on a regular basis, involves pressing the LN TEST button (for up to 30 seconds). It will l ight up if this circuit is OK, then should extinguish within 20 seconds of being released. If not already lit , a momentary press of the LN TEST button will initiate a new measurement and if the sensor is actually fully out of the liquid the LN TEST lamp should light in less than one minute, thus indicating that the circuit (including the sensor itself) is okay.
Diagnostic LEDs Troubleshooting
On-Line Sampling and Analysis System (MSA) Technical Manual 3.1 9-18
Calibrating the LN2 sensor is only required when the sensor or AM092/10 card is changed or power has been off to the Signal Analyser for a long period of time. The procedure is detailed in the chapter 5, Commissioning. The LN2 sensor circuit incorporates the brown Teflon coated BNC cable that connects to the LN2 Sensor at the top of the detector dewar and at the other end into the detector preamp assembly. The sensor signal is then output via the 9-pin cable at pin 8 to the Signal Analyser. A break in this loop, including a broken diode at the end of the sensor wire, will cause the open circuit LED on the AM092/10 card to light Red. A short circuit of the LN test circuit is when the voltage that the AM092 card reads across the LN level sensor is significantly less (more than one volt lower) than the programmed value. Refer also LN level sensor calibration procedure in chapter 5, Commissioning .
9.4.6 Checking the Signal Analyser Settings Count-rates and hence the on-line assays will change significantly if the SCA settings or the AM001 Gain card setting are altered. Checking the AM001 Gain Setting The Gain once set must not be altered unless a new detector or AM001 card is installed. Check the current setting against the last known setting from your commissioning or last service visit . If i t is now different and you have no record of why then try setting the Gain back to the last recorded value then measure the standard (refer chapter 5, Commissioning) and check the on-line assays. Checking the SCA Reference Volt Settings If the Gain setting appears to be okay then check the SCA reference volt settings against your last known values. Set the dial on the AM994 MCA access module to 0 volts. Then set the following switches on the AM994 MCA Access Module:
RUN/TEST to TEST
PROBE/INJECT to INJECT Slowly turn the potentiometer clockwise on the AM994 MCA access module and record the voltages each time a SCA LED (green) just comes on and then just goes off.
Troubleshooting Diagnostic LEDs
On-Line Sampling and Analysis System (MSA) Technical Manual 3.1 9-19
This is the voltage range or reference volt setting for the SCA. Repeat this for each SCA and then compare the current settings against the last known and recorded values. If one or more of the voltage settings has changed then check first if that particular SCA (count-rate channel) is being used in an assay equation that is now displaying wrong assay values. If i t is then reset the voltage setting to what is should have been and check the assay values now displayed. Standardisation is recommended after a change such as this. To reset the reference volt setting turn the dial slowly to the value that i t should have been then insert a small screwdriver into whichever of the UL or LL discriminator needs to be moved and slowly turn the appropriate trim-pot until the green LED just l ights. Turning the trim-pot clockwise will increase the voltage setting and anticlockwise will decrease the voltage. Adjusting the AM001 Gain to Realign the Spectrum If the AM001 card, detector or detector preamp is replaced then the Gain needs adjustment to align the X-ray spectrum within the SCA settings. This requires the use of an MCA and if there is not one available on-site contact the Company to arrange one to be sent to site or arrange a site service visit . If you do have an MCA then follow these steps to tune the Gain (refer to chapter 5, Commissioning if you do not know how to use the MCA): 1. Check which parts of the spectrum fall within the SCA
channels by setting the switch on the AM994 module:
RUN/TEST to TEST
Then press the ACQUIRE button to light the red LED.
2. Then press the MARK button on each SCA briefly and release it then press and release again. You should see spikes appearing at the LL and UL discriminator settings of each SCA. The first press injects a marker pulse at the LL setting and the second press injects a marker pulse at the UL setting. Alternate presses inject pulses at the LL then UL marker positions.
Diagnostic LEDs Troubleshooting
On-Line Sampling and Analysis System (MSA) Technical Manual 3.1 9-20
3. The GAIN of the AM001 card is correctly set by
adjusting the GAIN trim-pot by a small amount to ensure that the spectrum peaks fall in the centre of the channel markers (spikes). This is best done by comparing alignment with two larger peaks at the bottom and top of the spectrum. As you fine-tune the gain, clear the spectrum on the MCA, start collecting again and re-press the SCA marker buttons. If a small adjustment is sti ll needed to the SCA itself then follow the procedure in chapter 5, Commissioning or below. This may be required due to non-linearities in gain across the spectrum between probes.
Note: It is possible to set the GAIN control without the aid of an MCA, provided the probe and signal analyser are otherwise okay. To do this, use a metal plate (eg Fe) or a sample having a high concentration of the key element in front of the probe then adjust the GAIN control for maximum brightness of the relevant SCA LED (FeKα in this example). Then use the standard biscuit to confirm the count-rates are close to expected values.
Adjusting the SCA Reference Volt Settings If one of the SCAs is replaced then the LL and UL discriminators will have to be set up. This is done by using the REFERENCE dial on the MCA Access module and adjusting the levels to the previous values by setting the following switches:
RUN/TEST to TEST
PROBE/INJECT to INJECT Wind the UL trimpot fully clockwise (10 turns). Now set the REFERENCE dial to the LL value. If the LL<•<UL LED is alight, rotate LL clockwise until i t is on the edge of on/off (flickering indicates 10 volt power supply noise or AM994 fault). If i t is off, rotate LL anti-clockwise. The lower level (LL) is now set. Change the REFERENCE to the upper level (UL) value. Turn the UL tr impot anti-clockwise until the LL<•<UL LED is on the edge of on/off.
Troubleshooting Diagnostic LEDs
On-Line Sampling and Analysis System (MSA) Technical Manual 3.1 9-21
Then check that the count-rates for that channel with the new SCA are close to what they were before it failed. If they are significantly different then very slightly further adjust the LL and UL discriminators or get an MCA and investigate for a more serious problem.
9.4.7 Checking the MEP Detector
An immediate problem with the MEP detector may be identified by the Optical Reset and Bias supply LEDs discussed in section 9.3 and Table 9-4. If both the Optical Reset and the Bias LEDs are off (with the Bias switch to ON) then there may be a failure of the FET/Optical LED assembly inside the detector. Check for the presence of any other RED lights and check cabling to the probe. If the LEDs are stil l off then contact the Company immediately to arrange repair. Providing the AM963 module has not failed then the Bias LED red indicates there may be moisture in the probe (see later) or a complete failure of the detector. Low LN will turn the Bias off also and hence the LED will be off. The Optical reset LED indicates two different things about the incoming probe signal:
• COLOUR
The colour green indicates that the gross count-rate is within the maximum allowable rate for the ASP fitted. If the count-rate is too high it goes red.
• FLASH
I t flashes once for each reset transition detected in the probe signal. The colour of the flash may be red or green depending on 1 above. At high reset rates the flashes will merge into an unsteady glow.
Because each reset also registers one or more counts, albeit outside the spectrum, it is possible that the Optical Reset will turn red momentarily during the bias ramp-up stage but this is of no consequence. Should it turn red during normal operation it may indicate one of the following problems:
• The radiation level (X-ray flux) is too high, or
• An excess of electrical noise is being generated in the probe.
Diagnostic LEDs Troubleshooting
On-Line Sampling and Analysis System (MSA) Technical Manual 3.1 9-22
This may be due to the loss of LN2 cooling or a degraded vacuum or ageing Si(Li) detector or FET and will show some effect on the spectral performance of the probe.
• One of the two cards AM001/.. or AM002/.. is defective.
• Electromagnetic Interference (EMI). This can be checked by ensuring the fil ter under the dewar is present and okay and check all earthing points. Also look for possible sources of EMI nearby eg. variable speed motor drives, etc.
Increase in LN2 Usage A problem with an MEP detector may be the noticeable increase (above 2 litres per day) in LN2 usage. If this occurs you will sti l l get count-rates (assays) but the values may not be true due to degradation in the vacuum and hence the Probe Resolution , especially if LN2 usage increases beyond 3 litres per day. If you think that there is a problem with an MEP detector, the most important thing to do first is to measure the probe X-ray spectral resolution using the standard biscuit and compare it against the last recorded value. If there has been a significant increase in the value and particularly if i t is now >270eV; contact the Company immediately to arrange repair and re-evacuation of the detector. The procedure for measuring the Probe Resolution is provided in chapter 5, Commissioning .
Note: If you have 4µs or 2µs ASP cards, the probe resolution limits are 300eV or 330eV respectively.
Note: Re-evacuation is a specialised task and is infrequently needed. If i t becomes necessary, please consult the Company or local agent for assistance.
Note: Average lifespan of the Multi-Element Probe is 7 to 10 years. Environmental conditions and consistency of Liquid Nitrogen fill ing are some factors which affect lifespan.
Troubleshooting Diagnostic LEDs
On-Line Sampling and Analysis System (MSA) Technical Manual 3.1 9-23
Moisture in the Probe (Red Bias LED) If the LN2 consumption is normal but all count-rates have decreased and are unstable, the probe Live Time Ratio (LTR) has changed, and the Probe Resolution (sharpness of the peaks) has deteriorated, then it is most l ikely that condensation has formed on the high voltage components in the pre-amplifier inside the probe itself. Most often this will be associated with the BIAS LED on the Bias Controller card remaining red instead of green. i .e. , the HV will not ramp up to the required 500 volts, in which case the count-rates (assays) will not be displayed at the computer. To remedy this refer to the procedure; "Drying Out the Probe Preamplifier", in chapter 8, Maintenance . Significant Decrease in LTR The Live Time Ratio (LTR) gives an indication of any electronic problems that may be developing in the MEP detector. This value is displayed as the first channel in the count-rate tabular display at the computer. In normal operation the LTR will remain fairly constant and will have a value greater than 0.50 (meaning 50%). 70% to 90% is usual. It will never exceed 1.0 (100%) of course and will only approach that value when the probe is “not seeing” sample or slurry. The operating live time may possibly change up to 5% as the count-rates in the detector vary during normal probe operation. LTR is affected by the number of total counts in the spectrum so as elemental concentrations change, so will LTR. LTR may also be affected by temperature; this is normal. If the LTR begins to decrease markedly (i .e. by more than 10), i t may indicate that there is an increase in acoustic noise (microphonics) or that the vacuum in the detector chamber is deteriorating. Measure the Probe Resolution and if this is also very poor (eg. >300eV), then the FET and or crystal inside the detector may be damaged.
Warning: If you think there may be a serious problem with your MEP detector then contact the Company after carrying out the checks detailed above.
Diagnostic LEDs Troubleshooting
On-Line Sampling and Analysis System (MSA) Technical Manual 3.1 9-24
9.5 Locating a Fault with Metallurgical Samplers
The following table is a guide for diagnosing problems with the Metallurgical Samplers if they are fit ted to your Multi-Stream Analyser.
REF FAULT CAUSE CHECK OR REMEDY 1 Sampler will not cut, and Red
LED on AM987 is on. Sampler module has timed out
• Press white RESET button alongside the LED. • Check AM665 is set on Speed 1 to 5, not 0.
Try selecting another speed. • Replace AM987 • Replace AM054/01
Table 9-5 Faul t D iagnosis for Metal lurgical Samplers
Troubleshooting Diagnostic LEDs
On-Line Sampling and Analysis System (MSA) Technical Manual 3.1 9-25
Note: Refer Section 8.2 for Lubrication Schedule .
Note: Always turn off and lock out the MSA power before
replacing circuit cards or modules.
On-Line Sampling and Analysis System (MSA) Technical Manual 3.1 10-1
10 Service &Warranty
10.1 Customer Service
The Company provides full telephone, fax and email service support to its Customers or alternatively, the Company has a full complement of Customer Support Engineers available to visi t si te, if necessary. The Company also offers its customers a “Product Support Agreement (PSA)”. Please contact the Company for further information or visit our website: www.thermogammametrics.com.au Thermo Electron Corporation Head Office addresses is: Street Address: Thermo Electron Corporation
11 West Thebarton Road THEBARTON South Australia 5031 AUSTRALIA
Postal Address: Thermo Electron Corporation PO Box 292 Torrensville Plaza South Australia 5031 AUSTRALIA
Shipping Address:
Thermo Electron Corporation Rollerdoor, 4 Osman Place THEBARTON South Australia 5031 AUSTRALIA
National International TELEPHONE FACSIMILE
(08) 8150 5300 (08) 8234 5882
+61 8 8150 5300 +61 8 8234 5882
Spare Parts Service & Warranty
On-Line Sampling and Analysis System (MSA) Technical Manual 3.1 10-2
10.2 Spare Parts
Recommended start-up and operational spare parts are listed in chapter 8, Maintenance .
Note: Refer to the AnStat Parts List Manual for a complete
listing of assembly parts and drawings. If spares have not been purchased as part of your system then they may be ordered directly from your local Thermo Electron office. Allow 2 to 6 weeks delivery, ex Adelaide, Australia, depending on availability and location of your plant. All i tems of equipment supplied initially with the analyser system are covered by Warranty (see section 10.3). When requesting a quotation, please quote the 5-digit Store Number and Part Number (usually AM---/-- or TE---/--), where available as well as the descriptive name of the part.
10.3 Equipment Warranty
The Company ensures that all "Work" covered under a contract scope of supply including, but not l imited to, material workmanship conforms to the Customer requirements and specification using sound, established and modern engineering practice and applicable standards (ISO 9001). The Company guarantees that the equipment is free from defect in workmanship and materials under normal operational use, the Company will make good, by repair, or at i ts option, by replacement, defects which, under proper use in Company opinion, appear in the equipment within twelve (12) months from the date of date of supply of the equipment or part. Any goods that are supplied under replacement shall be supplied FCA, from Thermo Electron, Adelaide, Australia. All freight, insurance, taxes, imposts, duties and levies etc. , will be to the Customer’s account. INCOTERMS 2000 Edition applies.
Service & Warranty Equipment Warranty
On-Line Sampling and Analysis System (MSA) Technical Manual 3.1 10-3
Equipment will be repaired under warranty, free of charge, at our works providing that i t is returned to the Company, freight paid . Alternatively, any repairs necessary may be carried out on-site providing that any travel, accommodation and expenses incurred are paid by the Customer. Should the Company be called to carry out work under warranty and find that the fault l ies outside our responsibility then any cost involved will be to the Customer’s account. This warranty is in lieu of all other guarantees and warranties expressed or implied, and does not apply to replacement or repairs which are required as a result of negligent use, improper installation by others, maladjustment, modification or lack of routine maintenance by others. The Company does not guarantee the overall performance of any plant or the result of any process on which their equipment is used. This warranty does not apply to any items considered to be of consumable nature, i .e. all i tems listed as "Tools & Consumables" and including any other such parts susceptible to wear and tear, eg. probe windows, pump hoses, rubber and plastic pipes/tubes, impellers, stirrer shafts, mild or stainless steel tanks and Primary Sampler internal l inings, including sample cutters, sample nozzles, etc. This warranty also does not cover any form of surface coating, eg. rubber lining, paint coatings, etc. The warranty does not extend to, and the Company accepts no responsibility for, consequential and/or secondary damages or losses of any kind sustained directly or indirectly as a result of a defect in any products, materials or installation. Outside the warranty period, where a site visit for repair, re-calibration, training etc is required, current standard, or service agreement rates will be charged. Travel days, return air fares and transit expenses will be charged as a fixed mobilisation cost. Accommodation, meals and on-site transport will be charged accordingly. This warranty does not extend to non-Company supplied computer and peripherals. It is the Customer's responsibility to arrange for service and warranty agreements for those items with their local supplier.
Repairs Service & Warranty
On-Line Sampling and Analysis System (MSA) Technical Manual 3.1 10-4
10.4 Repairs
For individual assemblies, modules and cards, if i t 's broken then we can probably fix it . Contact your regional support office for advice or just package and label the part(s) and send, along with a fault description and contact details to our Head Office. We will assess the repairability of the part and advise the customer. Ship To: Thermo Electron Corporation Rollerdoor, 4 Osman Place, Thebarton, Adelaide, South Australia 5031 Australia Attention: Repairs Department
Caution: Do Not dispatch radioisotope sources with equipment for repair.
Warning: An MEP detector requires special packaging for return for repair. Consult with the Company before packaging and shipping.


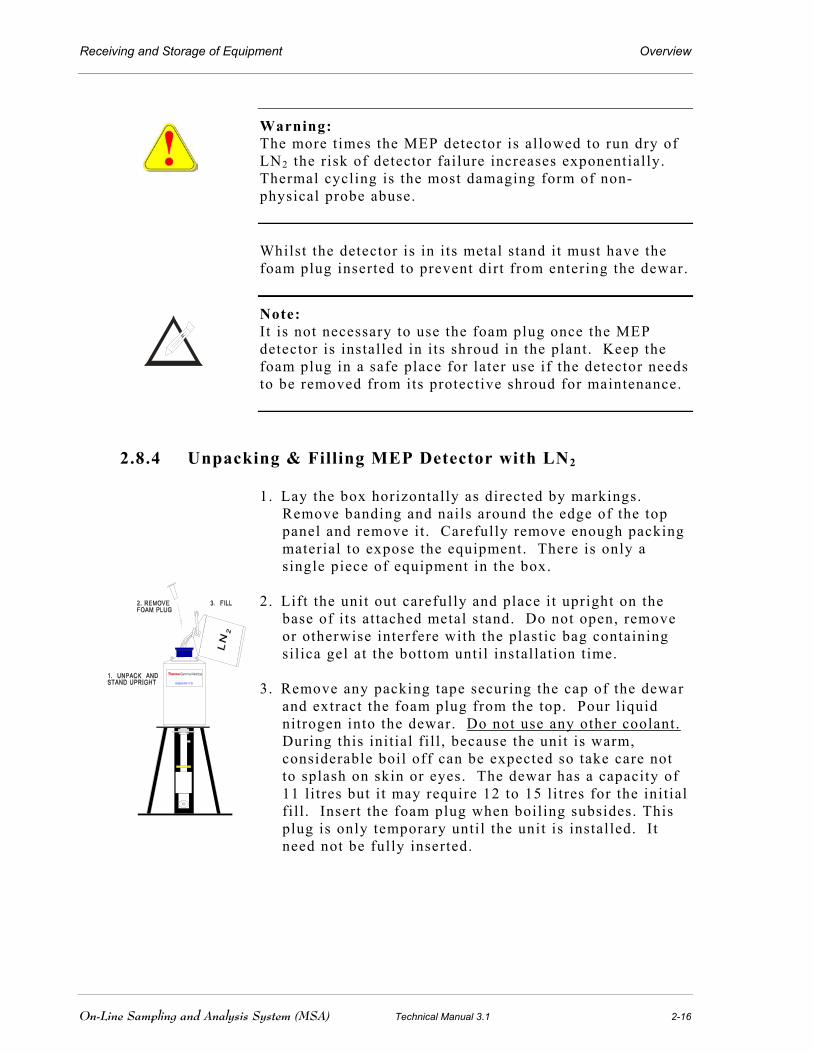


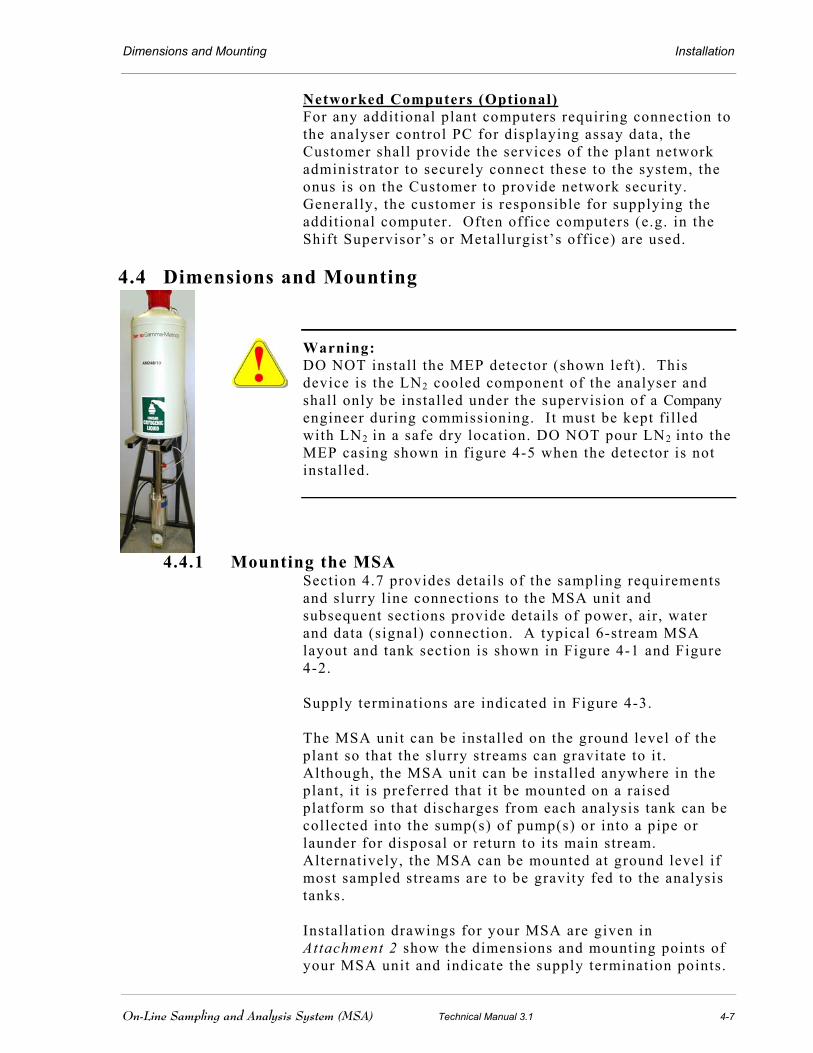
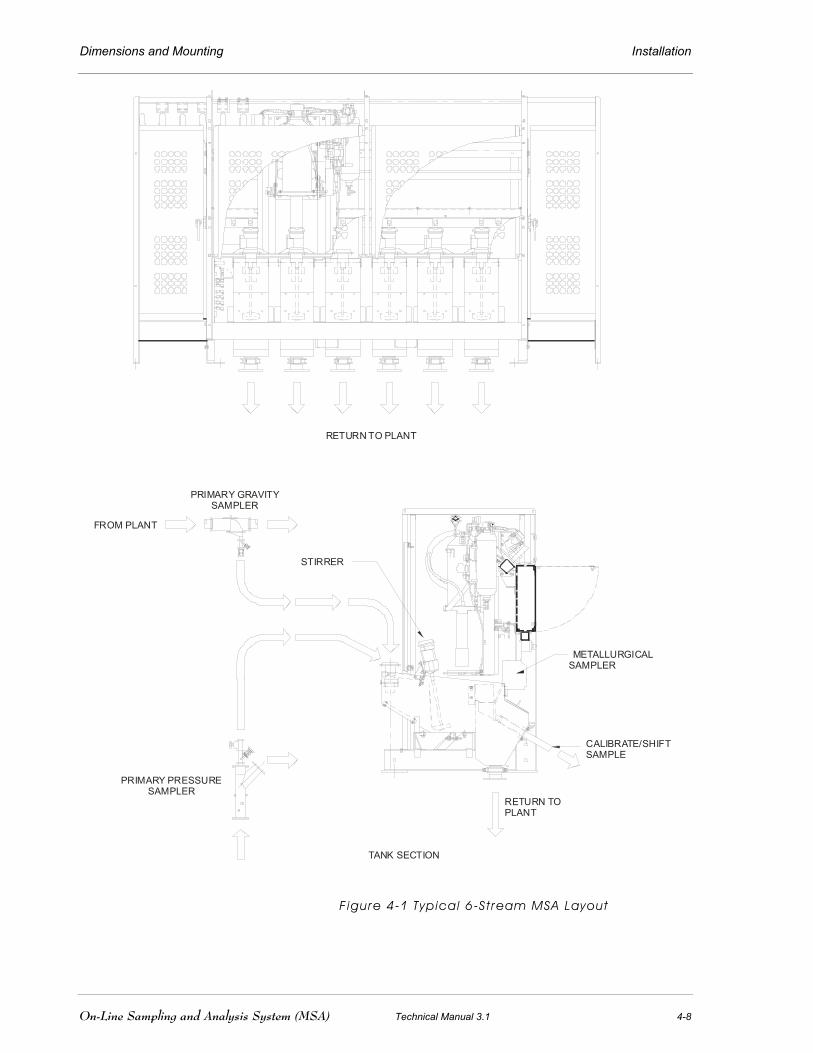


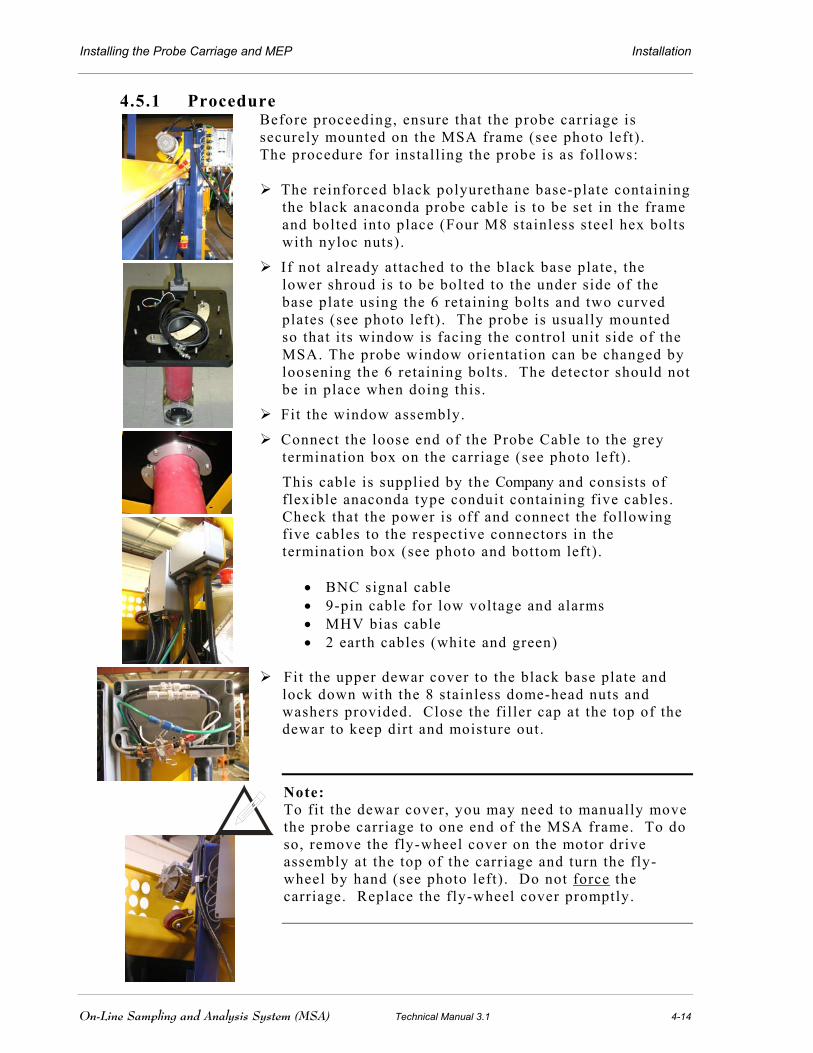


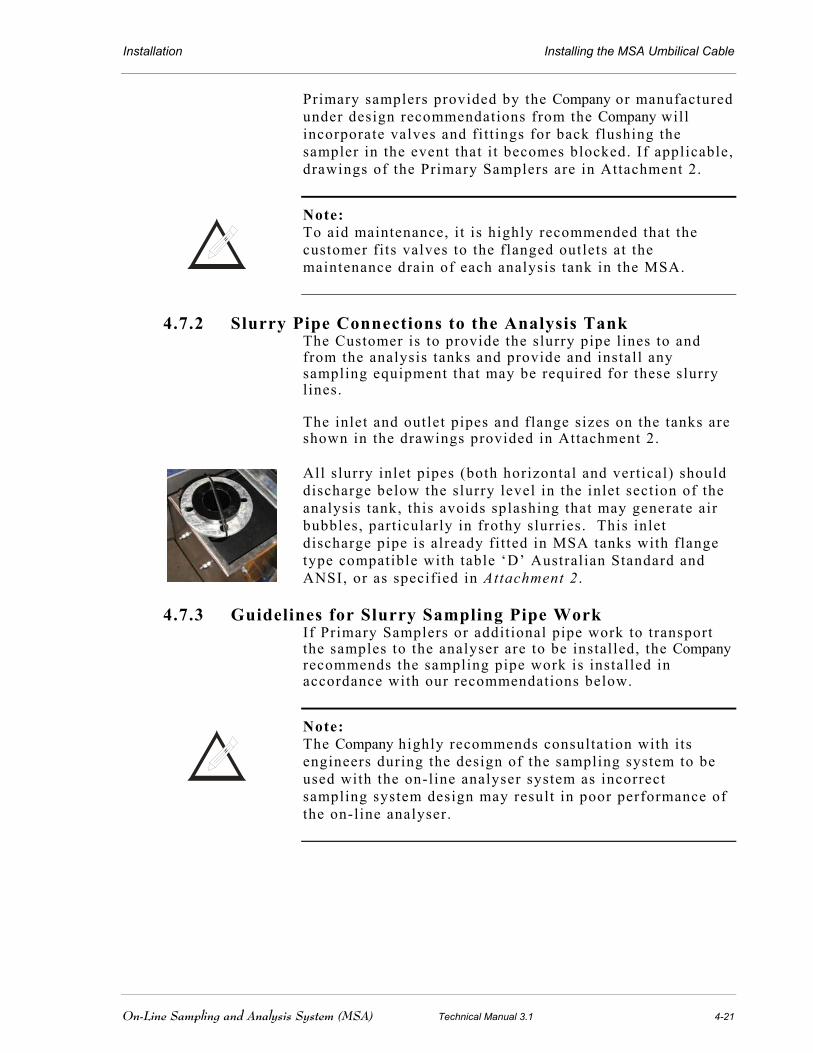


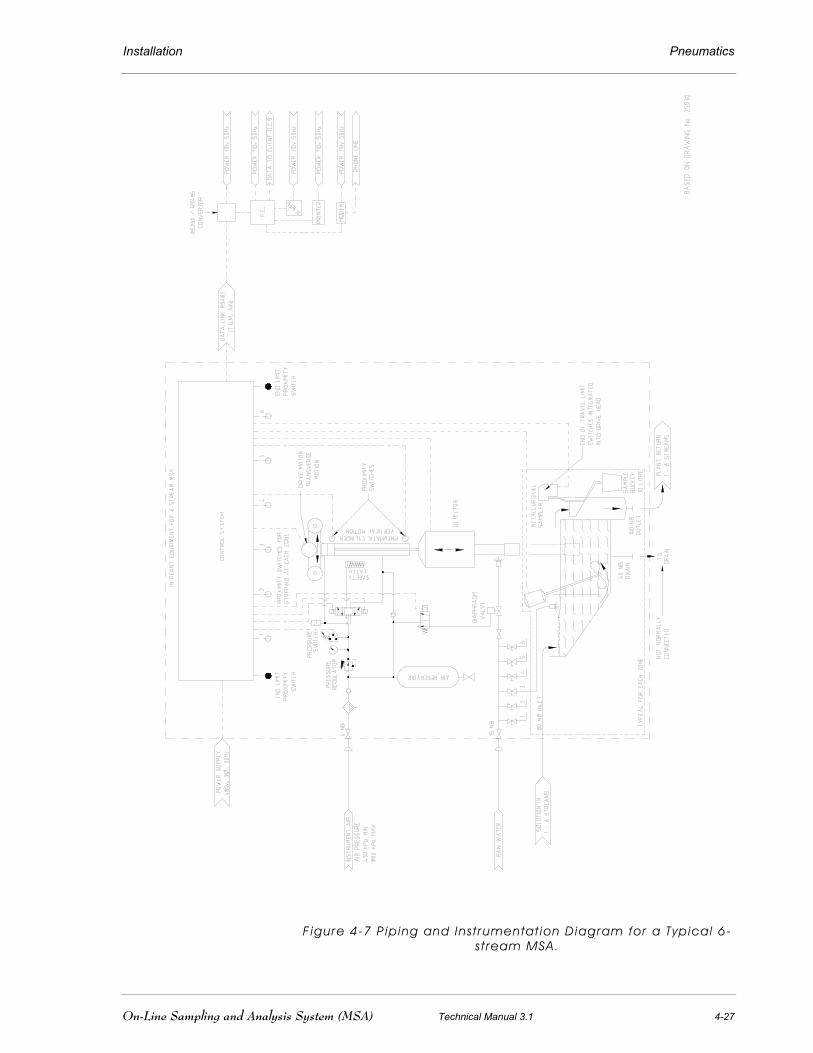


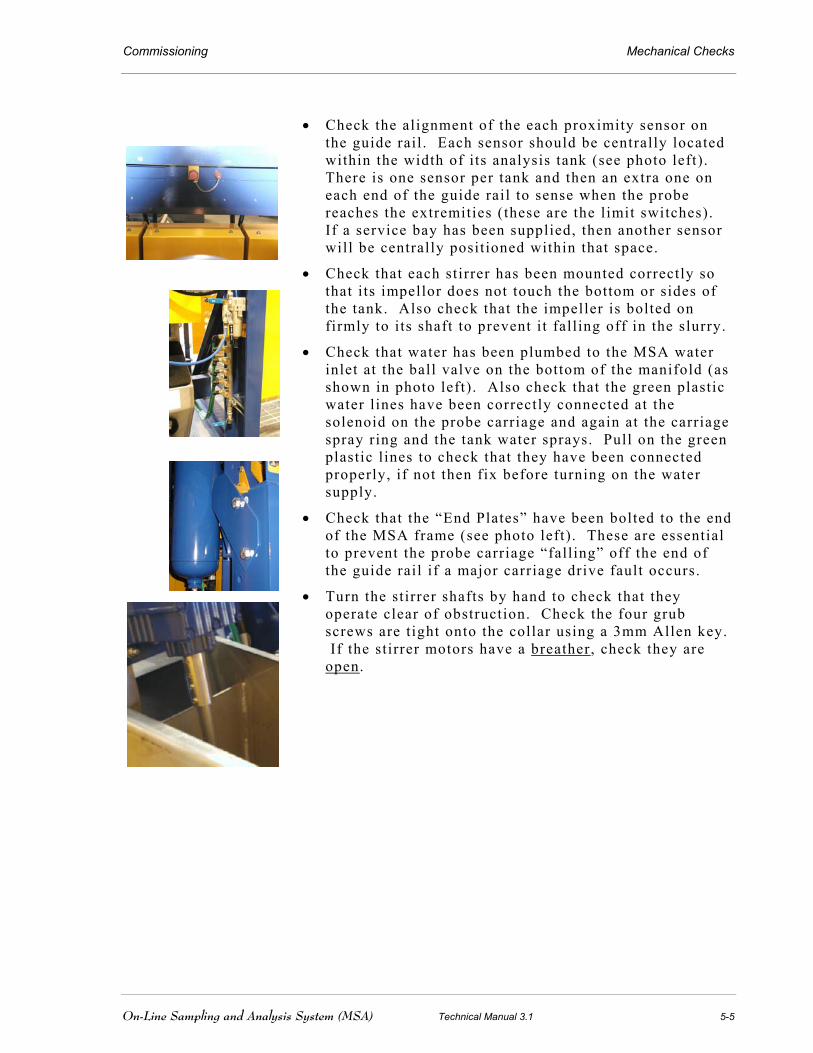

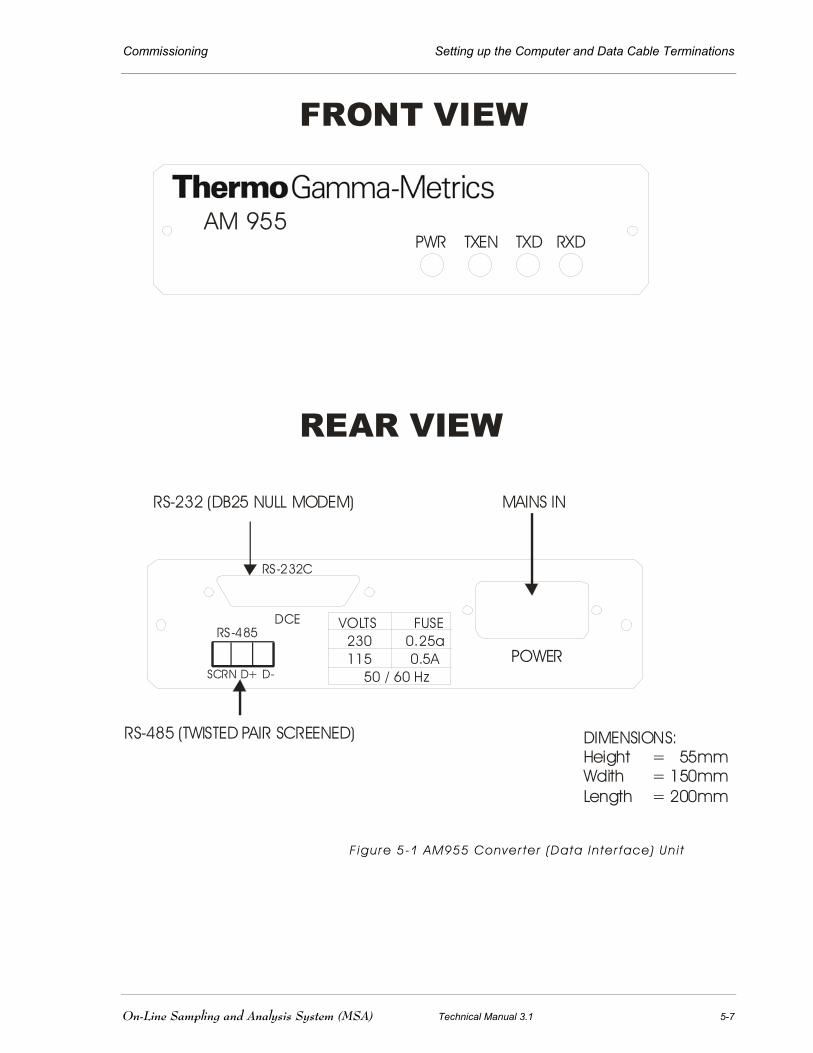


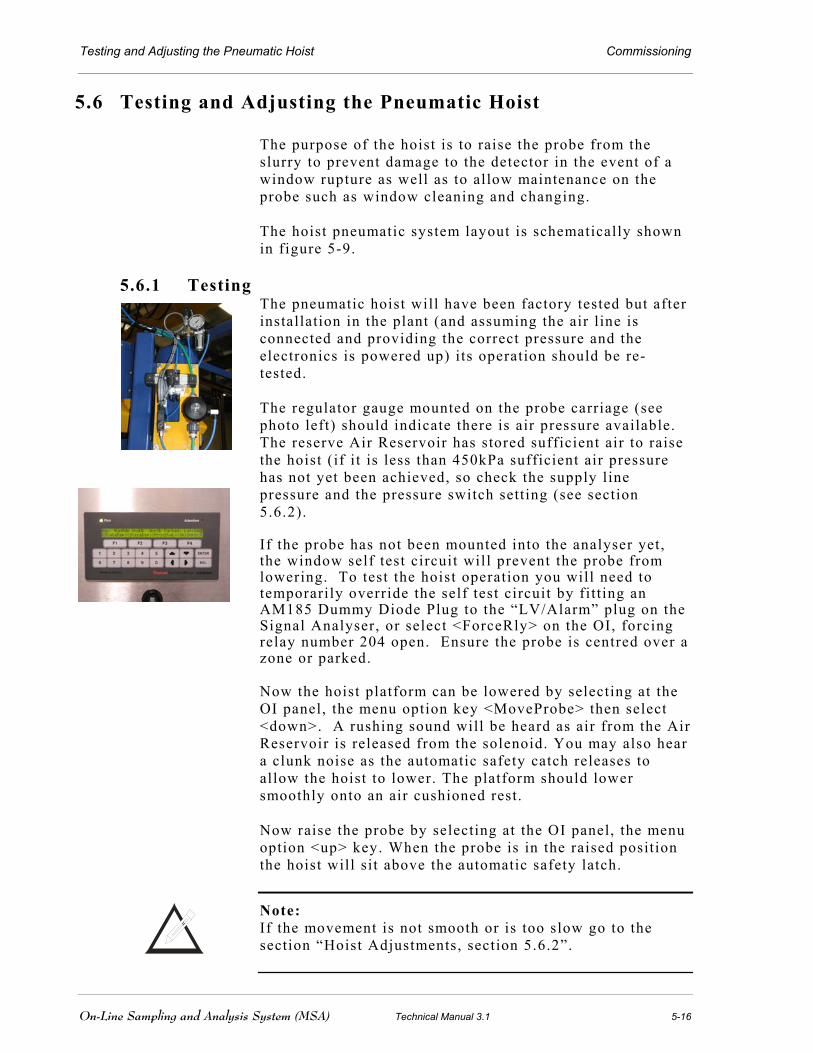


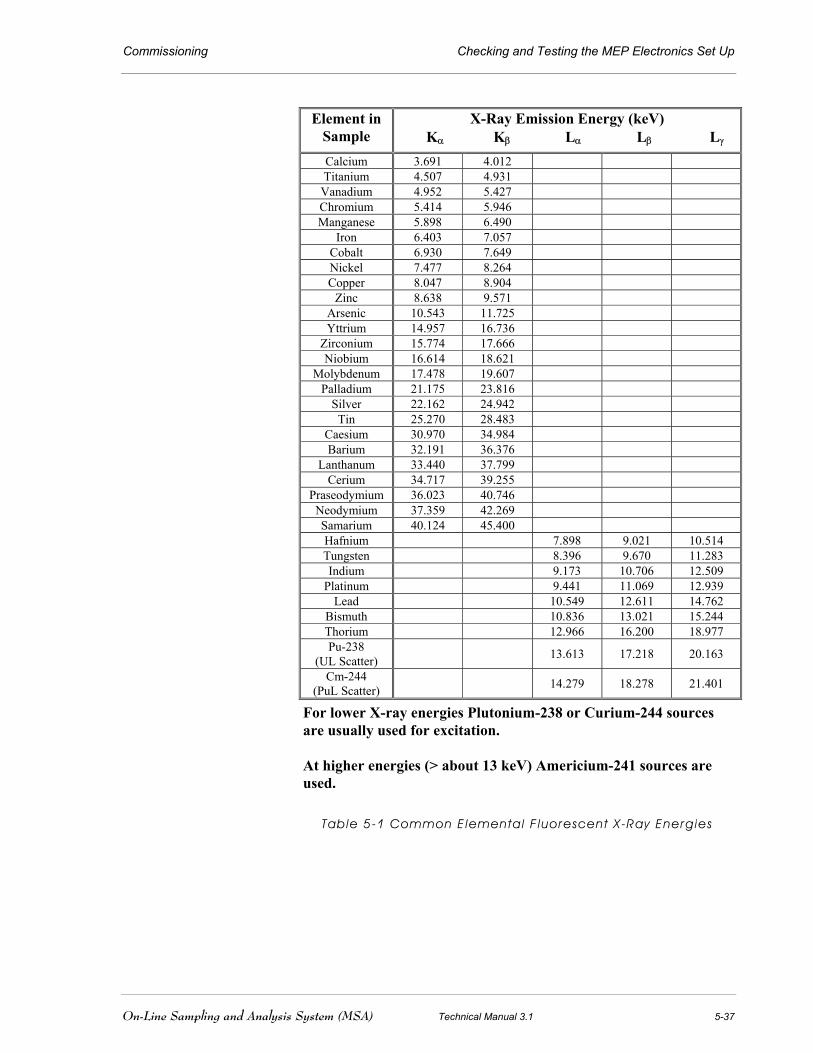


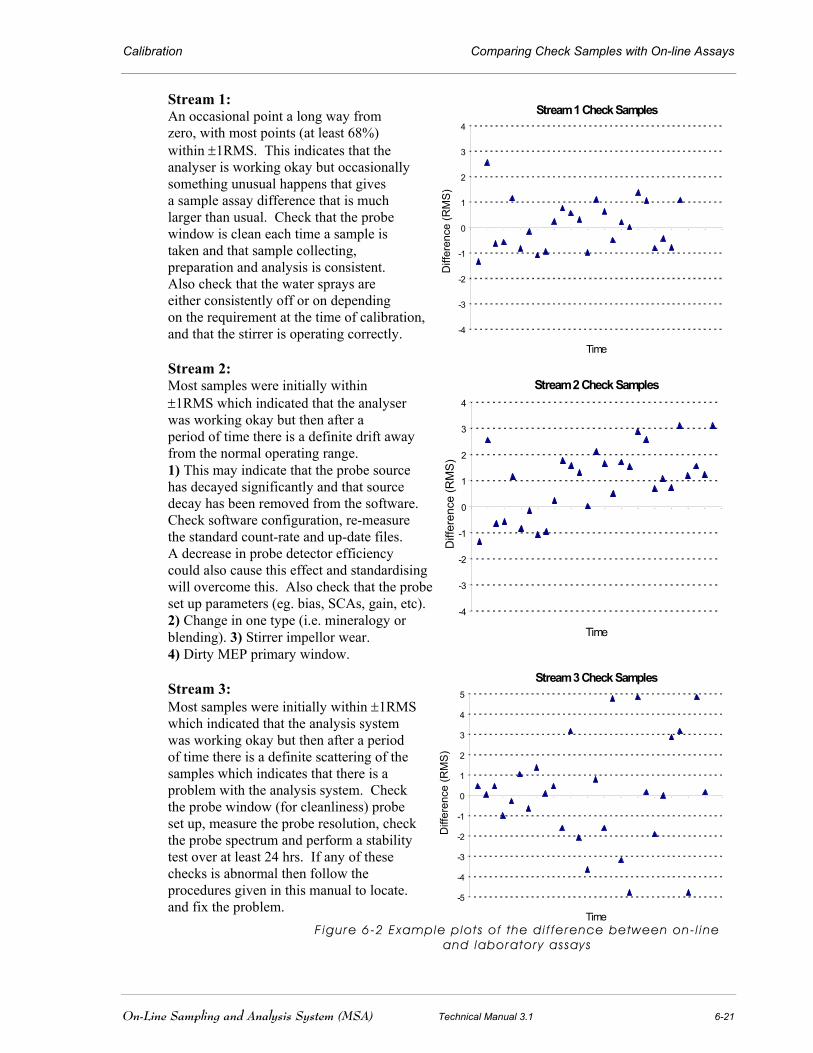


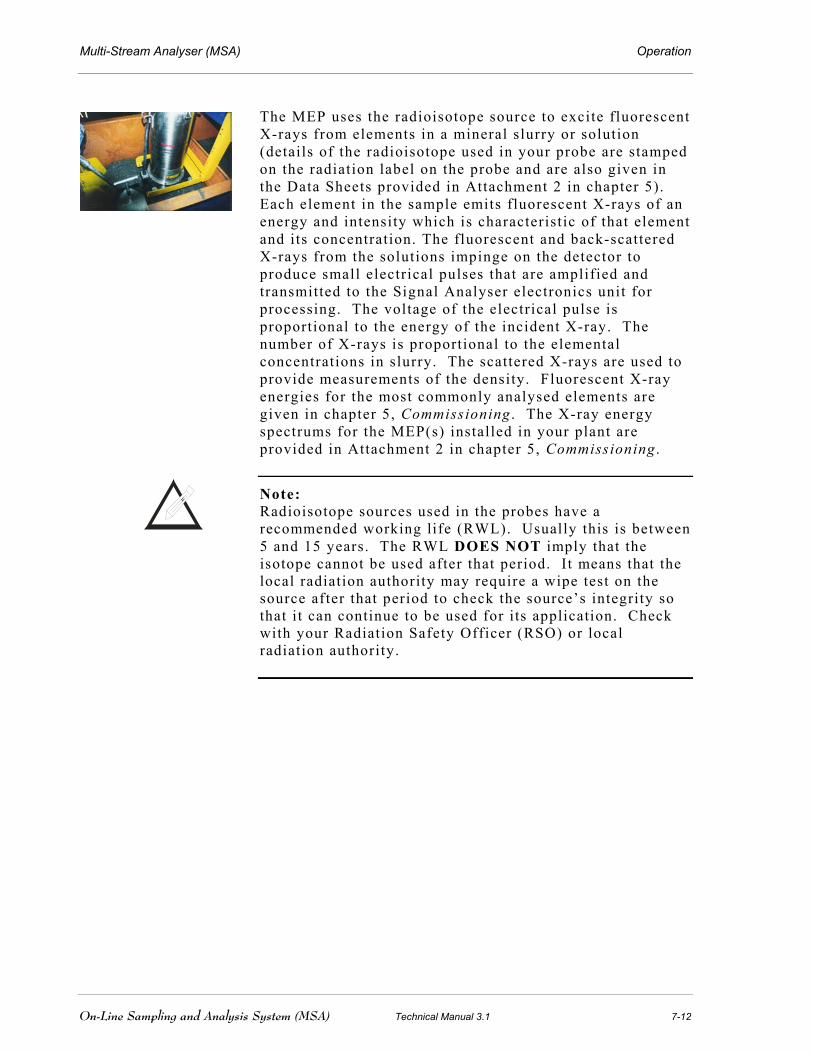


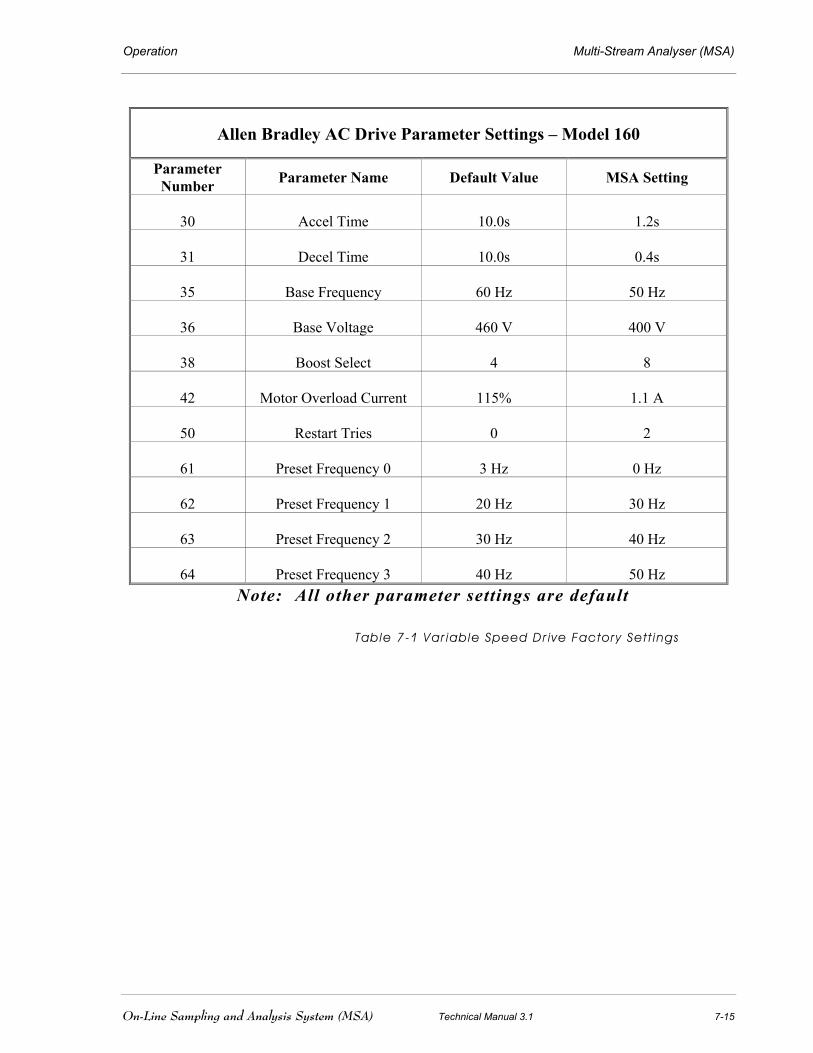


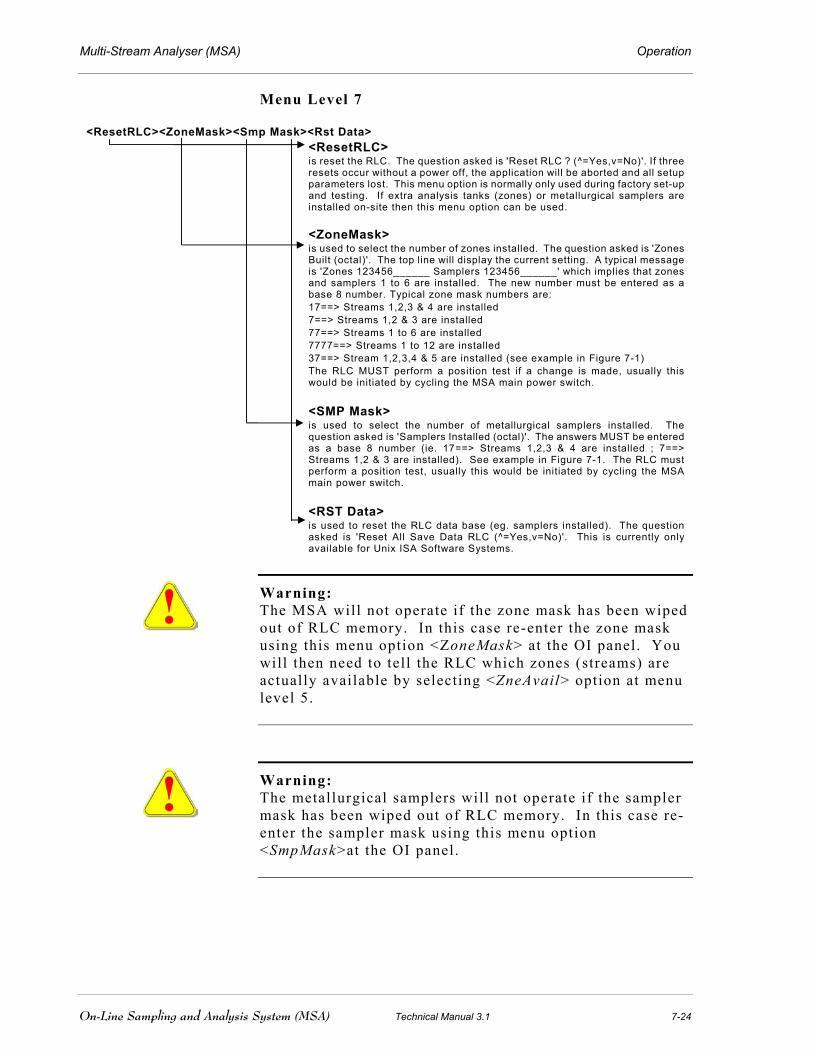


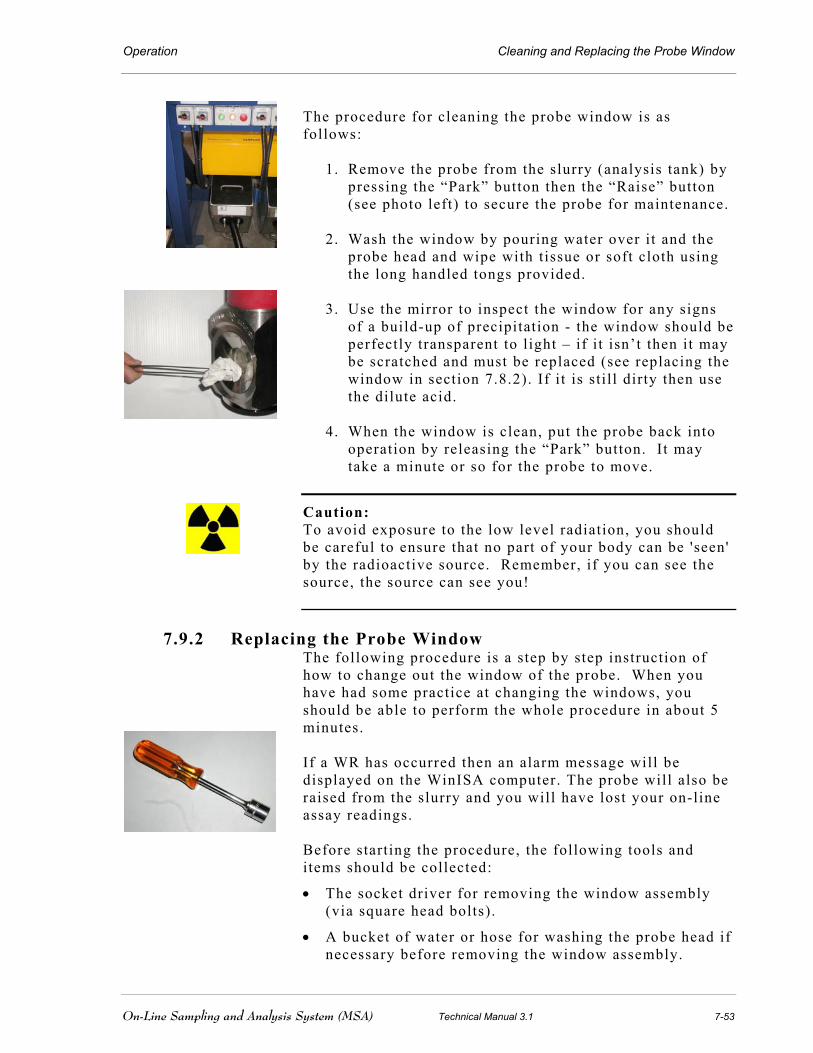


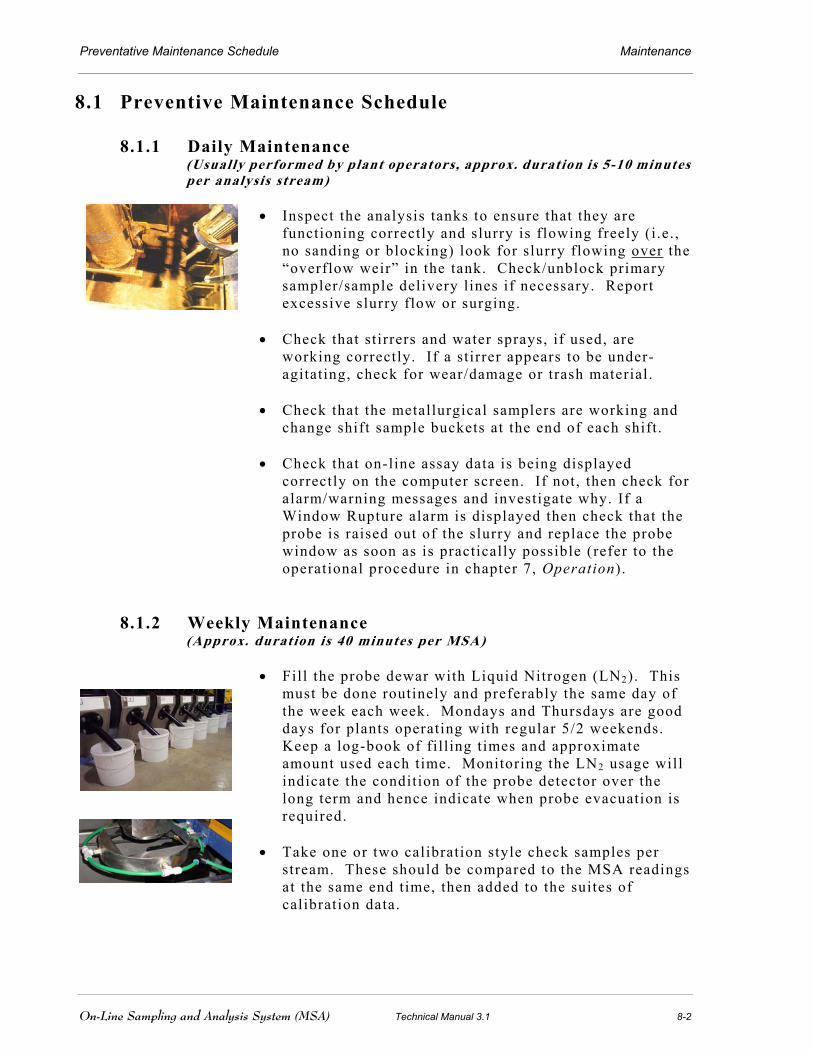


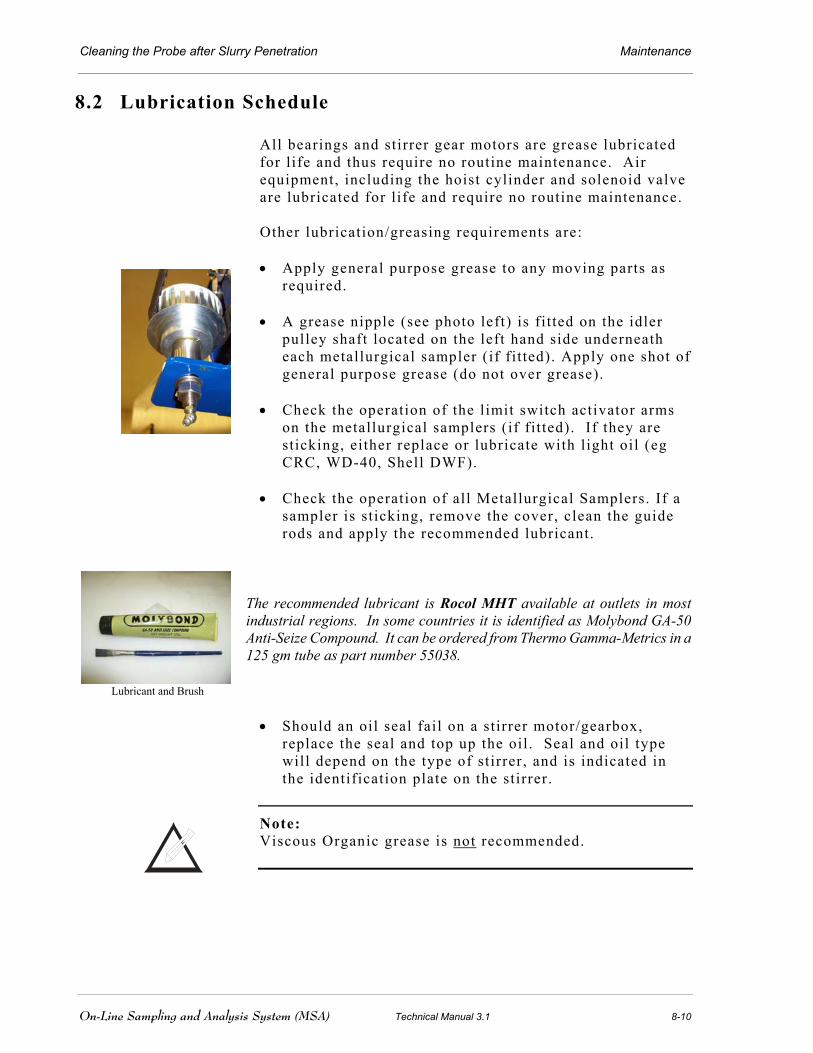


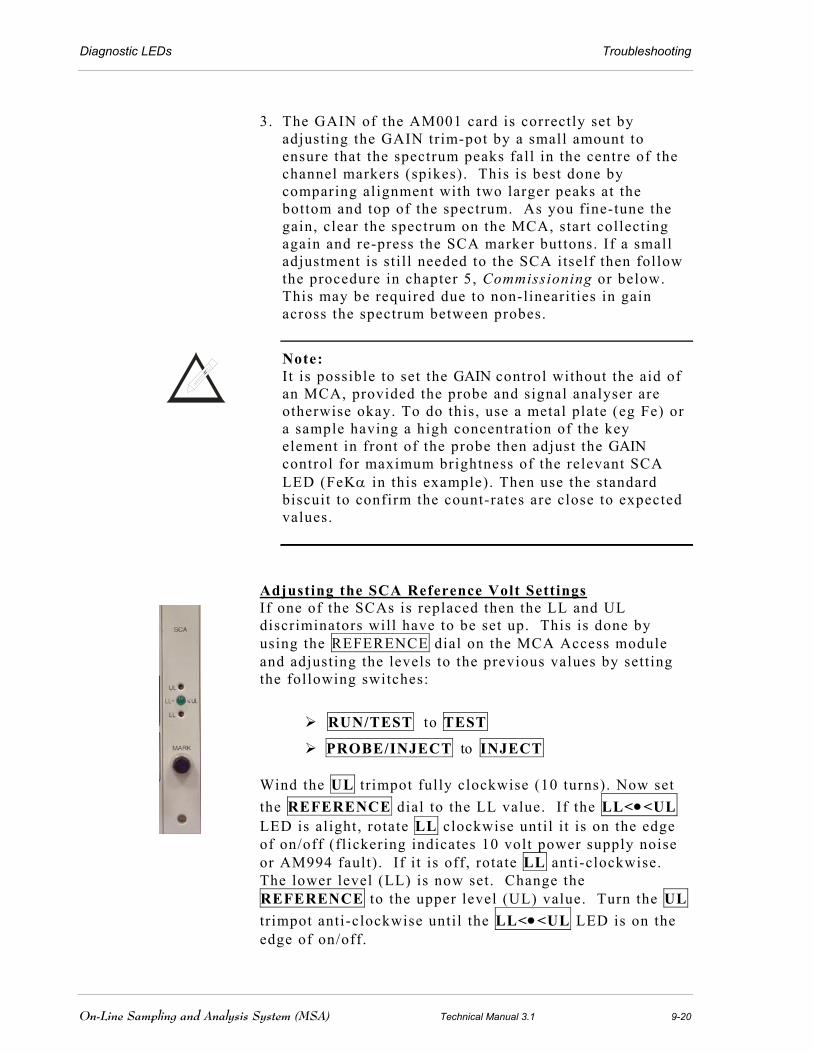


![Operating Manual ALTAIR 5 with WirelessUSB module ALTAIR ... · MSA in Europe [ & ] Northern Europe Southern Europe Eastern Europe Central Europe Netherlands MSA Nederland Kernweg](https://static.documents.pub/doc/80x56/6021ffa02077db43a028a451/operating-manual-altair-5-with-wirelessusb-module-altair-msa-in-europe-.jpg)

