Do mitigation plans come true? An analysis of the implementation of mitigation actions by European cities and the influence of governance factors. i MSc Programme in Urban Management and Development Rotterdam, The Netherlands November 2016 Thesis Do mitigation plans come true? An analysis of the implementation of mitigation actions by European cities and the influence of governance factors. Name: Jeniffer S. Heemann Supervisor: Dr. Stelios Grafakos Specialization: Urban Environment and Climate Change UMD 12
Transcript
Do mitigation plans come true? An analysis of the implementation of mitigation actions by European cities and the influence of governance factors.
i
MSc Programme in Urban Management and Development Rotterdam, The Netherlands November 2016 Thesis Do mitigation plans come true? An analysis of the implementation of mitigation actions by European cities and the influence of governance factors. Name: Jeniffer S. Heemann Supervisor: Dr. Stelios Grafakos Specialization: Urban Environment and Climate Change UMD 12
Do mitigation plans come true? An analysis of the implementation of mitigation actions by European cities and the influence of governance factors.
i
MASTER’S PROGRAMME IN URBAN MANAGEMENT AND DEVELOPMENT
(October 2015 – November 2016)
Do mitigation plans come true? An analysis of the implementation of mitigation actions by European cities and the influence of
governance factors.
Jeniffer S. Heemann Brazil
Supervisor: Dr. Stelios Grafakos
UMD 12 Report number:
Rotterdam, November 2016
Do mitigation plans come true? An analysis of the implementation of mitigation actions by European cities and the influence of governance factors.
ii
Summary
European cities voluntarily adopt targets and climate action plans with the objective of reducing GHG emissions related to urban activities. Although studies confirm the importance of cities’ action in mitigating climate change, it is still unknown the extent to which their mitigation plans become a reality, and the factors that influence their execution. This study is one of the first attempts to assess the status of implementation of urban-scale mitigations actions undertaken by 113 European cities through the Sustainable Energy Action Plan, and to analyse the governance factors that drive and constrain the implementation of such measures. The governance factors are related to the three variables: local framing, political actors and factors, and local government capacity, which institutionalises the governance aspects within local governments.
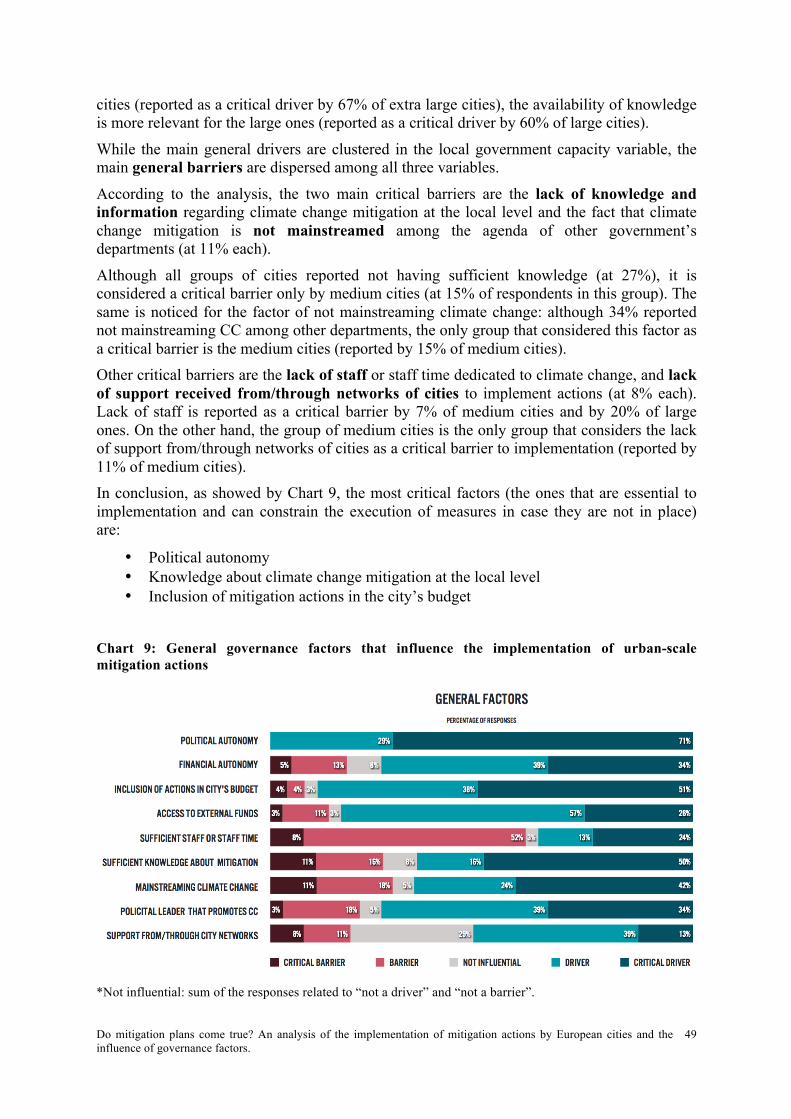
Based on a survey, SEAPs’ monitoring reports, and academic literature, the study shows that 58% of the mitigation actions are being implemented, while the other half is divided into completed and not started actions. Political authority and the inclusion of the mitigation policies in the city’s budget appear as the main drivers of implementation, while the main barriers are lack of staff and the fact that climate change mitigation is not mainstreamed among other government’s departments. The availability of knowledge and information regarding mitigation at the local level is both considered as a main driver and a main barrier. The study also analyses the critical factors of implementation in each of the nine sectors of the SEAP. In two-thirds of the sectors, it is essential that the mitigation actions are aligned with the cities’ priorities and with national policies, while the most common barriers to implementation across sectors are the resistance of the private sector and the lack of co-benefits offered by the measures adopted. Furthermore, the analysis highlights that the mitigation actions related to local electricity production have the highest potential to reduce emissions, but are the least implemented by European cities, mainly because of the interactions of the local governments with the national government and the private sector.
Do mitigation plans come true? An analysis of the implementation of mitigation actions by European cities and the influence of governance factors.
iii
Acknowledgements
Although the different support received from so many people was crucial for the conduction of this research, I would like to start by thanking Pedro Meneghetti. There are not enough words to express how grateful I am for all your encouragement, and how thankful I am for all your support. You have made this dream come true. I would also like to thank my family for encouraging my endeavours even when they mean physical distance, and for believing I am the best in whatever I do, no matter who are my competitors or what the evaluations might say. You always give me the confidence I need to take bigger steps. My deepest gratitude goes to Professor Dr. Stelios Grafakos, whose commitment to education, research, and climate change is not only admirable but inspiring. Your support, help, and advice were crucial for improving the quality of this work. Thank you for being so motivated with the topic. Thanks also to Professor Dr. João Marcelo Ketzer, for inspiring me to invest my energy and time in contributing to mitigate climate change, to Professor Dr. Niki Frantzeskaki, whose comments and inputs were valuable for this research, to Alexandra Tsatou and Els Keunen, for helping me with the questionnaire and contacts, and to all IHS staff, for the knowledge and the good times that I’ll never forget. A very special thanks to my colleagues and friends Riccardo Palazzolo, Aleksandra and Denis Tkachenko, Juliana Giraldo, Diego Giron, Julio Camelo, Alessandro Piperno, Aline Peres, Daniela Melo, Cristina Espinoza, Colin McAweeney, Henri De Cagny, and Bel Lima. Thanks for the important contribution with the translation of the questionnaire and e-mails, for helping me to contact cities, for hearing my doubts, for the coffees, questions, and comments. Finally, a big thank you to all my friends from IHS, for making the past year so enjoyable and fun, and for my special friends from Brazil, who are always present despite the distance.
Do mitigation plans come true? An analysis of the implementation of mitigation actions by European cities and the influence of governance factors.
iv
Abbreviations
IHS Institute for Housing and Urban Development
CAP Climate Action Plan
CC Climate Change
CoM Covenant of Mayors for Climate & Energy
COP Conference of the Parties (of UNFCCC)
ETP Energy Technologies Perspective
GHG Greenhouse gases
IEA International Energy Agency
OECD Organisation for Economic Co-operation and Development
SEAP Sustainable Energy Action Plan
UNEP United Nations Environment Programme
UNFCCC United Nations Framework Convention on Climate Change
2DS Two Degree Scenario
6DS Six Degree Scenario
Do mitigation plans come true? An analysis of the implementation of mitigation actions by European cities and the influence of governance factors.
v
Table of Contents Summary ................................................................................................................................... ii Keywords .................................................................................................................................. ii Acknowledgements ................................................................................................................ iii Abbreviations .......................................................................................................................... iv List of Tables .......................................................................................................................... vii List of Figures ......................................................................................................................... vii List of Charts ........................................................................................................................ viii Chapter 1: Introduction .......................................................................................................... 1
1.1 Background .............................................................................................................................. 1 1.2 Problem Statement ................................................................................................................... 2 1.3 Research Objectives ................................................................................................................. 3 1.4 Provisional Research Question(s) ............................................................................................ 4 1.5 Significance of the Study ......................................................................................................... 4
Chapter 2: Literature Review ................................................................................................. 6 2.1 Urban-scale climate change mitigation .................................................................................... 6 2.1.1 Abatement potential of cities: a global projection ................................................................ 6 2.1.2 Abatement potential of urban-scale actions and sectors: a local projection .......................... 9 2.2 Implementation of urban-scale mitigation policies and actions by cities .............................. 13 2.2.1 Climate action in cities: from planning to implementation ................................................. 13 2.2.2 Implementation of urban-scale mitigation actions by cities ................................................ 15 2.3 Governance factors that influence implementation of mitigation actions by cities ............... 16 2.3.1 Governance: explaining the concept ................................................................................... 16 2.3.2 Critical governance factors for implementation of mitigation actions ................................ 17 2.3.2.1 Local Framing .................................................................................................................. 19 2.3.2.2 Local government capacity .............................................................................................. 20 2.3.2.3 Political actors and factors ............................................................................................... 22 2.3.2.4 Sectoral factors ................................................................................................................. 23 2.4 Conceptual framework ........................................................................................................... 27
Chapter 3: Research Design and Methods .......................................................................... 28 3.1 Revised research questions ..................................................................................................... 28 3.2 Operationalization: variables and indicators .......................................................................... 28 3.3 Research strategy .................................................................................................................... 32 3.4 Data collection methods ......................................................................................................... 32 3.4.1 Sample size and selection .................................................................................................... 35 3.5 Reliability and validity ........................................................................................................... 36 3.6 Data analysis methods ............................................................................................................ 37
Chapter 4: Analysis ................................................................................................................ 38 4.1 Sample of European cities ...................................................................................................... 39 4.1.1 Location and size of selected cities ..................................................................................... 39 4.1.2 Targets to reduce GHG emissions, and adhesion to CoM .................................................. 40 4.1.3 Questionnaire respondents by jurisdiction .......................................................................... 40 4.2 Status of implementation of urban-scale mitigation actions of SEAPs ................................. 42 4.2.1 Frequency of urban-scale mitigation actions by sector ....................................................... 42 4.2.2 Status of implementation of urban-scale mitigation actions developed by 113 European cities ............................................................................................................................................. 43 4.2.3 Medium European cities: status of implementation of urban-scale mitigation actions ...... 45 4.2.4 Large European cities: status of implementation of urban-scale mitigation actions ........... 45
Do mitigation plans come true? An analysis of the implementation of mitigation actions by European cities and the influence of governance factors.
vi
4.2.5 Extra large European cities: status of implementation of urban-scale mitigation actions .. 46 4.3 Influence of governance factors on the implementation of urban-scale mitigation policies and actions ........................................................................................................................................... 47 4.3.1 Rating of drivers and barriers to implementation ................................................................ 48 4.3.2 Factors that influence the implementation of all types of urban-scale mitigation actions .. 48 4.3.3 Governance factors that influence the implementation of urban-scale mitigation actions in each sector .................................................................................................................................... 51 4.3.3.1 Overall findings concerning sectoral factors .................................................................... 51 4.3.3.2 Influence of governance factors on the implementation of urban-scale mitigation actions related to Municipal Buildings ..................................................................................................... 57 4.3.3.3 Influence of governance factors on the implementation of urban-scale mitigation actions related to Tertiary Buildings ........................................................................................................ 58 4.3.3.4 Influence of governance factors on the implementation of urban-scale mitigation actions related to Residential Buildings ................................................................................................... 59 4.3.3.5 Influence of governance factors on the implementation of urban-scale mitigation actions related to Public Lighting ............................................................................................................. 61 4.3.3.6 Influence of governance factors on the implementation of urban-scale mitigation actions related to Industry ......................................................................................................................... 62 4.3.3.7 Influence of governance factors on the implementation of urban-scale mitigation actions related to Transport ...................................................................................................................... 63 4.3.3.8 Influence of governance factors on the implementation of urban-scale mitigation actions related to Local Electricity Production ......................................................................................... 64 4.3.3.9 Influence of governance factors on the implementation of urban-scale mitigation actions related to Local Heat/Cold Production ......................................................................................... 66 4.3.3.10 Influence of governance factors on the implementation of urban-scale mitigation actions related to Other sectors ................................................................................................................. 67 4.4 Categorisation of sectors by implementation, critical governance factors, and abatement potential (summary of findings) ................................................................................................... 69
Chapter 5: Conclusions ......................................................................................................... 73 5.1 Status of implementation of urban-scale mitigation actions present in Sustainable Energy Action Plans of European cities ................................................................................................... 73 5.2 Governance factors that drive or constrain the implementation of urban-scale mitigation actions ........................................................................................................................................... 73 5.2.1 Governance factors that influence the implementation of urban-scale mitigation actions in general .......................................................................................................................................... 74 5.2.2 Governance factors that influence the implementation of urban-scale mitigation actions of different sectors ............................................................................................................................ 75 5.3 Main findings concerning sectors implementation rate, critical drivers and critical barriers, and abatement potential ................................................................................................................ 76 5.4 Discussion and further research ............................................................................................. 77
Bibliography ........................................................................................................................... 80 Annex 1: List of cities that participated in the study .......................................................... 85
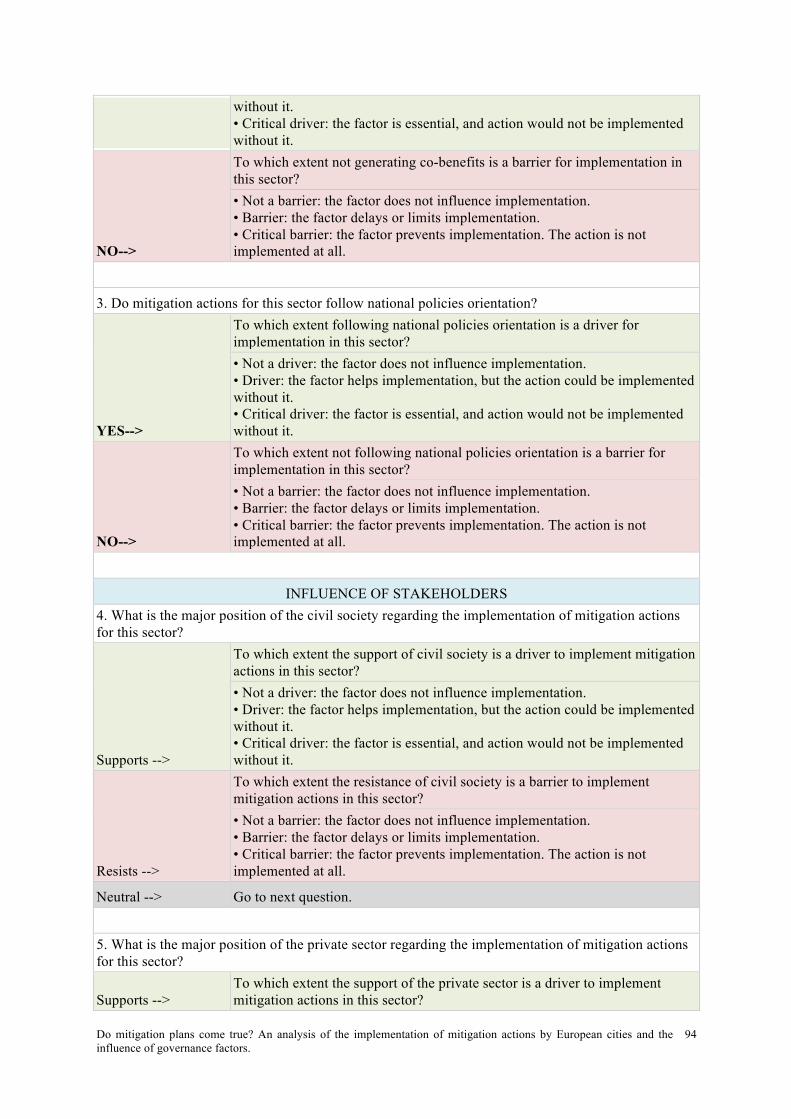
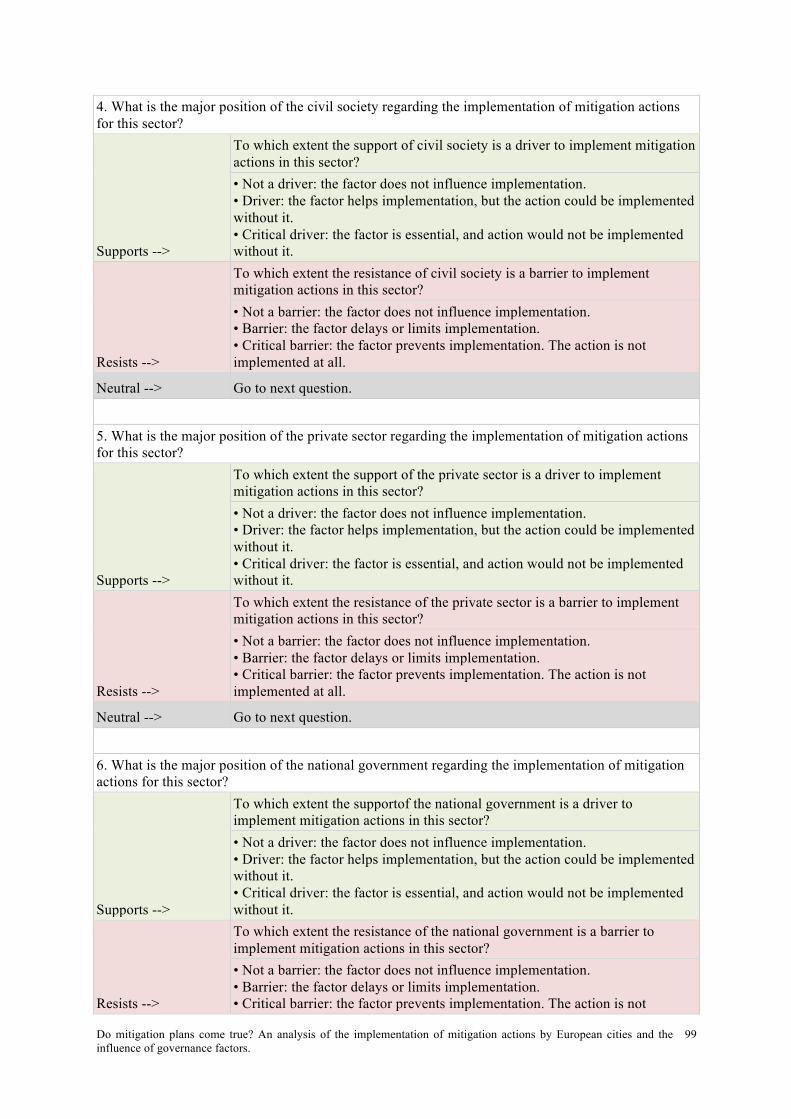
Annex 2: Questionnaire structure ........................................................................................ 88 Annex 3: Position of actors in each sector ......................................................................... 112
Annex 4: Number of questionnaire respondents, per sector and position of actor ....... 115 Annex 5: IHS copyright form ................................................... Error! Bookmark not defined.
Do mitigation plans come true? An analysis of the implementation of mitigation actions by European cities and the influence of governance factors.
vii
List of Tables Table 1: Scale for rating the abatement potential of urban-scale technologies and practices .......................................... 11!Table 2: Scale for rating degree of influence of local jurisdictions ..................................................................................... 11!Table 3: Typology of technologies and practices for GHG abatement at the urban scale ................................................ 12!Table 4: Examples of academic findings that relate governance factors to specific sectors ............................................. 23!Table 5: Dependent variables and indicators ........................................................................................................................ 29!Table 6: Independent variables and indicators ..................................................................................................................... 30!Table 7: 10 largest European cities in the sample ................................................................................................................. 39
Table 8: 10 smallest European cities in the sample .............................................................................................................. 39!Table 9: Description of the sample ......................................................................................................................................... 40!Table 10: Status of implementation of urban-scale mitigation actions per sector ............................................................. 44!Table 11: Raking of sectors based on level of implementation ............................................................................................ 69!Table 12: Scale for rating the abatement potential of urban-scale technologies and practices ........................................ 70!Table 13: Categorisation of sectors based on implementation of urban-scale mitigation actions, critical governance
factors that influence implementation, and abatement potential for 2020 ................................................................ 71!
List of Figures Figure 1: GHG emissions and potential emissions avoided in the urban action scenario .................................................. 7!Figure 2: The potential impact of urban actions on global climate mitigation ambition .................................................... 7!Figure 3: Global CO2 reductions by technology area, 2013-50 ............................................................................................. 8!Figure 4: Climate action planning process ............................................................................................................................ 14!Figure 5: Conceptual framework of critical factors developed by Ryan (2015) ................................................................ 19!Figure 6: Conceptual framework ........................................................................................................................................... 27!Figure 7: Example of items 1 and 2 of the questionnaire ..................................................................................................... 34!Figure 8: Map of the sample - 113 European cities selected for the study ......................................................................... 36!
Do mitigation plans come true? An analysis of the implementation of mitigation actions by European cities and the influence of governance factors.
viii
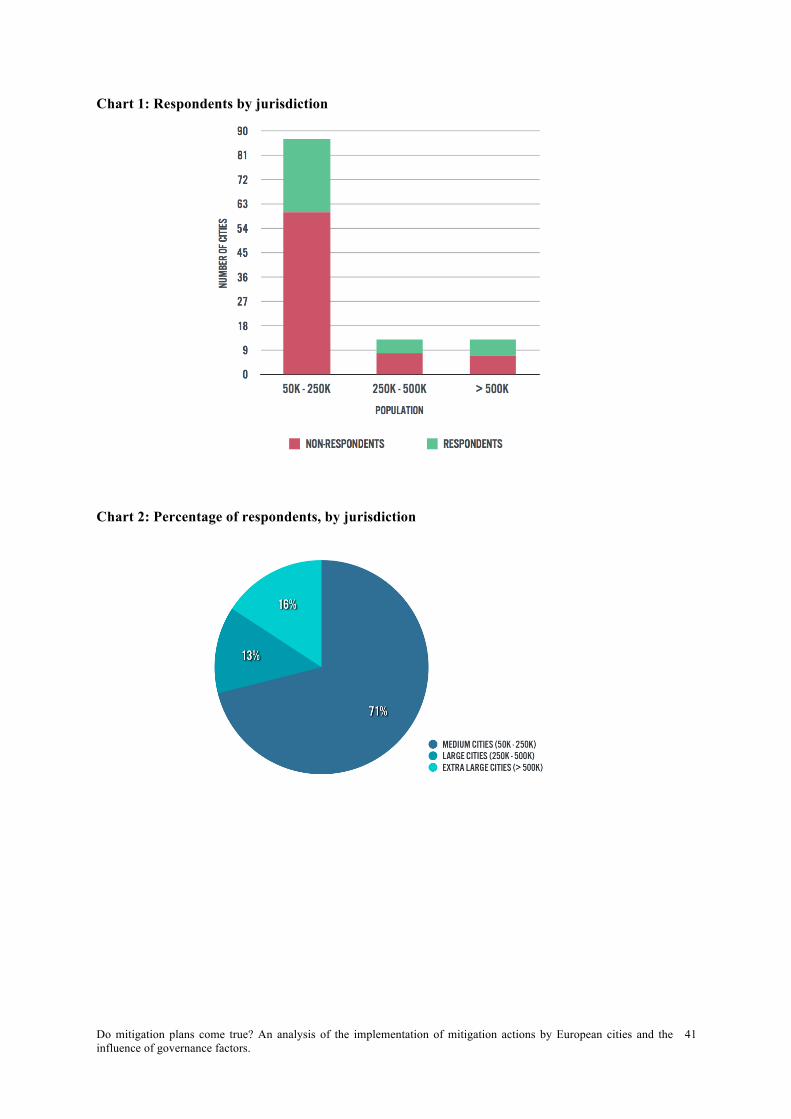
List of Charts Chart 1: Respondents by jurisdiction .................................................................................................................................... 41!Chart 2: Percentage of respondents, by jurisdiction ............................................................................................................ 41!Chart 3: Frequency of mitigation actions, per sector ........................................................................................................... 42!Chart 4: Sectors considered in the section “Others” of the SEAPs .................................................................................... 43!Chart 5: Status of implementation of urban-scale mitigation actions ................................................................................ 44!Chart 6: Status of implementation of urban-scale mitigation actions of 87 medium European cities (50k – 250k
inhabitants) ...................................................................................................................................................................... 45!Chart 7: Status of implementation of urban-scale mitigation actions of 13 large European cities (250k – 500k
inhabitants) ...................................................................................................................................................................... 46!Chart 8: Status of implementation of urban-scale mitigation actions of 13 extra large European cities ........................ 47!Chart 9: General governance factors that influence the implementation of urban-scale mitigation actions ................. 49!Chart 10: Overall position of actors concerning the implementation of mitigation actions ............................................. 52!Chart 11: Sectoral governance factors that influence the implementation of urban-scale mitigation actions ............... 53!Chart 12: Governance factors that act as drivers of implementation of mitigation actions, per sector .......................... 54!Chart 13: Governance factors that act as barriers of implementation of mitigation actions, per sector ........................ 56!Chart 14: Governance factors that influence the implementation of mitigation actions related to Municipal Buildings
........................................................................................................................................................................................... 58!Chart 15: Governance factors that influence the implementation of mitigation actions related to Tertiary Buildings 59!Chart 16: Governance factors that influence the implementation of mitigation actions related to Residential Buildings
........................................................................................................................................................................................... 60!Chart 17: Governance factors that influence the implementation of mitigation actions related to Public Lighting ..... 62!Chart 18: Governance factors that influence the implementation of mitigation actions related to Industry ................. 63!Chart 19: Governance factors that influence the implementation of mitigation actions related to Transport .............. 64!Chart 20: Governance factors that influence the implementation of mitigation actions related to Local Electricity
Production ........................................................................................................................................................................ 66!Chart 21: Governance factors that influence the implementation of mitigation actions related to Local Heat/Cold
Production ........................................................................................................................................................................ 67!Chart 22: Governance factors that influence the implementation of mitigation actions related to Other sectors ......... 68!
Do mitigation plans come true? An analysis of the implementation of mitigation actions by European cities and the influence of governance factors.
1
Chapter 1: Introduction
1.1 Background
The Paris Agreement signed by all UNFCCC Parties in 2015 is considered to be a historic commitment to mitigate climate change and adapt to its effects. While it can be viewed with scepticism because of the lack of results of previous commitments adopted by nations (see, for example, James Hansen's opinion on Milman, O., 2015); it is also considered to be a “milestone for implementation” since it was the first time that non-state actors participated in the decision process (OECD and IEA, 2016). It is estimated that 400 mayors were present at COP21, voluntarily committing to reduce emissions (Hsu, Cheng, et al., 2016). In a context of distrust of nations states’ performance and deliberately commitment of local governments to address global warming, political and academic discussions have been approaching the role of cities regarding climate change. While initially the discussion was centred on mitigation, which addresses the causes of climate change and aims to reduce greenhouse gases (GHG) emissions, currently the focus is also on adaptation measures able to deal with the consequences of global warming by reducing the exposure to hazards. Both approaches are necessary, and it is recognised the importance of mitigating and adapting simultaneously (OECD, 2010, pg. 29). Moreover, it is acknowledged that the extent to which mitigation measures are executed nowadays will limit the risk of threats related to global warming in the future (OECD, 2010, pg. 29), hence influencing the necessity of adaptation measures in the medium and long term. Unfortunately, a new report from UNEP (2016) shows that the current national and international policies and pledges to reduce emissions are not sufficient to limit the global average temperature increase by 2°C above pre-industrial levels by 2020, which would avoid an increase in extreme climate events. Therefore, academic studies have analysed both the extent that urban activities are responsible for greenhouse gases (GHG) emissions and their potential to reduce emissions. In relation to cities’ effect on climate change, over the last years it has been acknowledged that the built environment and the economic activities that take place in urban areas contribute to global GHG emissions. According to IPCC (2014), between 71% and 76% of CO2 emissions related to energy consumption accounts to cities, and this contribution is expected to increase because of the growth of the population. Lee and Erickson (2014, pg. 2) conclude that by 2030, urban areas could account for 8 billion tonnes CO2 from private vehicle use, heating and cooling for buildings, only. Furthermore, the total emissions produced by current trends of development and consumption are expected to exceed the “safe carbon budget” of 2°C by 2020, and it is expected that one-third of these emissions will come from urban areas (C40 and Arup, 2015). On the other hand, it has also been recognised the abatement potential of urban areas. According to Erickson and Tempest (2014), cities have the potential of reducing global GHG emissions by 6% (3.7 Gt CO2e) of business-as-usual in 2030, and by 11% (8.0 Gt CO2e) in 2050. According to OECD and IEA (2016), even though cities highly demand energy for consumption, they also offer great potential in the transition to a more sustainable energy system. Local governments have influence and power over policies with great mitigation potential, such as public transportation and urban planning, which could contribute to 15% of the GHG reduction that is globally required in order to keep global warming no more than
Do mitigation plans come true? An analysis of the implementation of mitigation actions by European cities and the influence of governance factors.
2
2°C above pre-industrial levels (Erickson and Tempest, 2014). Furthermore, local governments are characterised by less complex structures when compared to national governments and international bodies, which can facilitate the implementation of climate actions (Reckien, Flacke, et al., 2014a). In this context, cities have the opportunity to achieve more dramatic emissions reduction than countries did so far. Several cities are aware of their potential to mitigate climate change and are taking action. It is estimated that more than 2,000 cities all over the world established targets to reduce emissions (Sippel, 2011). They are developing climate action plans and strategies in order to mitigate GHG emissions (Kennedy, Steinberger, et al., 2009) and to adapt to climate change. Since 2011, cities that are members of the C40 network, for example, have taken more than ten thousand climate actions, such as activities, policies and programs for mitigation and adaptation; and city mayors are willing to expand these measures by 75% (C40 and Arup, 2015). Networks of cities, such as C40, ICLEI, and Covenant of Mayors, encourage much of cities’ climate plans and actions, once they provide information and guidelines, and foster the sharing of best practices among local governments.
1.2 Problem Statement Current international policies and pledges to mitigate climate change will reduce emissions, but only by a third of what is required to avoid catastrophic events. UNEP (2016) estimates that global temperature will increase to 3.4°C above pre-industrial levels, while the Paris Agreement aims to limit it to 1.5°C.
In this context, cities play a relevant role. Nowadays approximately 70% of global CO2 emissions related to energy consumption accounts to cities (including indirect emissions from power and heat generation) and when we reach the year 2050 this figure is expected to increase by 50% (OECD and IEA, 2016, pg. 9). This increase is explained by the fact that by 2050 cities will account for two-thirds of global population and 85% of global GDP, while primary energy demand in urban areas is estimated to be 70% higher than 2013 levels. More than ever, current urban activities and policies undertaken by local governments have a global impact, and could significantly contribute to the transition to a more sustainable energy generation and consumption. In Europe one of the main international initiatives focused on helping cities and regions to reduce GHG emissions is the Covenant of Mayors for Climate & Energy (CoM), launched in 2008 by the European Commission. Its creation followed the European Union commitment to reduce CO2 emissions to 20% below 1990 levels by 2020 (European Commission, 2011) and has the objective of supporting local and regional authorities in the development and implementation of sustainable energy policies to meet or exceed EU’s target. Currently, Covenant of Mayors has almost seven thousand signatories, reaching a total population of more than 212 million inhabitants. Throughout Covenant of Mayors, European cities voluntarily commit to developing Sustainable Energy Action Plans (SEAPs) and to monitoring the implementation of their mitigation actions. Although EU countries provide information on their progress every two years, and the achievements are published in a report (European Commission, 2015), there is lack of information regarding the extent to which the SEAPs developed by European cities have been implemented in overall.
Do mitigation plans come true? An analysis of the implementation of mitigation actions by European cities and the influence of governance factors.
3
A study conducted among 200 medium and large European cities shows that Covenant of Mayors is “particularly successful in helping cities to prepare climate plans”, and assumes that these networks of cities contribute significantly to enhance knowledge and awareness about climate change (Reckien, Flacke, et al., 2015, pg. 11). However, development of climate actions plans does not provide evidence of execution of such measures or success in achieving climate goals (Reckien, Flacke, et al., 2014b, Millard-Ball, 2012, as cited in, Reckien, Flacke, et al., 2015), and there is lack of assessments regarding the actual implementation of mitigation measures by European cities. Nevertheless, academic research shows that European cities still need to put more effort in reducing emissions to meet mitigation targets (Dodman, 2009).
Even though cities are considered to be relevant actors to address climate change, because they have less complex structures to undertake actions in comparison to national governments (Reckien, Flacke, et al., 2015), it is found that several factors can drive or constrain the development of policies for both mitigation and adaptation measures. Academic literature has addressed these factors, and the studies have reached similar conclusions. For example, financial aspects seem to be the most critical ones, followed by human resources, knowledge and information, and even the presence of a political leader that promotes climate change (Aylett, 2015, Salon, Murphy, et al., 2014, Betsill, 2001, Romero-Lankao, 2012, Bulkeley and Betsill, 2003, Bulkeley, Schroeder, et al., 2009). But these studies analyse the influence of governance and institutional factors on the whole policy cycle – from problem definition to evaluation of measures – and there is lack of knowledge related to how these factors influence implementation.
In order to understand the actual role that European cities play to mitigate climate change, it is essential to address the extent to which their climate action plans have been implemented, and how governance factors drive or constrain implementation. Since these topics have not been covered by academic literature, this research aims to contribute to the creation of knowledge in the field by exploring them.
1.3 Research Objectives
The aim of this research is to identify the governance factors that influence the implementation of urban-scale mitigation actions developed by the local governments of European cities signatories of the Covenant of Mayors, and also to determine the status of implementation of such actions.
This objective is achieved by describing the extent to which urban-scale mitigation actions related to nine different sectors are implemented, and how governance factors influence the implementation of the mitigation actions in each sector – either acting as a driver or a barrier. The differences among distinct cities sizes will also be explored. Furthermore, the study classifies the mitigation actions by level of implementation, abatement potential, critical drivers and critical barriers.
Do mitigation plans come true? An analysis of the implementation of mitigation actions by European cities and the influence of governance factors.
4
1.4 Provisional Research Question(s)
In order to address the research objectives, the following research questions were formulated: What are the governance factors that influence the implementation of urban-scale mitigation actions by European cities?
1. What is the status of implementation of urban-scale mitigation actions present in European cities’ Sustainable Energy Action Plans (in total and by sector)?
2. Which are the governance factors that drive or constrain the implementation of urban-scale mitigation actions (generally and by sector)?
3. How can the sectors be categorised according to implementation, critical drivers and critical barriers, and abatement potential?
1.5 Significance of the Study
Urban activities are responsible for contributing to global GHG emissions, which has been addressed by cities worldwide through the adoption of reduction targets and the planning of urban-scale mitigation actions. A study shows that the targets and plans undertaken by European cities are ambitious and would help most of the countries to meet their EU2020 GHG targets (Reckien, Flacke, et al., 2014a). However, cities voluntarily adopt these commitments that are not legally binding; therefore, nothing assures that local governments are implementing their initiatives (Hsu, Cheng, et al., 2016). Is this sense, Reckien, Flacke, et al. (2014a) suggest that future studies address the monitoring of such plans and investigate the potential drivers and barriers of the implementation of planned actions, which are the objectives of this study.
Recently, academic literature has analysed the factors that drive and constrain local climate action, but there is lack of research focused on implementation. For example, one of the main recent studies to analyse the drivers and barriers of local climate response approaches the planning and the implementation of measures without differentiating these phases (Aylett, 2014), assuming that the factors influence both stages in the same way. However, the implementation comprehends distinct processes than the planning phase, demanding organisational and economic resources, and concrete actions that might evoke stakeholders’ opposition (Sharp, 2011 in Ryan, 2015, pg. 520).
In this context, this research builds on previous and relevant studies related to local climate action and moves beyond the influence of governance factors on the overall cycle of climate action plans towards an analysis focused on the implementation of planned measures. It also contributes to the academic knowledge by assessing the extent to which planned urban-scale mitigation actions in European cities are implemented. The research develops on Ryan’s (2015) analytical model, which was built to explain what influences climate policy implementation. The framework was created based on literature of urban policy and climate change, and in case studies of cities in developing countries; therefore, the model is further revised and adapt in accordance to academic literature that also analyse cities in developed countries. In addition, European cities are among the most committed to mitigating climate change in the world. The acknowledgment of their implementation power, and what drives or constrains
Do mitigation plans come true? An analysis of the implementation of mitigation actions by European cities and the influence of governance factors.
5
implementation, might contribute to the development of mitigation policies and actions with higher potential of implementation, which will enhance the reduction of GHG emissions related to cities. Furthermore, this information can also contribute to the practices conducted by networks of cities in order to support these cities with the adoption, development, and implementation of mitigation actions.
Do mitigation plans come true? An analysis of the implementation of mitigation actions by European cities and the influence of governance factors.
6
Chapter 2: Literature Review
2.1 Urban-scale climate change mitigation
Over the last years, academic literature has analysed the role of cities in mitigating climate change. The studies are conducted from different perspectives, out of which the most relevant for this research were selected. This section explores the main findings regarding the cities’ potential to reduce global emissions, and the estimated impact of mitigation policies and actions available in different sectors.
2.1.1 Abatement potential of cities: a global projection This section focuses on recent academic literature that explores the extent to which cities can contribute to reducing global emissions; or, in other words, the abatement potential of cities. Since this field of research has just emerged, a small number of publications is available. Main publications are working papers developed by the Stockholm Environment Institute (SEI), which are further reviewed.
One of the first studies to develop a global assessment of future GHG emissions and abatement potential1 related to urban areas is the analysis conducted by Erickson and Tempest (2014). The study creates a reference scenario that contemplates GHG emissions from urban areas, as well as future economy and energy patterns by 2050. This baseline scenario does not consider aggressive urban action, but it does consider policies recently adopted by nations. Erickson and Tempest (2014) also create an urban action scenario in which a set of aggressive technologies and practices that can reduce energy use and GHG emission from urban areas is applied to the reference scenario.
Since there is absence of city-scale data, the authors relied on national-scale data to create the scenarios, which are mainly based on the Energy Technology Perspectives series developed by the International Energy Agency (IEA, 2014, as cited in Erickson and Tempest, 2014). The actors define “urban technologies and practices” as any emissions reductions actions associated with urban building energy use, urban passenger transport, urban road freight transport, and urban waste management. A few examples of these actions are addressed in chapter 2.1.2. For detailed information about this analysis, please see Erickson and Tempest (2014, pg. 3-4).
Figure 1 shows the abatement potential of urban actions in different sectors. In comparison to the reference scenario, the urban actions could reduce emissions by 24% in 2030, and 47% in 2050. The authors advise interpreting the results with caution since the study faced challenges in defining “urban” and collecting data regarding GHG emissions related to urban areas. Even though the analysis provides a rough estimation, it concludes that aggressive urban actions could contribute to keeping global warming below 2°C degrees in relation to pre-industrial levels, as showed in Figure 2.
1 Abatement potential: potential to reduce GHG emissions.
Do mitigation plans come true? An analysis of the implementation of mitigation actions by European cities and the influence of governance factors.
7
Figure 1: GHG emissions and potential emissions avoided in the urban action scenario
From: Erickson and Tempest (2014)
Figure 2: The potential impact of urban actions on global climate mitigation ambition
From: Erickson and Tempest (2014)
Another study conducted by SEI assesses how policies related to urban economic development influence global GHG emissions. In this analysis, Lee and Erickson (2014, pg. 2) conclude that initiatives such as “compact development, mass transit and non-motorized infrastructure, expansion of renewable electricity access, and improvements to waste and water utility infrastructure, under certain conditions” can reduce global emissions. On the other hand, the authors highlight that there are strategies that reduce emissions at the city
Do mitigation plans come true? An analysis of the implementation of mitigation actions by European cities and the influence of governance factors.
8
scale but not at the global scale – for example, strategies that encourage energy-intensive industries to shift from one city to another. At last, the authors conclude that in order to maximize mitigation at the urban level, cities must address the consumption of goods and services, and the emissions related to it. Food choice, product purchases, and long-distance transport are responsible for 40% of GHG emissions accounted for city residents of developed countries (Lee and Erickson, 2014, pg. 15).
The most recent assessment regarding the potential of urban and non-urban areas to reducing global GHG emissions is the Energy Technologies Perspective (ETP) report (OECD and IEA, 2016). Since 2006, the International Energy Agency (IEA) and the Organisation for Economic Co-operation and Development (OECD) annually publish the ETP, informing trends and technologies focused on developing a sustainable energy future. The report published in 2016 is possibly the first of the collection to highlight the role of cities in the transition to a low-carbon society, recognizing that “the energy landscape is shaped by cities” and admitting that “cities are at the heart of the decarbonisation effort” (OECD and IEA, 2016, pg 9). The study presents several cost-effective sustainable energy opportunities for urban areas, and observes the importance of the cooperation among national and local governments in order to implement such measures. Figure 3 shows the estimated CO2 emissions reduction by technology area from 2013 levels to 2050. According to OECD and IEA (2016, pg. 29), “the ETP model comprises four interlinked technology-rich models, one for each of four sectors: energy supply, buildings, industry and transport. Depending on the sector, this modelling framework covers 28 to 39 world regions or countries, over the period 2013 to 2050.” The 6DS (6 Degree Scenario) considers current trends in energy demand and emissions, which are estimated to increase by 60% from 2013 to 2050, as well as an absence of efforts to mitigate emissions, projecting that the global average temperature will reach 5.5°C above pre-industrial levels. On the other hand, the 2DS (2 Degree Scenario) considers the transition to a sustainable energy future, in which CO2 emissions are reduced by almost 60% by 2050 in comparison to 2013 levels, and there is at least 50% chance that the rise of global average temperature is limited to 2°C (OECD and IEA, 2016, pg. 29). Figure 3: Global CO2 reductions by technology area, 2013-50
From: OECD and IEA (2016)
According to the projections conducted by OECD and IEA (2016, pg. 32), end-use fuel and electricity efficiency account for the largest contribution to cumulative emissions reduction (38%) from 6DS to 2DS, followed by renewables (32%). Furthermore, in the 2DS, 70% of
Do mitigation plans come true? An analysis of the implementation of mitigation actions by European cities and the influence of governance factors.
9
the estimated emissions reduction for 2050 is accounted to a transformation in urban energy systems (OECD and IEA, 2016, pg. 10). In this context, solutions related to compact and dense urban development are essential to achieving reduction in many sectors (OECD and IEA, 2016, pg. 11).
The report suggests that renewable energy sources located in urban areas could contribute to meeting urban electricity demands while avoiding or reducing emissions. For example, the rooftop solar photovoltaic has potential to “provide up to 32% of urban electricity demand and 17% of global total electricity demand in the 2DS by 2050” (OECD and IEA, 2016, pg. 14). Regarding energy consumption related to urban buildings, OECD and IEA (2016, pg. 12) argue that the deployment of energy efficiency options could reduce direct emissions of the sector by over 50%. In the transport sector, about two-thirds of emissions could be reduced by implementing measures that address low-carbon fuels and offer higher vehicle efficiency (OECD and IEA, 2016, pg. 12-13). It is important to observe that academic research and political discussions have been based on the goal of keeping global temperature increase lower than 2°C above pre-industrial levels (IPCC, 2014, pg. 10). However, recent studies suggest that this target may not be enough to avoid catastrophic effects, given that global warming might have initiated in certain regions much earlier than previously assumed (Abram, McGregor, et al., 2016), and that the sea level is rising faster than expected (Hansen, Sato, et al., 2015). Even so, studies that explore the abatement potential of urban areas generate relevant knowledge regarding cities’ contribution to climate change mitigation. Although they are a first attempt to understand the abatement potential of cities, they show that urban actions and policies can reduce global emissions, and that more aggressive local policies should be implemented. However, the types of policies and actions adopted by cities must be selected according to the local emissions, which might differ from city to city. This topic is further explained in the following section.
2.1.2 Abatement potential of urban-scale actions and sectors: a local projection The types of policies and actions that local governments can undertake to reduce GHG emissions are related to the activities that take place in urban areas and the systems that enable these activities. Main sectors responsible for high urban emissions are:
Energy: it is considered one of the primary sources of GHG emissions in several cities (Kennedy, Steinberger, et al., 2009). The combustion of fossil fuels heavily contributes to global emissions and is used for transportation, electricity production, heating and cooling of buildings, among other activities (Romero-Lankao, 2012).
Urban form and density: related to energy consumption, mostly associated with transportation and building sectors (OECD, 2010, Romero-Lankao, 2012). While urban sprawl and low densification are commonly related to high GHG emissions, high densification tends to be related with lower energy consumption and per capita emissions (Hoornweg, Sugar, et al., 2011, OECD, 2010). Commercial and residential buildings: related not only to heating/cooling and general consumption of energy but also to the materials and processes of construction of buildings that can be responsible for high emissions (Romero-Lankao, 2012, Kyrö, Heinonen, et al., 2012).
Do mitigation plans come true? An analysis of the implementation of mitigation actions by European cities and the influence of governance factors.
10
Industry: several industrial activities are responsible for high energy consumption and high GHG emissions, which has an impact on the overall emissions of the city (Romero-Lankao, 2012). Waste: also considered one of the main sources of GHG emissions (Romero-Lankao, 2012), either because of the release of methane from the organic matter in landfills, or because of incineration and even composting procedures (Eurostat, 2014).
The sectors and urban activities responsible for high local emissions are different from city to city. For example, in the case of Rotterdam, the city’s per capita emissions is more than the double of Netherlands’ cities average. The reason is the impact of the city’s port, which attracts industry and ships – activities associated with high GHG emissions (Hoornweg, Sugar, et al., 2011). Therefore, the actions and practices adopted by one city to reduce GHG emissions might not be suitable to another.
In this context, it seems critical that local governments have the capability to choose the most appropriate mitigation options among a varied list of measures. However, authors highlight the lack of frameworks and tools to assess the abatement potential of urban-scale options (Rosenzweig, Solecki, et al., 2010, Zhou, Price, et al., 2011, as cited in Erickson, Lazarus, et al., 2013), which can be an obstacle for urban policy planning processes. In order to address this gap and contribute to the efforts of local climate action planning, Erickson, Lazarus, et al. (2013) developed a typology of urban-scale mitigation technologies and practices based on the IPCC’s national assessments, and on several studies concerning urban activities and urban-scale GHG abatement. Before describing the findings of Erickson, Lazarus, et al. (2013), it is important to highlight that the study precedes the assessment conducted by Erickson and Tempest (2014), reviewed in Chapter 2.1.1., which presents a much more rigorous analysis at urban abatement potential. However, the typology presented by Erickson, Lazarus, et al. (2013) details the abatement potential of several measures and sectors, while Erickson and Tempest (2014) disclose the abatement potential of only three sectors, focusing “on emissions sources and activities where abatement potential, local influence, and data availability are greater” (Erickson and Tempest, 2014, pg. 17) . Furthermore, both assessments present the same information regarding the sector-wide abatement potential for 2020. Since the typology of Erickson, Lazarus, et al. (2013) considers more measures and sectors, this literature review focuses on its findings.
A summary of the typology is presented in Table 3, and provides not only the relative potential of sectors to reduce GHG emissions in 2020 and 2050, but also the influence of local governments to develop and implement these actions. The rating scale of abatement potential is presented in Table 1. Since cities are distinct in paths and development, this range should be considered as a relative basis, instead of absolute (e.g. total tons per capita). Moreover, “these ranges represent average, relative abatement potential across a range of the world’s cities and relative, as well as absolute, potentials in individual jurisdictions, may vary” (Erickson, Lazarus, et al., 2013, pg. 42).
Do mitigation plans come true? An analysis of the implementation of mitigation actions by European cities and the influence of governance factors.
11
Table 1: Scale for rating the abatement potential of urban-scale technologies and practices
Rating symbol Relative, average
abatement potential
Fraction of average resident’s carbon
footprint
Equivalent abatement potential for a world average resident (tCO2e per
resident per year) √ High >5% >0.3 √√ Medium 1–5% 0.06–0.3 √√√ Low <1% <0.06
Adapted from: Erickson, Lazarus, et al. (2013)
The degree of influence, presented in Table 2, has a similar approach once the local jurisdiction influence can vary from city to city. In order to develop a range of influence, the authors considered the fraction of cities that reported each level of influence on the research conducted by Arup and C40 Cities (2011). If the survey did not explicitly address a particular technology or practice, the authors considered as “low” influence, unless it was suggested differently by available evidence. For a detailed explanation of the methodology, please see Erickson, Lazarus, et al. (2013).
Table 2: Scale for rating degree of influence of local jurisdictions
Rating symbol Relative, average influence of local
jurisdictions
Fraction of C40 cities with strong ‘powers’ over each technology or
practice √ High >50% √√ Medium 10–50% √√√ Low <10%
Adapted from: Erickson, Lazarus, et al. (2013)
Based on the typology, Erickson, Lazarus, et al. (2013) conclude that:
• Technologies and policies related to transportation and building sectors are among the most relevant and should be prioritized, once they are characterized by high abatement potential and high local influence;
• Energy supply also has a high abatement potential, but its implementation might be more challenging for the local government once the local influence seems to be generally low.
• Local influence might be limited in areas such as food choice and waste generation, that present significant abatement potential (Erickson, Lazarus, et al., 2013).
Do mitigation plans come true? An analysis of the implementation of mitigation actions by European cities and the influence of governance factors.
12
Table 3: Typology of technologies and practices for GHG abatement at the urban scale
Sector
Abatement potential (sector-wide) Local
influence Technologies and practices 2020 2050 Energy supply √√√ √√√ √√ - Utility-scale low-carbon electricity supply
- Distributed renewables / on-site generation - District heating and cooling - Improved transmission and distribution efficiency
Residential, Commercial, and Institutional buildings and infrastructure
√√ √√√ √√√ - Efficient heating/cooling equipment - Lower-GHG fuel sources - Improved building thermal integrity - More efficient appliances and lighting - Improved space usage and reduce average home size
Transport √√ √√√ √√√ - Reduce vehicle energy intensity - Lower-GHG fuel sources - Increased operational efficiency of road network / transport system - Increased share and non-motorized transport (mode shift) - Avoided trips and/or reduce trip lenght
Industry, Goods, and Materials
√√ √√ √√ - Process change, energy efficiency, and fuel switching (in-region facilities) - Use of low-GHG cement - Use of low-GHG steel - Increased consumer product longevity
√ √√ √√ - Increased and improved urban tree cover - Forest and agricultural land conservation / avoided conversion
Waste management √√ √√ √√ - Capture gas and/or energy from waste - Increased recycling and composting - Wastewater treatment
Adapted from: Erickson, Lazarus, et al. (2013)
In another research, Kyrö, Heinonen, et al. (2012) evaluate the abatement potential effectiveness of different mitigation strategies in three cities in Finland: Helsinki, Porvoo, and Tampere. According to the authors, reducing private driving have low emissions reduction in dense urban structures, and only appeared to be more attractive in the city of Porvoo, where the energy production is characterized by low emissions and the kilometers traveled by car per resident is high (Kyrö, Heinonen, et al., 2012, pg. 1521). This conclusion shows that not all actions related to transport have high abatement potential in all cities, and, therefore, the typology developed by Erickson, Lazarus, et al. (2013) should be interpreted with caution.
Do mitigation plans come true? An analysis of the implementation of mitigation actions by European cities and the influence of governance factors.
13
Furthermore, Kyrö, Heinonen, et al. (2012) find that mitigation strategies related to local energy production are the most effective in terms of reducing emissions in absolute and short-term – and is in accordance with Erickson, Lazarus, et al. (2013). On the other hand, “the study also finds that the carbon spike generated by current construction practices is enough to overrule the benefits of the newly constructed low-energy buildings for decades, even a century. Given the accumulation of the GHG emissions into the atmosphere, this phenomenon is even more detrimental from the climate protection perspective” (Kyrö, Heinonen, et al., 2012, pg. 1521). In conclusion, the academic literature shows that cities have potential to mitigate global warming through several practices and actions that are available for local governments. The next pressing question is: are cities putting these actions into practice? The answer to this question is addressed in chapter 2.2.
2.2 Implementation of urban-scale mitigation policies and actions by cities Local governments all over the world are undertaking climate actions plans with the objective of mitigating climate change and adapting to its effects. However, as the following sections show, not much is known regarding the implementation of such measures, and the factors that influence implementation. Therefore, this section presents main findings related to the benefits of implementing climate measures at the local level (chapter 2.2.1), and also what factors are related to the adoption and implementation of climate policies (chapter 2.2.2.).
2.2.1 Climate action in cities: from planning to implementation Although the first policies to address climate change may have initiated in 1980s through national and international interactions (Corfee-Morlot, Kamal-Chaoui, et al., 2009), publications related to climate change in urban settings started almost twenty years later (Betsill and Bulkeley, 2004, as cited in Francesch-Huidobro, 2016) – which allows to have an idea about the period in which the planning of mitigation policies and actions initiated in cities. Academic literature mainly recognises the complex governance aspects of local climate action (Betsill and Bulkeley, 2006, McCarney, Blanco, et al., 2011), and the importance of regional and local mitigation and adaptation strategies (Corfee-Morlot, Kamal-Chaoui, et al., 2009, Hooghe and Marks, 2003). Overall, they have reached similar conclusions about the benefits of addressing climate change at the local level, which are organised as follows, in three main arguments:
1. Even if both mitigation and adaptation strategies are guided by national and international levels, the implementation will be local (Corfee-Morlot, Kamal-Chaoui, et al., 2009), which makes local action crucial for nation-states to meet international commitments (Bulkeley and Betsill, 2003);
2. The position of cities authorities may facilitate the engagement with stakeholders to implement mitigation and adaptation strategies (Corfee-Morlot, Kamal-Chaoui, et al., 2009). Which shows that not only municipal governments play an important
Do mitigation plans come true? An analysis of the implementation of mitigation actions by European cities and the influence of governance factors.
14
role to implement climate measures, but also civil society, public and private organisations; and
3. Local governments are generally responsible for sectors that can achieve GHG emissions reduction, such as waste management, transportation and land-use planning (Bulkeley, Schroeder, et al., 2011, Lee and Erickson, 2014, Erickson, Lazarus, et al., 2013). Even in the energy sector, where local government’s authority can be limited, it is possible to achieve energy efficiency through “strategic planning, zoning regulation and building permits” (Bulkeley and Betsill, 2003, pg. 48).
Currently, cities worldwide are addressing climate change through a systematic approach that has been cited and analysed in the academic literature of urban climate change (Betsill, 2001, Bulkeley and Betsill, 2003, Millard-Ball, 2012). Mainly, this process is attributed to the Cities for Climate Protection (CCP), a campaign from International Council for Local Environmental Initiatives (ICLEI), since the member cities commit to following its formal milestones, which comprises the stages showed in Figure 4 (Millard-Ball, 2012). Figure 4: Climate action planning process
Adapted from: Millard-Ball (2012)
Although the climate action plan (CAP) lacks regulatory force, Millard-Ball (2012, 290) lists a series of causal impacts they might have, such as:
• Reduce information barriers, once the CAP contains local knowledge related to climate change and offers a clear list of planned measures;
• Create awareness and shape the preference of elected officials, residents, and developers;
• Include the issues of climate change on the local agenda; • Restrict political backsliding; • Increase the likelihood of actions’ implementation.
Conduction of GHG
emissions inventory
Adoption of target to reduce
emissions
Develop-ment of climate
action plan (CAP)
Implemen-tation of actions
Monitoring and
evaluating implemen-
tation
Do mitigation plans come true? An analysis of the implementation of mitigation actions by European cities and the influence of governance factors.
15
Regarding the term implementation, it can be defined as “the stage of the policy-making process that involves translating the goals and commitments of a public policy into concrete and operating actions” (Ryan, 2015, pg. 520). This definition was developed by Ryan (2015) based on the definition created by Sabatier and Mazmanian (1980).
It is important to differentiate the adoption and the implementation of climate policies because not only their processes and actions are distinct, but also the implication of both stages. While climate policy adoption can be relatively uncontroversial, its implementation requires concrete government actions that might evoke stakeholders’ opposition and demands organisational and economic resources (Sharp, 2011 in Ryan, 2015, pg. 520). In order words, adopting targets and creating plans do not necessarily translate into concrete action. Therefore, it is important to assess the level of implementation of such policies, and understand which factors influence implementation.
2.2.2 Implementation of urban-scale mitigation actions by cities Since the discussion of cities’ role regarding climate change has increased in the last decade, so did the number of local Climate Action Plans (CAP) and the academic studies about cities’ climate policies and actions. Nonetheless, there is a lack of academic literature regarding the extent to which cities implement mitigation measures, and which factors influence implementation. A few studies in this field assess the implementation of mitigation actions by cities in the US (Krause, 2012, Krause, 2011a, Krause, 2011b, Millard-Ball, 2012). However, in the European context, most studies address climate policy planning and climate strategies in general (Romero-Lankao, 2012, Heidrich, Dawson, et al., 2013, Reckien, Flacke, et al., 2015, Reckien, Flacke, et al., 2014a, Bulkeley and Betsill, 2003).
One of the main publications regarding local climate action is the book “Cities and climate change: urban sustainability and global environmental governance”, by Bulkeley and Betsill (2003). The book presents a study that questions whether the membership in a trans-municipal network (in this case, the Cities for Climate Protection’s programme) influences the development and implementation of strategies to address climate change. It is probably one of the first attempts to understand the implementation of climate policies in cities. The study concludes that several strategies were developed in Cambridgeshire city, but only little action has been noticed (Bulkeley and Betsill, 2003, pg. 103), while in Leicester, several measures related to energy efficiency and conservation were implemented, but the influence of the CCP program is not clear once the city was interested in these subjects since 1970 (Bulkeley and Betsill, 2003, pg. 119). The authors conclude that other factors seemed to have a bigger influence than membership on CCP, such as financial aspects, political champions, local government’s capacity, and how the issue of climate change was framed.
Another study questions whether the adoption of a climate action plan is an indicator of implementation of mitigation actions in US cities (Millard-Ball, 2012). The study concludes that citizens’ environmental preferences have more impact on the implementation of mitigation actions than the plans themselves. However, the author also finds that “cities with climate plans have done more to reduce greenhouse gas emissions than their counterparts without such plans” (Millard-Ball, 2012, pg. 290). These studies seem to agree on the importance of considering a broad set of factors when addressing the implementation of local climate policies. Recently, studies that analyse the adoption of mitigation and adaptation measures by local governments have explored institutional factors (Burch, 2010, Reckien, Flacke, et al., 2015), socio-cultural factors
Do mitigation plans come true? An analysis of the implementation of mitigation actions by European cities and the influence of governance factors.
16
(Burch, 2010), and socio-economic, environmental and composite vulnerability factors (Reckien, Flacke, et al., 2015), among others. For Romero-Lankao (2012), the way the policies are framed, leadership, institutional capacity and autonomy, financial aspects, competing priorities, and access to knowledge are also relevant factors in the analysis of local climate action. According to the author “the complex interplay of these factors may, in fact, enhance or constrain a local government’s ability to mitigate the consequences of climate change or to respond to its inevitable impacts” (Romero-Lankao, 2012, pg. 22). The next chapter of the literature review is focused on the main findings related to the governance factors that influence climate planning (and, to a lesser extent, implementation) in cities.
2.3 Governance factors that influence implementation of mitigation actions by cities This chapter addresses the main academic findings related to the governance factors that influence the implementation of mitigation measures in cities. It starts by defining the concept of governance and continuous by presenting the main governance factors that affect the adoption, planning, and implementation of climate measures (for both mitigation and adaptation actions). This approach was chosen based on the fact that there is lack of academic literature specifically related to the governance factors that influence the implementation of mitigation policies. Furthermore, academic findings show similarities between governance factors that influence different stages of the policy cycle, and for both adaptation and mitigation measures, which also corroborates with this approach.
2.3.1 Governance: explaining the concept
In order to understand local climate governance, it is crucial to start by addressing the concept of governance itself. The following paragraphs explain how governance has been defined in the literature, and the facts that led to the creation of local climate governance concept.
Over the last years, several scholars have addressed the shift from a top-down and centralised development of policies towards a dispersed and multiple actor process of policy-making. According to Hooghe and Marks (2003), the centralised authority – which is characterised by command and control – has been losing its relevance and advocates to a new and modern governance – which is represented by diffuse structures and multiple authorities. Loorbach (2010, pg. 161) defines the first as a “centralized government-based nation-state” and the second as a “liberalized, market–based, and decentralized decision-making structures” – including private actors in the discourse of policy –, and argues that the last one is commonly referred to as “governance” (Kooiman, 1993, as cited in Loorbach, 2010). In other words, governance is attributed to a new meaning of government, which considers “a new process of governing”, “a changed condition of ordered rule”, or a “new method by which society is governed” (Rhodes, 1996, pg. 652).
The concept has attracted the interest of several scholars, and its definition is far from being singular. The political scientist Gerry Stoker (1998) observes that the theoretical roots of
Do mitigation plans come true? An analysis of the implementation of mitigation actions by European cities and the influence of governance factors.
17
governance are varied, coming from institutional economics, organisational studies, political science, public administration, development studies, among others – which might explain the varieties of definitions. The author analysed the literature about the concept and defined five propositions (Stoker, 1998, pg. 18):
1. “Governance refers to a set of institutions and actors that are drawn from but also beyond government”.
2. “Governance identifies the blurring of boundaries and responsibilities for tackling social and economic issues”.
3. “Governance identifies the power dependence involved in the relationships between institutions involved in collective action”.
4. “Governance is about autonomous self-governing network of actors”. 5. “Governance recognizes the capacity to get things done which does not rest on the
power of government to command or use its authority. It sees government as able to use new tools and techniques to steer and guide”.
Instead of considering only one as the correct or best definition, Stoker (1998) suggests that they can be combined. The use of one proposition or the combination of two or more is present in academic studies. For example, governance was defined as a process through which a social system coordinates and manages itself, and the government plays a facilitator role (Pierre, J. and Peters, G., 2000, Kooiman, 2000, as cited in Francesch-Huidobro, 2016); or a process of decision-making, in which collective goals are defined, and it is not attributed a particular role for the government (Hooghe and Marks, 2003). The concept was also related to the government’s ability to execute rules and services, in which the interaction between government’s capacity and autonomy are important dimensions of quality of governance (Fukuyama, 2013).
For this research, the concept of governance was defined after considering the dynamics regarding climate change politics at the local level, reviewed in the following sections. In order to achieve this research’s objective, the concept of local climate governance is related to the local government’s ability to frame mitigation policies, as well as its capacity and autonomy to implement such policies, considering the political context of actors that might act as barriers or drivers of implementation (Fukuyama, 2013, Stoker, 1998).
2.3.2 Critical governance factors for implementation of mitigation actions According to Salon, Murphy, et al. (2014, pg. 68), there are few studies that question the enablers/drivers and barriers/challenges of local climate planning in US and Europe. Although they are mostly case studies of different cities, they find common factors that constrain the efforts of local governments to mitigate and adapt to climate change, such as lack of data or information (Millard-Ball, 2013); conceptual differences between climate change (which is a global issue) and local actions (Betsill, 2001); financial and technical issues (Allman, Fleming, et al., 2004, Fleming and Webber, 2004, Betsill, 2001); and institutional barriers (DeAngelo and Harvey, 1998). The studies also show that “local action has been most successful when climate policies also target local-scale goals and when there are climate policy champions within the local government” (Salon, Murphy, et al., 2014, pg. 68). Among academic literature related to the institutional aspects, several studies analyse local climate action through a multilevel approach that considers the power and influence relations among national and local state and non-state actors, and also the influence of networks of
Do mitigation plans come true? An analysis of the implementation of mitigation actions by European cities and the influence of governance factors.
18
cities. For example, when Bulkeley and Betsill (2003) conducted case studies of six cities members of ICLEI’s Cities and Climate Protection programme (CCP), the authors conclude that the governance of climate change should be analysed through a multilevel approach. Such kind of analysis has been employed by several studies during the following years (Reckien, Flacke, et al., 2015, Bulkeley and Betsill, 2003, Aylett, 2015), with different conclusions regarding how the interactions among actors drive and constrain the adoption and implementation of measures related to both adaptation and mitigation by local governments. However, there is lack of academic literature regarding the factors that drive and constrain the implementation of climate policies, either for mitigation and adaptation. In this field, there is a study conducted by Aylett (2014) for MIT and ICLEI, which identifies drivers and challenges for climate policy and implementation. Although it presents a rich list of influential factors, this and other studies that show the factors that influence climate policies in general are too broad and based on many different concepts. Recently, Ryan analysed academic literature on climate change and urban policy, and conclude that “there is a tendency for the literature on climate change and urban issues to fall into the ‘everything matters’ trap when analysing policy development” (Ryan, 2015, pg. 519), suggesting that the studies are characterised either by reports with “long lists of factors” or by descriptive case studies that consider a “range of different contextual circumstances, from hosting international diplomatic events to energy crises” (Ryan, 2015, pg. 520). Notwithstanding, the author also identifies studies that attempt to organise and synthesise this knowledge, mentioning Romero-Lankao, Hughes, et al. (2013), Bulkeley, Schroeder, et al. (2009), among others. In order to organise these factors and contribute to this field of study, Ryan (2015) developed a framework of critical factors for implementation of urban climate policy, considering adaptation and mitigation measures. Figure 5 presents the framework, which is based on a literature review of climate change and urban policy, as well as on findings of case studies conducted by the author among cities in developing countries. The framework considers three sets of conditions:
1. Local government capacity 2. Local framing 3. Political actors and factors
These conditions might influence the implementation of mitigation and adaptation actions in different ways, presenting distinct causal effects. In this case, the author admits a configurational approach, in which “the effect of any particular condition may depend on the presence or absence of other conditions” (Ryan, 2015, pg. 520).
Do mitigation plans come true? An analysis of the implementation of mitigation actions by European cities and the influence of governance factors.
19
Figure 5: Conceptual framework of critical factors developed by Ryan (2015)
From: Ryan (2015)
Even though this framework is based on studies conducted both in developed and developing countries and to both mitigation and adaption measures, it is the first attempt to organise the local governance factors that influence the implementation of climate actions and policies.
Since there are similar governance factors that affect the adoption, planning and implementation of adaptation and mitigation actions by local governments (as showed by the following sections), this framework is used to present the main findings related to local climate governance, and is applied in this research to understand how governance factors influence implementation of mitigation actions by European cities.
2.3.2.1 Local Framing The first set of conditions that influence implementation of climate policies and actions by cities are related to the way in which the policies are framed. The hypothesis is that “local governments and communities are more likely to develop and advance climate-friendly policies if they can be framed in relation to local problems and generate other socio-economic or environmental benefits” (Ryan, 2015, pg. 523). Therefore, it is relevant to understand how climate policies are designed – in terms of goals and expected outputs – and also its feasibility, once certain objectives can be conflicting with other goals of the city, as showed by different studies (Romero-Lankao, 2012, Bulkeley and Betsill, 2003, Bulkeley, Schroeder, et al., 2009).
In the survey conducted by Salon, Murphy, et al. (2014, pg. 74), co-benefits related to saving money of the jurisdiction and to the local environment preservation were classified as ‘extremely important’ reasons for local climate action. Another motive identified by 50% of the respondents was the community’s attractiveness for business and families. Measures to reduce emissions can also address mobility issues, in which public transportation systems are improved, instead of building more roads (Romero-Lankao, 2012).
Do mitigation plans come true? An analysis of the implementation of mitigation actions by European cities and the influence of governance factors.
20
On the other hand, the conflict between climate actions and other budget priorities can be considered a substantial obstacle to implementation (Salon, Murphy, et al., 2014). Studies highlight the importance of framing climate policies in a way that they contribute to city’s priorities (Romero-Lankao, 2012, Aylett, 2015). Either way, there are cases in which relating climate issues to local goals might not be possible and priorities must be made. Economic growth, housing, sanitation, and health are examples of competing priorities for both adaptation and mitigation action – a challenge identified by 76% of the survey conducted by Aylett (2015, pg. 11).
Although it is not mentioned in Ryan’s framework, another factor that significantly affects the dynamics of climate policy is the necessity of coordinating policy responses across multiple departments within local government (Aylett, 2015). Mainstreaming climate change is commonly related to adaptation policies (Aylett, 2015), however, it is noticed that mitigation measures also require the involvement of different sectors and departments, such as transportation, urban planning, waste, to name a few (Erickson, Lazarus, et al., 2013), and might also be significant for the implementation of mitigation actions. Finally, literature also suggests that state and national policies and requirements can significantly drive climate action in cities (Salon, Murphy, et al., 2014). For example, in the state of California (U.S.), “Attorney General threatened under state environmental law to sue only a small number of cities because their General Plans did not address climate change, the threat of this intervention motivated many more California jurisdictions to step up their climate-related activities” (Salon, Murphy, et al., 2014, pg. 73), but also the support of higher levels of government are considered to be critical for motivated climate action in cities.
Although several decisions regarding the framing of climate policies are taken during the planning period, it shows to be highly influential to implementation. Therefore, local governments must be aware of these aspects during the planning process. In other words, local governments need to have sufficient knowledge (regarding co-benefits, for example) in order to frame climate policies in a way that increases the chances of implementation. This factor is related to the local government capacity, which is further addressed.
2.3.2.2 Local government capacity Local government capacity comprehends the factors related to (Ryan, 2015, pg. 527):
1. Administrative authority and issue scale 2. Financial resources, human and technical resources 3. Scientific information and data management
It is important to highlight that although the factors concern the capacity of the local government and do not relate directly to local governance, they address the governance aspects within local government. As mentioned in Chapter 2.3.1, one of the five propositions presented by Stoker (1998, pg. 18) to define the concept characterises governance as “the capacity to get things done” and “sees government as able to use new tools and techniques to steer and guide”. Moreover, Rhodes (1996) implies that governance entails authority and resources allocation as enablers of coordinated action, and Fukuyama (2013) argues that the government’s capacity and autonomy translate the quality of governance. In this context, government and governance are not differentiated in order to analyse the institutional governance structures of local government. This approach was conducted by studies that analyse urban climate governance either for adaptation (Aylett, 2015) and mitigation
Do mitigation plans come true? An analysis of the implementation of mitigation actions by European cities and the influence of governance factors.
21
measures (Anguelovski and Carmin, 2011). It is also recognised by the OECD (2010), which relates factors such as funding, political authority, knowledge, and staff to local and regional governance obstacles that can constrain the implementation of climate change policies. The administrative authority has been commonly addressed in literature as the legal authority or power that the local government has to plan and implement climate policies, which can be a strong enabler or obstacle for climate action. For example, in the survey conducted by Aylett (2015, pg. 11) among 350 cities worldwide that are members of ICLEI, 48% of the respondents agree that the “lack of government jurisdiction over key policy areas” is a challenge for both mitigation and adaptation action. This result highlights the governance coordination among local, state and national government, and is related to financial aspects.
The issue scale is related to the “mismatch between the scale of urban issues that need to be addressed and the extent of local government authority” (Ryan, 2015, pg. 521). Bulkeley and Betsill (2003) define it as a problem of fit between jurisdictional areas and the boundaries of climate change issues. In this context, the necessary legal power to deploy certain climate actions goes beyond local government’s capacity. Funding is found in literature as one of the most relevant factors – even if the local government has the legal authority to develop and implement climate policies, it does not necessarily mean that it also has the fiscal authority to do so. In this context of decentralisation, the local government has new “policy responsibilities without corresponding funds to carry them out” (Ryan, 2015, pg. 522). Several studies concluded that this is one of the main factors that drive or constrain climate policy in cities (Aylett, 2015, Salon, Murphy, et al., 2014, Betsill, 2001, Romero-Lankao, 2012, Bulkeley and Betsill, 2003, Bulkeley, Schroeder, et al., 2009). They explore specific aspects or consequences of financial challenges, such as lack of funding to hire staff (Aylett, 2015), dependence on external funding (Bulkeley and Betsill, 2003), and difficulty of factoring climate change into infrastructure budgeting procedures (Aylett, 2015) – for both mitigation and adaptation strategies. According to Aylett (2015, pg. 11), lack of funding for implementation of climate actions was the most significant challenge, cited by 78% of respondents.
Human and technical resources also play a major role in climate policy. Salon, Murphy, et al. (2014) argue that available staff can be a significant influence on the level of climate action undertaken by cities. In this aspect, staff time dedicated to sustainability activities is an obstacle far more relevant than others regarding local government capacity. Although the lack of funding to hire sufficient staff is a challenge reported by several cities (Aylett, 2015), Burch (2010) argues that obstacles regarding the lack of human, financial and technical resources can be solved by changing procedures that led to unsuccessful patterns, instead of creating more capacity.
Another relevant issue is related to scientific information & data management, which comprehends the local government’s capacity to generate data regarding climate change, and to manage it. Although this issue is commonly related to adaptation (Bulkeley, Schroeder, et al., 2009), it can also be related to mitigation, although it might not be relevant in certain contexts (Bulkeley and Betsill, 2003, Aylett, 2015). For example, in the research conducted by Salon, Murphy, et al. (2014) information availability showed to be irrelevant regarding advancing sustainable policies. However, Aylett (2015) combines information and staff awareness and achieves different results. In this study, lack of understanding about how climate change can be addressed by the local government (53%), and lack of knowledge regarding local impacts and CC relevance (51%) showed to be important challenges for climate policy. On the other hand, lack of information on GHG emissions was less influential (27%).
Do mitigation plans come true? An analysis of the implementation of mitigation actions by European cities and the influence of governance factors.
22
So far, the two sets of conditions reviewed are related to the local government and its capacity to frame, plan and implement climate policies. However, in a governance perspective, the interests and position of other stakeholders also influence local climate action. These aspects are addressed in the following section.
2.3.2.3 Political actors and factors This set of conditions comprehends the factors that are characterised by the social and political context, which includes the broad range of actors that might somehow encourage or act as obstacles for climate action at the local level. Ryan (2015) identifies political entrepreneurs, social coalitions and political parties as main factors of this condition. Literature regarding the first factor considers local climate change as a subject that can be promoted by political leadership, which is studied through the roles of the political entrepreneur or political champion (Ryan, 2015, Bulkeley, Schroeder, et al., 2009). Ryan (2015) argues that this leadership role is commonly performed by senior local government officials who promote climate change agendas and initiatives, either for ideological reasons or advantages in their career. The literature considers leadership as an important factor for climate change policy. For example, in the study conducted by Burch (2010, pg. 296), interviewees of District of North Vancouver reported that leadership “was the most significant missing ingredient” to keep climate change in the local agenda; while Salon, Murphy, et al. (2014, pg. 75) identified that the jurisdictions without visible champions reported less action than jurisdictions that had at least a ‘supporting’ champion. Aylett (2015) shows that the lack of strong leadership is considered a challenge for cities to employ and implement adaptation policies. However, it is also acknowledged the limits of political entrepreneurs regarding the local climate change agenda, once its performance might be constrained by other factors related to the local government’s capacity (Ryan, 2015).
To a lesser extent, the influence of interest groups is also addressed in academic literature. Among the studies reviewed, only a few considered the influence of actors on climate policy (Salon, Murphy, et al., 2014, Bulkeley and Betsill, 2003, Burch, 2010). According to Salon, Murphy, et al (2014, pg. 74), residents “were key enablers of action in four of our eight case study cities, promoting climate action in their cities through organised involvement in local politics”. These cities tended to be politically liberal and wealthier – characteristics that were also related to the success of climate proposals formulated by champions of climate actions, suggesting a connection between these factors. On the other hand, local co-benefits needed to be emphasised in cities with conservative residents. Furthermore, the study also concludes that the extent of climate action is directly related to the participation of community stakeholders in the policy development; and volunteers have a unique role in implementing climate action – an actor that is not mentioned in other studies.
Among the actors that might drive or constrain the implementation of climate policies, studies also consider the role of the private sector. Depending on their activities, they can be powerful oppositions against the climate policies – for example, economic sector dependent of carbon-intensive activities – or very supportive – in the case of bicycle manufacturers regarding policies that promote cycling (Ryan, 2015). Therefore, it is important to consider a broad range of actors and stakeholders when analysing this aspect.
Do mitigation plans come true? An analysis of the implementation of mitigation actions by European cities and the influence of governance factors.
23
The last point mentioned by Ryan (2015) is the lack of literature regarding political parties and how they influence climate action. This observation is confirmed by this review, since only two studies addressed factors related to political party, such as the political preferences of residents (Salon, Murphy, et al., 2014) and the way the structure of the party system affects the development and approval of policies (Burch, 2010). However, the role of the parties in climate action as suggested by Ryan was not explored, and the author highlights that the lack of research “might indicate low levels of politicization of climate issues at the city level – meaning that climate change is not an electorally salient issue nor subject to competition between political parties” (Ryan, 2015, pg. 525). Although not mentioned in Ryan’s framework, the author also includes international networks of cities in this condition. As observed, although there are several studies regarding the influence of network membership on the adoption of climate policies (Reckien, Flacke, et al., 2015, Bulkeley and Betsill, 2003, Bulkeley, Schroeder, et al., 2009), the implementation of these policies needs further analysis. It is still not clear the extent to which membership in these networks influence the execution of measures related to climate change, as observed by the findings presented by Bulkeley and Betsill (2003).
2.3.2.4 Sectoral factors In the literature reviewed, case studies characterised by a more in-depth analysis commonly relate the influence of certain factors to specific sectors. Factors such as co-benefits, the way climate mitigation policies are framed considering city’s priorities and national orientation, and the influence of interest groups seem to have a more sectorial affect, instead of general. In other words, they might not influence the implementation of mitigation actions of all sectors in the same way, since the characteristics and the governance context of each sector impact the influence of these factors. Table 4 presents a few academic findings that relate the factors to specific sectors. Table 4: Examples of academic findings that relate governance factors to specific sectors
Factor: Mitigation action generates co-benefits
Reference Sector Example
Bulkeley, Schroeder, et al. (2009, pg. 81)
Transport "...action on climate change benefits from a strong link to issues high on the agenda of rapidly expanding cities – air pollution, congestion, sprawl"
Bulkeley, Schroeder, et al. (2009, pg. 19)
Energy "Framing climate change with respect to particular local problems can be a means for narrowing the agenda in such a way that only those aspects of the issue on which consensus can be reached – for example energy efficiency – are addressed and more fundamental issues – often connected to the need to reduce demand – are ignored."
Bulkeley and Betsill (2003, 179)
Transport "In Denver, initial concerns about local air quality prompeted the city to invest in alternative transport for its employees".
Do mitigation plans come true? An analysis of the implementation of mitigation actions by European cities and the influence of governance factors.
24
Table 4: Continued
Factor: Mitigation action generates co-benefits
Reference Sector Example
Bulkeley and Betsill (2003, 179)
Transport "In Newcastle, concerns for air quality have been accompanied by the realization among those working on climate protection in the city that the issue of transport needs to be addressed. Such action may be facilitated by the state legislation requirement that local authorities address sustainable development and the evolution of new urbanist planning principles."
Factor: Mitigation action aligned with city's priorities
Reference Sector Example
Anguelovski and Carmin (2011, pg. 171)
Transport "In Bogota, the sophisticated Bus Rapid Transit system (TransMilenio) plays a prominent role in climate mitigation. Its development has been supported by the establishment of air pollution control measures including mandatory inspection and maintenance of buses, air pollution monitoring stations, and allocation of exclusive property rights over routes to private operators to eliminate excess bus supply."
Betsill and Bulkeley (2007, pg. 452)
Transport "The contributions to this special issue (the extent to which climate change is prioritised in relation to other social and economic concerns) reinforce the need to reframe global climate change as a local issue, often by linking it to problems already on the local agenda. In Mexico City, this has meant addressing greenhouse gas emissions as part of a broader strategy to combat air pollution"
Romero-Lankao (2012, pg. 19)
Transport and energy efficiency
"The first (factor to explain the difference between proposed actions and succesful climate response) is the way in which policy issues and response options are framed in terms of local concerns and priorities: e.g. as fitting into existing environmental priorities for improved air quality (Mexico City, Romero Lankao, 2007); or into issues with economic priority such as energy efficiency (for Cape Town & Beijin, see Holgate, 2007; Zhao, 2011, respectively)."
Burch (2010, pg. 7579)
Transport “Delta politicians and planners expressed deep frustration that at the provincial level, transportation infrastructure initiatives have been designed that will effectively undo any progress that Delta may make in the future toward greenhouse gas emissions reductions (…) The inconsistency between policies at the provincial, regional, and local levels was repeatedly raised as an inhibitor of mitigation strategies.”
Factor: Mitigation action follows national orientation
Reference Sector Example
Bulkeley and Betsill (2003, 179)
Transport “… climate change has explicitly been recognized locally and nationally as an issue which transport policy should address. (…) In Newcastle, state policies promoting the integration of land-use and transport planning have been significant, and in Cambridgeshire the influence of national policy development is also evident.”
Do mitigation plans come true? An analysis of the implementation of mitigation actions by European cities and the influence of governance factors.
25
Table 4: Continued
Factor: Mitigation action follows national orientation
Reference Sector Example
Bulkeley and Betsill (2003, 181)
Building “In Leicester, the introduction by central government of the Home Energy Conservation Act has been one important factor in developing energy policies and measures within the housing sector of the city.”
Factor: Influence of interest groups
Reference Sector Example
Bulkeley and Betsill (2003, 180)
Transport “(…) the extent to which the local authority can affect the provision of public transport is limited. In Denver and Newcastle regional organizations, and in Cambridgeshire private companies, supply public transport. In this contect, the role of the local authority becomes one of lobbying for better provision, creating transport infrastructure for the supply of more public transport, and informing the public about, and persuading them to use, these services.”
Bulkeley and Betsill (2003, 180)
Transport “… (In Cambridgeshire) more radical proposal, in which workplace parking levies or road-user charges are implemented by local authorities, have been sanctioned by central government. However, the political and pragmatic difficulties of such schemes have meant that they remain on the back-burner.”
Bulkeley, Schroeder, et al. (2009, pg. 81)
Built environment
“Stakeholders outside of local government are important drivers of action in this sector. This is particularly the case in the commercial built environment.”
Burch (2010, pg. 7581)
Transport and urban development
“Politicians in both Delta and the District of North Vancouver, however, reported that their efforts to lead on climate change issues had often been stymied by either a lack of knowledge about the issues on the part of community groups and citizens or outright opposition to policies (especially those, such as planned increases in density, that might change the character and aesthetic of the community).”
Burch (2010, pg. 7581)
Transport and urban development
"In the District of North Vancouver, for instance, three interviewees claimed that vocal community groups paired with an aging population and values described as ‘conservative’ combined to produce a powerful hindrance to density-oriented mitigation policies."
Bulkeley and Betsill (2003, 136)
Sectors outside the municipal government.
"Officials in Denver face considerable obstacles to climate protection, including strong opposition from local business interests. This opposition has prevented the City from expanding its climate protection programme outside the municipal government (...)"
Such findings raise a question concerning these factors: since their influence on climate change mitigation efforts is related to specific sectors, do they impact different sectors in different ways? In order to address this question and contribute to the current academic knowledge about local climate action, this study analyses the influence of these factors in each sector of the Sustainable Energy Action Plan. Therefore, the analysis is divided into General Factors (factors that impact the whole plan), and Sectoral Factors (factors that might affect each sector differently). The list of General Factors and Sectoral Factors is available on Chapter 3.
Do mitigation plans come true? An analysis of the implementation of mitigation actions by European cities and the influence of governance factors.
26
In conclusion, the literature review shows that academic studies related to urban policy and climate change present relevant findings regarding the governance factors that influence local climate action as a whole, from the adoption of targets to implementing measures. There is lack of academic knowledge concerning the influence of the factors in each stage of the policy cycle, especially related to the implementation phase. In order to fill this gap, Ryan (2015) developed a framework with three sets of conditions that potentially affect the implementation of local climate policies. This research builds on Ryan’s framework and academic findings reviewed in this section. The final conceptual framework, which also considers the other concepts explored in this literature review, is available in Chapter 2.4.
Do mitigation plans come true? An analysis of the implementation of mitigation actions by European cities and the influence of governance factors.
27
2.4 Conceptual framework
The objective of this study is to analyse the governance factors that drive or constrain the implementation of mitigation actions by European cities. Furthermore, the study also assesses the status of implementation of such actions in nine sectors, as well as the overall abatement potential, which is based on academic literature. The relation between these aspects and the cities’ size is also explored. The governance factors are based on academic literature regarding local climate governance, and comprehend three main variables: “local framing”, “local government capacity”, and “political actors and factors”. The variable “local government capacity” addresses the governance aspects within the local government by institutionalising these aspects, as conducted by other studies (Aylett, 2015, Anguelovski and Carmin, 2011). According to Ryan (2015), these three set of conditions influence the implementation of climate measures and are corroborated by academic literature, as presented in Chapter 2.
Figure 6: Conceptual framework
Adapted from: Ryan (2015).
Do mitigation plans come true? An analysis of the implementation of mitigation actions by European cities and the influence of governance factors.
28
Chapter 3: Research Design and Methods
3.1 Revised research questions As mentioned, the research questions formulated to achieve the research objective is:
What are the governance factors that influence the implementation of urban-scale mitigation actions by European cities?
1. What is the status of implementation of urban-scale mitigation actions present in European cities’ Sustainable Energy Action Plans (in total and by sector)?
2. Which are the governance factors that drive or constrain the implementation of urban-scale mitigation actions (generally and by sector)?
3. How can the sectors be categorised according to implementation, critical drivers and critical barriers, and abatement potential?
3.2 Operationalization: variables and indicators The research was conducted according to the central concepts of the conceptual framework: local climate governance and implementation of urban-scale mitigation actions. Local climate governance is related to the local government’s ability to frame mitigation policies, as well as its capacity and autonomy to implement such policies, considering the political context of actors that might act as barriers or drivers of implementation (Stoker, 1998, Fukuyama, 2013). The concept is further divided into three variables: local framing, local government capacity, and political actors and factors, as the framework organised by Ryan (2015). The variables are defined as follows:
• Local framing: Local government’s ability to frame mitigation policies considering local problems, and generating other socio-economic or environmental benefits (Ryan, 2015, pg. 523)
• Local government capacity: comprehends political and financial autonomy, financial and human resources, and knowledge and information regarding climate change (Ryan, 2015, pg. 527).
• Political actors and factors: factors characterised by the social and political context, which includes the broad range of actors that might somehow encourage or act as obstacles for climate action at the local level (2015, pg. 524).
Urban-scale mitigation actions are the policies and measures undertaken by city governments with the objective of reducing GHG emissions related to urban activities (Erickson, Lazarus, et al., 2013). The extent to which emissions reduction can be achieved is defined as the abatement potential.
Implementation is understood to be the extent to which the urban-scale mitigation actions described previously are translated into “concrete and operating actions” in the understanding of local governments (Ryan, 2015).
Do mitigation plans come true? An analysis of the implementation of mitigation actions by European cities and the influence of governance factors.
29
Tables 5 and 6 illustrate the operationalization. As mentioned in Chapter 2.3.2.4, the indicators of local climate governance are divided into General factors (which influence all types of mitigation actions in the same way), and Sectoral factors (which might influence mitigation actions related to each sector differently).
Table 5: Dependent variables and indicators
Concept Dependent
variables Indicators Values
Implementation of urban-scale mitigation actions
Urban-scale mitigation policies and actions in SEAPs
Mitigation actions related to Municipal buildings Number
Mitigation actions related to Tertiary buildings Number
Mitigation actions related to Residential buildings Number
Mitigation actions related to Public lighting Number
Mitigation actions related to Industry Number
Mitigation actions related to Transport Number
Mitigation actions related to Local electricity production Number
Mitigation actions related to Local heat/cold production Number
Mitigation actions related to other sectors Number
Abatement potential
Municipal buildings Range
Tertiary buildings Range
Residential buildings Range
Public lighting Range
Industry Range
Transport Range
Local electricity production Range
Local heat/cold production Range
Status of implementation
Not started actions Number
Ongoing actions Number
Completed actions Number
Do mitigation plans come true? An analysis of the implementation of mitigation actions by European cities and the influence of governance factors.
30
Table 6: Independent variables and indicators Concept Independent
variables Indicators Sectoral (S)
General (G) Values
Local climate governance
Local framing Mitigation actions aligned with city's priorities and goals
S Yes Not a driver
Driver
Major driver
No Not a barrier
Barrier
Major barrier
Mitigation actions generate other socio-economic and/or environmental benefits
at the local level, which is not a city priority (co-benefits)
S Yes Not a driver
Driver
Major driver
No Not a barrier
Barrier
Major barrier
Mainstreaming climate change mitigation among agenda of other
government’s departments
Yes Not a driver
G Driver
Major driver
No Not a barrier
Barrier
Major barrier
Following national policy orientation S Yes Not a driver
Driver
Major driver
No Not a barrier
Barrier
Major barrier
Local government capacity
Administrative authority over mitigation policies' areas
G Yes Not a driver
Driver
Major driver
No Not a barrier
Barrier
Major barrier
Financial autonomy to collect funds G Yes Not a driver
Driver
Major driver
No Not a barrier
Barrier
Major barrier
Mitigation actions considered in local government's budget
G Yes Not a driver
Driver
Major driver
No Not a barrier
Barrier
Major barrier
Available external funds for implementation
G Yes Not a driver
Driver
Major driver
No Not a barrier
Barrier
Major barrier
Do mitigation plans come true? An analysis of the implementation of mitigation actions by European cities and the influence of governance factors.
31
Table 6: Continued
Concept Independent variables
Indicators Sectoral (S) General (G)
Values
Local climate governance
Local government capacity
Sufficient staff or staff time dedicated to climate change
G Yes Not a driver
Driver
Major driver
No Not a barrier
Barrier
Major barrier
Sufficient knowledge and information regarding climate change mitigation at
the local level
G Yes Not a driver
Driver
Major driver
No Not a barrier
Barrier
Major barrier
Political actors and factors
Presence of political leader promoting local climate change policies
G Yes Not a driver
Driver
Major driver
No Not a barrier
Barrier
Major barrier
Position of the civil society regarding the implementation of SEAP's mitigation
actions
S Supports Not a driver
Driver
Major driver
Neutral -
Resists Not a barrier
Barrier
Major barrier
Position of the private sector regarding the implementation of SEAP's mitigation
actions
S Supports Not a driver
Driver
Major driver
Neutral -
Resists Not a barrier
Barrier
Major barrier
Position of the national government regarding the implementations of
SEAP's mitigation actions
S Supports Not a driver
Driver
Major driver
Neutral -
Resists Not a barrier
Barrier
Major barrier
Support received by or through networks of cities (e.g. Covenant of Mayors, C40, ICLEI) to implement SEAP's mitigation
actions
G Yes Not a driver
Driver
Major driver
No Not a barrier
Barrier
Major barrier
Do mitigation plans come true? An analysis of the implementation of mitigation actions by European cities and the influence of governance factors.
32
3.3 Research strategy
In order to achieve the research objective, the cities selected for the study must be able to provide information regarding the governance factors that influence the implementation of urban-scale mitigation measures. Therefore, the criteria for the sample selection requires that the cities have developed a climate action plan and monitored its implementation. Since the Covenant of Mayors encourages the signatories to develop and monitor the implementation of Sustainable Energy Action Plans, and several European cities have published the monitoring reports of such plans on the CoM’s online platform, the cities selected for this study are signatories of the Covenant of Mayors. The sample selection is further addressed in Chapter 3.4.1. The research methods adopted in this study are survey and desk research. The strategy was chosen based on the objective of gaining a broad overview of the subject, and at the same time, respecting time and cost requirements. Moreover, this strategy is understood to be the most effective once a large number of European cities are analysed with the aim of generalizing conclusions. The combination of desk research and survey enable to reduce the size of the questionnaire, possibly increasing the response rate. The desk research is conducted to analyse secondary data of dependent variables, therefore, regarding the quantity of urban-scale mitigation actions present in Sustainable Energy Action Plans (SEAPs) developed by European cities, and the status of implementation of such actions. The survey is used to collect data for the independent variables, related to the local governance factors, and how they influence the implementation of urban-scale mitigation actions in each sector.
The main challenges and limitations for these research methods are:
• Limitations concerning the European cities that can be included in the research • Restrictions regarding data availability • Influence of available data on measurement units • Lack of data reliability • Difficulty in conducting survey in the cities’ official languages, which might affect
interpretation of questions • Survey conducted during vacation period in Europe (July/August)
Some of these limitations are addressed through measures undertaken in data collection methods, which is further explained.
3.4 Data collection methods
The data collection methods applied in this study are chosen based on the availability of secondary data for each of the indicators. For the indicators in which secondary data are not available, the data will be collected through a questionnaire. Secondary data collection is used for all the indicators of dependent variables, which includes the number of urban-scale mitigation actions adopted through Sustainable Energy Action Plans (SEAPs), and the status of implementation of such actions. This information was collected from 27 June to 16 July of 2016, from the dataset of Covenant of Mayors for
Do mitigation plans come true? An analysis of the implementation of mitigation actions by European cities and the influence of governance factors.
33
Climate & Energy, available online through the following link: http://www.covenantofmayors.eu/about/signatories_en.html
During data collection period, the SEAPs monitoring reports of fourteen cities were also available as a PDF document that could be downloaded from Covenant of Mayors' website. When the data of the online report and the PDF report were compared, it was noticed that a few information were not matching. Since the publishing date of the online report was more recent than the PDF report, it is assumed that the online report provides the latest data regarding the SEAP monitoring report. Therefore, all the data for this study was collected from the online report. The Covenant of Mayors for Climate & Energy (CoM) was launched in 2008 by the European Commission. The movement was created after the adoption of the 2020 EU Climate and Energy Package with the aim of endorsing and supporting mayors of European cities to implement sustainable energy policies. Throughout the movement, European cities voluntarily commit to creating Sustainable Energy Action Plans and implement European climate and energy objectives in their territories. Since 2014, the group of European cities also considers adaptation measures in their SEAPs; however, the monitoring reports only provide information regarding mitigation actions. The Covenant of Mayors dataset was also used to collect information about the profile of the cities, such as population, year of adhesion in CoM, and targets to reduce emissions (year and percentage).
In order to gather information for the indicators in which secondary data is not available, the secondary data is combined with a questionnaire.
The questionnaire, presented in Annex II, is applied to collect the information regarding the independent variables: local framing, local government capacity, and political actors and factors. The objective is to understand which indicators influence the implementation of urban-scale mitigation actions in general and by sector, and how – either driving or constraining implementation.
The questionnaire is divided into two parts: 1) General factors: factors that influence the implementation of SEAP as a whole; and
2) Sectoral factors: factors that influence the implementation of actions in each sector of the SEAP.
This distinction is made because, as showed by literature review, certain indicators are related to more general aspects that would affect all the sectors equally while others might have different influence depending on the sector. Table 6, presented in Chapter 3.2, informs which indicators are Sectoral or General factors.
In order to be able to collect quantitative data, and to keep the questionnaire as clear and objective as possible, the questionnaire contains two items for each indicator.
• The first item aims to understand if the indicator is present or not in the reality of the local government. It offers a Yes/No option of answer, and directs the respondent to the second item.
• The second item asks to which extent the indicator is a driver or barrier. If the answer for the first item is “yes”, the second item is related to driver; if it is “no”, the second item is related to barrier. The format of Likert Scale is used for the second item, and
Do mitigation plans come true? An analysis of the implementation of mitigation actions by European cities and the influence of governance factors.
34
the response option has 3 levels of scale in which the respondent chooses from “not a driver/barrier” to “critical driver/barrier”.
Figure 7: Example of items 1 and 2 of the questionnaire
For the indicators related to the position of actors regarding mitigation actions, the first item offers three options of answer: “Supports”, “Neutral”, and “Resists”. “Supports” leads to the Likert Scale of drivers; “Resists” leads to Likert Scale of barriers; and “Neutral” leads to the following question. This approach was chosen based on the lack of academic literature concerning the influence of neutral actors in local climate action, and also with the objective of keeping the questionnaire shorter and objective.
The questionnaire was managed online and available in four languages: English, Spanish, Italian, and Portuguese. They were chosen considering four aspects:
1. Native languages of most of the cities that receive the questionnaire. 2. Overall English skills of the citizens (for example, although the questionnaire was
sent to eleven cities in Sweden, it is known that Swedish citizens have great English skills, and, therefore, a translation to Swedish is not necessary).
3. Author’s knowledge in Portuguese (fluent) and English (advanced). 4. Author’s personal contacts for translation to Spanish and Italian.
The invitation to participate in the questionnaire was translated into four languages mentioned before, and it was sent through e-mail to the city’s contact person informed on the Covenant of Mayors’ website. In case no contact person was informed, the questionnaire was sent to the director of the department responsible for developing climate action plans, which were mostly the environmental or urban planning departments. These contacts were found on the municipality’s website, and also with the contribution of IHS’ network.
In general, the professional names and e-mail addresses were easily found, with the exception of a few small municipalities which the websites did not contain detailed information regarding the responsible department for climate action plans neither professionals’ names
Do mitigation plans come true? An analysis of the implementation of mitigation actions by European cities and the influence of governance factors.
35
and contacts. In these few cases, a contact request was sent to a general e-mail address of the municipality.
In order to increase the response rate, the invitation mentioned Covenant of Mayors’ endorsement to the research and promised to send the results of the study to the participants as soon as the analysis is concluded. Furthermore, the professionals invited to participate in the study received a reminder message five days before the deadline to answer the questionnaire. The invitations were sent from July 05 to 26, and the time limit to answer the questionnaire was always informed as being two weeks from the day in which the invitation was sent. Hence, the deadline was not the same for all the cities. Since the invitations were sent during the vacation period in Europe, there were several automatic responses informing that the professional contacted was out of office. Therefore, the cities that did not answer the questionnaire by 29 July received a new invitation claiming that the deadline was postponed to 05 August because of the vacation period.
A few contacts were not able to open the link of the questionnaire, which was administered through the typeform.com. In these cases, an off-line form of the questionnaire was sent to the contacts. This problem was identified during the last few days of the research. It is not known how many contacts were not able to access the questionnaire in total, and the late acknowledgment of the situation did not allow to make adjustments on time, which might have impacted on the response rate.
3.4.1 Sample size and selection As mentioned in the Research Strategy, the criteria for the sample selection requires that the cities have developed a climate action plan and monitored its implementation. Although cities worldwide are undertaking measures to mitigate climate change, there is lack of information regarding the extent to which the implementation is monitored. Through online platforms such as Carbonn, C40 Cities, and CDP, cities inform the status of implementation of isolated measures, which are not necessarily related to targets to reduce emissions or execution deadlines. Differently, the database of the Covenant of Mayors contains monitoring reports of Sustainable Energy Action Plans developed by the local government of several European cities in order to reduce GHG emission by 2020 and 2030. Since the SEAPs have clear targets and deadlines, and several European cities have published the monitoring reports of such plans (which are in process of verification by the European Commission’s Joint Research Centre), the cities selected for this study are signatories of the Covenant of Mayors. However, it is important to highlight that the European cities with less than 50,000 inhabitants that published the SEAPs monitoring reports are mainly from Italy, which are not representative of the whole European context. Therefore, the sample selection excluded European cities with less than 50,000 inhabitants. The sample comprises European cities with the following characteristics:
1. The city is member of Covenant of Mayors 2. The city has more than 50,000 inhabitants 3. The city adopted a target to reduce GHG emissions by 2020, at least 4. The city developed and monitored a Sustainable Energy Action Plan 5. Monitoring information of the city’s SEAP is available on the section “Signatories” of
Covenant of Mayor’s website
Do mitigation plans come true? An analysis of the implementation of mitigation actions by European cities and the influence of governance factors.
36
This purposive method guarantees that only cities that have developed and monitored the Sustainable Energy Action Plan are selected for the sample, and, therefore, are knowledgeable concerning the factors that influence the implementation of mitigation actions. However, it limits the cities evaluated in the study by excluding European cities with less than 50,000 inhabitants and also cities that are not signatories of the Covenant of Mayors.
Figure 8 presents the location of all the 113 cities selected for the study. The list of cities is available on Annex I.
Figure 8: Map of the sample - 113 European cities selected for the study
3.5 Reliability and validity In order to achieve the internal validity of the research, variables and indicators used to measure the concepts of local climate governance and implementation of urban-scale mitigation actions derive from academic studies. Furthermore, the sample is selected in a purposive way, in which only European cities that developed and monitored Sustainable Energy Action Plans are analysed. Although this purposive selection excludes European
Do mitigation plans come true? An analysis of the implementation of mitigation actions by European cities and the influence of governance factors.
37
cities without available data for SEAPs monitoring reports, on the other hand, it also decreases the risk of selection bias and ensures that the sample is representative.
As mentioned before, the research methods adopted are secondary data, based on Covenant of Mayors’ dataset. In order to increase the reliability of the secondary data, the questionnaire asked respondents to confirm the information provided by CoM’s dataset and to provide the correct information in case of disagreement. Moreover, the secondary data is open sourced and provided by European cities themselves. Another concern of the research is to what extent cities have information regarding the abatement potential of their mitigation plans and actions. When this information is acknowledged, it is indicated on CoM’s dataset. However, CoM’s dataset lacks this information for several cities of the sample, and the cities that publish this information do not provide the abatement potential for all the actions. Therefore, the estimated abatement potential of each sector used in this study is based on academic literature.
3.6 Data analysis methods Both the primary and secondary data collected are analysed using statistical software Microsoft Excel and SPSS. In order to answer the research questions, and address the research objectives, descriptive statistical is used as the main data analysis method.
Do mitigation plans come true? An analysis of the implementation of mitigation actions by European cities and the influence of governance factors.
38
Chapter 4: Analysis
This chapter presents the analysis of the data collected and its main findings. As explained in the third chapter, primary data was collected from the Covenant of Mayors website and it concerns the characteristics of the European cities on the sample as well as information related to the monitoring report of their Sustainable Energy Action Plans. The secondary data analysed was collected through questionnaires and it is related to the governance factors that influence the implementation of SEAPs’ mitigation measures. Academic literature was consulted to estimate the abatement potential of mitigation actions per sector. The main characteristics of the European cities in the sample are addressed in Chapter 4.1. The analysis shows that the sample consists of 113 cities of 23 European countries. Most of the cities are located in Italy (27), Spain (24), Portugal (11), and Sweden (11).
Chapter 4.2 presents the status of implementation of mitigation actions undertaken by the European cities. It shows that 58% of the mitigation actions are being implemented, while the other half is divided into completed and not started actions. The general and sectoral factors that influence the implementation of mitigation actions are analysed in Chapter 4.3.
Chapter 4.3.2 analyses the factors that influence all types of mitigation actions. It finds that political authority and the inclusion of the mitigation policies in the city’s budget appear as the main drivers of implementation, while the main barriers are lack of staff dedicated to climate change issues, and the fact that climate change mitigation is not mainstreamed among other government’s departments. The findings corroborate with previous studies (Aylett, 2015, Salon, Murphy, et al., 2014, Betsill, 2001, Romero-Lankao, 2012, Bulkeley and Betsill, 2003, Bulkeley, Schroeder, et al., 2009). The availability of knowledge and information regarding mitigation at the local level is both considered as a main driver and a main barrier. This result disagrees with previous studies, in which information availability showed to be irrelevant in terms of advancing sustainable policies (Salon, Murphy, et al., 2014), or that this factor is more influential when it comes to adaptation (Bulkeley, Schroeder, et al., 2009, Bulkeley and Betsill, 2003). Chapter 4.3.3 presents the analysis of the critical factors of implementation in each of the nine sectors of the plan, and shows that the drivers are similar among sectors, while the barriers are distinct. In two-thirds of the sectors, it is essential that the mitigation actions are aligned with the cities’ priorities and with national policies. On the other hand, the most common barriers to implementation across sectors are the resistance of the private sector and the lack of co-benefits. Furthermore, the analysis highlights that the mitigation actions related to local electricity production have the highest potential to reduce emissions, but are the least implemented by European cities, mainly because of the interactions between the local and the national governments.
In both general and sectoral factors, the indicators are highly rated as drivers instead of barriers.
Do mitigation plans come true? An analysis of the implementation of mitigation actions by European cities and the influence of governance factors.
39
4.1 Sample of European cities
4.1.1 Location and size of selected cities As mentioned in Chapter 3, all the selected European cities are signatories of the Covenant of Mayors for which there is available information online regarding the status of implementation of Sustainable Energy Action Plans (SEAPs). The sample consists of 113 cities of 23 European countries. Most of the cities are located in Italy (27) and Spain (24), followed by Portugal (11) and Sweden (11). The list with the name and country of all cities is available in Annex I. Regarding size of the population, the smallest city in the sample is Città di Collegno, in Italy, which has 50,185 inhabitants; while the largest city is Berlin, in Germany, with 3,439,132 inhabitants.
Table 7: 10 largest European cities in the sample / Table 8: 10 smallest European cities in the sample
The sample comprises:
• 87 cities with population from 50,000 to 250,000 (defined in this study as “medium cities”);
• 13 cities with population between 250,000 and 500,000 (defined as “large cities”); • 13 cities with population over 500,000 inhabitants (defined as “extra large cities”).
The definitions “medium”, “large”, and “extra large” cities are used by the Covenant of Mayors’ dataset to define the cities by the size of the population. This study is also using these definitions to differentiate cities by population’s size, and to favour comparisons among them.
Do mitigation plans come true? An analysis of the implementation of mitigation actions by European cities and the influence of governance factors.
40
4.1.2 Targets to reduce GHG emissions, and adhesion to CoM
All the cities of the sample adopted targets to reduce GHG emissions by 2020. Manresa, in Spain, is the only city that also adopted reduction targets for the year 2030. Concerning the percentage of the targets, 44 cities adopted a target percentage of 20%. Växjö, in Sweden, is the city with the biggest target (65%). It is important to highlight that both the target year of 2020 and the target percentage of 20% are the minimum year and percentage accepted to become a signatory of the Covenant of Mayors.
Almost one-third of the cities (32) joined Covenant of Mayors in 2008. Other years with large adhesions are 2009 and 2011 (25 cities each), followed by 2011 (25 cities). Only seven cities of the sample joined CoM in 2012, and 2 in 2013. This low adhesion in recent years is explained by the purposive selection of this study, whereas only cities in the stage of monitoring the results of their Sustainable Energy Action Plans were selected.
Table 9: Description of the sample
4.1.3 Questionnaire respondents by jurisdiction
All 113 European cities were invited to participate in the questionnaire. The response rate of the questionnaire is 33,6%, with a total of 38 responses. Out of the responses, 27 are from medium sized cities (31% of medium-cities in the sample), 5 from large cities (38% of large cities in the sample), and 7 from extra large cities (46% of extra large cities in the sample). Chart 1 compares the number of respondents and non-respondents for each of the three sizes definitions, and Chart 2 presents the percentage of respondents for each group, based on the total number of responses.
Do mitigation plans come true? An analysis of the implementation of mitigation actions by European cities and the influence of governance factors.
41
Chart 1: Respondents by jurisdiction
Chart 2: Percentage of respondents, by jurisdiction
Do mitigation plans come true? An analysis of the implementation of mitigation actions by European cities and the influence of governance factors.
42
4.2 Status of implementation of urban-scale mitigation actions of SEAPs
4.2.1 Frequency of urban-scale mitigation actions by sector The SEAPs’ monitoring reports available on the website of Covenant of Mayors organise the mitigation actions in nine different sectors. The study analyses the frequency of mitigation actions in each sector, and concludes that the sectors with the highest number of mitigation actions are Others (1115 actions) and Transport (998 actions). Industry presents the lowest number of mitigation actions (108 actions).
Chart 3: Frequency of mitigation actions, per sector
Regarding the sector defined as “Others”, the SEAPs monitoring reports available online do not specify the types of mitigation actions that the signatories adopt in this category. Therefore, a question related to this subject was added to the questionnaire. The analysis shows that all the four sectors suggested by Covenant of Mayors (2014) are present in the monitoring reports, such as urban regeneration, waste and wastewater management, tree planting in urban areas, and agriculture and forestry. Furthermore, other types of sectors were added by the respondents.
Do mitigation plans come true? An analysis of the implementation of mitigation actions by European cities and the influence of governance factors.
43
Chart 4: Sectors considered in the section “Others” of the SEAPs
4.2.2 Status of implementation of urban-scale mitigation actions developed by 113 European cities As previously seen in operationalization, Covenant of Mayors’ signatories can report three statuses of implementation for SEAPs’ mitigation actions: “not started”, “ongoing”, and “completed”. In order to understand how the SEAPs of the 133 European cities perform regarding implementation, it was analysed the frequency of mitigation actions in these plans per sector and per status of implementation. Table 10 shows a detailed description of the number of actions and status of implementations per sector. The percentages of “not started”, “ongoing”, and “completed” actions are related to the amount of actions in each status of implementation considering the total number of actions in the sector. The “sector’s frequency in SEAPs” is related to the number of SEAPs that consider measures for that sector. Since each European city developed only one SEAP, it also indicates the quantity of European cities that considered each sector in their plans.
It was found that the total number of mitigation actions for all 113 SEAPs is 5055, out of which more than half of the actions (58%) are being implemented (“ongoing”). For the remaining 42%, half of the actions were fully implemented (“completed”), and the other half did not start yet (“not started”).
It is assumed that the “not started” actions might be at this stage of implementation because of several reasons. For example, the city might plan to start implementation after the monitoring report was published (since the targets of the plans are 2020); or the barriers might delay or prevent the implementation of measures by the local government. In order to better understand the reasons behind this status of implementation, the questionnaire asked the respondents if the mitigation actions described as “not started” did not start because of the barriers they identified in the questionnaire. This question was answered by 33 respondents (86,8% of the total respondents), in which more than half of them (57%) identified the barriers as the reason for the lack of implementation.
Do mitigation plans come true? An analysis of the implementation of mitigation actions by European cities and the influence of governance factors.
44
Table 10: Status of implementation of urban-scale mitigation actions per sector
Chart 5: Status of implementation of urban-scale mitigation actions
The number of actions per status of implementation is further analysed for medium, large, and extra large European cities.
Do mitigation plans come true? An analysis of the implementation of mitigation actions by European cities and the influence of governance factors.
45
4.2.3 Medium European cities: status of implementation of urban-scale mitigation actions
This section presents the SEAPs’ level of implementation and abatement potential of 87 European cities with population between 50k and 250k inhabitants (77% of the sample). According to the monitoring reports, the SEAPs of the medium cities comprehend 3975 mitigation actions (78% of the total of 5055). Of these actions, 57,3% are being implemented, while 22,5% did not start yet, and 20,2% are completed.
Chart 6: Status of implementation of urban-scale mitigation actions of 87 medium European cities (50k – 250k inhabitants)
4.2.4 Large European cities: status of implementation of urban-scale mitigation actions
Thirteen (13) signatories of the sample (11,5%) are classified as large European cities - cities with population between 250k and 500k inhabitants. The analysis of the large cities monitoring reports shows that their SEAPs adopted 649 mitigations actions, which is 12,8% of the total of 5055 mitigation actions. Half of the actions (50,7%) is being implemented, while one-third (33,3%) is completed.
Do mitigation plans come true? An analysis of the implementation of mitigation actions by European cities and the influence of governance factors.
46
Chart 7: Status of implementation of urban-scale mitigation actions of 13 large European cities (250k – 500k inhabitants)
4.2.5 Extra large European cities: status of implementation of urban-scale mitigation actions
Extra large cities have a population larger than 500k inhabitants and represent 11,5% of the sample. The analysis of their monitoring reports shows that there are 431 mitigation actions in these cities’ SEAPs; or, in other words, 8,5% of the total of 5055. Out of the 431 mitigation actions, 76,6% is being implemented, while 12,8% did not start yet, and 10,7% are completed.
Do mitigation plans come true? An analysis of the implementation of mitigation actions by European cities and the influence of governance factors.
47
Chart 8: Status of implementation of urban-scale mitigation actions of 13 extra large European cities
4.3 Influence of governance factors on the implementation of urban-scale mitigation policies and actions
As mentioned in the operationalization, the governance factors that influence implementation concern three variables: local framing, local government capacity, and political actors and factors.
Although local government capacity is related to the government instead of governance, academic studies have approached the government capacity as a condition related to governance within local government (Aylett, 2015, OECD, 2010, Anguelovski and Carmin, 2011). For example, in a quantitative research about climate change adaptation, Aylett (2015) does not differentiate government and governance in order to be able to analyse the institutional governance structures of local government work. The study “positions local government actors within a spectrum of activity and authority that spans multiple scales” (Aylett, 2015, pg. 5). It assumes a definition based on Rhodes (1996), who implies that governance entails authority and resources allocation as enablers of coordinated action. Furthermore, one of the five propositions presented by Stoker (1998, pg. 18) to define the concept characterises governance as “the capacity to get things done”, and “sees government as able to use new tools and techniques to steer and guide”.
This approach is not exclusive of Aylett’s study. Anguelovski and Carmin (2011) consider factors related to government capacity as governance challenges to develop climate action programmes, while the OECD (2010, pg. 186) argues that “local governments’ capacity to implement climate change policies and action plans is closely linked with their regulatory modes or urban governance”, and relates factors such as funding, political authority, knowledge, and staff to local and regional governance obstacles that can constrain the implementation of climate change policies.
Do mitigation plans come true? An analysis of the implementation of mitigation actions by European cities and the influence of governance factors.
48
The indicators of local government capacity adopted in this study are based on the indicators applied by Aylett (2015) with the objective of not only addressing governance aspects outside government, such as the relationships with other levels of government and actors, but also inside government.
The following sections show the main findings regarding the influence of the three variables of local climate governance.
4.3.1 Rating of drivers and barriers to implementation As mentioned in chapter 3, the respondents were asked to rate the extent to which a factor is a driver of or a barrier to implementation through a three-level scale. The rating options for driver were:
• Not a driver: the factor does not influence implementation. • Driver: the factor helps implementation, but the action could be implemented
without it. • Critical driver: the factor is essential, and action would not be implemented without
it.
The rating options for barrier were:
• Not a barrier: the factor does not influence implementation. • Barrier: the factor delays or limits implementation. • Critical barrier: the factor prevents implementation. The action is not implemented
at all.
The responses reported by the 38 participants are analysed through descriptive statistical methods, and the difference among medium, large, and extra large cities are explored.
Furthermore, the questionnaire was divided into two parts: general factors, and sectoral factors. This structure is also used to present the analysis of the collected primary data.
4.3.2 Factors that influence the implementation of all types of urban-scale mitigation actions
Critical drivers and barriers
The first key finding is that the three factors considered as the main critical drivers to implementing mitigation actions are related to one variable: local government capacity.
As expected, all the cities stated that they have political autonomy to implement mitigation actions, and 71% reported that this is a critical driver to implementation. The group of large European cities has the highest percentage of respondents reporting political autonomy as a critical driver (80%).
Another critical driver for half of the respondents is the inclusion of the actions in the city’s budget (51%) and having sufficient knowledge and information regarding climate change mitigation at the local level (50%), which is related to urban-scale solutions to reduce GHG emissions. While the budgetary condition seems to be a most critical driver for extra large
Do mitigation plans come true? An analysis of the implementation of mitigation actions by European cities and the influence of governance factors.
49
cities (reported as a critical driver by 67% of extra large cities), the availability of knowledge is more relevant for the large ones (reported as a critical driver by 60% of large cities).
While the main general drivers are clustered in the local government capacity variable, the main general barriers are dispersed among all three variables.
According to the analysis, the two main critical barriers are the lack of knowledge and information regarding climate change mitigation at the local level and the fact that climate change mitigation is not mainstreamed among the agenda of other government’s departments (at 11% each).
Although all groups of cities reported not having sufficient knowledge (at 27%), it is considered a critical barrier only by medium cities (at 15% of respondents in this group). The same is noticed for the factor of not mainstreaming climate change: although 34% reported not mainstreaming CC among other departments, the only group that considered this factor as a critical barrier is the medium cities (reported by 15% of medium cities). Other critical barriers are the lack of staff or staff time dedicated to climate change, and lack of support received from/through networks of cities to implement actions (at 8% each). Lack of staff is reported as a critical barrier by 7% of medium cities and by 20% of large ones. On the other hand, the group of medium cities is the only group that considers the lack of support from/through networks of cities as a critical barrier to implementation (reported by 11% of medium cities). In conclusion, as showed by Chart 9, the most critical factors (the ones that are essential to implementation and can constrain the execution of measures in case they are not in place) are:
• Political autonomy • Knowledge about climate change mitigation at the local level • Inclusion of mitigation actions in the city’s budget
Chart 9: General governance factors that influence the implementation of urban-scale mitigation actions
*Not influential: sum of the responses related to “not a driver” and “not a barrier”.
Do mitigation plans come true? An analysis of the implementation of mitigation actions by European cities and the influence of governance factors.
50
Drivers and barriers Responses show that the access to external funds, an indicator of local government capacity, is the main driver for 57% of the respondents. It is followed by financial autonomy, the presence of a political leader that promotes climate change, and the support received from/through networks of cities (39% for each) – which is also the factor with the highest percentage of respondents stating that it is not a driver of or a barrier to implementation (29%). All large and extra large cities that participated in the questionnaire reported having access to external funds and financial autonomy, while 81% of medium cities have access to external funds, and 70% of them reported to have financial autonomy.
The access to external funds seems more relevant for large cities, once 40% of them ranked this factor as a driver for implementation. On the other hand, the financial autonomy is ranked as a driver by all large cities (100%), half of extra large (50%), and 26% of medium cities – although it is considered a critical driver for 40% of medium cities, and 33% of extra large cities. The presence of a political leader and the support received from/through networks of cities received similar ratings across the groups of cities. Differently from the main critical drivers (in which the main factors are related to local government capacity), the drivers of implementation are also linked to the political actors and factors variable. This result shows that not only the capacity of the local government but also the political context and the participation in networks are drivers – although not critical ones – to implementing mitigation actions.
In overall, the extent to which the factors are reported as barriers range from 0% to 18%; however, there is one discrepant result: the extent to which lack of staff is reported as a barrier (52%). This factor is not only one of the main critical barriers, as previously showed, but is also responsible for preventing or limiting the implementation of SEAPs’ mitigation actions. Lack of staff shows to be more significant for medium and large cities (reported as a barrier by 56% of medium cities and by 60% of large cities), but it also affects extra large ones (reported as a barrier by 33% of extra large cities). Not mainstreaming climate change, which is among the main critical barriers, is also one of the main barriers as reported by 18% of respondents. None of the extra large cities reported this factor as a barrier; however, it is ranked as a barrier by 19% of the medium cities and 40% of the large ones. European cities also consider the lack of political leader promoting climate change as a barrier that limits or prevents the implementation of mitigation actions (at 18%), presenting similar results across the different groups of cities.
In conclusion, as previously showed by Chart 9, the top factors considered to be important for implementation (although not critical) are:
• Access to external funds • Sufficient staff or staff time dedicated to climate change • Presence of political leader promoting climate change agenda
Do mitigation plans come true? An analysis of the implementation of mitigation actions by European cities and the influence of governance factors.
51
4.3.3 Governance factors that influence the implementation of urban-scale mitigation actions in each sector
As mentioned in operationalization, SEAPs’ mitigations actions are organised into nine sectors. During data collection, it was noticed that the mitigation actions adopted by different cities do not necessarily relate to all of the nine sectors. For example, the SEAP developed by the city of Lund (SE) considers mitigation actions for seven sectors. Therefore, the questionnaire asked the respondents to answer only the sectoral questions related to the sectors contemplated in the SEAP of their cities. In the following analysis, the percentage of responses for each sector is based on the number of respondents for the sector (and not on the total number of respondents for the whole questionnaire).
Furthermore, the analysis concerning the sectoral indicators of the variable Political actors and factors is exceptionally different. The questionnaire asked the respondents to rate the position of three actors (the national government, the private sector, and the civil society) regarding the implementation of mitigation actions as “neutral”, “resists”, or “supports”. As mentioned in Chapter 3, only the respondents who answered “resists” and “supports” were redirected to the questions related to the extent to which the actors are drivers of (in the case of “supports”) and barriers to (in the case of “resists”) implementation. Therefore, the respondents who answered “neutral” did not rate the extent to which the actor is a driver for or a barrier to implementation. In the analysis of these indicators, the percentage of responses for each actor is based on the number of respondents that answered both “supports” and “resists”, and excludes the responses related to “neutral” position; and, hence, does not consider the total number of respondents of the sector, as the other indicators.
4.3.3.1 Overall findings concerning sectoral factors Not influential
The six sectoral factors are related to two variables: local framing, and political actors and factors. The extent to which the factors were reported as “not a driver” and “not a barrier” represent the extent to which the factors are “not influential” to implementation since they neither help nor constrain the execution of measures.
The analysis of the indicators related to the variable political actors and factors is conducted in two parts. First, Chart 10 presents the extent to which the actors are reported as having a “neutral” position in relation to the implementation of mitigation measures, and also the percentage of respondents that recognise that the actors “support” or “resist” implementation. This analysis is related to the first question of the questionnaire regarding actors, in which the respondents were asked to inform the position of the actors regarding the implementation of mitigation measures in each sector. As mentioned in Chapter 3, when the respondents answered that the actor “supports” or “resists” implementation, they were directed to a question concerning the extent to which this support or resistance is a driver or barrier to implementation. For “neutral” position answers, the respondents were directed to the next question and would not evaluate the influence (driver or barrier) of that actor on implementation. Hence, “neutral” position does not mean that the actor does not influence implementation.
Second, Chart 11 shows the extent to which the actors are rated as “not a barrier” and “not a driver” among the respondents that reported the position of the actors as “supports” and
Do mitigation plans come true? An analysis of the implementation of mitigation actions by European cities and the influence of governance factors.
52
“resists” implementation, which is presented with the indicators of the variable local framing, based on the total number of respondents.
Chart 10: Overall position of actors concerning the implementation of mitigation actions
The civil society is significantly more likely to be reported as having a “neutral” position concerning the implementation of mitigation actions than other actors, at 46% of respondents. Moreover, even when the civil society supports or resists the implementation of measures, its influence is not considered to be influential by 12% of the European cities, as showed by Chart 11. On the other hand, the national government seems to be the most influential among the three actors analysed, presenting the lowest rating as “neutral” (at 20% of respondents) and “not influential” (8,25% of respondents that reported that the national government “supports” and “resists” the implementation of mitigation measures). The extent to which the actors are reported as “neutral”, “supporters” and “resistors” of implementation of mitigation measures is similar among the nine sectors, with few exceptions. In Industry and Other sectors, none of the three actors are reported as “resistors” of implementation. Furthermore, in the Local Electricity Production, the private sector is the main “supporter” (instead of the national government, as in other sectors). In fact, the national government is the main resistor for this sector. Annex III presents how the positions of actors are reported in each sector.
Overall, among all sectors and all indicators, the presence of co-benefits (socio-economic and/or environmental benefits at the local level) and the alignment with national policies are considered as the least influential factors, reported as “not a barrier” and “not a driver” by 16% and 13% of respondents, respectively.
Do mitigation plans come true? An analysis of the implementation of mitigation actions by European cities and the influence of governance factors.
53
Chart 11: Sectoral governance factors that influence the implementation of urban-scale mitigation actions
*Not influential: sum of the responses related to “not a driver” and “not a barrier”.
**The percentage of responses for “position of the civil society”, “position of the private sector”, and “position of the national government” are based on respondents that classified the position of these actors as “support” and “resist” implementation. Therefore, respondents that classified the position of these actors as “neutral” are excluded.
Drivers and critical drivers
Chart 11 shows the overall rating of the factors across sectors, while Chart 12 presents the extent to which the factors are rated as drivers in each of the nine sectors. In Chart 12, the percentages are calculated based on the number of respondents of each sector. However, the percentages of the three factors concerning the support of actors are calculated based on the number of respondents that informed the actors as “supporters” and “resistors”. The number of respondents for each sector and actor is available in Annex 4.
Overall, the fact that mitigation actions are aligned with national policies and cities’ priorities, and have the support from the national government not only help implementation but are also considered to be essential to implementing the actions at first place.
• Alignment with city's priorities and goals is a critical driver for 30% of the respondents, and a driver for 51%
• Support from the national government is a critical driver for 28% of the respondents that reported the position of this actor as “supports” and “resists”, and a driver for 55%
• Alignment with national policies is a critical driver for 25% of the respondents, and a driver for 55%
These results are generally stable among different sectors and groups of cities. However, there are variances in the extent to which the factors are reported as critical drivers in each sector and by different groups of cities, which are further addressed from the Chapter 4.3.2.2.
Do mitigation plans come true? An analysis of the implementation of mitigation actions by European cities and the influence of governance factors.
54
Chart 12: Governance factors that act as drivers of implementation of mitigation actions, per sector
Do mitigation plans come true? An analysis of the implementation of mitigation actions by European cities and the influence of governance factors.
55
Barriers and critical barriers As mentioned, the six sectoral factors are related to two variables: local framing, and political actors and factors. Chart 13 presents the extent to which the factors are rated as barriers in each of the nine sectors. The percentages are calculated based on the number of respondents of each sector. However, the percentages of the three factors concerning the resistance of actors are calculated based on the number of respondents that informed the actors as “supporters” and “resistors”. The number of respondents for each sector and actor is available in Annex 4.
Differently from the sectoral drivers – in which there is not a major difference between the two variables – the factors related to the variable political actors and factors are slightly more likely to be rated as barriers than the factors related to local framing. Since the extent to which the factors were rated as barriers is very low in comparison to drivers, the analysis of how each indicator performed as a whole does not seem to be relevant. Nevertheless, a few general conclusions are shared to highlight the small differences in ratings among indicators. Regarding the factors that prevent implementation, the resistance of the private sector and the national government and the lack of alignment with national policies were the factors most rated as critical barriers and barriers, as presented by Chart 11.
• Resistance of the private sector is a critical barrier for 3% of the respondents that reported the position of this actor as “supports” and “resists”, and a barrier for 9%
• Resistance of the national government is a critical barrier for 2% of the respondents that reported the position of this actor as “supports” and “resists”, and a barrier for 7%
• Lack of alignment with national policies is a critical barrier for 2% of the respondents, and a barrier for 5%
The extent to which the factors are reported as critical barriers in each sector and by different groups of cities is further addressed from the Chapter 4.3.2.2.
Do mitigation plans come true? An analysis of the implementation of mitigation actions by European cities and the influence of governance factors.
56
Chart 13: Governance factors that act as barriers of implementation of mitigation actions, per sector
Do mitigation plans come true? An analysis of the implementation of mitigation actions by European cities and the influence of governance factors.
57
4.3.3.2 Influence of governance factors on the implementation of urban-scale mitigation actions related to Municipal Buildings
In Municipal Building’s sector, the two governance factors that seem to be the least influential concerning the implementation of mitigation measures are the position of the civil society, and co-benefits (rated as “not a driver” and “not a barrier” by 28% and 22% of respondents, respectively). On the other hand, the most influential factors are the position of the national government and the alignment of mitigation actions with city’s priorities (rated as “not a driver” and “not a barrier” by only 6% of respondents, each). Moreover, the position of the national government is not only highly influential but it also seems to be essential to implementation, since this factor was rated as a critical driver by 45% of respondents, although it was not considered to be a critical barrier by any respondent. Other critical drivers are the fact that mitigation actions are aligned with national policies (35%) and with city’s priorities (32%).
Municipal Buildings - Main critical drivers:
• Support of the national government (rated as a critical driver by 45%) • Alignment with national policies (rated as a critical driver by 35%) • Alignment with city’s priorities (rated as a critical driver by 32%)
The alignment with city’s priorities is not considered a critical driver for implementation by any large European city – which is also the only group of cities that ranked this factor as not a driver of implementation (reported by 20% of large cities). Furthermore, generating co-benefits is also not considered a critical driver for large cities, and reported as not a driver by 40% of the cities in this group.
To a lesser extent, the governance factors are rated as a barrier and a critical barrier by the respondents. Although the lack of alignment with city’s priorities was the factor most rated as a barrier by respondents (at 11%) in this sector, it is not considered to be a critical barrier. Contrarily, the main critical barrier to implementing mitigation actions is the position of the civil society (at 6% of responses), and the position of the private sector (at 5%). Municipal Buildings – Main critical barriers and barriers:
• Lack of alignment with city’s priorities (rated as a critical barrier by 3%, and a barrier by 11%)
• Resistance of the private sector (rated as a critical barrier by 5%, and a barrier by 5%) • Lack of alignment with national policies (rated as a critical barrier by 3%, and a
barrier by 3%)
The lack of alignment with city’s priorities seems more relevant to medium and large cities since it is reported as a barrier by 15% of medium cities, and as a critical barrier by 20% of large cities. The resistance of the private sector is reported as a critical barrier and a barrier only by medium cities (ranked by 4% of medium cities, each). On the other hand, the lack of alignment with national policies is reported as a factor that prevents implementation of mitigation actions (critical barrier) by 20% of large cities.
Do mitigation plans come true? An analysis of the implementation of mitigation actions by European cities and the influence of governance factors.
58
Chart 14: Governance factors that influence the implementation of mitigation actions related to Municipal Buildings
*Not influential: sum of the responses related to “not a driver” and “not a barrier”.
**The percentage of responses for “position of the civil society”, “position of the private sector”, and “position of the national government” are based on respondents that classified the position of these actors as “support” and “resist” implementation. Therefore, respondents that classified the position of these actors as “neutral” are excluded.
4.3.3.3 Influence of governance factors on the implementation of urban-scale mitigation actions related to Tertiary Buildings
According to the responses, the governance factors that seem to be the most influential concerning the implementation of mitigation measures in this sector are the position of the civil society and the position of the private sector, rated as “not a driver” and “not a barrier” by only 5% and 7% of respondents, respectively.
The support of the private sector and the national government to implementing mitigation actions are among the top 3 critical drivers, at 24% and 23%, respectively. Other significant critical driver in this sector is the alignment of mitigation policies to national orientation (23%).
Tertiary Buildings – Main critical drivers:
• Support of the private sector (rated as a critical driver by 24%) • Support of the national government (rated as a critical driver by 23%) • Alignment with national policies (rated as a critical driver by 23%)
Large European cities reported the support of the private sector as a critical driver to implementing mitigation actions related to tertiary buildings (at 40% of large cities), while the same factor is rated as a critical driver by only 14% of the medium sized cities, and by none of the extra large ones. The support of the national government seems more relevant to extra large cities, since it was reported as a critical driver by half (50%) of the respondents in this group. Furthermore, the resistance of the private sector is one of the main barriers to implementing mitigation actions related to the Tertiary Buildings (rated as a barrier by 14% of respondents,
Do mitigation plans come true? An analysis of the implementation of mitigation actions by European cities and the influence of governance factors.
59
and as a critical barrier by 5%). The fact that mitigation actions do not generate co-benefits is ranked as a critical barrier by 3% of respondents.
Tertiary Buildings - Main critical barriers and barriers:
• Resistance of the private sector (rated as a critical barrier by 5%, and a barrier by 14%)
• Lack of co-benefits (rated as a critical barrier by 3%, and a barrier by 3%) • Lack of alignment with city’s priorities (rated as a barrier by 16%)
The resistance of the private sector and the lack of co-benefits are ranked as barriers only by medium cities – resistance of the private sector is reported as a barrier by 14% of medium cities, and as a critical barrier by 5%; while lack of co-benefits is reported as a critical barrier by 5% of medium cities. On the other hand, the fact that mitigation actions are not aligned with city’s priorities is a barrier to implementation for 25% of extra large cities, 20% of large cities, and 14% of medium cities. Chart 15: Governance factors that influence the implementation of mitigation actions related to Tertiary Buildings
*Not influential: sum of the responses related to “not a driver” and “not a barrier”.
**The percentage of responses for “position of the civil society”, “position of the private sector”, and “position of the national government” are based on respondents that classified the position of these actors as “support” and “resist” implementation. Therefore, respondents that classified the position of these actors as “neutral” are excluded.
4.3.3.4 Influence of governance factors on the implementation of urban-scale mitigation actions related to Residential Buildings
In this sector, three governance factors were considered to be 100% influential concerning the implementation of mitigation actions, since they were not rated as “not a driver” and “not a barrier” by any of the respondents. The most influential factors are the alignment of mitigation actions with national policies, the position of the civil society, and the position of the national government. Furthermore, these factors were also considered to be the most critical drivers of implementation. The support received from the private sector and the civil society were rated
Do mitigation plans come true? An analysis of the implementation of mitigation actions by European cities and the influence of governance factors.
60
as a critical driver by 33% of respondents, each; while the alignment with national policies was considered a critical driver by 29%.
Residential Buildings – Main critical drivers:
• Support of the private sector (rated as a critical driver by 33%) • Support of the civil society (rated as a critical driver by 33%) • Alignment with national policies (rated as a critical driver by 29%)
Although rated as one of the main critical drivers, the alignment with city’s priorities is not reported as a critical driver by any of the extra large cities. While the support of the private sector seems more important for large cities (reported as a critical driver by 40% of the cities in this group), the support from the civil society is not reported as a critical driver by any city of this group. In Residential Buildings, there are three clear main barriers: the resistance of the private sector, the lack of alignment with city’s priorities, and the lack of co-benefits. Residential Buildings – Main critical barriers and barriers:
• Resistance of the private sector (rated as a critical barrier by 5%, and a barrier by 10%)
• Lack of co-benefits (rated as a critical barrier by 3%, and a barrier by 6%) • Lack of alignment with city’s priorities (rated as a critical barrier by 3%, and a barrier
by 6%)
For 20% of large cities, the lack of alignment with city’s priorities is a critical barrier to implementation. Similar to Municipal Buildings, the resistance of the private sector is reported as a barrier and a critical barrier only by medium cities (at 9% and 5% of cities in this group, respectively). Moreover, this is also the only group that reporter lack of co-benefits a critical barrier (at 5% of cities in this group). Chart 16: Governance factors that influence the implementation of mitigation actions related to Residential Buildings
*Not influential: sum of the responses related to “not a driver” and “not a barrier”. **The percentage of responses for “position of the civil society”, “position of the private sector”, and “position of the national government” are based on respondents that classified the position of these actors as “support” and “resist” implementation. Therefore, respondents that classified the position of these actors as “neutral” are excluded.
Do mitigation plans come true? An analysis of the implementation of mitigation actions by European cities and the influence of governance factors.
61
4.3.3.5 Influence of governance factors on the implementation of urban-scale mitigation actions related to Public Lighting
Public Lighting is one of the sectors in which the governance factors are highly reported as “not influential” in comparison to others. The position of the civil society and co-benefits are considered as the least influential concerning implementation, being reported as “not a driver” and “not a barrier” by 22% and 20% of respondents, respectively. Nonetheless, the fact that mitigation actions are aligned with city’s priorities is considered to be the most influential on the implementation of such measures, reported as “not a driver” and “not a barrier” by only 9% of respondents. In fact, this factor is the most rated as a critical driver of implementation, at 34% of responses. Other significant governance factors are the support of the national government and the alignment with national policies, reported as a critical driver by 29% of respondents, each. Public Lighting – Main critical drivers:
• Alignment with city’s priorities (rated as a critical driver by 34%) • Support of the national government (rated as a critical driver by 29%) • Alignment with national policies (rated as a critical driver by 29%)
Alignment with national policies is not a critical driver for large cities. On the other hand, half (50%) of the extra large cities consider the alignment with national policies and the support of national government as the two main critical drivers of implementation. The main factors that act as barriers to implementing mitigation actions related to Public Lighting are the resistance of the national government and the private sector, as well as the lack of co-benefits.
Public Lighting – Main critical barriers and barriers:
• Resistance of the private sector (rated as a critical barrier by 5%, and a barrier by 5%) • Resistance of the national government (rated as a critical barrier by 4%, and a barrier
by 7%) • Lack of co-benefits (rated as a critical barrier by 3%, and a barrier by 3%)
All three indicators are reported as barriers and critical barriers only by medium cities.
Do mitigation plans come true? An analysis of the implementation of mitigation actions by European cities and the influence of governance factors.
62
Chart 17: Governance factors that influence the implementation of mitigation actions related to Public Lighting
*Not influential: sum of the responses related to “not a driver” and “not a barrier”.
**The percentage of responses for “position of the civil society”, “position of the private sector”, and “position of the national government” are based on respondents that classified the position of these actors as “support” and “resist” implementation. Therefore, respondents that classified the position of these actors as “neutral” are excluded.
4.3.3.6 Influence of governance factors on the implementation of urban-scale mitigation actions related to Industry
In the Industry sector, the governance factors related to the variable local framing are highly rated as “not influential” to the implementation of mitigation actions, while the factors related to the variable political actors and factors are considered to be 100% influential. Furthermore, the factors are rarely rated as a barrier or critical barrier.
In overall, the main critical drivers of Industry are the support received from the private sector and the national government, as well as the alignment with national policies and city’s priorities. Industry – Main critical drivers:
• Support of the private sector (rated as a critical driver by 38%) • Support of the national government (rated as a critical driver by 22%) • Alignment with national policies (rated as a critical driver by 21%) • Alignment with city’s priorities (rated as a critical driver by 21%)
The support received from the private sector is only reported as a critical driver by medium cities (at 33% of the medium cities); while the support received from the national government is considered as critical to implementation by large and extra large cities (at 33% and 50% of cities in these groups, respectively). Furthermore, extra large cities do not consider the alignment with national policy as a critical driver of implementation. The alignment with city’s priorities is not ranked as a critical driver by any large or extra large city. In the Industry sector, the lack of co-benefits is the only factor reported as a critical barrier, being ranked as so by 11% of medium cities. None of the six factors were reported as barriers to implementation.
Do mitigation plans come true? An analysis of the implementation of mitigation actions by European cities and the influence of governance factors.
63
Industry – Main critical barrier:
• Lack of co-benefits (rated as a critical barrier by 7%)
Chart 18: Governance factors that influence the implementation of mitigation actions related to Industry
*Not influential: sum of the responses related to “not a driver” and “not a barrier”.
**The percentage of responses for “position of the civil society”, “position of the private sector”, and “position of the national government” are based on respondents that classified the position of these actors as “support” and “resist” implementation. Therefore, respondents that classified the position of these actors as “neutral” are excluded.
4.3.3.7 Influence of governance factors on the implementation of urban-scale mitigation actions related to Transport
Regarding the implementation of mitigation actions in the Transport sector, the fact that these actions are aligned with the city’s priorities, and the position of the national government are considered the most influential factors. In fact, these factors are so relevant that they are also highly reported as critical drivers to implementation, by 58% and 44% of respondents, respectively. To a lesser extent, the support received from the civil society is also essential to the implementation of mitigation actions.
Transport – Main critical drivers:
• Alignment with city’s priorities (rated as a critical driver by 58%) • Support of the national government (rated as a critical driver by 44%) • Support of the civil society (rated as a critical driver by 38%)
The alignment with city’s priorities is considered a critical driver by all the groups of cities; however, it seems more relevant for the extra large cities since 80% of the respondents in this group reported the factor as a critical driver for implementation. For the large cities, the support received from the civil society is more relevant than the support of the national government to implementing mitigation actions related to Transport – since 60% of the large cities reported the support received from civil society as a critical factor, while none rated the support of national government the same way.
Do mitigation plans come true? An analysis of the implementation of mitigation actions by European cities and the influence of governance factors.
64
Regarding the governance factors that act as obstacles to implementation in this sector, two main barriers are the resistance of the private sector and the lack of co-benefits, which are the only factors reported as a critical barrier by the respondents. Transport – Main critical barriers and barriers:
• Resistance of the private sector (rated as a critical barrier by 5%, and a barrier by 18%)
• Lack of co-benefits (rated as a critical barrier by 4%, and a barrier by 8%) The resistance of the private sector is reported as a critical barrier by 20% of the large cities, and as a barrier by 15% of the medium cities. On the other hand, lack of co-benefits is ranked as a barrier and a critical barrier only by medium cities (at 8% and 4% of medium cities, respectively).
Chart 19: Governance factors that influence the implementation of mitigation actions related to Transport
*Not influential: sum of the responses related to “not a driver” and “not a barrier”.
**The percentage of responses for “position of the civil society”, “position of the private sector”, and “position of the national government” are based on respondents that classified the position of these actors as “support” and “resist” implementation. Therefore, respondents that classified the position of these actors as “neutral” are excluded.
4.3.3.8 Influence of governance factors on the implementation of urban-scale mitigation actions related to Local Electricity Production
The indicators related to the "political actors and factors” variable tend to be generally more influential to the implementation of measures in this sector than the factors related to the “local framing” variable, since they were reported as “not influential” by a smaller number of respondents. On the other hand, the indicators of the “local framing” variable are more frequently reported as a critical driver, however, with small differences among the ratings of both variables.
The main critical drivers of implementation of mitigation actions related to Local Electricity Production are the alignment with national policies (23%) and with city’s priorities (20%), and generating co-benefits (20%).
Do mitigation plans come true? An analysis of the implementation of mitigation actions by European cities and the influence of governance factors.
65
Local Electricity Production – Main critical drivers:
• Alignment with national policies (rated as a critical driver by 23%) • Alignment with city’s priorities (rated as a critical driver by 20%) • Generating co-benefits (rated as a critical driver by 20%)
The responses from medium and extra large cities are similar; however, the extent to which these factors are considered as critical drivers by large cities vary. None of the large cities consider the alignment with national policies and with city’s priorities as critical drivers of implementation. In fact, generating co-benefits and the support of the national government are the only two critical drivers of implementation for large cities in this sector (reported by 20% of large cities, each).
Furthermore, one of the main factors that limit and prevent implementation of measures in this sector is the resistance of the national government, followed by the lack of alignment with national policies and with city’s priorities. Local Electricity Production – Main critical barriers and barriers:
• Resistance of the national government (rated as a critical barrier by 9%, and a barrier by 13%)
• Lack of alignment with national policies (rated as a critical barrier by 7%, and a barrier by 3%)
• Lack of alignment with city’s priorities (rated as a critical barrier by 3%, and a barrier by 10%)
Both factors related to the national government are reported as barriers only by medium cities. The lack of alignment with national policies is rated as a barrier by 14% of medium cities, and as a critical barrier by 10%; while the resistance of the national government is a critical barrier for 10% of medium cities, and a barrier for 5%. The lack of alignment with cities’ priorities is a barrier that prevents implementation (critical barrier) for 20% of large cities, and a barrier that delays or limits implementation for 15% of medium cities.
Do mitigation plans come true? An analysis of the implementation of mitigation actions by European cities and the influence of governance factors.
66
Chart 20: Governance factors that influence the implementation of mitigation actions related to Local Electricity Production
*Not influential: sum of the responses related to “not a driver” and “not a barrier”.
**The percentage of responses for “position of the civil society”, “position of the private sector”, and “position of the national government” are based on respondents that classified the position of these actors as “support” and “resist” implementation. Therefore, respondents that classified the position of these actors as “neutral” are excluded.
4.3.3.9 Influence of governance factors on the implementation of urban-scale mitigation actions related to Local Heat/Cold Production
Overall, in Local Heat/Cold Production the extent to which the factors are rated as critical drivers is low when compared to other sectors. The top critical driver of implementation is the alignment with city’s priorities (25%), followed by the support of the private sector (20%), and generating co-benefits (13%). Local Heat/Cold Production – Main critical drivers:
• Alignment with city’s priorities (rated as a critical driver by 25%) • Support of the private sector (rated as a critical driver by 20%) • Generating co-benefits (rated as a critical driver by 13%)
Similar to what is noticed in Local electricity production, the responses from large cities are different from the medium and extra large cities. Although the three factors mentioned before are considered to be critical drivers in overall, they are not reported as critical drivers by any of the large cities, which do not report any critical driver for this sector. To a lesser extent, the governance factors were also rated as barriers. The main barriers to implementing mitigation actions related to Local Heat/Cold Production are the resistance of the private sector and the national government.
Local Heat/Cold Production – Main critical barriers and barriers:
• Resistance of the national government (rated as a critical barrier by 6%, and a barrier by 6%)
• Resistance of the private sector (rated as a barrier by 13%)
Do mitigation plans come true? An analysis of the implementation of mitigation actions by European cities and the influence of governance factors.
67
Both factors are rated as barriers only by medium cities. According to the responses, the resistance of the national government is identified as a barrier that limits or delays implementation by 4% of medium cities, and that prevents implementation by other 4%. The resistance of the private sector is reported as a barrier by 8% of medium cities.
Chart 21: Governance factors that influence the implementation of mitigation actions related to Local Heat/Cold Production
*Not influential: sum of the responses related to “not a driver” and “not a barrier”.
**The percentage of responses for “position of the civil society”, “position of the private sector”, and “position of the national government” are based on respondents that classified the position of these actors as “support” and “resist” implementation. Therefore, respondents that classified the position of these actors as “neutral” are excluded.
4.3.3.10 Influence of governance factors on the implementation of urban-scale
mitigation actions related to Other sectors
For Other sectors – which include mitigation actions for waste and wastewater management, urban regeneration, tree planting in urban areas, among others – the factors are similarly reported as critical drivers. The four top critical drivers are alignment with city’s priorities, alignment with national policies, generating co-benefits, and support of the private sector, all at 14%. They are followed by support of civil society (10%), and support of national government (5%).
Others – Main critical drivers and drivers:
• Support of the private sector (rated as a critical driver by 25%) • Generating co-benefits (rated as a critical driver by 14%, and a driver by 81%) • Support of the civil society (rated as a critical driver by 14%, and a driver by 79%)
Only medium cities reported generating co-benefits as a critical driver. The main critical drivers for large cities are the support of the private sector and the support of the civil society (reported by 33% of large cities, each). On the other hand, no factor is considered a critical driver for extra large cities. Regarding the extent to which the governance factors are considered to constrain the implementation of measures, the only factor rated as a critical barrier is the lack of alignment
Do mitigation plans come true? An analysis of the implementation of mitigation actions by European cities and the influence of governance factors.
68
with national policies (at 5%), which is also reported as a barrier by 5% of the respondents. However, this factor is considered to be not influential more frequently than it is as a barrier. This result might be explained by the varied options of measures that can be undertaken on the ‘Other sectors’ umbrella, which would affect the way the factors are rated. Furthermore, only one more factor, the lack of alignment with city’s priorities, was also rated as a barrier. Others – Main critical barriers and barriers:
• Lack of alignment with national policies (rated as a critical barrier by 5%, and a barrier by 5%)
• Lack of alignment with city’s priorities (rated as a barrier by 5%) Only medium cities consider the lack of alignment with national policies as a critical barrier to implementation (at 7% of medium cities), while only large cities consider the same factor as a barrier (at 33% of large cities). Similarly, the lack of alignment with city’s priorities is only ranked as a barrier by medium cities (at 7% of medium cities).
Chart 22: Governance factors that influence the implementation of mitigation actions related to Other sectors
*Not influential: sum of the responses related to “not a driver” and “not a barrier”.
**The percentage of responses for “position of the civil society”, “position of the private sector”, and “position of the national government” are based on respondents that classified the position of these actors as “support” and “resist” implementation. Therefore, respondents that classified the position of these actors as “neutral” are excluded. Overall, extra large cities did not report any barriers in the following sectors: Municipal Buildings, Residential Buildings, Industry, Transport, Local Heat/Cold Production, and Others. Among large cities, no barrier was reported for Industry, while medium cities identified barriers in all sectors. The number of cities participating in the questionnaire might explain this pattern since the group of medium cities has the largest number of participants.
Do mitigation plans come true? An analysis of the implementation of mitigation actions by European cities and the influence of governance factors.
69
4.4 Categorisation of sectors by implementation, critical governance factors, and abatement potential (summary of findings)
In order to quickly visualise how the different sectors perform concerning implementation, and to further explore the relation between this performance and the critical factors that act as drivers and barriers, it was calculated the weighted arithmetic mean of implementation for each sector.
Based on the status of implementation, the mitigation actions received different score weights:
• Not started action = score 0 • Ongoing action = score 1 • Completed action = score 2
These scores were applied to all the actions in each sector. This result was then divided by the total number of actions times 2 (which is the highest possible score for the sector). The calculation is illustrated by the following formula, in which Σ1 is the sum of not started actions, Σ2 is the sum of ongoing actions, and Σ3 is the sum of completed actions.
Score of implementation = (Σ1 x 0)+ (Σ2 x 1) + (Σ3 x 2)
(Σ1+ Σ2+ Σ3) x 2
Table 11 shows the ranking of the sectors based on the status of implementation of urban-scale mitigation actions proposed in SEAPs.
Table 11: Raking of sectors based on level of implementation
*Implementation rate: 0 = implementation of all actions did not start; 1.0 = implementation of all actions are complete.
Do mitigation plans come true? An analysis of the implementation of mitigation actions by European cities and the influence of governance factors.
70
As a second step, this categorisation was further developed to facilitate the comparison among sectors. The final classification is available on Table 13. It presents the scores of implementation and the critical governance factors that influence implementation for each sector – factors that are essential to implement actions (critical drivers) or factors that prevent implementation (critical barriers). The categorisation also contains examples of areas of interventions and policies instruments, as mentioned by Covenant of Mayors (2014), and the estimated abatement potential for 2020, as assessed by Erickson, Lazarus, et al. (2013). Regarding the abatement potential of each sector, it is important to highlight that cities are distinct in paths and development, and therefore, the actual potential do reduce emissions of each sector might differ from city to city. Furthermore, the estimated abatement potential of each sector depends on the types of mitigations actions undertaken by local governments. The estimated GHG emissions reduction provided by the online monitoring reports of SEAPs do not specify the amount of reduction per action (only per group of actions, and it is not sure if all actions are contemplated). Therefore, the abatement potential for 2020 used for this categorisation is based on the scientific assessment conducted by Erickson, Lazarus, et al. (2013), which must be interpreted as a rough estimation, presented here in order to give an idea regarding the potential of each sector. According to Erickson, Lazarus, et al. (2013, pg. 42), “these ranges represent average, relative abatement potential across a range of the world’s cities and relative, as well as absolute, potentials in individual jurisdictions may vary”. Table 12 explains the meaning of the rating symbols used in the final categorisation.
Table 12: Scale for rating the abatement potential of urban-scale technologies and practices
Adapted from: Erickson, Lazarus, et al. (2013)
The typology of urban-scale policies and measures developed by Erickson, Lazarus, et al. (2013) describes the abatement potential for each measure, and also the sector-wide abatement potential. As mentioned, the types of mitigation actions undertaken in SEAPs are unknown; therefore, the estimated abatement potential applied to the categorisation considers the sector-wide rating for almost all the sectors. The only exception is Public Lighting, which is not defined as a sector by Erickson, Lazarus, et al., however, it is listed as a measure undertaken in the sector “Residential, Commercial, and Institutional buildings and infra-structure”. Therefore, the abatement potential for Public Lighting is based on the rating of the measure – and not sector-wide, like other sectors. Furthermore, no abatement potential was applied to the sector Others once there is a wide range of mitigation actions that can be undertaken in this sector which precludes the attribution of a range of abatement potential from the typology developed by Erickson, Lazarus, et al. (2013).
Do mitigation plans come true? An analysis of the implementation of mitigation actions by European cities and the influence of governance factors.
71
Table 13: Categorisation of sectors based on implementation of urban-scale mitigation actions, critical governance factors that influence implementation, and abatement potential for 2020
Abatement potential adapted from: Erickson, Lazarus, et al. (2013). Area of intervention and policy instruments adapted from: Covenant of Mayors (2014).
Do mitigation plans come true? An analysis of the implementation of mitigation actions by European cities and the influence of governance factors.
72
Table 13: Continued
Abatement potential adapted from: Erickson, Lazarus, et al. (2013). Area of intervention and policy instruments adapted from: Covenant of Mayors (2014).
Do mitigation plans come true? An analysis of the implementation of mitigation actions by European cities and the influence of governance factors.
73
Chapter 5: Conclusions
This research is one of the first attempts to assess the status of implementation of urban-scale mitigation actions undertaken by European cities, and also to explore how governance factors influence the execution of measures of different sectors – either driving or constraining implementation. These aspects are also related to the average abatement potential of measures by sector, in order to understand if European cities are reaching their highest potential to reduce emissions, and what governance factors influence their performance.
5.1 Status of implementation of urban-scale mitigation actions present in Sustainable Energy Action Plans of European cities
Overall, the Sustainable Energy Action Plans undertaken by the 113 European cities analysed in this study contain 5055 mitigation actions. According to the monitoring report of these cities available online during the period of the study, more than half of the actions (58%) is being implemented while the implementation of the other half is either completed (21.09%) or not started (20.85%). Although large cities present the biggest percentage of completed actions (33%) in comparison to medium cities (20%) and extra-large cities (10%), the study suggests that extra-large cities perform better than others in terms of implementing mitigation actions since 88% of its actions was completed or being implemented, in comparison to 84% of large cities and 80% of medium cities.
Furthermore, the study analyses the implementation rate of mitigations actions undertaken in nine different sectors, with the objective of comparing these sectors in terms of execution. Distinct weights are attributed to not started actions, ongoing actions, and completed actions, and the weighted arithmetic mean of implementation for each sector is calculated. The analysis shows that mitigation actions related to Public Lighting are the most implemented, followed by mitigation actions for Residential Building, Municipal Buildings, and Transport. On the other hand, the study suggests that actions focused on Local Electricity Production, such as wind power, smart grids, and photovoltaic, are the less implemented, followed by mitigation actions related to Industry, Local Heat/Cold Production, and Tertiary Buildings. To further understand the reasons behind the status of implementation of mitigation actions, the study also analyses how the governance factors influence implementation, either acting as drivers or barriers.
5.2 Governance factors that drive or constrain the implementation of urban-scale mitigation actions
The study confirms the influence of all the governance factors in the implementation of mitigation actions as suggested by the academic literature since overall they are rated as “not influential” only a few times and by a low number of respondents. The only exception is the effect of the support received from/through networks of cities on implementation (reported as “not a barrier” and “not a driver” by 29% of respondents); nonetheless, these networks are considered as influential more frequently than they are as not influential. Furthermore, the
Do mitigation plans come true? An analysis of the implementation of mitigation actions by European cities and the influence of governance factors.
74
factors related to the variable Local framing are more likely to be considered as not influential than the factors of the other variables.
There are clear differences among the extent to which the governance aspects are critical to implementation – while certain factors encourage or limit the execution of mitigation policies, the influence of others might be determinant. The findings also suggest that European cities are characterised by a good context of governance since the majority of respondents reported the factors as drivers of implementation, instead of barriers. In the case of a week governance context, the influence of the factors would be negatively influential.
This study organises the governance factors into two categories: the ones that influence the implementation of all types or urban-scale mitigation actions; and the ones that can affect the execution of urban-scale mitigation actions of different sectors in distinct ways (for example, the influence of the private sector’s position might change from sector to sector). The conclusions presented below follow this same structure.
5.2.1 Governance factors that influence the implementation of urban-scale mitigation actions in general
Drivers It is encouraging to see that, in overall, the governance aspects that take place in European cities are strong drivers of implementation of mitigation actions, which might explain the good rate of execution of these type of actions (79% of SEAPs’ mitigation actions are either being implemented or completed). All local governments of this study have the political authority to deploy mitigation policies and actions, and all respondents consider this condition to be a driver of implementation. In fact, according to 71% of respondents, mitigation actions could not be implemented without political authority. This finding confirms the conclusion achieved by a study conducted in other continents, where cities do not have the administrative/political authority. In these regions, lack of authority was considered a challenge to undertake both mitigation and adaptation measures (Aylett, 2015, pg. 11).
Looking at other factors related to the local government capacity, it is clear that financial aspects also play an important role when it comes to implementation of mitigation policies, in accordance with the findings of studies that analyse climate action as a whole (Aylett, 2015, Salon, Murphy, et al., 2014, Betsill, 2001, Romero-Lankao, 2012, Bulkeley and Betsill, 2003, Bulkeley, Schroeder, et al., 2009). However, the only financial aspect highly considered as essential to implementing measures is the inclusion of mitigation policies in city’s budget. Other factors, such as financial autonomy to implement actions and access to external funds encourage implementation, but the majority of respondents agree that actions could be implemented without them. The influence of other factors seems to be more critical to implementation than financial aspects. The capacity of the local governments to acquire knowledge about climate change mitigation at the local level and to mainstream climate change among other departments not only help execution of actions but are essential to implementation, in a way that mitigation policies and actions would not be implemented in case these conditions were not in place. Sufficient knowledge about climate change mitigation is considered as a critical driver for implementation by half (50%) of respondents. This result disagrees with previous studies, in which information availability showed to be irrelevant in terms of advancing
Do mitigation plans come true? An analysis of the implementation of mitigation actions by European cities and the influence of governance factors.
75
sustainable policies (Salon, Murphy, et al., 2014), or that this factor is more influential when it comes to adaptation (Bulkeley, Schroeder, et al., 2009, Bulkeley and Betsill, 2003). Aylett (2015) has shown that acquiring knowledge related to GHG emissions is not one of the main challenges for local governments but does not explore the extent it can encourage implementation. Furthermore, only one study reviewed for this research analysed the effect of mainstreaming climate change among departments of local government on local climate action, and it is focused on adaptation (Aylett, 2015). However, this is a critical driver to implementing mitigation policies for 42% of respondents. Clearly, this factor should be considered when analysing local climate action and added to Ryan’s (2015) framework.
Barriers
Although in overall governance aspects drive the implementation of mitigation actions by European cities, to a lesser extent a few factors can also act as obstacles and even prevent the execution of mitigation policies. The implementation of 21% of SEAPs’ mitigation actions have not started yet, and more than half of respondents agree that the barriers identified through this study are the reason for the lack of implementation. As expected, the main critical drivers of implementation are also the main critical barriers. Lack of knowledge related to climate change, and not mainstreaming CC among other departments of local government are among the most prominent factors that prevent the implementation of mitigation policies, reported as a barrier and a critical barrier by 27% and 28% of respondents, respectively.
However, the main obstacle that European cities face to implement mitigation actions is the lack of staff dedicated to climate change (reported as a barrier and a critical barrier by 61% of respondents). Although it does not seem to prevent implementation as much as the lack of knowledge and not mainstreaming CC, it significantly limits or delays the implementation of mitigation measures. This finding agrees with Salon, Murphy, et al. (2014), in which lack of staff or staff time dedicated to sustainable activities is an obstacle far more relevant than others regarding local government capacity. It is important to highlight that the lack of staff can be related to financial aspects, e.g. lack of funding to hire sufficient staff, as showed by Aylett (2015).
5.2.2 Governance factors that influence the implementation of urban-scale mitigation actions of different sectors
Although it is assumed that urban sectors are characterised by different governance contexts, the study shows that the way in which the factors are drivers to the implementation of mitigation actions are similar among sectors, with a few exceptions. However, when they are rated as barriers, findings are distinct.
As mentioned, in overall the governance factors are highly rated as drivers – instead of barriers –, and a pattern emerged from the answers. In two-thirds of the sectors, it seems to be essential that mitigation policies are aligned with the cities’ priorities and with national policies. However, in the Industry sector, these two factors were highly rated as “not influential”; nevertheless they were more frequently rated as drivers than as not influential. Furthermore, these two factors are critical drivers of implementation, and the mitigation actions wouldn’t be implemented in case these conditions were not in place. Both factors can
Do mitigation plans come true? An analysis of the implementation of mitigation actions by European cities and the influence of governance factors.
76
be related to financial aspects. For example, if mitigation actions are aligned with city’s priorities, they will automatically be considered in the city’s budget and, hence, implemented. However, if this is not the case, there might be a conflict between climate actions and other budget priorities, which can be an obstacle to implementation (Salon, Murphy, et al., 2014). Moreover, mitigation actions aligned with national policies can also be linked with national support (Salon, Murphy, et al., 2014).
Another critical driver is the support of stakeholders, although the stakeholders who are important for the execution of mitigation actions vary among sectors. For example, the support of the national government is essential in sectors such as Municipal Buildings, Public Lighting, and Transport; while the support of the private sector plays a more relevant role in sectors such as Residential Buildings, and Local Heat/Cold Production. Moreover, the support of both the national government and the private sector are relevant in sectors such as Tertiary Buildings, and Industry. This finding agrees with Ryan (2015), who argues that the private sector can be powerful opposition or supporter of implementation. In academic literature, the influence of stakeholders has been addressed (Bulkeley and Betsill, 2003, Bulkeley, Schroeder, et al., 2009, Burch, 2010), with different conclusions regarding how they affect the sectors. Although similar factors act as critical drivers of implementation in different sectors, the opposite is noticed when the factors are rated as critical barriers. The obstacles that prevent implementation of mitigation actions by European cities vary among the sectors. Nevertheless, the resistance of the private sector and the lack of co-benefits are the most common obstacles across sectors.
5.3 Main findings concerning sectors implementation rate, critical drivers and critical barriers, and abatement potential
Sectors with highest implementation rate
Mitigation actions of Public Lighting have the highest implementation rate and medium abatement potential. Urban-scale mitigation actions related to Public Lighting have medium average GHG abatement potential and are the easiest to be implemented by European cities. However, they are among the lowest number of actions present in SEAPs, in overall. The support received from the national government play a fundamental role and is essential to implement actions. Furthermore, if mitigation actions of Public Lighting were not aligned with national policies and with city’s priorities, the implementation would face strong challenges that could prevent the execution (for example, actions could not be considered in the city’s budget).
Mitigation actions of Municipal and Residential Buildings have high implementation rate and medium abatement potential. Municipal and Residential Buildings are among the sectors with the highest number of mitigation actions, which are easily implemented by European cities when compared to actions of other sectors. The fact that mitigations actions are aligned with city’s priorities and with national policies is essential to implementation. While the support of national government seems to be critical for the implementation of Municipal Buildings’ mitigation actions, when it comes to Residential Buildings the private
Do mitigation plans come true? An analysis of the implementation of mitigation actions by European cities and the influence of governance factors.
77
sector and the civil society play a more relevant role, and actions would not be implemented without their support.
Sectors with lowest implementation rate
Mitigation actions of Local Electricity Production have the lowest implementation rate and the highest abatement potential. When compared to other measures, urban-scale mitigation actions of Local Electricity Production have the highest average potential to reduce GHG emissions related to urban areas, but they are also the most difficult to be implemented by local governments of European cities. According to the results, in this sector the relation between the local and the national governments might be critical to implementation – if the mitigation actions are not aligned with national policies, or if the national government does not support the measures, the implementation can be constrained. Furthermore, the resistance of the private sector can also limit or delay implementation of measures of this sector. Nevertheless, the extent to which these factors are reported as barriers to implementation is low, ranging from 10% to 22%, and the results must be interpreted with caution.
Mitigation actions of Industry have low implementation rate and medium abatement potential. In average, urban-scale mitigation actions of Industry have medium potential to reduce GHG emissions related to urban areas. They are not only among the hardest to be implemented by European cities, but they are also the less frequent in SEAPs. The only factor considered as an obstacle to implement mitigation actions related to Industry is the fact that the measures do not offer co-benefits for the city. This result must be interpreted with caution since only 7% of respondents reported this factor as a barrier.
5.4 Discussion and further research This study selected European cities through a purposive approach to guarantee the access of the level of implementation of mitigation actions and ensure that only cities that are knowledgeable about the governance factors that influence implementation are selected. However, this selection method limited the cities that could participate in the study, which might influence the findings. Furthermore, only measures adopted through Sustainable Energy Action Plans were analysed, which does not represent all the mitigation actions undertaken by local governments in Europe. Even though networks of cities have been assessing the implementation of climate actions by cities (C40 and Arup, 2015), this study contributes to the gap existing in academic literature regarding the implementation of urban-scale mitigation actions, and further research is needed to address a broader range of policies and actions undertaken not only by local governments but also by private initiatives and civil society. Initially, one of the objectives of this study was to contribute to the lack of academic knowledge regarding the actual abatement potential of urban-scale mitigation actions by collecting estimated GHG emissions reduction of SEAPs’ measures. However, several challenges constrained the use of this type of data, and the abatement potential of urban-scale policies and actions used for the study is based on a scientific assessment that also needs improvement (Erickson, Lazarus, et al., 2013). It is clear that data availability and reliability
Do mitigation plans come true? An analysis of the implementation of mitigation actions by European cities and the influence of governance factors.
78
constrain the advance of this type of research, however, networks of cities are already working closely with cities to enhance data for abatement potential, which might facilitate research in the future. Moreover, scenarios were projected concerning the extent to which cities can contribute to reducing emissions with the objective of keeping the average global temperature no more than 2°C above pre-industrial levels (Erickson and Tempest, 2014, OECD and IEA, 2016). However, there is lack of studies related to the extent to which emissions accounted to urban areas are actually reducing. Further research could address this topic by analysing GHG emissions inventories of cities in different years. This approach would contribute to the creation of knowledge regarding cities’ potential to mitigate global warming, and even to evaluate the effectiveness of mitigation actions and policies that have been undertaken.
Governance factors First, it is important to highlight that the governance factors related to the capacity of the local government do not directly concern local governance, but they address the governance interactions within local government. In this context, government and governance are not differentiated in order to institutionalise the governance aspects of local government. This approach was conducted by studies that analyse the urban climate governance, either for adaptation (Aylett, 2015) and mitigation measures (Anguelovski and Carmin, 2011). Regarding the governance factors in overall, there is lack of academic literature that explores how these factors influence specifically the phase of implementation for both mitigation and adaptation measures. This study aims to contribute to the creation of knowledge concerning mitigation and presents a few different findings than the ones reached by academic studies that analyse the policy cycle as a whole. This distinction of conclusions confirms the necessity of researching how the governance factors influence different phases of the policy cycle, as suggested by Ryan (2015), and more research could be conducted in this field.
Concerning the sectoral factors, the findings of this study paint a picture of different policy and political context among sectors, which must be taken into consideration when analysing the factors that affect local climate action, and when developing climate action plans. Although case studies have addressed the sectors, there is not a clear understanding of the differences and similarities among them, and the influence of their governance context on implementation.
In this study, the two variables analysed across sectors are: political actors and factors, and local framing. It is interesting to highlight how the influence of the two variables analysed across sectors is varied. While for some sectors the critical factors to implement mitigation actions are more related to the policy context (such as in Municipal Buildings, Industry, and Local Electricity Production), for others the influence of actors is more relevant in terms of implementation (such as in Tertiary Buildings, and Transport). There is even a third set of sectors, in which the influence of both variables is equal (such as in Residential Buildings, Public Lighting, Local Heat/Cold Production, and Other sectors). However, it is not possible to conclude which variable drives more implementation, and which constrains. Among the three sectors with the highest implementation rate, two sectors receive equal influence of both variables, while the other sector is more impacted by local framing. When analysing the three sectors with lowest implementation rate, the local framing variable is more relevant in two sectors, while the other sector received equal influence of both variables. Local framing is the variable that stands out in both situations (low and high
Do mitigation plans come true? An analysis of the implementation of mitigation actions by European cities and the influence of governance factors.
79
implementation rate), and, hence, it is not possible to define its influence as only positive or negative to implementation.
It is interesting to emphasise that from the six sectors in which the national policies orientation is one of the main drivers to implement mitigation measures, three are related to buildings (Municipal, Tertiary, and Residential Buildings sectors). Concerning this finding, a few assumptions can be made. In this case, national policies and programmes focused on specific sectors can encourage the development of funding schemes for implementing initiatives at the local level, enabling municipalities to undertake measures without compromising their own budgets. For example, through the National Action Plan on Energy Efficiency (NAPE), Germany’s federal government discloses clear and ambitious efficiency standards for buildings. In order to achieve these standards, the German Federal Ministry for Economic Affairs and Energy and KfW created a funding programme with low interest rates and high repayment bonuses that can be undertaken by local governments to increase energy efficiency in municipal buildings (KfW, 2015). If the national policies were not in place, this funding programme would not be available and the implementation of measures related to Municipal Buildings could be limited. This reasoning not only shows how the indicators among variables are related, but it also might explain the relevance of national orientation focused on specific sectors. In fact, two of the three German cities that participated in the study reported the national orientation as a critical driver to implement mitigation actions in the Municipal Buildings sector. Therefore, political autonomy and capacity might not be sufficient to implement measures in certain sectors, and even though cities are responsible for sectors that can achieve GHG emissions reduction, the orientation of the national government is still relevant since it impacts other local factors. One of the most notable finding of this study is that the urban-scale mitigation actions with the highest potential to reduce GHG emissions are also the hardest to be implemented by European cities. These mitigation actions are related to the sector of Local Electricity Production, in which the variable local framing is considered to be more influential to implementation than the political actors. However, the most frequently reported challenges to implementation are related to the resistance of the national government and the lack of national orientation. Lack of national orientation is rated as a barrier solely by Spanish cities, and only by three of the seven Spanish cities that participated in the study. Thus, more research is needed in order to address the obstacles faced by cities during the implementation of measures related to this sector, especially since it is so relevant concerning emissions reduction.
Surprisingly, lack of knowledge regarding climate change mitigation in urban areas is a relevant barrier to implementing mitigation actions and could be addressed with the support of academic institutions. Other relevant obstacles are characterised by dynamics within local governments, such as the fact that climate change is not mainstreamed among departments and there is a lack of staff or staff time dedicated to climate change. These factors could be further researched in order to understand their origins, allowing the design of measures to overcome them.
Do mitigation plans come true? An analysis of the implementation of mitigation actions by European cities and the influence of governance factors.
80
Bibliography
Abram, N. J., McGregor, H. V., Tierney, J. E., Evans, M. N., et al., 2016. Early onset of industrial-era warming across the oceans and continents. Nature, 536 (7617), pp. 411-418. Available at: http://www.nature.com/nature/journal/v536/n7617/full/nature19082.html [Accessed 16-09-2016].
Allman, L., Fleming, P. and Wallace, A. 2004. The progress of English and Welsh local authorities in addressing climate change. Local Environment, 9 (3), pp. 271-283.
Anguelovski, I. and Carmin, J. 2011. Something borrowed, everything new : innovation and institutionalization in urban climate governance. Current Opinion in Environmental Sustainability, 3 (3), pp. 169-175. Available at: http://www.sciencedirect.com/science/article/pii/S1877343511000042/pdfft?md5=674ecd86e2453991d11d3e67c0d6fbed&pid=1-s2.0-S1877343511000042-main.pdf [Accessed 18-01-2016].
Arup and C40 Cities, 2011. Climate action in megacities: C40 cities baseline and opportinities. 1.0), London and New York: Arup for C40 Cities. Available at: http://publications.arup.com/publications/c/climate_action_in_megacities [Accessed 21-04-2016].
Aylett, A., 2014. Progress and Challenges in the Urban Governance of Climate Change: Results of a Global Survey. Cambridge, MA: MIT. Available at: http://www.preventionweb.net/publications/view/38666 [Accessed 11-03-2016].
Aylett, A., 2015. Institutionalizing the urban governance of climate change adaptation: Results of an international survey. Urban Climate, 14 (1), pp. 4-16. Available at: http://www.sciencedirect.com/science/article/pii/S2212095515300031 [Accessed 11-03-2016].
Betsill, M. M., 2001. Mitigating climate change in US cities: opportunities and obstacles. Local Environment, 6 (4), pp. 393-406. [Accessed 4/11/2016 9:23:51 AM].
Betsill, M. M. and Bulkeley, H. 2006. Cities and the multilevel governance of global climate change. Global Governance, 12 pp. 141-159. Available at: http://sciencepolicy.colorado.edu/students/envs_4100/betsill_2006.pdf [Accessed 15-2-2016].
Betsill, M. and Bulkeley, H. 2007. Looking back and thinking ahead: a decade of cities and climate change research. Local Environment, 12 (5), pp. 447-456. [Accessed 4/11/2016 9:24:13 AM].
Bulkeley, H. and Betsill, M. M., 2003. Cities and climate change: urban sustainability and global environmental governance. Psychology Press. [Accessed 4/13/2016 9:38:12 AM].
Bulkeley, H., Schroeder, H., Janda, K., Zhao, J., et al., 2009. Cities and climate change: the role of institutions, governance and urban planning. Change, 28 pp. 30. [Accessed 4/11/2016 9:55:54 AM].
Bulkeley, H., Schroeder, H., Janda, K., Zhao, J., et al., 2011. The Role of Institutions, Governance, and Urban Planning for Mitigation and Adaptation. In: D. Hoornweg, M. Freire, M. J. Lee, P. Bhada-Tata and B. Yuen eds., 2011. Cities and Climate Change: Responding to an Urgent Agenda. Washington, D.C.: World Bank. pp. 125-159. Available at: http://elibrary.worldbank.org.eur.idm.oclc.org/doi/book/10.1596/978-0-8213-8493-0#. [Accessed 28-03-2016].
Do mitigation plans come true? An analysis of the implementation of mitigation actions by European cities and the influence of governance factors.
81
Burch, S., 2010. In pursuit of resilient, low carbon communities: an examination of barriers to action in three Canadian cities. Energy Policy, 38 (12), pp. 7575-7585. [Accessed 4/11/2016 6:12:19 AM].
C40 and Arup, 2015. Potential for climate action. Arup. Available at: http://publications.arup.com/Publications/P/Potential_for_Climate_Action.aspx [Accessed 11-03-2016].
Corfee-Morlot, J., Kamal-Chaoui, L., Donovan, M. G., Cochran, I., et al., 2009. Cities, Climate Change and Multilevel Governance. OECD Environmental Working Papers, 14 Available at: http://www.oecd.org/governance/regional-policy/44232263.pdf [Accessed 7-2-2016].
Covenant of Mayors, 2014. SEAP Template. Covenant of Mayors Office & Joint Research Centre of the European Commission.
DeAngelo, B. J. and Harvey, L. D. 1998. The jurisdictional framework for municipal action to reduce greenhouse gas emissions: Case studies from Canada, the USA and Germany. Local Environment, 3 (2), pp. 111-136.
Dodman, D., 2009. Blaming cities for climate change? An analysis of urban greenhouse gas emissions inventories. Environment & Urbanization, 21 (1), pp. 185-201. Available at: http://eau.sagepub.com/content/21/1/185.abstract [Accessed 5-2-2016].
Erickson, P., Lazarus, M., Chandler, C. and Schultz, S. 2013. Technologies, policies and measures for GHG abatement at the urban scale. Greenhouse Gas Measurement and Management, 3 (1-2), pp. 37-54. [Accessed 4/20/2016 9:49:09 AM].
Erickson, P. and Tempest, K., 2014. Advancing climate ambition: How city-scale actions can contribute to global climate goals. 2014-06), Sweden: Stockholm Environment Institute. Available at: http://www.sei-international.org/publications?pid=2582 [Accessed 11-03-2016].
European Commission, 2011. Europe 2020 targets. Available at: http://ec.europa.eu/europe2020/targets/eu-targets/index_en.htm [Accessed 2016].
European Commission, 2015. EU on track to meeting 20% renewable energy target. Available at: http://ec.europa.eu/energy/en/topics/renewable-energy/progress-reports [Accessed 2016].
Eurostat, 2014. Archive:Greenhouse gas emissions from waste disposal. Available at: http://ec.europa.eu/eurostat/statistics-explained/index.php/Archive:Greenhouse_gas_emissions_from_waste_disposal [Accessed 2016].
Fleming, P. and Webber, P. 2004. Local and regional greenhouse gas management. Energy Policy, 32 (6), pp. 761-771.
Francesch-Huidobro, M., 2016. Climate change and energy policies in Shanghai: A multilevel governance perspective. Applied Energy, 164 pp. 45-56. Available at: http://www.sciencedirect.com.eur.idm.oclc.org/science/article/pii/S0306261915014762 [Accessed 15-2-2016].
Fukuyama, F., 2013. What Is Governance? Governance, 26 (3), pp. 347-368. Available at: http://onlinelibrary.wiley.com/doi/10.1111/gove.12035/full .
Do mitigation plans come true? An analysis of the implementation of mitigation actions by European cities and the influence of governance factors.
82
Hansen, J., Sato, M., Hearty, P., Ruedy, R., et al., 2015. Ice melt, sea level rise and superstorms: evidence from paleoclimate data, climate modeling, and modern observations that 2 C global warming is highly dangerous. Atmos.Chem.Phys.Discuss, 15 pp. 20059-20179. Available at: http://www.atmos-chem-phys-discuss.net/15/20059/2015/acpd-15-20059-2015.pdf [Accessed 16-09-2016].
Heidrich, O., Dawson, R. J., Reckien, D. and Walsh, C. L. 2013. Assessment of the climate preparedness of 30 urban areas in the UK. Climatic Change, 120 (4), pp. 771-784. [Accessed 4/18/2016 5:45:21 AM].
Hooghe, L. and Marks, G. 2003. Unraveling the central state, but how? Types of multi-level governance. The American Political Science Review, 97 (2), pp. 233-243. Available at: http://www.jstor.org/stable/3118206?seq=1#page_scan_tab_contents [Accessed 15-2-2016].
Hoornweg, D., Sugar, L. and Gomez, C. L. T. 2011. Cities and greenhouse gas emissions: moving forward. Environment and Urbanization, pp. 0956247810392270. [Accessed 4/11/2016 2:08:09 PM].
Hsu, A., Cheng, Y., Weinfurter, A., Xu, K., et al., 2016. Track climate pledges of cities and companies. Nature, 532 (7599), pp. 303-306. Available at: http://www.nature.com/news/track-climate-pledges-of-cities-and-companies-1.19764 .
IEA, 2014. Energy Technology Perspectives 2014: Harnessing Electricity’s Potential. Paris: International Energy Agency. Available at: http://www.iea.org/etp/etp2014/ .
IPCC, 2014. Climate Change 2014: Synthesis Report. Contribution of Working Groups I, II and III to the Fifth Assessment Report of the Intergovernmental Panel on Climate Change. 5), Geneva, Switzerland: IPCC. Available at: http://www.ipcc.ch/pdf/assessment-report/ar5/syr/SYR_AR5_FINAL_full_wcover.pdf [Accessed 6-2-2016].
Kennedy, C., Steinberger, J., Gasson, B., Hansen, Y., et al., 2009. Greenhouse Gas Emissions from Global Cities. Environ. Sci. Technol., 43 (19), pp. 7297-7302. Available at: http://pubs.acs.org/doi/abs/10.1021/es900213p [Accessed 11-03-2016].
KfW, 2015. New KfW promotional offering for the energy-efficient construction and rehabilitation of non-residential buildings to launch in. Available at: https://www.kfw.de/KfW-Group/Newsroom/Aktuelles/Pressemitteilungen/Pressemitteilungen-Details_268224.html [Accessed 2016].
Krause, R. M., 2011a. Symbolic or substantive policy? Measuring the extent of local commitment to climate protection. Environment and Planning C: Government and Policy, 29 (1), pp. 46-62. [Accessed 4/11/2016 10:49:26 AM].
Krause, R. M., 2012. An assessment of the impact that participation in local climate networks has on cities’ implementation of climate, energy, and transportation policies. Review of Policy Research, 29 (5), pp. 585-604. [Accessed 4/11/2016 10:32:07 AM].
Krause, R. M., 2011b. An assessment of the greenhouse gas reducing activities being implemented in US cities. Local Environment, 16 (2), pp. 193-211. [Accessed 4/11/2016 9:08:38 AM].
Kyrö, R., Heinonen, J., Säynäjoki, A. and Junnila, S. 2012. Assessing the potential of climate change mitigation actions in three different city types in Finland. Sustainability, 4 pp. 1510-1524. Available at: http://www.mdpi.com/2071-1050/4/7/1510 [Accessed 8-2-2016].
Do mitigation plans come true? An analysis of the implementation of mitigation actions by European cities and the influence of governance factors.
83
Lee, C. M. and Erickson, P. 2014. What impact can local economic development in cities have on global GHG emissions? Assessing the evidence.
Loorbach, D., 2010. Transition Management for Sustainable Development: A Prescriptive, Complexity-Based Governance Framework. Governance, 23 (1), pp. 161-183. Available at: http://onlinelibrary.wiley.com/doi/10.1111/j.1468-0491.2009.01471.x/abstract?userIsAuthenticated=false&deniedAccessCustomisedMessage= [Accessed 15-2-2016].
McCarney, P., Blanco, H., Carmin, J. and Colley, M. 2011. Cities and climate change : the challenges for governance. In: C. Rosenzweig, W. D. Solecki, S. A. Hammer and Mehrotra Shagun eds., 2011. Climate change and cities : first assessment report of the Urban Climate Change Research Network. Cambridge: Cambridge University Press. pp. 249-269.
Millard-Ball, A., 2012. Do city climate plans reduce emissions? Journal of Urban Economics, 71 (3), pp. 289-311. [Accessed 4/15/2016 10:55:17 AM].
Millard-Ball, A., 2013. The limits to planning causal impacts of city climate action plans. Journal of Planning Education and Research, 33 (1), pp. 5-19.
Milman, O., 2015. James Hansen, father of climate change awareness, calls Paris talks 'a fraud'. Available at: https://www.theguardian.com/environment/2015/dec/12/james-hansen-climate-change-paris-talks-fraud [Accessed 2016].
OECD, 2010. Cities and Climate Change. OECD Publishing. Available at: http://dx.doi.org/10.1787/9789264091375-en [Accessed 20-04-2016].
OECD and IEA, 2016. Energy Technology Perspectives 2016 - Towards Sustainable Urban Energy Systems. 2016: OECD/IEA. Available at: http://www.iea.org/etp/ [Accessed 13-09-2016].
Reckien, D., Flacke, J., Dawson, R. J., Heidrich, O., et al., 2014a. Climate change response in Europe: what’s the reality? Analysis of adaptation and mitigation plans from 200 urban areas in 11 countries. Climatic Change, 122 (1), pp. 331-340. Available at: http://link.springer.com/article/10.1007%2Fs10584-013-0989-8 [Accessed 11-03-2016].
Reckien, D., Flacke, J., De Gregorio Hurtado, S., Salvia, M., et al., 2014b. Urban climate change response and the impact of climate networks in Europe. In: R. J. Dawson, A. Wyckmans, O. Heidrich, J. Köhler, S. Dobson and E. Feliú eds., 2014b. Understanding Cities: Advances in integrated assessment of urban sustainability. Newcastle, UK: Centre for Earth Systems Engineering Research (CESER). pp. 45-52. Available at: http://www.ncl.ac.uk/ceser/researchprogramme/costactiontu0902/Final_All_CoverLo.pdf.
Reckien, D., Flacke, J., Olazabal, M. and Heidrich, O. 2015. The Influence of Drivers and Barriers on Urban Adaptation and Mitigation Plans—An Empirical Analysis of European Cities. . PLoS ONE, 10 (8), pp. 1-21. Available at: http://journals.plos.org/plosone/article?id=10.1371/journal.pone.0135597 [Accessed 11-03-2016].
Rhodes, R. A. W., 1996. The new governance: governing without Government. Political Studies, 44 (4), pp. 652-667. Available at: http://onlinelibrary.wiley.com/doi/10.1111/j.1467-9248.1996.tb01747.x/abstract;jsessionid=2CB7A98C110490AB68E244BBF5E454C7.f03t04?userIsAuthenticated=false&deniedAccessCustomisedMessage= [Accessed 15-2-2016].
Do mitigation plans come true? An analysis of the implementation of mitigation actions by European cities and the influence of governance factors.
84
Romero-Lankao, P., 2012. Governing Carbon and Climate in the Cities: An Overview of Policy and Planning Challenges and Options. European Planning Studies, 20 (1), pp. 7-26. Available at: http://www.tandfonline.com/doi/abs/10.1080/09654313.2011.638496 [Accessed 16-2-2016].
Romero-Lankao, P., Hughes, S., Rosas-Huerta, A., Borquez, R., et al., 2013. Institutional capacity for climate change responses: an examination of construction and pathways in Mexico City and Santiago. Environment and Planning C: Government and Policy, 31 (5), pp. 785-805. [Accessed 4/18/2016 6:48:38 AM].
Rosenzweig, C., Solecki, W., Hammer, S. A. and Mehrotra, S. 2010. Cities lead the way in climate-change action. Nature, 467 (7318), pp. 909-911. [Accessed 4/11/2016 2:08:53 PM].
Ryan, D., 2015. From commitment to action: a literature review on climate policy implementation at city level. Climatic Change, 131 (4), pp. 519-529. [Accessed 4/11/2016 11:30:23 AM].
Sabatier, P. and Mazmanian, D. 1980. The implementation of public policy: A framework of analysis. Policy Studies Journal, 8 (4), pp. 538-560.
Salon, D., Murphy, S. and Sciara, G. 2014. Local climate action: motives, enabling factors and barriers. Carbon Management, 5 (1), pp. 67-79. [Accessed 4/15/2016 11:35:54 AM].
Sippel, M., 2011. Urban GHG inventories, target setting and mitigation achievements: how German cities fail to outperform their country. Greenhouse Gas Measurement and Management, 1 (1), pp. 55-63. Available at: http://dx.doi.org/10.3763/ghgmm.2010.0001 [Accessed 7-2-2016].
Stoker, G., 1998. Governance as theory: five propositions. International Social Science Journal, 50 (155), pp. 17-28. [Accessed 4/15/2016 5:26:58 AM].
UNEP, 2016. The Emissions Gap Report 2016. Nairobi: United Nations Environment Programme (UNEP). Available at: http://web.unep.org/emissionsgap/ .
Zhou, N., Price, L., Ohshita, S. and Zheng, N., 2011. A Guidebook for Low-Carbon Development at the Local Level. Berkeley: Lawrence Berkeley National Laboratory. Available at: http://escholarship.org/uc/item/1sp9m82g .
Do mitigation plans come true? An analysis of the implementation of mitigation actions by European cities and the influence of governance factors.
85
Annex 1: List of cities that participated in the study
City Country Questionnaire respondent Population
Year of adhesion on Covenant of Mayors
Date of data access on Covenant of Mayors website (dd/mm/yyyy)
Medium cities Città di Collegno IT NO 50,185 2010 07/07/2016 Rho IT NO 50,686 2011 07/07/2016 Larnaca CY NO 51,232 2009 07/07/2016 Montesilvano IT NO 52,401 2010 07/07/2016 Fafe PT YES 52,722 2011 07/07/2016 Thermi GR NO 53,201 2011 07/07/2016 Cava de' Tirreni IT NO 53,500 2010 07/07/2016 Calvià ES NO 54,268 2011 07/07/2016 Olbia IT NO 54,873 2011 07/07/2016 Agioi Anargyroi-Kamatero GR YES 55,191 2011 07/07/2016 Ovar PT NO 56,296 2010 07/07/2016 Castelldefels ES NO 60,572 2008 08/07/2016 Granollers ES NO 60,658 2008 08/07/2016 Helsingør DK NO 61,000 2010 08/07/2016 Gradiška BA YES 62,000 2011 08/07/2016 Irun ES YES 62,000 2010 08/07/2016 El Prat de Llobregat ES NO 63,418 2008 08/07/2016 Faro PT NO 63,967 2011 08/07/2016 Genk BE NO 64,519 2008 08/07/2016 Vilanova i la Geltrú ES YES 65,890 2009 11/07/2016 Piaseczno PL NO 66,000 2011 11/07/2016 Jelgava LV NO 66,034 2009 11/07/2016 Alba Iulia RO NO 66,369 2010 11/07/2016 Strovolos CY NO 67,565 2009 11/07/2016 Pervomaisk UA YES 67,800 2009 11/07/2016 Colmar FR NO 68,000 2010 11/07/2016 Aprilia IT YES 70,349 2012 11/07/2016 Quartu Sant'Elena IT YES 71,779 2011 11/07/2016 Cinisello Balsamo IT NO 72,050 2010 13/07/2016 L'Aquila IT NO 72,442 2011 13/07/2016 Amaroussion GR NO 72,480 2011 14/07/2016 Rubí ES NO 73,778 2008 14/07/2016 Haninge SE NO 76,237 2009 14/07/2016 Manresa ES NO 76,558 2008 14/07/2016 Slagelse DK NO 77,457 2009 14/07/2016 Barreiro PT NO 77,893 2011 14/07/2016
Do mitigation plans come true? An analysis of the implementation of mitigation actions by European cities and the influence of governance factors.
86
Nea Smyrni GR NO 79,000 2009 14/07/2016 Sant Cugat del Vallès ES YES 79,253 2008 14/07/2016 Treviso IT NO 81,014 2011 14/07/2016 Sant Boi de Llobregat ES NO 82,428 2008 14/07/2016 Södertälje SE NO 85,270 2009 14/07/2016 Guidonia Montecelio IT NO 85,570 2010 14/07/2016 Växjö SE YES 86,000 2008 14/07/2016 Viana do Castelo PT NO 86,368 2011 14/07/2016 Cornellà de Llobregat ES YES 86,519 2008 14/07/2016 Botkyrka SE YES 87,000 2009 14/07/2016 Lorca ES NO 92,865 2011 14/07/2016 Pesaro IT NO 94,926 2011 14/07/2016 La Spezia IT NO 95,303 2011 14/07/2016 Halmstad SE NO 96,800 2009 14/07/2016 Viseu PT NO 100,167 2010 14/07/2016 Lahti FI NO 103,384 2012 14/07/2016 Funchal PT YES 112,015 2011 14/07/2016 Vicenza IT YES 116,000 2011 14/07/2016 Lund SE YES 116,000 2009 14/07/2016 Bottrop DE NO 116,771 2011 14/07/2016 Forlì IT NO 117,928 2010 14/07/2016 Reykjavík IS YES 118,427 2010 14/07/2016 Bergamo IT YES 119,144 2009 14/07/2016 Santa Coloma de Gramenet ES NO
119,717 2008 14/07/2016
Unione dei Comuni NET (Nord Est Torino) IT YES 120,000 2012 15/07/2016 Monza IT NO 120,204 2013 15/07/2016 Mataró ES YES 121,746 2008 15/07/2016 Jönköping SE YES 126,331 2009 15/07/2016 Helsingborg SE YES 130,000 2011 15/07/2016 Stavanger NO NO 130,754 2008 15/07/2016 Tarragona ES NO 137,536 2008 15/07/2016 Salerno IT YES 139,579 2010 15/07/2016 Associazione Intercomunale Terre Estensi IT NO 141,673 2012 15/07/2016 Volos GR NO 141,675 2013 15/07/2016 Ravenna IT YES 142,035 2008 15/07/2016 Poole GB NO 147,600 2012 15/07/2016 South Tyneside GB NO 151,600 2009 15/07/2016 Logroño ES NO 152,928 2012 15/07/2016 Bijeljina BA NO 153,000 2010 15/07/2016 Seixal PT YES 158,269 2011 15/07/2016 Matosinhos PT NO 174,283 2010 15/07/2016
Do mitigation plans come true? An analysis of the implementation of mitigation actions by European cities and the influence of governance factors.
87
San Sebastián - Donostia ES NO 183,300 2008 15/07/2016 Rostock DE NO 201,096 2009 15/07/2016 Trieste IT NO 208,136 2012 15/07/2016 Padova IT YES 209,679 2010 16/07/2016 Terrassa ES NO 210,941 2008 16/07/2016 Badalona ES NO 215,329 2008 16/07/2016 Freiburg DE YES 220,000 2008 16/07/2016 Elche ES NO 228,647 2010 16/07/2016 Vitoria - Gasteiz ES YES 239,361 2008 16/07/2016 Gdynia PL YES 247,428 2011 16/07/2016
Large cities Hospitalet de Llobregat ES NO 257,038 2008 06/07/2016 Verona IT YES 265,085 2008 06/07/2016 Venezia IT NO 271,000 2011 06/07/2016 Münster DE NO 298,518 2008 06/07/2016 Vila Nova de Gaia PT YES 312,742 2008 06/07/2016 Malmö SE YES 320,000 2008 06/07/2016 Leicester GB NO 343,019 2009 06/07/2016 Bilbao ES NO 353,340 2010 06/07/2016 Kaunas LT NO 353,800 2009 07/07/2016 Bologna IT YES 374,561 2008 07/07/2016 Tallinn EE NO 413,727 2009 07/07/2016 Murcia ES YES 424,063 2008 07/07/2016 Lisboa PT NO 479,884 2008 07/07/2016
Extra large cities Bremen DE YES 546,451 2008 27/06/2016 Göteborg SE NO 506,100 2008 27/06/2016 Düsseldorf DE YES 597,102 2010 27/06/2016 Glasgow GB NO 612,000 2009 27/06/2016 Helsinki FI NO 622,240 2009 27/06/2016 Bordeaux Metropole FR NO 720,000 2009 27/06/2016 Zagreb HR YES 788,850 2008 27/06/2016 Stockholm SE YES 829,417 2008 27/06/2016 Torino IT NO 910,504 2009 28/06/2016 Birmingham GB NO 1,028,700 2009 28/06/2016 Tbilisi GE YES 1,100,000 2010 28/06/2016 Warsaw PL NO 1,680,000 2009 28/06/2016 Berlin DE NO 3,439,132 2010 28/06/2016
Do mitigation plans come true? An analysis of the implementation of mitigation actions by European cities and the influence of governance factors.
88
Annex 2: Questionnaire structure
URBAN MITIGATION This survey aims to understand what drives or constrains the implementation of mitigation actions by your city. It starts with a set of questions related to factors that might influence implementation in general, followed by questions related to each sector/category of the SEAP.
GENERAL FACTORS This section is mainly about how factors related to the local government influence the implementation of mitigation actions of your city's SEAP (Sustainable Energy Action Plan).
1. Does the local government have political authority to implement mitigation actions?
YES-->
To which extent political authority is a driver to implement SEAP's mitigation actions? • Not a driver: the factor does not influence implementation. • Driver: the factor helps implementation, but the action could be implemented without it. • Critical driver: the factor is essential, and action would not be implemented without it.
NO-->
To which extent lack of political authority is a barrier to implement SEAP's mitigation actions? • Not a barrier: the factor does not influence implementation. • Barrier: the factor delays or limits implementation. • Critical barrier: the factor prevents implementation. The action is not implemented at all.
2. Does the local government have financial autonomy to collect funds to implement mitigation actions?
YES-->
To which extent financial autonomy is a driver to implement SEAP's mitigation actions? • Not a driver: the factor does not influence implementation. • Driver: the factor helps implementation, but the action could be implemented without it. • Critical driver: the factor is essential, and action would not be implemented without it.
NO-->
To which extent lack of financial autonomy is a barrier to implement SEAP's mitigation actions? • Not a barrier: the factor does not influence implementation. • Barrier: the factor delays or limits implementation. • Critical barrier: the factor prevents implementation. The action is not implemented at all.
3. Does local government's budget consider the implementation of SEAP's mitigation actions?
YES-->
To which extent this budgetary condition is a driver to implement SEAP's mitigation actions? • Not a driver: the factor does not influence implementation. • Driver: the factor helps implementation, but the action could be implemented without it.
Do mitigation plans come true? An analysis of the implementation of mitigation actions by European cities and the influence of governance factors.
89
• Critical driver: the factor is essential, and action would not be implemented without it.
NO-->
To which extent this budgetary condition is a barrier to implement SEAP's mitigation actions? • Not a barrier: the factor does not influence implementation. • Barrier: the factor delays or limits implementation. • Critical barrier: the factor prevents implementation. The action is not implemented at all.
4. Are external funds available for your city, in order to implement mitigation actions?
External funds = funds from national government or other private/public organisations.
YES-->
To which extent availability of external funds is a driver to implement SEAP's mitigation actions? • Not a driver: the factor does not influence implementation. • Driver: the factor helps implementation, but the action could be implemented without it. • Critical driver: the factor is essential, and action would not be implemented without it.
NO-->
To which extent lack of external funds is a barrier to implement SEAP's mitigation actions? • Not a barrier: the factor does not influence implementation. • Barrier: the factor delays or limits implementation. • Critical barrier: the factor prevents implementation. The action is not implemented at all.
5. Does the local government have sufficient staff or staff time dedicated to climate change mitigation?
YES-->
To which extent availability of staff is a driver to implement SEAP's mitigation actions? • Not a driver: the factor does not influence implementation. • Driver: the factor helps implementation, but the action could be implemented without it. • Critical driver: the factor is essential, and action would not be implemented without it.
NO-->
To which extent lack of staff is a barrier to implement SEAP's mitigation actions? • Not a barrier: the factor does not influence implementation. • Barrier: the factor delays or limits implementation. • Critical barrier: the factor prevents implementation. The action is not implemented at all.
6. Does the local government have sufficient knowledge/information regarding climate change mitigation at the local level?
YES-->
To which extent availability of knowledge/information is a driver to implement SEAP's mitigation actions? • Not a driver: the factor does not influence implementation. • Driver: the factor helps implementation, but the action could be implemented
Do mitigation plans come true? An analysis of the implementation of mitigation actions by European cities and the influence of governance factors.
90
without it. • Critical driver: the factor is essential, and action would not be implemented without it.
NO-->
To which extent lack of knowledge/information is a barrier to implement SEAP's mitigation actions? • Not a barrier: the factor does not influence implementation. • Barrier: the factor delays or limits implementation. • Critical barrier: the factor prevents implementation. The action is not implemented at all.
7. Does any national or local political leader promote local climate change mitigation?
YES-->
To which extent the presence of political leader is a driver to implement SEAP's mitigation actions? • Not a driver: the factor does not influence implementation. • Driver: the factor helps implementation, but the action could be implemented without it. • Critical driver: the factor is essential, and action would not be implemented without it.
NO-->
To which extent lack of political leader is a barrier to implement SEAP's mitigation actions? • Not a barrier: the factor does not influence implementation. • Barrier: the factor delays or limits implementation. • Critical barrier: the factor prevents implementation. The action is not implemented at all.
8. Is climate change mitigation mainstreamed among other departments of the local government?
Mainstreaming = integrating mitigation in other policy domains.
YES-->
To which extent mainstreaming mitigation is a driver to implement SEAP's mitigation actions? • Not a driver: the factor does not influence implementation. • Driver: the factor helps implementation, but the action could be implemented without it. • Critical driver: the factor is essential, and action would not be implemented without it.
NO-->
To which extent not mainstreaming mitigation is a barrier to implement SEAP's mitigation actions? • Not a barrier: the factor does not influence implementation. • Barrier: the factor delays or limits implementation. • Critical barrier: the factor prevents implementation. The action is not implemented at all.
9. Does the local government receive support from or through global intermunicipal organisations (e.g. CoM, ICLEI) to implement mitigation actions?
YES-->
To which extent this support is a driver to implement SEAP's mitigation actions? • Not a driver: the factor does not influence implementation. • Driver: the factor helps implementation, but the action could be implemented
Do mitigation plans come true? An analysis of the implementation of mitigation actions by European cities and the influence of governance factors.
91
without it. • Critical driver: the factor is essential, and action would not be implemented without it.
NO-->
To which extent the lack of support is a barrier to implement SEAP's mitigation actions? • Not a barrier: the factor does not influence implementation. • Barrier: the factor delays or limits implementation. • Critical barrier: the factor prevents implementation. The action is not implemented at all.
MUNICIPAL BUILDINGS Please, only answer the following questions if your city's SEAP incorporates mitigation actions for the Municipal Buildings sector. If it does not, please continue to the next sector.
1. Are mitigation actions for this sector framed according to the city's priorities and goals?
Such as economic development, poverty reduction, energy supply, air quality, etc.
YES-->
To which extent framing mitigation actions according to city's priorities is a driver for implementation in this sector? • Not a driver: the factor does not influence implementation. • Driver: the factor helps implementation, but the action could be implemented without it. • Critical driver: the factor is essential, and action would not be implemented without it.
NO-->
To which extent not framing mitigation actions according to city's priorities is a barrier for implementation in this sector? • Not a barrier: the factor does not influence implementation. • Barrier: the factor delays or limits implementation. • Critical barrier: the factor prevents implementation. The action is not implemented at all.
2. Do mitigation actions for this sector generate local co-benefits which are not in the city's agenda? Co-benefits = financial, socio-economic and/or environmental benefits. E.g.: saving money of the jurisdiction, environmental preservation, quality of life, city attractiveness for business, etc.
YES-->
To which extent generating co-benefits is a driver for implementation in this sector? • Not a driver: the factor does not influence implementation. • Driver: the factor helps implementation, but the action could be implemented without it. • Critical driver: the factor is essential, and action would not be implemented without it.
NO-->
To which extent not generating co-benefits is a barrier for implementation in this sector? • Not a barrier: the factor does not influence implementation. • Barrier: the factor delays or limits implementation. • Critical barrier: the factor prevents implementation. The action is not implemented at all.
Do mitigation plans come true? An analysis of the implementation of mitigation actions by European cities and the influence of governance factors.
92
3. Do mitigation actions for this sector follow national policies orientation?
YES-->
To which extent following national policies orientation is a driver for implementation in this sector? • Not a driver: the factor does not influence implementation. • Driver: the factor helps implementation, but the action could be implemented without it. • Critical driver: the factor is essential, and action would not be implemented without it.
NO-->
To which extent not following national policies orientation is a barrier for implementation in this sector? • Not a barrier: the factor does not influence implementation. • Barrier: the factor delays or limits implementation. • Critical barrier: the factor prevents implementation. The action is not implemented at all.
INFLUENCE OF STAKEHOLDERS 4. What is the major position of the civil society regarding the implementation of mitigation actions for this sector?
Supports -->
To which extent the support of civil society is a driver to implement mitigation actions in this sector? • Not a driver: the factor does not influence implementation. • Driver: the factor helps implementation, but the action could be implemented without it. • Critical driver: the factor is essential, and action would not be implemented without it.
Resists -->
To which extent the resistance of civil society is a barrier to implement mitigation actions in this sector? • Not a barrier: the factor does not influence implementation. • Barrier: the factor delays or limits implementation. • Critical barrier: the factor prevents implementation. The action is not implemented at all.
Neutral --> Go to next question.
5. What is the major position of the private sector regarding the implementation of mitigation actions for this sector?
Supports -->
To which extent the support of the private sector is a driver to implement mitigation actions in this sector? • Not a driver: the factor does not influence implementation. • Driver: the factor helps implementation, but the action could be implemented without it. • Critical driver: the factor is essential, and action would not be implemented without it.
Resists -->
To which extent the resistance of the private sector is a barrier to implement mitigation actions in this sector? • Not a barrier: the factor does not influence implementation. • Barrier: the factor delays or limits implementation. • Critical barrier: the factor prevents implementation. The action is not implemented at all.
Do mitigation plans come true? An analysis of the implementation of mitigation actions by European cities and the influence of governance factors.
93
Neutral --> Go to next question.
6. What is the major position of the national government regarding the implementation of mitigation actions for this sector?
Supports -->
To which extent the supportof the national government is a driver to implement mitigation actions in this sector? • Not a driver: the factor does not influence implementation. • Driver: the factor helps implementation, but the action could be implemented without it. • Critical driver: the factor is essential, and action would not be implemented without it.
Resists -->
To which extent the resistance of the national government is a barrier to implement mitigation actions in this sector? • Not a barrier: the factor does not influence implementation. • Barrier: the factor delays or limits implementation. • Critical barrier: the factor prevents implementation. The action is not implemented at all.
Neutral --> Go to next question.
TERTIARY BUILDINGS Please, only answer the following questionsif your city's SEAPincorporatemitigation actions for theTertiary Buildingssector. If itdoes not, please continue to the next sector.
1. Are mitigation actions for this sector framed according to the city's priorities and goals?
Such as economic development, poverty reduction, energy supply, air quality, etc.
YES-->
To which extent framing mitigation actions according to city's priorities is a driver for implementation in this sector? • Not a driver: the factor does not influence implementation. • Driver: the factor helps implementation, but the action could be implemented without it. • Critical driver: the factor is essential, and action would not be implemented without it.
NO-->
To which extent not framing mitigation actions according to city's priorities is a barrier for implementation in this sector? • Not a barrier: the factor does not influence implementation. • Barrier: the factor delays or limits implementation. • Critical barrier: the factor prevents implementation. The action is not implemented at all.
2. Do mitigation actions for this sector generate local co-benefits which are not in the city's agenda? Co-benefits = financial, socio-economic and/or environmental benefits. E.g.: saving money of the jurisdiction, environmental preservation, quality of life, city attractiveness for business, etc.
YES-->
To which extent generating co-benefits is a driver for implementation in this sector? • Not a driver: the factor does not influence implementation. • Driver: the factor helps implementation, but the action could be implemented
Do mitigation plans come true? An analysis of the implementation of mitigation actions by European cities and the influence of governance factors.
94
without it. • Critical driver: the factor is essential, and action would not be implemented without it.
NO-->
To which extent not generating co-benefits is a barrier for implementation in this sector? • Not a barrier: the factor does not influence implementation. • Barrier: the factor delays or limits implementation. • Critical barrier: the factor prevents implementation. The action is not implemented at all.
3. Do mitigation actions for this sector follow national policies orientation?
YES-->
To which extent following national policies orientation is a driver for implementation in this sector? • Not a driver: the factor does not influence implementation. • Driver: the factor helps implementation, but the action could be implemented without it. • Critical driver: the factor is essential, and action would not be implemented without it.
NO-->
To which extent not following national policies orientation is a barrier for implementation in this sector? • Not a barrier: the factor does not influence implementation. • Barrier: the factor delays or limits implementation. • Critical barrier: the factor prevents implementation. The action is not implemented at all.
INFLUENCE OF STAKEHOLDERS 4. What is the major position of the civil society regarding the implementation of mitigation actions for this sector?
Supports -->
To which extent the support of civil society is a driver to implement mitigation actions in this sector? • Not a driver: the factor does not influence implementation. • Driver: the factor helps implementation, but the action could be implemented without it. • Critical driver: the factor is essential, and action would not be implemented without it.
Resists -->
To which extent the resistance of civil society is a barrier to implement mitigation actions in this sector? • Not a barrier: the factor does not influence implementation. • Barrier: the factor delays or limits implementation. • Critical barrier: the factor prevents implementation. The action is not implemented at all.
Neutral --> Go to next question.
5. What is the major position of the private sector regarding the implementation of mitigation actions for this sector?
Supports --> To which extent the support of the private sector is a driver to implement mitigation actions in this sector?
Do mitigation plans come true? An analysis of the implementation of mitigation actions by European cities and the influence of governance factors.
95
• Not a driver: the factor does not influence implementation. • Driver: the factor helps implementation, but the action could be implemented without it. • Critical driver: the factor is essential, and action would not be implemented without it.
Resists -->
To which extent the resistance of the private sector is a barrier to implement mitigation actions in this sector? • Not a barrier: the factor does not influence implementation. • Barrier: the factor delays or limits implementation. • Critical barrier: the factor prevents implementation. The action is not implemented at all.
Neutral --> Go to next question.
6. What is the major position of the national government regarding the implementation of mitigation actions for this sector?
Supports -->
To which extent the supportof the national government is a driver to implement mitigation actions in this sector? • Not a driver: the factor does not influence implementation. • Driver: the factor helps implementation, but the action could be implemented without it. • Critical driver: the factor is essential, and action would not be implemented without it.
Resists -->
To which extent the resistance of the national government is a barrier to implement mitigation actions in this sector? • Not a barrier: the factor does not influence implementation. • Barrier: the factor delays or limits implementation. • Critical barrier: the factor prevents implementation. The action is not implemented at all.
Neutral --> Go to next question.
RESIDENTIAL BUILDINGS Please, only answer the following questionsif your city's SEAPincorporatemitigation actions for theResidential Buildingssector. If itdoes not, please continue to the next sector.
1. Are mitigation actions for this sector framed according to the city's priorities and goals?
Such as economic development, poverty reduction, energy supply, air quality, etc.
YES-->
To which extent framing mitigation actions according to city's priorities is a driver for implementation in this sector? • Not a driver: the factor does not influence implementation. • Driver: the factor helps implementation, but the action could be implemented without it. • Critical driver: the factor is essential, and action would not be implemented without it.
NO-->
To which extent not framing mitigation actions according to city's priorities is a barrier for implementation in this sector? • Not a barrier: the factor does not influence implementation. • Barrier: the factor delays or limits implementation. • Critical barrier: the factor prevents implementation. The action is not
Do mitigation plans come true? An analysis of the implementation of mitigation actions by European cities and the influence of governance factors.
96
implemented at all.
2. Do mitigation actions for this sector generate local co-benefits which are not in the city's agenda? Co-benefits = financial, socio-economic and/or environmental benefits. E.g.: saving money of the jurisdiction, environmental preservation, quality of life, city attractiveness for business, etc.
YES-->
To which extent generating co-benefits is a driver for implementation in this sector? • Not a driver: the factor does not influence implementation. • Driver: the factor helps implementation, but the action could be implemented without it. • Critical driver: the factor is essential, and action would not be implemented without it.
NO-->
To which extent not generating co-benefits is a barrier for implementation in this sector? • Not a barrier: the factor does not influence implementation. • Barrier: the factor delays or limits implementation. • Critical barrier: the factor prevents implementation. The action is not implemented at all.
3. Do mitigation actions for this sector follow national policies orientation?
YES-->
To which extent following national policies orientation is a driver for implementation in this sector? • Not a driver: the factor does not influence implementation. • Driver: the factor helps implementation, but the action could be implemented without it. • Critical driver: the factor is essential, and action would not be implemented without it.
NO-->
To which extent not following national policies orientation is a barrier for implementation in this sector? • Not a barrier: the factor does not influence implementation. • Barrier: the factor delays or limits implementation. • Critical barrier: the factor prevents implementation. The action is not implemented at all.
INFLUENCE OF STAKEHOLDERS 4. What is the major position of the civil society regarding the implementation of mitigation actions for this sector?
Supports -->
To which extent the support of civil society is a driver to implement mitigation actions in this sector? • Not a driver: the factor does not influence implementation. • Driver: the factor helps implementation, but the action could be implemented without it. • Critical driver: the factor is essential, and action would not be implemented without it.
Resists --> To which extent the resistance of civil society is a barrier to implement mitigation actions in this sector?
Do mitigation plans come true? An analysis of the implementation of mitigation actions by European cities and the influence of governance factors.
97
• Not a barrier: the factor does not influence implementation. • Barrier: the factor delays or limits implementation. • Critical barrier: the factor prevents implementation. The action is not implemented at all.
Neutral --> Go to next question.
5. What is the major position of the private sector regarding the implementation of mitigation actions for this sector?
Supports -->
To which extent the support of the private sector is a driver to implement mitigation actions in this sector? • Not a driver: the factor does not influence implementation. • Driver: the factor helps implementation, but the action could be implemented without it. • Critical driver: the factor is essential, and action would not be implemented without it.
Resists -->
To which extent the resistance of the private sector is a barrier to implement mitigation actions in this sector? • Not a barrier: the factor does not influence implementation. • Barrier: the factor delays or limits implementation. • Critical barrier: the factor prevents implementation. The action is not implemented at all.
Neutral --> Go to next question.
6. What is the major position of the national government regarding the implementation of mitigation actions for this sector?
Supports -->
To which extent the supportof the national government is a driver to implement mitigation actions in this sector? • Not a driver: the factor does not influence implementation. • Driver: the factor helps implementation, but the action could be implemented without it. • Critical driver: the factor is essential, and action would not be implemented without it.
Resists -->
To which extent the resistance of the national government is a barrier to implement mitigation actions in this sector? • Not a barrier: the factor does not influence implementation. • Barrier: the factor delays or limits implementation. • Critical barrier: the factor prevents implementation. The action is not implemented at all.
Neutral --> Go to next question.
PUBLIC LIGHTING Please, only answer the following questionsif your city's SEAPincorporatemitigation actions for thePublic Lightingsector. If itdoes not, please continue to the next sector.
1. Are mitigation actions for this sector framed according to the city's priorities and goals?
Such as economic development, poverty reduction, energy supply, air quality, etc.
YES--> To which extent framing mitigation actions according to city's priorities is a
Do mitigation plans come true? An analysis of the implementation of mitigation actions by European cities and the influence of governance factors.
98
driver for implementation in this sector?
• Not a driver: the factor does not influence implementation. • Driver: the factor helps implementation, but the action could be implemented without it. • Critical driver: the factor is essential, and action would not be implemented without it.
NO-->
To which extent not framing mitigation actions according to city's priorities is a barrier for implementation in this sector? • Not a barrier: the factor does not influence implementation. • Barrier: the factor delays or limits implementation. • Critical barrier: the factor prevents implementation. The action is not implemented at all.
2. Do mitigation actions for this sector generate local co-benefits which are not in the city's agenda? Co-benefits = financial, socio-economic and/or environmental benefits. E.g.: saving money of the jurisdiction, environmental preservation, quality of life, city attractiveness for business, etc.
YES-->
To which extent generating co-benefits is a driver for implementation in this sector? • Not a driver: the factor does not influence implementation. • Driver: the factor helps implementation, but the action could be implemented without it. • Critical driver: the factor is essential, and action would not be implemented without it.
NO-->
To which extent not generating co-benefits is a barrier for implementation in this sector? • Not a barrier: the factor does not influence implementation. • Barrier: the factor delays or limits implementation. • Critical barrier: the factor prevents implementation. The action is not implemented at all.
3. Do mitigation actions for this sector follow national policies orientation?
YES-->
To which extent following national policies orientation is a driver for implementation in this sector? • Not a driver: the factor does not influence implementation. • Driver: the factor helps implementation, but the action could be implemented without it. • Critical driver: the factor is essential, and action would not be implemented without it.
NO-->
To which extent not following national policies orientation is a barrier for implementation in this sector? • Not a barrier: the factor does not influence implementation. • Barrier: the factor delays or limits implementation. • Critical barrier: the factor prevents implementation. The action is not implemented at all.
INFLUENCE OF STAKEHOLDERS
Do mitigation plans come true? An analysis of the implementation of mitigation actions by European cities and the influence of governance factors.
99
4. What is the major position of the civil society regarding the implementation of mitigation actions for this sector?
Supports -->
To which extent the support of civil society is a driver to implement mitigation actions in this sector? • Not a driver: the factor does not influence implementation. • Driver: the factor helps implementation, but the action could be implemented without it. • Critical driver: the factor is essential, and action would not be implemented without it.
Resists -->
To which extent the resistance of civil society is a barrier to implement mitigation actions in this sector? • Not a barrier: the factor does not influence implementation. • Barrier: the factor delays or limits implementation. • Critical barrier: the factor prevents implementation. The action is not implemented at all.
Neutral --> Go to next question.
5. What is the major position of the private sector regarding the implementation of mitigation actions for this sector?
Supports -->
To which extent the support of the private sector is a driver to implement mitigation actions in this sector? • Not a driver: the factor does not influence implementation. • Driver: the factor helps implementation, but the action could be implemented without it. • Critical driver: the factor is essential, and action would not be implemented without it.
Resists -->
To which extent the resistance of the private sector is a barrier to implement mitigation actions in this sector? • Not a barrier: the factor does not influence implementation. • Barrier: the factor delays or limits implementation. • Critical barrier: the factor prevents implementation. The action is not implemented at all.
Neutral --> Go to next question.
6. What is the major position of the national government regarding the implementation of mitigation actions for this sector?
Supports -->
To which extent the supportof the national government is a driver to implement mitigation actions in this sector? • Not a driver: the factor does not influence implementation. • Driver: the factor helps implementation, but the action could be implemented without it. • Critical driver: the factor is essential, and action would not be implemented without it.
Resists -->
To which extent the resistance of the national government is a barrier to implement mitigation actions in this sector? • Not a barrier: the factor does not influence implementation. • Barrier: the factor delays or limits implementation. • Critical barrier: the factor prevents implementation. The action is not
Do mitigation plans come true? An analysis of the implementation of mitigation actions by European cities and the influence of governance factors.
100
implemented at all.
Neutral --> Go to next question.
INDUSTRY Please, only answer the following questionsif your city's SEAPincorporatemitigation actions for theIndustrysector. If itdoes not, please continue to the next sector.
1. Are mitigation actions for this sector framed according to the city's priorities and goals?
Such as economic development, poverty reduction, energy supply, air quality, etc.
YES-->
To which extent framing mitigation actions according to city's priorities is a driver for implementation in this sector? • Not a driver: the factor does not influence implementation. • Driver: the factor helps implementation, but the action could be implemented without it. • Critical driver: the factor is essential, and action would not be implemented without it.
NO-->
To which extent not framing mitigation actions according to city's priorities is a barrier for implementation in this sector? • Not a barrier: the factor does not influence implementation. • Barrier: the factor delays or limits implementation. • Critical barrier: the factor prevents implementation. The action is not implemented at all.
2. Do mitigation actions for this sector generate local co-benefits which are not in the city's agenda? Co-benefits = financial, socio-economic and/or environmental benefits. E.g.: saving money of the jurisdiction, environmental preservation, quality of life, city attractiveness for business, etc.
YES-->
To which extent generating co-benefits is a driver for implementation in this sector? • Not a driver: the factor does not influence implementation. • Driver: the factor helps implementation, but the action could be implemented without it. • Critical driver: the factor is essential, and action would not be implemented without it.
NO-->
To which extent not generating co-benefits is a barrier for implementation in this sector? • Not a barrier: the factor does not influence implementation. • Barrier: the factor delays or limits implementation. • Critical barrier: the factor prevents implementation. The action is not implemented at all.
3. Do mitigation actions for this sector follow national policies orientation?
YES-->
To which extent following national policies orientation is a driver for implementation in this sector? • Not a driver: the factor does not influence implementation. • Driver: the factor helps implementation, but the action could be implemented without it.
Do mitigation plans come true? An analysis of the implementation of mitigation actions by European cities and the influence of governance factors.
101
• Critical driver: the factor is essential, and action would not be implemented without it.
NO-->
To which extent not following national policies orientation is a barrier for implementation in this sector? • Not a barrier: the factor does not influence implementation. • Barrier: the factor delays or limits implementation. • Critical barrier: the factor prevents implementation. The action is not implemented at all.
INFLUENCE OF STAKEHOLDERS 4. What is the major position of the civil society regarding the implementation of mitigation actions for this sector?
Supports -->
To which extent the support of civil society is a driver to implement mitigation actions in this sector? • Not a driver: the factor does not influence implementation. • Driver: the factor helps implementation, but the action could be implemented without it. • Critical driver: the factor is essential, and action would not be implemented without it.
Resists -->
To which extent the resistance of civil society is a barrier to implement mitigation actions in this sector? • Not a barrier: the factor does not influence implementation. • Barrier: the factor delays or limits implementation. • Critical barrier: the factor prevents implementation. The action is not implemented at all.
Neutral --> Go to next question.
5. What is the major position of the private sector regarding the implementation of mitigation actions for this sector?
Supports -->
To which extent the support of the private sector is a driver to implement mitigation actions in this sector? • Not a driver: the factor does not influence implementation. • Driver: the factor helps implementation, but the action could be implemented without it. • Critical driver: the factor is essential, and action would not be implemented without it.
Resists -->
To which extent the resistance of the private sector is a barrier to implement mitigation actions in this sector? • Not a barrier: the factor does not influence implementation. • Barrier: the factor delays or limits implementation. • Critical barrier: the factor prevents implementation. The action is not implemented at all.
Neutral --> Go to next question.
6. What is the major position of the national government regarding the implementation of mitigation actions for this sector?
Supports --> To which extent the supportof the national government is a driver to
Do mitigation plans come true? An analysis of the implementation of mitigation actions by European cities and the influence of governance factors.
102
implement mitigation actions in this sector?
• Not a driver: the factor does not influence implementation. • Driver: the factor helps implementation, but the action could be implemented without it. • Critical driver: the factor is essential, and action would not be implemented without it.
Resists -->
To which extent the resistance of the national government is a barrier to implement mitigation actions in this sector? • Not a barrier: the factor does not influence implementation. • Barrier: the factor delays or limits implementation. • Critical barrier: the factor prevents implementation. The action is not implemented at all.
Neutral --> Go to next question.
TRANSPORT Please, only answer the following questionsif your city's SEAPincorporatemitigation actions for theTransportsector. If itdoes not, please continue to the next sector.
1. Are mitigation actions for this sector framed according to the city's priorities and goals?
Such as economic development, poverty reduction, energy supply, air quality, etc.
YES-->
To which extent framing mitigation actions according to city's priorities is a driver for implementation in this sector? • Not a driver: the factor does not influence implementation. • Driver: the factor helps implementation, but the action could be implemented without it. • Critical driver: the factor is essential, and action would not be implemented without it.
NO-->
To which extent not framing mitigation actions according to city's priorities is a barrier for implementation in this sector? • Not a barrier: the factor does not influence implementation. • Barrier: the factor delays or limits implementation. • Critical barrier: the factor prevents implementation. The action is not implemented at all.
2. Do mitigation actions for this sector generate local co-benefits which are not in the city's agenda? Co-benefits = financial, socio-economic and/or environmental benefits. E.g.: saving money of the jurisdiction, environmental preservation, quality of life, city attractiveness for business, etc.
YES-->
To which extent generating co-benefits is a driver for implementation in this sector? • Not a driver: the factor does not influence implementation. • Driver: the factor helps implementation, but the action could be implemented without it. • Critical driver: the factor is essential, and action would not be implemented without it.
NO--> To which extent not generating co-benefits is a barrier for implementation in this sector?
Do mitigation plans come true? An analysis of the implementation of mitigation actions by European cities and the influence of governance factors.
103
• Not a barrier: the factor does not influence implementation. • Barrier: the factor delays or limits implementation. • Critical barrier: the factor prevents implementation. The action is not implemented at all.
3. Do mitigation actions for this sector follow national policies orientation?
YES-->
To which extent following national policies orientation is a driver for implementation in this sector? • Not a driver: the factor does not influence implementation. • Driver: the factor helps implementation, but the action could be implemented without it. • Critical driver: the factor is essential, and action would not be implemented without it.
NO-->
To which extent not following national policies orientation is a barrier for implementation in this sector? • Not a barrier: the factor does not influence implementation. • Barrier: the factor delays or limits implementation. • Critical barrier: the factor prevents implementation. The action is not implemented at all.
INFLUENCE OF STAKEHOLDERS 4. What is the major position of the civil society regarding the implementation of mitigation actions for this sector?
Supports -->
To which extent the support of civil society is a driver to implement mitigation actions in this sector? • Not a driver: the factor does not influence implementation. • Driver: the factor helps implementation, but the action could be implemented without it. • Critical driver: the factor is essential, and action would not be implemented without it.
Resists -->
To which extent the resistance of civil society is a barrier to implement mitigation actions in this sector? • Not a barrier: the factor does not influence implementation. • Barrier: the factor delays or limits implementation. • Critical barrier: the factor prevents implementation. The action is not implemented at all.
Neutral --> Go to next question.
5. What is the major position of the private sector regarding the implementation of mitigation actions for this sector?
Supports -->
To which extent the support of the private sector is a driver to implement mitigation actions in this sector? • Not a driver: the factor does not influence implementation. • Driver: the factor helps implementation, but the action could be implemented without it. • Critical driver: the factor is essential, and action would not be implemented without it.
Do mitigation plans come true? An analysis of the implementation of mitigation actions by European cities and the influence of governance factors.
104
Resists -->
To which extent the resistance of the private sector is a barrier to implement mitigation actions in this sector? • Not a barrier: the factor does not influence implementation. • Barrier: the factor delays or limits implementation. • Critical barrier: the factor prevents implementation. The action is not implemented at all.
Neutral --> Go to next question.
6. What is the major position of the national government regarding the implementation of mitigation actions for this sector?
Supports -->
To which extent the supportof the national government is a driver to implement mitigation actions in this sector? • Not a driver: the factor does not influence implementation. • Driver: the factor helps implementation, but the action could be implemented without it. • Critical driver: the factor is essential, and action would not be implemented without it.
Resists -->
To which extent the resistance of the national government is a barrier to implement mitigation actions in this sector? • Not a barrier: the factor does not influence implementation. • Barrier: the factor delays or limits implementation. • Critical barrier: the factor prevents implementation. The action is not implemented at all.
Neutral --> Go to next question.
LOCAL ELECTRICITY PRODUCTION Please, only answer the following questionsif your city's SEAPincorporatemitigation actions for theLocal Electricity Productionsector. If itdoes not, please continue to the next sector.
1. Are mitigation actions for this sector framed according to the city's priorities and goals?
Such as economic development, poverty reduction, energy supply, air quality, etc.
YES-->
To which extent framing mitigation actions according to city's priorities is a driver for implementation in this sector? • Not a driver: the factor does not influence implementation. • Driver: the factor helps implementation, but the action could be implemented without it. • Critical driver: the factor is essential, and action would not be implemented without it.
NO-->
To which extent not framing mitigation actions according to city's priorities is a barrier for implementation in this sector? • Not a barrier: the factor does not influence implementation. • Barrier: the factor delays or limits implementation. • Critical barrier: the factor prevents implementation. The action is not implemented at all.
2. Do mitigation actions for this sector generate local co-benefits which are not in the city's agenda?
Do mitigation plans come true? An analysis of the implementation of mitigation actions by European cities and the influence of governance factors.
105
E.g.: saving money of the jurisdiction, environmental preservation, quality of life, city attractiveness for business, etc.
YES-->
To which extent generating co-benefits is a driver for implementation in this sector? • Not a driver: the factor does not influence implementation. • Driver: the factor helps implementation, but the action could be implemented without it. • Critical driver: the factor is essential, and action would not be implemented without it.
NO-->
To which extent not generating co-benefits is a barrier for implementation in this sector? • Not a barrier: the factor does not influence implementation. • Barrier: the factor delays or limits implementation. • Critical barrier: the factor prevents implementation. The action is not implemented at all.
3. Do mitigation actions for this sector follow national policies orientation?
YES-->
To which extent following national policies orientation is a driver for implementation in this sector? • Not a driver: the factor does not influence implementation. • Driver: the factor helps implementation, but the action could be implemented without it. • Critical driver: the factor is essential, and action would not be implemented without it.
NO-->
To which extent not following national policies orientation is a barrier for implementation in this sector? • Not a barrier: the factor does not influence implementation. • Barrier: the factor delays or limits implementation. • Critical barrier: the factor prevents implementation. The action is not implemented at all.
INFLUENCE OF STAKEHOLDERS 4. What is the major position of the civil society regarding the implementation of mitigation actions for this sector?
Supports -->
To which extent the support of civil society is a driver to implement mitigation actions in this sector? • Not a driver: the factor does not influence implementation. • Driver: the factor helps implementation, but the action could be implemented without it. • Critical driver: the factor is essential, and action would not be implemented without it.
Resists -->
To which extent the resistance of civil society is a barrier to implement mitigation actions in this sector? • Not a barrier: the factor does not influence implementation. • Barrier: the factor delays or limits implementation. • Critical barrier: the factor prevents implementation. The action is not implemented at all.
Neutral --> Go to next question.
Do mitigation plans come true? An analysis of the implementation of mitigation actions by European cities and the influence of governance factors.
106
5. What is the major position of the private sector regarding the implementation of mitigation actions for this sector?
Supports -->
To which extent the support of the private sector is a driver to implement mitigation actions in this sector? • Not a driver: the factor does not influence implementation. • Driver: the factor helps implementation, but the action could be implemented without it. • Critical driver: the factor is essential, and action would not be implemented without it.
Resists -->
To which extent the resistance of the private sector is a barrier to implement mitigation actions in this sector? • Not a barrier: the factor does not influence implementation. • Barrier: the factor delays or limits implementation. • Critical barrier: the factor prevents implementation. The action is not implemented at all.
Neutral --> Go to next question.
6. What is the major position of the national government regarding the implementation of mitigation actions for this sector?
Supports -->
To which extent the supportof the national government is a driver to implement mitigation actions in this sector? • Not a driver: the factor does not influence implementation. • Driver: the factor helps implementation, but the action could be implemented without it. • Critical driver: the factor is essential, and action would not be implemented without it.
Resists -->
To which extent the resistance of the national government is a barrier to implement mitigation actions in this sector? • Not a barrier: the factor does not influence implementation. • Barrier: the factor delays or limits implementation. • Critical barrier: the factor prevents implementation. The action is not implemented at all.
Neutral --> Go to next question.
LOCAL HEAT/COLD PRODUCTION Please, only answer the following questionsif your city's SEAPincorporatemitigation actions for theLocal Heat/Cold Productionsector. If itdoes not, please continue to the next sector.
1. Are mitigation actions for this sector framed according to the city's priorities and goals?
Such as economic development, poverty reduction, energy supply, air quality, etc.
YES-->
To which extent framing mitigation actions according to city's priorities is a driver for implementation in this sector? • Not a driver: the factor does not influence implementation. • Driver: the factor helps implementation, but the action could be implemented without it. • Critical driver: the factor is essential, and action would not be implemented
Do mitigation plans come true? An analysis of the implementation of mitigation actions by European cities and the influence of governance factors.
107
without it.
NO-->
To which extent not framing mitigation actions according to city's priorities is a barrier for implementation in this sector? • Not a barrier: the factor does not influence implementation. • Barrier: the factor delays or limits implementation. • Critical barrier: the factor prevents implementation. The action is not implemented at all.
2. Do mitigation actions for this sector generate local co-benefits which are not in the city's agenda? Co-benefits = financial, socio-economic and/or environmental benefits. E.g.: saving money of the jurisdiction, environmental preservation, quality of life, city attractiveness for business, etc.
YES-->
To which extent generating co-benefits is a driver for implementation in this sector? • Not a driver: the factor does not influence implementation. • Driver: the factor helps implementation, but the action could be implemented without it. • Critical driver: the factor is essential, and action would not be implemented without it.
NO-->
To which extent not generating co-benefits is a barrier for implementation in this sector? • Not a barrier: the factor does not influence implementation. • Barrier: the factor delays or limits implementation. • Critical barrier: the factor prevents implementation. The action is not implemented at all.
3. Do mitigation actions for this sector follow national policies orientation?
YES-->
To which extent following national policies orientation is a driver for implementation in this sector? • Not a driver: the factor does not influence implementation. • Driver: the factor helps implementation, but the action could be implemented without it. • Critical driver: the factor is essential, and action would not be implemented without it.
NO-->
To which extent not following national policies orientation is a barrier for implementation in this sector? • Not a barrier: the factor does not influence implementation. • Barrier: the factor delays or limits implementation. • Critical barrier: the factor prevents implementation. The action is not implemented at all.
INFLUENCE OF STAKEHOLDERS 4. What is the major position of the civil society regarding the implementation of mitigation actions for this sector?
Supports --> To which extent the support of civil society is a driver to implement mitigation actions in this sector?
Do mitigation plans come true? An analysis of the implementation of mitigation actions by European cities and the influence of governance factors.
108
• Not a driver: the factor does not influence implementation. • Driver: the factor helps implementation, but the action could be implemented without it. • Critical driver: the factor is essential, and action would not be implemented without it.
Resists -->
To which extent the resistance of civil society is a barrier to implement mitigation actions in this sector? • Not a barrier: the factor does not influence implementation. • Barrier: the factor delays or limits implementation. • Critical barrier: the factor prevents implementation. The action is not implemented at all.
Neutral --> Go to next question.
5. What is the major position of the private sector regarding the implementation of mitigation actions for this sector?
Supports -->
To which extent the support of the private sector is a driver to implement mitigation actions in this sector? • Not a driver: the factor does not influence implementation. • Driver: the factor helps implementation, but the action could be implemented without it. • Critical driver: the factor is essential, and action would not be implemented without it.
Resists -->
To which extent the resistance of the private sector is a barrier to implement mitigation actions in this sector? • Not a barrier: the factor does not influence implementation. • Barrier: the factor delays or limits implementation. • Critical barrier: the factor prevents implementation. The action is not implemented at all.
Neutral --> Go to next question.
6. What is the major position of the national government regarding the implementation of mitigation actions for this sector?
Supports -->
To which extent the supportof the national government is a driver to implement mitigation actions in this sector? • Not a driver: the factor does not influence implementation. • Driver: the factor helps implementation, but the action could be implemented without it. • Critical driver: the factor is essential, and action would not be implemented without it.
Resists -->
To which extent the resistance of the national government is a barrier to implement mitigation actions in this sector? • Not a barrier: the factor does not influence implementation. • Barrier: the factor delays or limits implementation. • Critical barrier: the factor prevents implementation. The action is not implemented at all.
Neutral --> Go to next question.
Do mitigation plans come true? An analysis of the implementation of mitigation actions by European cities and the influence of governance factors.
109
OTHER Please, only answer the following questionsif your city's SEAPincorporatemitigation actions forOthersectors. If itdoes not, please continue to the next sector.
1. Which are the other sector(s) considered in your city's SEAP?
(Please, write your answer here)
2. Are mitigation actions for this sector framed according to the city's priorities and goals?
Such as economic development, poverty reduction, energy supply, air quality, etc.
YES-->
To which extent framing mitigation actions according to city's priorities is a driver for implementation in this sector? • Not a driver: the factor does not influence implementation. • Driver: the factor helps implementation, but the action could be implemented without it. • Critical driver: the factor is essential, and action would not be implemented without it.
NO-->
To which extent not framing mitigation actions according to city's priorities is a barrier for implementation in this sector? • Not a barrier: the factor does not influence implementation. • Barrier: the factor delays or limits implementation. • Critical barrier: the factor prevents implementation. The action is not implemented at all.
3. Do mitigation actions for this sector generate local co-benefits which are not in the city's agenda? Co-benefits = financial, socio-economic and/or environmental benefits. E.g.: saving money of the jurisdiction, environmental preservation, quality of life, city attractiveness for business, etc.
YES-->
To which extent generating co-benefits is a driver for implementation in this sector? • Not a driver: the factor does not influence implementation. • Driver: the factor helps implementation, but the action could be implemented without it. • Critical driver: the factor is essential, and action would not be implemented without it.
NO-->
To which extent not generating co-benefits is a barrier for implementation in this sector? • Not a barrier: the factor does not influence implementation. • Barrier: the factor delays or limits implementation. • Critical barrier: the factor prevents implementation. The action is not implemented at all.
4. Do mitigation actions for this sector follow national policies orientation?
YES-->
To which extent following national policies orientation is a driver for implementation in this sector? • Not a driver: the factor does not influence implementation. • Driver: the factor helps implementation, but the action could be implemented without it.
Do mitigation plans come true? An analysis of the implementation of mitigation actions by European cities and the influence of governance factors.
110
• Critical driver: the factor is essential, and action would not be implemented without it.
NO-->
To which extent not following national policies orientation is a barrier for implementation in this sector? • Not a barrier: the factor does not influence implementation. • Barrier: the factor delays or limits implementation. • Critical barrier: the factor prevents implementation. The action is not implemented at all.
INFLUENCE OF STAKEHOLDERS 5. What is the major position of the civil society regarding the implementation of mitigation actions for this sector?
Supports -->
To which extent the support of civil society is a driver to implement mitigation actions in this sector? • Not a driver: the factor does not influence implementation. • Driver: the factor helps implementation, but the action could be implemented without it. • Critical driver: the factor is essential, and action would not be implemented without it.
Resists -->
To which extent the resistance of civil society is a barrier to implement mitigation actions in this sector? • Not a barrier: the factor does not influence implementation. • Barrier: the factor delays or limits implementation. • Critical barrier: the factor prevents implementation. The action is not implemented at all.
Neutral --> Go to next question.
6. What is the major position of the private sector regarding the implementation of mitigation actions for this sector?
Supports -->
To which extent the support of the private sector is a driver to implement mitigation actions in this sector? • Not a driver: the factor does not influence implementation. • Driver: the factor helps implementation, but the action could be implemented without it. • Critical driver: the factor is essential, and action would not be implemented without it.
Resists -->
To which extent the resistance of the private sector is a barrier to implement mitigation actions in this sector? • Not a barrier: the factor does not influence implementation. • Barrier: the factor delays or limits implementation. • Critical barrier: the factor prevents implementation. The action is not implemented at all.
Neutral --> Go to next question.
7. What is the major position of the national government regarding the implementation of mitigation actions for this sector?
Supports --> To which extent the supportof the national government is a driver to
Do mitigation plans come true? An analysis of the implementation of mitigation actions by European cities and the influence of governance factors.
111
implement mitigation actions in this sector?
• Not a driver: the factor does not influence implementation. • Driver: the factor helps implementation, but the action could be implemented without it. • Critical driver: the factor is essential, and action would not be implemented without it.
Resists -->
To which extent the resistance of the national government is a barrier to implement mitigation actions in this sector? • Not a barrier: the factor does not influence implementation. • Barrier: the factor delays or limits implementation. • Critical barrier: the factor prevents implementation. The action is not implemented at all.
Neutral --> Go to next question.
THANK YOU FOR COMPLETING THE SURVEY! But before you go, please provide a few information about your city, and also select the privacy preference for the publication of your answers.
NAME OF YOUR CITY: (Please, write your city name here)
COUNTRY: (Please, write your country here) Besides Covenant of Mayors, is your city member of any other intermunicipal organisation? (such as ICLEI, C40, etc) (Please, write your answer here) Do you confirm the information provided by the Covenant of Mayor's website regarding your city?
• Yes • No
In case there is any "not started" action in the status of implementation of your city's SEAP monitoring report, please answer: Do the actions did not start because of the barriers informed in this survey?
• Yes, in all sectors with "not started" actions • Yes, in a few sectors with "not started" actions • No
In case the barries prevented the implementation in a few sectors: which are the sectors in which the barriers prevented the implementation of actions? (Please, write your answer here) All the information provided in this survey should be used:
• Publically • Confidentially
THANK YOU!
Do mitigation plans come true? An analysis of the implementation of mitigation actions by European cities and the influence of governance factors.
112
Annex 3: Position of actors in each sector
Municipal buildings – Position of actors regarding the implementation of urban-scale mitigation actions of this sector
Tertiary buildings – Position of actors regarding the implementation of urban-scale mitigation actions of this sector
Residential buildings – Position of actors regarding the implementation of urban-scale mitigation actions of this sector
Do mitigation plans come true? An analysis of the implementation of mitigation actions by European cities and the influence of governance factors.
113
Public lighting – Position of actors regarding the implementation of urban-scale mitigation actions of this sector
Industry – Position of actors regarding the implementation of urban-scale mitigation actions of this sector
Transport – Position of actors regarding the implementation of urban-scale mitigation actions of this sector
Do mitigation plans come true? An analysis of the implementation of mitigation actions by European cities and the influence of governance factors.
114
Local electricity production – Position of actors regarding the implementation of urban-scale mitigation actions of this sector
Local heat/cold production – Position of actors regarding the implementation of urban-scale mitigation actions of this sector
Other sectors – Position of actors regarding the implementation of urban-scale mitigation actions of this sector
Do mitigation plans come true? An analysis of the implementation of mitigation actions by European cities and the influence of governance factors.
115
Annex 4: Number of questionnaire respondents, per sector and position of actor
Sector Number of respondents
Municipal buildings Total 37
Civil society: supports 16
Civil society: resists 2
Private sector: supports 16
Private sector: resists 3
National government: supports 29
National government: resists 2
Tertiaty buildings Total 31
Civil society: supports 13
Civil society: resists 2
Private sector: supports 17
Private sector: resists 4
National government: supports 24
National government: resists 2
Residential buildings Total 31
Civil society: supports 17
Civil society: resists 1
Private sector: supports 18
Private sector: resists 3
National government: supports 24
National government: resists 2
Public lighting Total 35
Civil society: supports 16
Civil society: resists 2
Private sector: supports 19
Private sector: resists 2
National government: supports 25
National government: resists 3
Do mitigation plans come true? An analysis of the implementation of mitigation actions by European cities and the influence of governance factors.
116
Sector Number of respondents
Industry Total 14
Civil society: supports 5
Civil society: resists 0
Private sector: supports 8
Private sector: resists 0
National government: supports 9
National government: resists 0
Transport Total 36
Civil society: supports 23
Civil society: resists 3
Private sector: supports 16
Private sector: resists 6
National government: supports 29
National government: resists 3
Local electricity production Total 30
Civil society: supports 15
Civil society: resists 2
Private sector: supports 22
Private sector: resists 1
National government: supports 17
National government: resists 6
Local heat/cold production Total 24
Civil society: supports 9
Civil society: resists 1
Private sector: supports 13
Private sector: resists 2
National government: supports 15
National government: resists 2
Other sectors Total 21
Civil society: supports 14
Civil society: resists 0
Private sector: supports 12
Private sector: resists 0
National government: supports 14
National government: resists 0
Annex 5: IHS copyright formIn order to allow the IHS Research Committee to select and publish the best IIMD theses,participants need to sign and hand in this copy right form to the course bureau together withtheir final thesis.
Criteria for publishing:
A summary of 300 to 500 words should be included in the thesis.
The number of pages for the thesis is about 60.
The thesis should be edited.
Please be aware of the length restrictions of the thesis. The Research Committee may choosenot to publish very long and badly written theses.
By signing this form you are indicating that you are the sole author(s) of the work and thatyou have the right to transfer copyright to IHS, except for items cited or quoted in your workthat are clearly indicated.
I grant IHS, or its successors, all copyrights to the work listed above, so that IHS may publishthe work in The IHS thesis serie.s, on the IHS web site, in an electronic publication or in anyother medium.
IHS is granted the right to approve reprinting.
The author(s) retain the rights to create derivative works and to distribute the work citedabove within the institution that employs the author.
Please note that IHS copyrighted material from The IHS thesis series may be reproduced, upto ten copies for educational (excluding course packs purchased by students), non-commercial purposes, providing full acknowledgements and a copyright notice appear on allreproductions.
Thank you for your contribution to IHS.
Date : 28 November 2016
Your Name(s)
Your Signature(s)
Please direct this form and all questi
nFlefimann
regarding this form or IHS copyright policy to:
: Jeniffer Se
The Chairman, IHS Research CoMitteeBurg. Oudlaan 50, T-Building 14th floor,3062PA Rotterdam, The Netherlands