Dehydrohalogenation of a Proton Responsive Cobalt Complex: Versatile Aggregation via Pyrazole Pincer Ligand Arms
Brian J. Cook, Chun-Hsing Chen, Maren Pink and Kenneth G. Caulton*
MSC#12134 (H2L)CoCl2 MPink/BCook
The sample 12134 was submitted for single crystal determination as blue needles with dimensions 0.104 0.162 0.753 mm3. The crystal rapidly lost solvent upon exposure to the atmosphere, so the sample was prepared in an inert atmosphere rapidly. A sample suitable for X-ray diffraction was placed on a MiTeGen microtip while suspended in perfluorinated oil. The crystal was mounted on a Bruker APEX II Kappa Duo diffractometer equipped with an APEX II detector at 150(2) K.
Data collectionThe data collection was carried out using MoΚ radiation (graphite monochromator) for 6 sets of data with a frame time of 45 seconds at detector distance of 5.00 cm. The total exposure time was 16.01 h. A collection strategy was calculated for a monoclinic C lattice and complete data to a resolution of 0.77 Å. 27822 reflections were observed with 6947 independent (Rint = 0.0331), for a redundancy of 4.121 were collected. Frame width for data collection was 0.50º for ω and φ scans. Data to a resolution of 0.77 Å were used in the reduction and data integration. Final cell constants were calculated from the XYZ centroids of 5934 strong reflections from the actual data collection after integration (SAINT).1 Intensity in the reflections were corrected for absorption using known methods (SADABS).2
Structure solution and refinement
The space group Aba2 was determined based on intensity statistics and systematic absences. The structure was solved using direct methods in Bruker APEX-II and refined using SHELXTL-97.3 Direct methods structure solution yielded most non-hydrogen atoms as determined by the electron density found in the difference map. Full-matrix least squares / difference Fourier cycles were then performed and the remaining non-hydrogen atoms were placed based on proposed molecular formula and electron density. All non-hydrogen atoms were refined with anisotropic parameters. Solvent molecules were successfully found and modeled as normal with acceptable Uij. Disordered solvent was found on a two-fold special position and refined at 50% occupancy using restraints and constraints. The hydrogen atoms were refined as riding atoms with exception of those involved classical hydrogen bonding, which were refined for all parameters. Residual electron densities were found to exist near carbon atoms or on bonds. The final full matrix least squares refinement converged with R1 = 0.0336 and wR2 = 0.0884 (F2, all
Structure discussionIn addition to the title compound, additional solvent guests (2.5 THF molecules per formula unit) were found to occupy the lattice. Two of these hydrogen-bond to the ligand backbone via the acidic N-H protons, one of which is disordered over two sites (63:37) and was refined with restraints and constraints. One THF molecule (not hydrogen-bond to the Co complex) is disordered over a special position; the large ellipsoids point to partial solvent loss. Additionally, non-classical hydrogen bonding was observed between Cl ligands of one complex to the vinyl and pyridyl protons of neighboring molecules (2.882Å and 2.712Å) respectively.
MSC#14006 [Co2L(HL)]2L Chen
An orange crystal (approximate dimensions 0.458 x 0.133 x 0.128 mm3) was placed onto the tip of MiTeGen and mounted on an Apex Kappa Duo diffractometer and measured at 150 K. Data collectionA preliminary set of cell constants was calculated from reflections harvested from three sets of 12 frames. These initial sets of frames were oriented such that orthogonal wedges of reciprocal space were surveyed. This produced initial orientation matrices determined from 108 reflections. The data collection was carried out using Mo K radiation (graphite monochromator) with a frame time of 90 seconds and a detector distance of 5.0 cm. A randomly oriented region of reciprocal space was surveyed to achieve complete data with a redundancy of 4. Sections of frames were collected with 0.50º steps in and scans. Data to a resolution of 0.92 Å were considered in the reduction. Final cell constants were calculated from the xyz centroids of 9682 strong reflections from the actual data collection after integration (SAINT).1 The intensity data were corrected for absorption (SADABS).2 Structure solution and refinementThe space group P212121 was determined based on intensity statistics and systematic absences. The structure was solved using Superflip3 and refined (full-matrix-least squares) using the Oxford University Crystals for Windows system.4 The charge-flipping method provided most non-hydrogen atoms from the E-map. Full-matrix least squares / difference Fourier cycles were performed, which located the remaining non-hydrogen atoms. All non-hydrogen atoms with exceptions of solvent THFs were refined with anisotropic displacement parameters. The hydrogen atoms H(102) and H(161) that were involved in hydrogen bonding were generated geometrically and their positions were refined, whereas the rest of the hydrogen atoms were placed in ideal positions and refined as riding atoms. The final full matrix least squares refinement converged to R1 = 0.0507 and wR2 = 0.1433 (F2, all data). Structure descriptionThe structure was found to be a helix containing four Co and five ligands, with two out of four THF solvent molecules hydrogen-bonded with the molecule.
MSC#14012 LiCo2L2Cl Chen An orange crystal (approximate dimensions 0.551 x 0.113 x 0.100 mm3) was placed onto the tip of MiTeGen and mounted on an Apex Kappa Duo diffractometer and measured at 150 K.
S-3
Data collectionThe preliminary unit cell was determined from 208 reflections harvested from three sets of 12 frames. The data collection was carried out using Mo K radiation (graphite monochromator) with a frame time of 90 seconds and a detector distance of 5.0 cm. A randomly oriented region of reciprocal space was surveyed to achieve complete data with a redundancy of 4. Sections of frames were collected with 0.50º steps in and scans. Data to a resolution of 0.82 Å were considered in the reduction. Final cell constants were calculated from the xyz centroids of 9956 strong reflections from the actual data collection after integration (SAINT).1 The intensity data were corrected for absorption (SADABS).2 Structure solution and refinementThe space group P21/n was determined based on intensity statistics and systematic absences. The structure was solved using Superflip3 and refined (full-matrix-least squares) using the Oxford University Crystals for Windows system.4 The charge-flipping method provided most non-hydrogen atoms from the E-map. Full-matrix least squares / difference Fourier cycles were performed, which located the remaining non-hydrogen atoms. Structure 14012 exhibits significant disorder at t-butyl and solvent THF, which was modeled successfully. The two-part disorder was modeled that the occupancies of the major and minor components are summed to 1. All ordered and the major components of the disordered non-hydrogen atoms were refined with anisotropic displacement parameters, whereas the minor component of the disorder and the solvent atoms were refined isotropically. The hydrogen atoms were placed in ideal positions and refined as riding atoms. The final full matrix least squares refinement converged to R1 = 0.0824 and wR2 = 0.2449 (F2, all data). Refinement with Li replaced by H gave an unrealistic thermal parameter for that atom. Identification of this peak as lithium, not proton, also rests on an electrophile-N distance too long for proton, on the linkage to more than one THF. Structure descriptionThe structure was found to contain bridging chloride between two Co complexes, as well as in the tetrahedral position of its neighboring lithium ion (Cl – Li = 2.6 Å).
MSC#14019 [Co2L(HL)]2CoL2 Chen
An orange crystal (approximate dimensions 0.380 x 0.166 x 0.072 mm3) was placed onto the tip of MiTeGen and mounted on an Apex Kappa Duo diffractometer and measured at 150 K. Data collectionThe preliminary unit cell was determined from 232 reflections harvested from three sets of 12 frames. The data collection was carried out using Mo K radiation (graphite monochromator) with a frame time of 70 seconds and a detector distance of 5.0 cm. A randomly oriented region of reciprocal space was surveyed to achieve complete data with a redundancy of 4. Sections of frames were collected with 0.50º steps in and scans. Data to a resolution of 0.8 Å were considered in the reduction. Final cell constants were calculated from the xyz centroids of 9964 strong reflections from the actual data collection after integration (SAINT).1 The intensity data were corrected for absorption (SADABS).2 Structure solution and refinement
S-4
The space group C 2/c was determined based on intensity statistics and systematic absences. The structure was solved using Superflip3 and refined (full-matrix-least squares) using the Oxford University Crystals for Windows system.4 The charge-flipping method provided most non-hydrogen atoms from the E-map. Full-matrix least squares / difference Fourier cycles were performed, which located the remaining non-hydrogen atoms. All non-hydrogen atoms were refined with anisotropic displacement parameters. The hydrogen atom H(1) that was involved in the hydrogen bonding was obtained from the difference map and was positionally refined whereas the rest of the hydrogen atoms were placed in ideal positions and refined as riding atoms. The final full matrix least squares refinement converged to R1 = 0.0691 and wR2 = 0.1863 (F2, all data).
14027 LiCo2L2Cl●2Li[N(SiMe3)2] ●3(Et2O) Chen An orange crystal (approximate dimensions 0.331 x 0.319 x 0.206 mm3) was placed onto the tip of MiTeGen and mounted on an Apex Kappa Duo diffractometer and measured at 150 K.
Data collectionThe preliminary unit cell was determined from 335 reflections harvested from three sets of 12 frames. The data collection was carried out using Mo K radiation (graphite monochromator) with a frame time of 90 seconds and a detector distance of 5.0 cm. A randomly oriented region of reciprocal space was surveyed to achieve complete data with a redundancy of 4. Sections of frames were collected with 0.50º steps in and scans. Data to a resolution of 0.84 Å were considered in the reduction. Final cell constants were calculated from the xyz centroids of 9901 strong reflections from the actual data collection after integration (SAINT).1 The intensity data were corrected for absorption (SADABS).2 Structure solution and refinementThe space group P -1 was determined based on intensity statistics and systematic absences. The structure was solved using Superflip3 and refined (full-matrix-least squares) using the Oxford University Crystals for Windows system.4 The charge-flipping method provided most non-hydrogen atoms from the E-map. Full-matrix least squares / difference Fourier cycles were performed, which located the remaining non-hydrogen atoms. All non-hydrogen atoms were refined with anisotropic displacement parameters. The hydrogen atoms were placed in ideal positions and refined as riding atoms. The final full matrix least squares refinement converged to R1 = 0.0570 and wR2 = 0.1674 (F2, all data). The remaining electron density is located within the vicinity of disordered solvent ether molecules.
1 SAINT, Bruker Analytical X-Ray Systems, Madison, WI, current version.2 An empirical correction for absorption anisotropy, R. Blessing, Acta Cryst. A51, 33 - 38 (1995).3 L. Palatinus, G. Chapuis, 2007: SUPERFLIP - a computer program for the solution of crystal structures by charge flipping in arbitrary dimensions. J. Appl. Cryst., Vol. 40, pp. 786-790. 4 Betteridge, P. W.; Carruthers, J. R.; Cooper, R. I.; Prout, K.; Watkin, D. J. J. Appl. Cryst. 2003, 36, 1487.
S-5
Figure S1. 1H NMR spectrum of (H2L)CoCl2 in d8 THF. Asterisk indicates solvent peaks.
.
S-6
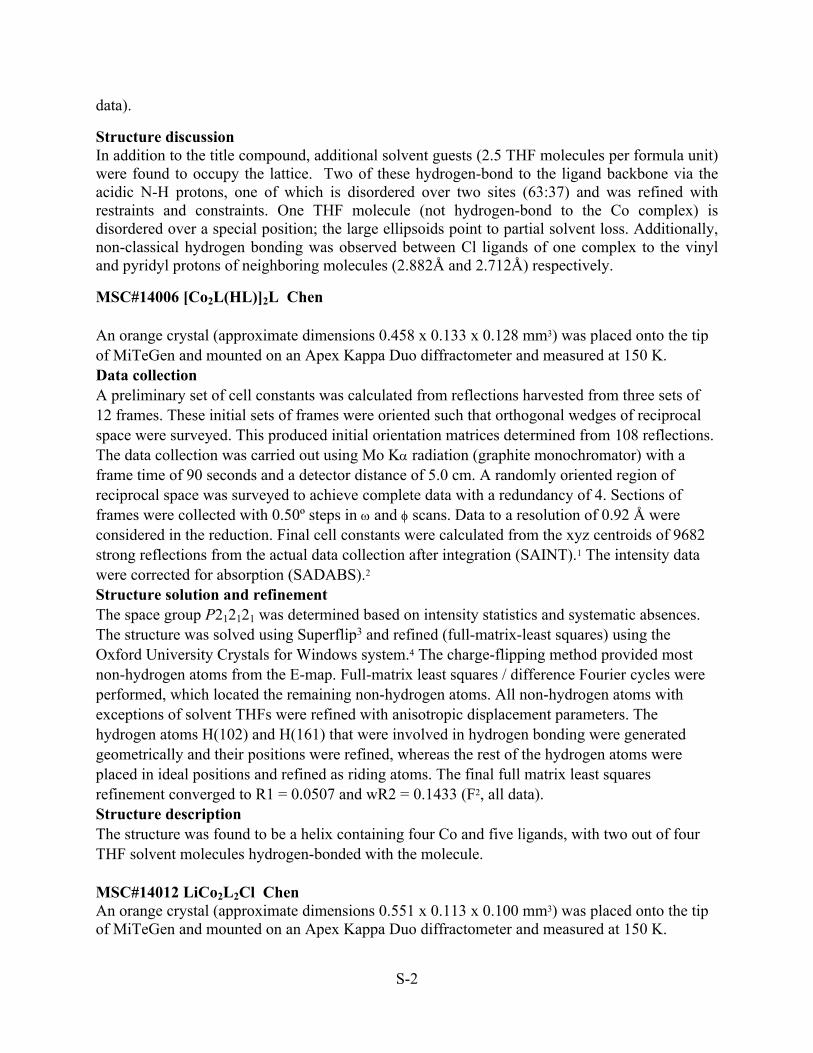
Figure S2. (LiCl)Co2L2 in THF-d8(*). Unmarked peaks are a CoII-containing impurity

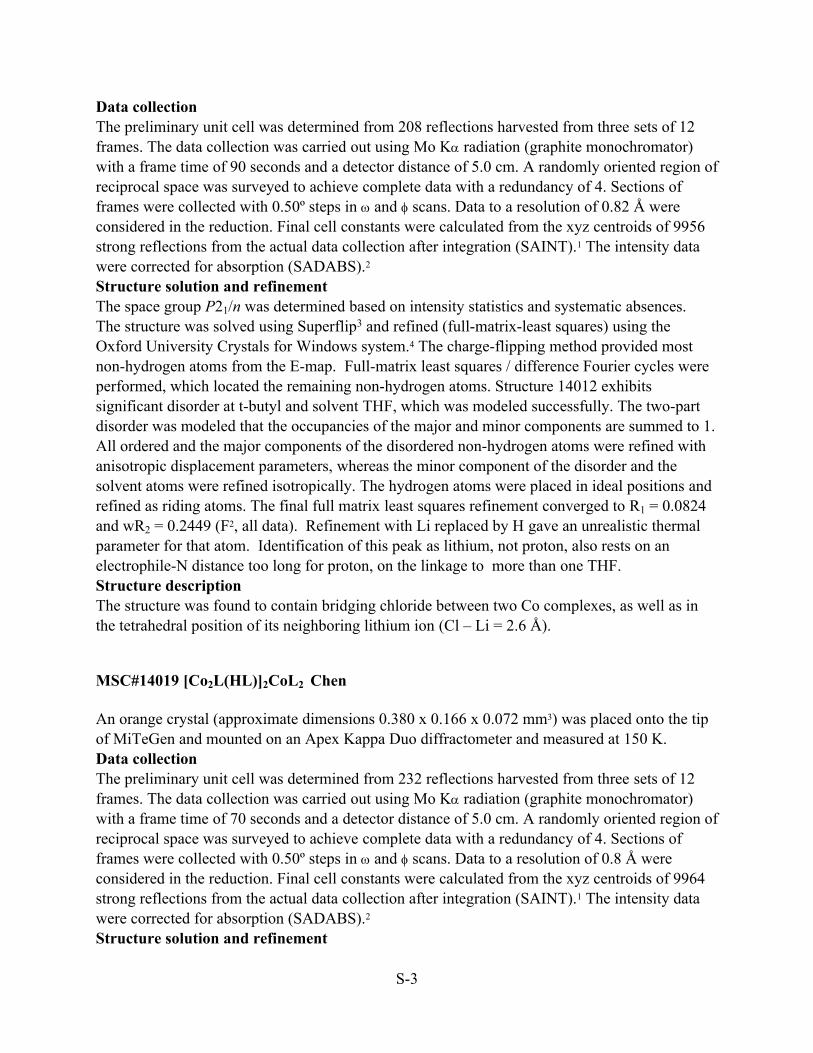


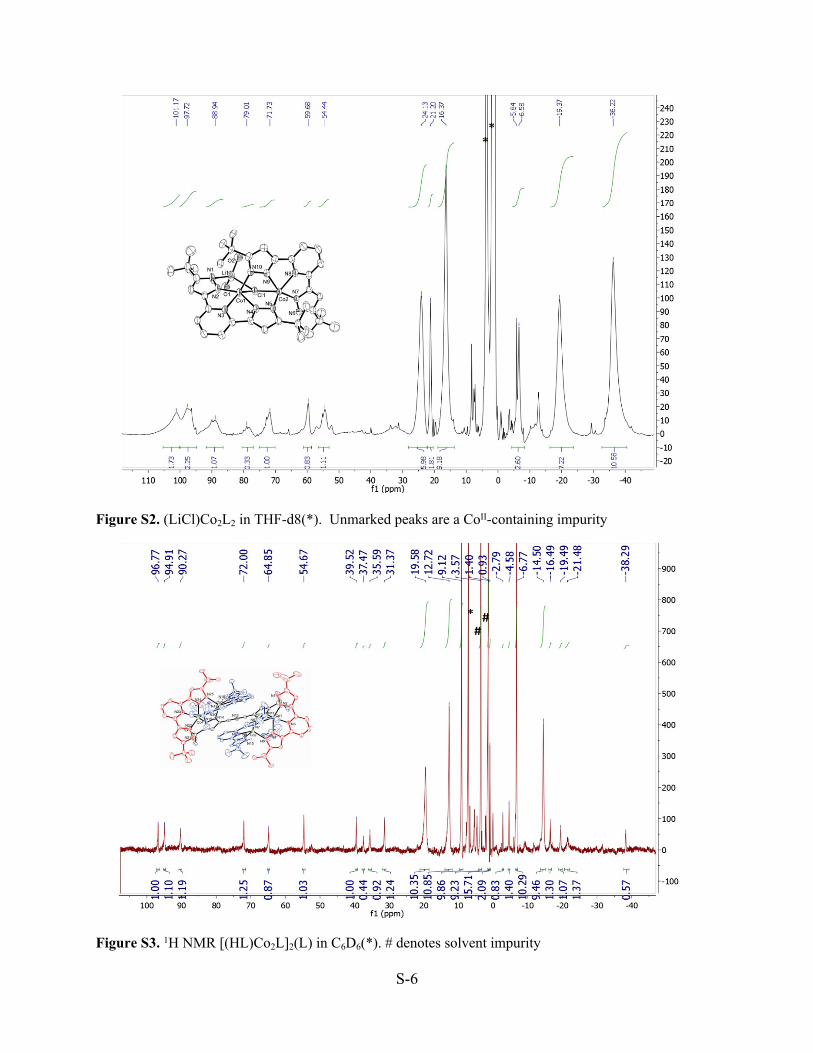


![L~~~~~St ,iiii~~ WI~ w nJUi · mr~ntl ~ 2 mrmqru 2t1mr~t1m~~rtum iJL~hli'gl,Y=lULtnn9 L~ftn 211If1u2ULt1UW!R~llil m b1 ~Ltn!J ft.isllG [] 1 n!ruJmm 2filt18 ~gmrmr f.3JGI 2 m6mt1 H2L~fl3JL~ru~tm](https://static.documents.pub/doc/80x56/5f5ad9f3c7f4a513ee613015/lst-iiii-wi-w-njui-mrntl-2-mrmqru-2t1mrt1mrtum-ijlhliglylultnn9.jpg)


