Jayati Sarkar Ekta Selarka MADRAS SCHOOL OF ECONOMICS Gandhi Mandapam Road Chennai 600 025 India October 2015 WOMEN ON BOARD AND PERFORMANCE OF FAMILY FIRMS: EVIDENCE FROM INDIA WORKING PAPER 130/2015
Transcript
Jayati SarkarEkta Selarka
MADRAS SCHOOL OF ECONOMICSGandhi Mandapam Road
Chennai 600 025 India
October 2015
WOMEN ON BOARD AND PERFORMANCE OF FAMILY FIRMS: EVIDENCE FROM INDIA
MSE Working Papers
Recent Issues
* Working Paper 119/2015Productivity, Energy Intensity and Output: A Unit Level Analysis of the Indian Manufacturing SectorSantosh K. Sahu and Himani Sharma
* Working Paper 120/2015Health Shocks and Coping Strategies: State Health Insurance Scheme of Andhra Pradesh, IndiaSowmya Dhanaraj
* Working Paper 121/2015Efficiency in Education Sector: A Case of Rajasthan State (India)Brijesh C Purohit
* Working Paper 122/2015Mergers and Acquisitions in the Indian Pharmaceutical SectorSantosh Kumar Sahu and Nitika Agarwal
* Working Paper 123/2015Analyzing the Water Footprint of Indian Dairy IndustryZareena B. Irfan and Mohana Mondal
* Working Paper 124/2015Recreational Value of Coastal and Marine Ecosystems in India: A Partial EstimatePranab Mukhopadhyay and Vanessa Da Costa
* Working Paper 125/2015Effect of Macroeconomic News Releases on Bond Yields in India China and JapanSreejata Banerjee and Divya Sinha
* Working Paper 126/2015Investigating Household Preferences for Restoring Pallikaranai MarshSuganya Balakumar and Sukanya Das
* Working Paper 127/2015The Culmination of the MDG's: A New Arena of the Sustainable Development GoalsZareena B. Irfan, Arpita Nehra and Mohana Mondal
* Working Paper 128/2015Analyzing the Aid Effectiveness on the Living Standard: A Check-Up on South East Asian CountriesZareena B. Irfan, Arpita Nehra and Mohana Mondal
* Working Paper 129/2015Related Party Transactions And Stock Price Crash Risk: Evidence From IndiaEkta Selarka and Subhra Choudhuryana Mondal
* Working papers are downloadable from MSE website http://www.mse.ac.in
$ Restricted circulation
WORKING PAPER 130/2015
i
Women on Board and Performance of Family Firms: Evidence from India
Jayati Sarkar
and
Ekta Selarka Assistant Professor, Madras School of Economics
Women on Board and Performance of Family Firms: Evidence from India
Jayati Sarkar and Ekta Selarka
Abstract
This paper provides evidence on the effect of women directors on the performance of family firms with a case study of India. Existing literature on the subject has primarily focused on widely held firms, notably in the US. Given that ownership structure and governance environment of family firms are distinctly different from those of non-family firms, the evidence on the relationship between women on board and firm performance in the context of widely held firms may not apply in the context of family firms. India provides an ideal setting for analyzing this question as the presence of family firms is pervasive and since 2013 India has instituted gender quotas on corporate boards. Using a data-set of 10218 firm year observations over a ten year period from 2005 to 2014 which spans the pre-quota and post-quota years, we find robust evidence that women directors on corporate boards positively impact firm value and that this effect increases with the number of women directors on board. However, we find that the positive effect of gender diversity on firm performance weakens with the extent to which the family exerts control through occupying key management positions on the board. In addition, women directors affiliated to the family have no significant effect on firm value, whereas - independent women directors do. Our results with respect to profitability are somewhat different; while as in the case of market value, women directors positively impact profitability with the positive effect driven by independent women directors, the effect does not vary with the extent of family control. Taken together, our results suggest that though gender diversity on corporate boards may positively impact firm performance in family firms in general, the extent of family control can have a significant bearing on this relationship. The findings from this study could be instructive for emerging economies like India in promoting gender-based quotas on corporate boards. Keywords: Board of Directors, gender diversity, promoter control,
ownership, regulation
JEL Codes: G32, G34, G38
iv
ACKNOWLEDGEMENT
We would like to thank Prof. Subrata Sarkar and the participants of the workshop on “Firm growth and corporate governance” held at IGIDR in September 2015 for their helpful comments and suggestions. We also acknowledge the research assistance provided by Mrinmoyee Chatterjee. The usual disclaimer applies. Jayati Sarkar is from the Indira Gandhi Institute of Development Research, Gen. A.K. Vaidya Marg, Mumbai –400605, INDIA.
Ekta Selarka
Jayati Sarkar
1
INTRODUCTION
The presence of women directors on corporate boards has been
increasingly recognized as a necessary component of good corporate
governance. The need to constitute gender diverse boards has been
primarily motivated by the business case, that it „pays‟ to have women
directors on boards as women have strengths and experiences distinct
from that of men that adds value to board deliberations and monitoring
of management (Adams and Ferreira, 2009, Davies Report, 2011; Rhode
and Packel, 2014). The crux of the arguments in favour of a gender
diverse board is that women are inherently distinct relative to their male
counterparts, are more “democratic, transformational and demonstrate
trust-building leadership style,” are more risk averse in financial decision
making, have higher ethical standards, are more conscientious, well-
prepared and are ready to ask “awkward questions”, and the presence of
women directors is likely to increase board independence and lead to
better decision making (for background literature, see Gul et. al., 2007;
Davies Report, 2011). The business case has been further bolstered by
the normative argument that achieving greater gender parity on boards is
by itself a desirable objective as the presence of women high up in the
corporate hierarchy can help draw attention to important social issues
such as family life and flexible work arrangements, thereby furthering the
cause of women empowerment and gender equality in the work place in
general (Francoeur et. al., 2008).
Arguments for greater gender diversity in company boards have
been accompanied by a slew of laws, regulations and voluntary initiatives
to increase the presence of women directors on company boards. Yet,
empirical evidence on the performance effects of women on boards,
measured in terms of market value and/or profitability, is surprisingly
mixed. Studies that find a positive effect of women directors on firm
performance (Carter et. al., 2003; Nguyen and Faff, 2007; Campbell and
Minguez-Vera, 2008; Adams and Ferreira, 2009; Lukerath-Rovers, 2013;
2
Liu et. al., 2014; Nguyen et. al., 2015) co-exist with studies that find no
effect (Hussein and Kiwiwa, 2009; Miller and Triana, 2009; Farrell and
Hersch, 2005), along with those that find a negative effect (Adams and
Ferreira, 2009; Ahern and Dittmar, 2012). The absence of unambiguous
positive effects of gender diversity brings into question quota based
policy initiatives that a growing number of countries, both developing and
developed, have been subscribing to, requiring boards to have a
minimum number/proportion of women in order to correct existing
gender imbalance at the board level so as to improve corporate
governance and firm performance.
An examination of existing empirical studies on women on board
and firm performance reveals that much of the relevant body of research
is confined to the analysis of the role of women directors in widely held
corporations with separation of ownership and control. Specifically, the
existing literature leaves out of its purview public corporations that are
characterised by concentrated insider ownership and control and typically
have a strong presence of families either in terms of voting rights, or
management control or both. Such firms are considered to be far more
prevalent in developed and developing countries around the world as
compared to widely held firms exemplified primarily in US based studies
(La Porta et. al., 1999; Maury, 2006).1 In fact, recent research highlights
the importance of family firms with concentrated ownership and control
even in the US, where such firms are estimated to account for
approximately one-third of Fortune 500 companies (DeMott, 2008;
Holderness, 2009). Among the countries that have introduced gender
quotas in the boardroom or are in the process of considering quotas, or
are witnessing institutional pressures on firms to constitute more gender
balanced boards, a substantial proportion of such countries are
1 For instance, La Porta et. al. (1999) find for their sample of 49 countries that the mean ownership of
the three largest shareholders in 46 per cent and at the 10 per cent cut-off of equity ownership, the
27 richest countries in the world in the sample have on an average 52 per cent of medium firms
owned by individuals or families.
3
dominated, not by widely held firms, but by firms with concentrated
ownership and control, many among which are owned and managed by
families. Among these are both developed and developing countries as
diverse as Spain, Denmark, Belgium, India, Kenya, Israel, Hong Kong,
Germany and Brazil.2 Notwithstanding this, the evidence on the impact of
women directors on corporate performance for firms with concentrated
ownership and control, specifically family firms, is sparse at best.
The objective of this paper is to provide empirical evidence on
the performance effects of gender diversity in corporate boards with a
case study of Indian family firms. The rationale for examining the impact
of women directors with particular focus on family owned and controlled
firms with concentrated ownership structures (henceforth, family firms) is
dictated by the consideration that such firms, as a growing scholarship on
ownership and governance highlight, have ownership and governance
structures that are distinctly different from those of widely held firms,
giving rise to corporate governance challenges that are specific to such
firms (Anderson and Reeb, 2004; DeMott, 2008). Specifically, family
firms are considered to be unique in comparison to non-family firms in
terms of agency problems as manifested in ownership patterns,
governance structure, management, motivation, objectives and social
value systems (Zahra et. al., 2004; Pieper, 2010). Given this, a question
of interest is whether women directors matter in these firms in ways that
are different from that in widely held firms. Encompassing this question is
the larger question of general interest as to whether the governance
environment of a firm matters in determining the relationship between
gender diversity and firm performance. Limited empirical evidence shows
that the institutional environment in which firms operate can matter in
the effect of gender diversity on firm performance (Liu et. al., 2014;
2 For a discussion on policies on gender diversity on boards, and a list of countries under different
policy regimes, see the weblink Increasing Gender Diversity on Boards: Current Index of Formal
Nguyen et. al., 2015), and that the effect can be sensitive to the quality
of firm level corporate governance as manifested in the quality of
monitoring (Adams and Ferreira, 2009) and in the quality of firm-level
disclosures (Gul et. al., 2011). In our paper, we focus specifically on
whether family firm dominance, as manifested in ownership and control
structures, affects the relationship between gender diversity and firm
performance. As the literature on governance of family firms suggest
especially with respect to the role and functioning of corporate boards,
directors on boards of family firms as compared to widely held firms may
require different strategies and skill sets as well as incentives to impart
their fiduciary duties of monitoring and advising management (Anderson
and Reeb,2004; DeMott, 2008). A case in point is the role of independent
directors in family firms who are required to be one of the “primary lines
of defense” for minority shareholders to guard against expropriation by
controlling shareholders (Anderson and Reeb, 2004).
Our primary hypothesis is that family firm dominance may impact
the relationship between gender diversity in board and firm performance
in ways that can be distinct from widely held firms. This is built from
juxtaposing the literature on characteristics and governance of family
firms with the literature on gender attributes that highlights how women
and men directors differ in terms of monitoring attributes and skill sets
(Adams and Funk, 2011; Bertrand, 2011; Nielson and Huse, 2011; Matsa
and Miller, 2010). As stated earlier, family firms are fundamentally
distinct from their widely held counterparts, in terms of the nature of
agency problems and operating environment. If we consider alongside
this the gender attributes of directors found in the social psychology and
experimental literature, of how men and women in the general
population, and in the population of directors, differ in terms of their
value systems and capabilities, one can argue that the effectiveness of
women directors in family firms is likely to be different with regard to
corporate governance and firm performance. As actions can be predicted
5
by value systems, systematic differences in value systems of directors by
gender can help predict the effect of gender diversity on corporate
outcomes (Adams and Funk, 2011). By mapping gender attributes of
directors to characteristics of family firms, one can identify ways in
which dominant attributes of women directors, such as universalism and
benevolence, conformism and tradition (Schwartz, 1992), may matter for
family firm governance relative to the governance of widely held firms,
and can therefore yield differences in outcomes. As we will discuss in
greater detail in Section 2 of this paper, the reduced form effect of the
attributes of women directors on performance is a priori unclear and
therefore the relationship between board gender diversity and
performance in family firms becomes an empirical issue.
The choice of Indian corporates to provide evidence on the
impact of women directors on corporate performance of family firms is
dictated by several important considerations. First is the obvious fact that
a large majority of publicly held corporations in India are characterised by
concentrated ownership and control structures and widely held firms with
diffused ownership are an exception rather than a rule. Second, firms
with concentrated ownership and control account for almost 80 percent
of market capitalization. Further, if we employ the common definitions of
family firms in the literature (Anderson and Reeb, 2003) of members of
founding family (referred to promoters in India) owning at least 20 per
cent of voting equity, family firms account for almost 95 per cent of firm
year observations in our sample. Such firms include both firms affiliated
to business groups and standalone firms. This provides us an opportunity
to utilize the variation in concentrated ownership structures through
board itself which has not been studied in the literature in the context of
gender diversity.
The second reason for India being an appropriate setting for
analyzing the issue at hand is that we can naturally exploit the variation
6
in the ownership and control structure of firms in India to analyse first
the effect of women directors in family firms, and then whether the
effectiveness of women directors depend on the governance structure as
manifested in the extent of family control on the board of directors.
Evidence from US firms suggest that the effect of gender diversity on
performance depends on how a firm is governed in terms of its ability to
resist takeovers (Adams and Ferriera, 2009), while evidence from
Chinese listed firms (Liu et. al., 2014) show that the impact of female
directors on performance depends on whether the firm is a legal person-
controlled firm or a state-controlled firm. In our paper, we contribute
evidence on whether the impact of gender diversity varies with the
extent to which members of the founding family have control in
management. In India, the management control structure of family firms
can be distinguished in terms of the extent to which founding family
members or promoters hold key managerial positions on the board, of
that of a Chief Executive Officer (CEO) and a Chairperson. This could
range from them having no control, when a promoter is neither a CEO or
a Chairperson, to those with full control of the board in terms of a
promoter holding the post of both chairperson and CEO. By evaluating
the performance effect of women on board by type of founding family
control, we seek to capture whether the governance by women directors
is subject to founding family influence on the board. This question in our
opinion assumes particular importance in light of the institution of gender
quotas in family controlled firms around the world. The question is also
linked to the larger social psychology literature on the extent to which
outside directors, particularly women directors, can be effective in
governance in the presence of an authoritative, and by and large, male
figure such as the promoter who may hinder independent judgement.
Experiments in social psychology highlight how simple elements of
human behavior (like loyalty) impede the independent decision making
calculus of an individual. Morck (2004) for instance argues that in the
absence of complementary mechanisms, genuine independence of
7
directors from management may prove elusive; directors out of a sense
of loyalty seldom oppose the CEO‟s decisions even at the expense of a
director‟s fiduciary duty and enjoys a positive sense of well-being from
their reflexive obedience to the CEO. This is a distinct possibility
especially in firms with controlling shareholders who often occupy
important positions on corporate boards, and significantly influence the
selection and appointment of outside directors and also tend to be
hierarchical and deference-oriented (De Mott, 2008). The academic
literature on the pros and cons of having women directors on board and
women-director attributes does suggest that men and women can be
different in terms of how they respond to control and loyalty issues.
The third reason why a study of gender diversity of boards in
India is relevant and is of general interest is that India has been the
latest to join this breed of countries whereby a mandatory gender quota
in corporate boards of public limited companies has been introduced in
the new Companies Act, 2013. The evolution of the law on gender quota,
beginning from the time it was drafted in 2011, to its compliance
deadline of April 1, 2015, forms a natural setting to evaluate the effect of
gender quota using an exogenous policy shock. Such exogenous policy
shocks help bypass the problems of estimation arising from the possible
presence of endogeneity in the relationship between women directors
and firm performance (Ahern and Dittmar, 2012). In the Indian context,
we can identify four policy regimes in this respect, one when appointing
women on board was voluntary (prior to 2011), second is the prospective
quota regime, between 2011 and 2013, third is the transition regime
between the announcement of the Companies Act, 2013 in the year 2013
when companies started complying to meet the compliance deadline of
April 1, 2015, and finally the post compliance period, post April 1, 2015.
The panel data set for the current study with 10218 firm-year
observations span a period of eleven years from 2005-14 including the
first three regimes. Using the Indian policy experience, we thus have the
8
advantage of examining within the same institutional context the effect
of women directors on boards both when appointments were voluntary
and when quotas were in the process of being introduced. In doing so,
we incorporate elements of both strands of studies on gender diversity at
the board level, the US based studies (notably, Adams and Ferreira,
2009) examining the effect of women directors in a no-quota regime and
studies in a post-quota regime, being based in countries that have
introduced quotas, such as Norway and Denmark (Ahern and Dittmar,
2012) in a unified framework. Consistent results across the two
approaches will ensure that our findings are robust independent of the
estimation methodology.
Finally, an examination of the role of women directors in Indian
firms contributes to the limited evidence on the subject not only with
respect to family firms, but also with regard to such firms within the
institutional context of developing/emerging economies. As Rhode and
Packell (2014) point out, the relationship between board characteristics
and firm performance could vary by regulatory regimes and governance
structures, economic climate, culture as well as the size of capital
markets. The most oft-quoted studies on gender diversity of boards in a
no-quota scenario are with respect to US firms, and those with respect to
gender quota scenarios, and these are fewer, are with respect to
countries that have introduced quotas, notably Norway and Denmark.
The exceptions in this respect are two recent studies with respect to
Vietnam (Nguyen et. al., 2015) and China (Liu et. al., 2014), both
emerging economies with relatively weak corporate governance systems
and both with not mandating quotas for women at the board level.
Given that empirical findings have an influence on policy, we believe that
we need a larger body of evidence on gender diversity on boards from a
larger cross-section of countries across different institutional contexts to
enable a more informed policy on gender quotas, especially for countries
9
that are in the process of adopting or deliberating on such quotas.3
While the weight of evidence of the effect women board gender diversity
on firm performance coming out of developed country studies is towards
the absence of a positive effect of women directors, the findings of
developing/emerging economy studies on Vietnam and China point to a
positive effect on firm performance, suggesting that institutional context
of a country may matter in the relationship between board diversity and
firm performance.
In order to estimate the relationship between women on board
and firm performance in the context of family firms, we use panel data
methods and instrumental variable approach to account for omitted
variable bias, endogeneity and reverse causality which are the main
empirical challenges in the literature (Adams and Ferreira, 2009; Liu et.
al., 2015). In addition, the long duration of the data, as well as the
exogenous shock of quota legislation, offers us an opportunity to conduct
difference-in-difference analysis to obtain further robust estimates of the
effect of women directors on firm performance. Using our data set, we
address the following key empirical issues, namely whether women on
board matter for firm performance measured both in terms of market
value and firm performance, whether the effect is different for family
firms, whether the effectiveness of women directors depend on the
extent of management control exerted by the founding family, and finally
whether women grey directors in family firms are more effective than
women independent directors. The key findings of our empirical analyses
are as follows. Consistent with the findings with respect to Vietnam and
3 On last count, countries as diverse as Spain, Norway, Netherlands, Kenya, Italy, Israel, India,
Iceland, France, Finland, Denmark, Canada (Quebec), Belgium, Greece have legislated gender quotas, countries such as Australia, China, Denmark, Finland, Germany, Hong Kong have
regulations that require disclosure of gender composition of boards mandatory, and countries such
as Brazil, Canada, along with EU which have legislative measures pending. See the weblink Increasing Gender Diversity on Boards: Current Index of Formal Approaches
As discussed in the introduction, family firms are fundamentally distinct
from their widely held counterparts with respect to a number of
important parameters that are relevant for governance. Given this, how
are women directors expected to fare relative to their male counterparts
in the governance of such firms, with associated implications on firm
performance? What are the distinct advantages/disadvantages of women
directors, given the governance issues in family firms? We attempt to get
some insights into these questions by drawing on the social psychology
and governance literature.
Let us first consider the nature of the agency problem in family
firms. The key agency problem is opportunistic behavior by founding
family members as manifested in the extraction of private benefits of
control at the expense of minority shareholders. As has been
documented in the literature, such benefits take the form of insiders
expropriating firms resources through excessive compensation, special
dividends and perquisites, and self-dealing (Anderson and Reeb, 2003;
Masulis, 2009). Such incentives as well as the ability to expropriate are
particularly strong when families not only have concentrated ownership
but have management control through their presence on the board of
directors. For instance, a family member as the Chief Executive Officer
(CEO) has large discretionary powers as well as „sufficient power‟ over
firm decisions and can affect corporate decision making which in turn can
facilitate expropriation of minority investors (Allen and Panian, 1982;
Berkman et. al., 2009). From the point of view of an outside director on
the board, the problem of governance in family firms therefore shifts
from devising strategies to align the interests of the manager and
shareholders and maximising shareholder value, to balancing the
12
conflicting interests of the two major blocks of shareholders. Under such
circumstances, as DeMott (2008) observes, independent directors should
be extra vigilant to guard against the expropriation of assets by a
controlling shareholder whether in collusion with senior management or
not. If conflicts between shareholder groups are not addressed, firm
value can be affected adversely (Claessens and Fan, 2002, Maury, 2006).
With respect to the second important feature of family firms, it is
observed in the context of examining the role of independent directors in
such firms that family firms have a complex operating environment
characterised by hierarchies, patterns of deference and nepotism, as well
as intra-family conflicts that could include inter-generational squabbles,
nepotism and entrenchment, all of which can distract from maximising
performance (De Mott, 2008; Miller et. al., 2007). Family owners and
managers are not a homogenous lot with convergent expectations and
objectives – individual roles as family member, equity owner or
participant in business management and operations may sometimes
overlap and sometimes collide. Family members, several likely to be
present on the board as grey directors, may also be less responsive to
outside suggestions or be ready to view facts objectively. Such
characteristics, several authors (DeMott,2008; Anderson and Reeb, 2004
and the references therein) argue, make the functioning of a director,
particularly an independent director, challenging. Effective service as an
independent director requires maintaining objectivity while functioning
within the bounds of family norms, buffering senior management from
family shareholders whether they are or are not fellow members of the
board, as well as assessing and moderating the stated preferences of
family shareholders and the interests of the non-family shareholders.
Under such circumstances, independent directors discharging their
fiduciary duty should be capable of resolving difficult management and
ownership issues with objectivity and with a sense of detachment, and
13
ensuring that intra-family frictions do not stand in the way of firm
performance and interests of minority shareholders.
Given the specific characteristics of family firms, how can gender
on board matter in corporate performance particular with respect to this
class of firms? Linking key family firm characteristics with gender
attributes, found both in the level of the general population as well as the
director level, one can argue that attributes that are dominant in women
may matter in ways that these would not in widely held firms. In arguing
that gender diversity on boards can matter, the extant literature in
general has identified certain qualities of women that may positively
matter in governance, such as distinct leadership style, attitude towards
risk in financial decision making, higher ethical standards, less
conformist, and higher capabilities to reach out to stakeholders.
Additionally, several attributes of women can be identified from the
behavioral and experimental literature that may work to a greater
advantage of women directors in family firms. For instance, attributes of
benevolence and universalism4 as identified by Schwartz (1992), that are
found to be stronger in women directors compared to their male
counterparts, may be more suitable for resolving various types of
conflicts within family firms as also with minority shareholders, thereby
contributing positively to firm performance. At the same time, evidence
of women directors being less security-oriented and less tradition bound
than men, found in the context of Swedish firms (Adams and Funk,
2011), suggests that women directors in family firms can be less
influenced by norms and practices such as hierarchical structure and
4 According to Schwartz(1992), benevolence is defined as preservation and enhancement of the
welfare of people whom one is in frequent personal contact (helpful, honest, forgiving, loyal and
responsible). Universalism is defined as understanding, appreciation, tolerance and protection for the welfare of all people and for nature (bROAdminded, wisdom, social justice, equality) (Source:
Adams et. al. (2009), Table 1).
14
deference than male directors, and hence be more objective in
monitoring, which in turn can impact family firm performance positively.5
Co-existing with the specific attributes of women directors
relative to their male counterparts that can positively impact family firm
performance, are potential drawbacks. Family firms are found to be
more inclined towards stakeholderism as compared to shareholderism in
widely held firms (De Mott, 2008). Stakeholderism is considered to be
associated predominantly with attributes of security, conformity,
tradition,6 benevolence and universalism (Adams et. al., 2009), found to
be stronger in women directors. Thus, with women present on boards in
family firms, the firm‟s focus on maximising profits and shareholder
value may be impaired. Support for this contention is found in Matsa and
Miller (2011), who find in the context of the institution of gender quotas
in Norway that Norwegian firms affected by gender quotas undertook
fewer workforce reduction which in turn led to a reduction in short term
profits and that the results are consistent with prior research suggesting
that female managers may be more stakeholder or long-term oriented
than their male counterparts. Additionally, the dominant attributes of
women directors, such as benevolence, universalism, tradition and
conformism can have a downside too and act as a disadvantage in this
respect and adversely impact their ability to govern. Such value systems,
5 The argument here is that of „selection,‟ when women who make it to the top as directors, just
having to survive against odds, care less about tradition, conformity, security and are more stimulation oriented than men contrary to what is found in the general population (Adams and
Funk, 2011). If that is the case, then women directors could be in a better position not to be
influenced by controlling shareholders, and would be more objective in strategizing and
monitoring management.
6 According to Schwartz values (1992), security is defined as safety, harmony and stability of society, of relationships and of self (family security, national security, social order, clean reciprocation of
favours; Conformity defined as restraint of actions, inclinations and impulses likely to upset or
harm others and violate social expectations or norms(self-discipline, obedient, politeness, honoring parents and elders; Tradition defined as respect, commitment and acceptance of the customs and
ideas that traditional culture or religion provide (Source: Adams et. al., 2009; Table 1).
15
while having their benefits in family firms, can also raise the prospect of
women directors being less vigilant than their male counterparts, in
monitoring minority shareholder expropriation. This can especially be the
case when controlling shareholders camouflage private benefits under
the garb of encouraging stewardship and responsibility rather than about
personal benefits (DeMott, 2008). While this can be an area of concern,
evidence on the ground seem to suggest that women directors can be
more objective and prevent corporate corruption, are “bold enough to
ask management the tough questions,” and are more likely to raise
questions related to multiple stakeholders (Rhode and Packel,2014).
The above discussion on the potential comparative
advantages/disadvantages of women directors in the corporate
governance of family firms suggests that the effect of gender diversity at
the board level on firm performance is an open question. While certain
attributes of women directors may act as an advantage for firm
performance, some others may act as a disadvantage. Moreover, some
attributes may have both positive and negative effects in the context of
family firms, and hence it is a priori unclear as to the net effect of
women directors on board. Our case study of Indian family firms with
concentrated ownership and control is expected to throw some insights
into the issue.
In order to gain a perspective on the empirical analysis
undertaken with Indian data, it is important to briefly discuss the
institutional context of family firms and the issues related to women on
corporate boards in the country. As in most other countries, women have
been consistently under-represented in corporate boards in the country
with less than 5 per cent of board seats held by women in large Indian
companies. Differences in labour force participation rate at the population
16
level, as well as the phenomena of „sticky floors,‟ and „glass ceilings‟7 and
leaking pipeline indicate that there are structural constraints on the way
of up the corporate ladder for women professionals. These constraints
are present disproportionately more in developing countries like India
and can include differential access by gender to educational and
employment opportunities (World Bank; IMF), preference for male
workers as women are seen to have a weaker attachment to the labor
market (Anker and Hein,1985) and, “structural distribution of rules,
norms, assets and identities” built into market forces historically through
discriminatory practices as well by powerful actors who exercise their
bargaining power (Kabeer, 2012). Overall, India which has one of the
lowest female labour participation rates in the world and ranks 114th out
of 142 countries in the Gender Gap Index as of 2014 (WEF,2014),
To put the Indian gender gap in the corporate boardroom in
perspective, according to available estimates, while the labour force in
India comprise of 36 per cent of women, employment in organisations
comprise of 26 per cent of women, only 3 to 6 per cent of women
account for senior management positions and 4.7 per cent of board
positions are accounted by women.8 This phenomenon of attrition of
women as one moves up the corporate ladder and dubbed as the
“Leaking Pipeline” is widely prevalent in India, placing it among the
lowest among its Asian cohorts (McKinsey, 2012; Community Business,
7 Motherhood penalty captures the situation when employers discount the contribution of employees
who are mothers as compared to that by fathers. Sticky floors capture gender bias in job promotions whereby women are less likely to start climbing the job ladder than men (Baert et. al.,
2014). Glass ceilings on the other hand describes that women, when compared to men, are less
likely to reach the top of the job ladder.
8Further details can be found at: http://www.catalyst.org/knowledge/india-case-gender-diversity-0.
Estimates by McKinsey (2011) also paint a similar picture; while the proportion of women among
entry level graduates is around 42 per cent, women constitute 29 per cent among entry level professionals, thereafter exhibiting a sharp drop as one moves up, with 9 per cent women
comprising of mid to senior level management, 3 per cent present in executive committees, one
per cent employed as CEOs and occupying 5 per cent of board positions.
2011).9 What is more significant is that India is that while the leakage in
other countries is the highest between middle and senior level positions,
in India, this attrition takes place much earlier between junior and middle
level positions (Community Business, 2011).
With regard to the policy framework with respect to gender
quotas in India, while corporate governance reforms started in earnest
with the setting up of the Kumara Mangalam Birla Committee in 1999
and the subsequent institution of Clause 49 by the Securities Exchange
Board of India based on the Committee‟s recommendations, it was not
until the enactment of the Companies Act, 2013,10 that gender diversity
on corporate boards received any attention. The focus of all committees
that were set up over the years to examine and recommend corporate
governance best practices related to the functioning of corporate boards
primarily deliberated on ways and means to ensure board independence.
The first time the issue of gender diversity on boards came up was in the
Draft Companies Bill, 2011, and the provision of having at least one
woman director on the boards of Indian companies was finally enacted as
Section 149(1) of the Companies Act 2013.11 The requirement is not
specified for any type of director, so that a woman on board can either
9 McKinsey (2011) for instance reports that while the proportion of women among entry level
graduates is around 42 per cent, women constitute 29 per cent among entry level professionals,
thereafter exhibiting a sharp drop as one moves up, with 9 per cent women comprising of mid to
senior level management, 3 per cent present in executive committees, one per cent employed as CEOs and occupying 5 per cent of board positions.
10 The recommendations of the J. J. Irani Committee set up in 2005 which largely formed the basis of
the new Companies Act, 2013, replacing Companies Act 1956 did not include any provision on
gender diversity.
11 The rules to implement this Section, as under consideration specify that “For the purposes of second proviso to sub-section (1) of section 149 the following class of companies shall appoint at
least one woman director within the period indicated against each of them, as under:-
(i) every listed company - within one year from the commencement of second proviso to sub-section (1) of section 149; (ii) every other company having a paid–up share capital of one hundred crore
rupees or more – within three years from the commencement of second proviso to sub-section (1)
of section 149. See http://www.taxmann.com/datafolder/News/CHAPTER percent20XI.pdf
be an executive director, grey director or independent director. This is in
line with quota provisions in all countries where the quota is specified
generally in terms of a woman director and not by her role on the board.
With regard to the compliance with the quota, the road map
that was set at the enactment of the Act was altered from time to time;
the first compliance date set was October 2014. This deadline was later
extended and further regulations of all listed companies under Clause 49
of the Listing Agreement of the Securities Exchange Board of India
require all listed companies to appoint at least one woman director on
the board by April 1, 2015.
Along with providing evidence on whether family control matters
in impacting the relationship between women directors and firm
performance, analysing the impact within the Indian institutional context
can throw light on an issue of general significance, that of tokenism
(Kanter, 1977). Given that the quota in India is set at the bare minimum
level of one woman director, would adding one woman to a board that
had no women directors earlier, be just a token action dictated by
normative considerations rather than the business case? As Liu et. al.
(2014) argue, the presence of only one female director, that is necessary
to meet the gender quota, may be considered as only a token by both
inside and outside shareholders so that her impact on firm value is likely
to be limited unless the market values gender diversity as a desirable
social goal in itself. However, an Indian case study is interesting as it
throws up the possibility that a minimum addition of one director may
matter after all if one considers the self-selection argument with regard
to women directors. One of the reasons of a greater likelihood of a
positive effect of women directors is because the costs of women vis-à-
vis men of choosing a career path leading to board positions can be
expected to be higher in developing countries than in developed
countries and that women directors who survive in the labour market
19
despite the various obstacles in the labour market, more capable women
self-select themselves in directorial positions. At the same time due to
challenges faced by women in general to pursue such high profile career,
market can comprehend gender diversity as signal about reduced
information asymmetry to small investors which in turn may result into
higher valuation.
Corroborating the self-selection argument, Adams and Funk
(2011) find in the case of Swedish firms that values such achievement,
power, self-direction and stimulation that positively impact firm
performance and are more prevalent in men in the general population,
are stronger in women at the director level. Further, such differences in
favour of women, the authors argue, are likely to be higher („extreme‟) in
countries where the costs of choosing a career are even higher. This in
turn could be reflected in a positive relationship between women
directors and firm performance. Evidence to this effect especially with
respect to independent women directors in family firms, from a country
like India which has one of the lowest female labour participation rates in
the world and a low level of gender diversity, can provide support to such
a hypothesis. On the other hand, if much of the compliance to gender
quotas happens through the addition of women grey directors with family
ties with regard to whom the selection argument does not necessarily
apply, together with the fact that t grey directors are likely to be less
objective, contribute little to corporate monitoring and side with the
controlling shareholder, one can expect that women on boards are
unlikely to have a positive effect on firm performance.
DATA, VARIABLES AND ESTIMATION METHODOLOGY
Data
The advantage of a case study of gender diversity on corporate boards
with Indian data lies in the richness of firm level data on firm
characteristics and corporate governance variables that are available in
20
the public domain as per regulatory requirements imposed on listed firms
by the country‟s securities market regulator, the Securities and Exchange
Board of India (SEBI). Our sample consists of an unbalanced panel of all
manufacturing companies for a ten year period, 2005-14, listed on the
National Stock Exchange, India‟s premiere stock exchange, for which we
could obtain information on the board of directors from the CMIE
Prowess database. The Prowess database contains information on
directors from company annual reports or corporate governance reports,
and includes the names of the directors, director‟s designation as well as
the identification of whether the promoter of a company holds
management positions of CEO or chairperson on the board.
We correct for many issues in the data. Firstly, gender is not
provided in the database directly. Therefore, we checked every director‟s
name as well his/her initials to identify the gender of the director and
also correct for any inconsistencies in the spellings/initials of the names
to ensure tracking of the same director. Secondly, the date of
appointment is not available from the database for all the directors, so
we used the initial sample from 2001 to identify firms with no woman
director until 2011 which covers a decade of not appointing any woman
director voluntarily. This information is used specifically for difference-in-
difference analysis. The choice of the financial year 2005 as our first year
for our empirical analysis is dictated by the fact that by this year, most of
the corporate governance regulations for listed companies under Clause
49 of the Listing Agreement of SEBI, were adopted, firmed up and
enforced.12
12 The implementation of Clause 49 took place in a phased manner. In 2001, the largest firms (those
listed under flag “A” at the BSE) were expected to comply. Then in 2002, another, much larger,
group of medium-sized firms were expected to comply. The remaining Clause 49 firms (the
smallest in size) were expected to comply in 2003. Finally, in October 2004, there were further revisions made to Clause 49 and financial penalties were imposed on non-complying firms. While
implementation was phased in for existing firms, all firms that listed for the first time in 2000 or
subsequent years were expected to comply, regardless of their size, from the time of listing.
21
We further obtain detailed ownership information, financial data
and stock price data from the Prowess database. The final sample is the
sample of firms for which we have full information on board of directors,
financial variables, ownership, and stock prices. We also obtain
incorporation year, business group affiliation and National Industrial
Classification (NIC) from CMIE-Prowess. We exclude firms that are
controlled by the government or have joint public-private ownership as
this could significantly affect the appointment of directors and also the
market valuation of such appointments in general. We also exclude firms
from industries such as real-estate, trading and utilities as measurement
of performance of firms in these industries can depend on other factors
such as valuation of intangible assets. Our final sample of complete
director and firm-level data consists of 1,09,328 (director firm-years) in
10,218 firm-years of data on 1348 firms after correcting for outliers in
the dependent variable.
Prowess also provides a classification of director as executive,
promoter and independent. We verify this classification based on
directors‟ designation and ownership. Directors are classified as
independent if they do not hold executive position, or have not held
executive position for last three years, do not hold one per cent or more
ownership and are not related to the promoter/s of the firm.
Variables
The variables used in our empirical analysis can be grouped into three
categories, (i) dependent variables measuring company performance (ii)
variables of interest describing the measures of gender diversity and (iii)
control variables describing the observable characteristics of the company
which might also affect its performance.
22
Dependent Variables
As is standard in the literature, we use two measures of performance as
dependent variables in our regressions, namely, Tobin‟s Q that measures
market value of a firm and Return on Assets (ROA) to measure firm
profitability. Tobin's Q is defined as the ratio of market value of equity
and market value of debt to the replacement cost of assets Tobin‟s Q is a
market-based measure of financial performance and is a forward looking
measure. However, in India, as in many developing countries, the
calculation of Tobin‟s Q is difficult primarily because a large proportion of
the corporate debt is institutional debt that is not actively traded in the
debt market. Also, most companies report asset values to historical costs
rather than at replacement costs. We, therefore, in line with earlier
2014), calculate a proxy for Tobin‟s Q by taking the book value of debt
and the book value of assets in place of market values.13 To mitigate the
potential effects of outliers, we transform Tobin's Q into natural
logarithmic form, lnqratio and also truncate 1 percent of top and bottom
percentile.
The profitability measure, ROA, is defined as the ratio of net
income before interest, taxes, depreciation and extraordinary items to its
book value of assets. Being an accounting measure, ROA is a backward
looking measure.
13 Another measure of company performance can be obtained by dividing the market value of the
company (calculated by the market value of equity plus the book value of debt) by total sales
instead by total assets. While this measure might have merit with respect to other countries, this was not the case for our sample of Indian companies where our analysis revealed a very low
correlation of this measure with MBVR and PQ-Ratio. This was in turn on account of the
inefficient asset utilization by many small and young firms that our analysis revealed.
23
Variables of Interest
The key variable of interest in this study is gender diversity at the board
level. We use the entire range of measures that have been used in
existing studies. These are as follows:
(i) The presence of women directors on board (dfdir), measured as
a dummy variable which equals one if the board has at least one
woman director and zero otherwise.
(ii) The number of women directors on board (nfdir) measured as
the total number of women directors in absolute terms.
(iii) The percentage of women directors on board (pfdir), one of the
most common measures in the literature (Adams and Ferreira,
2009; Ahern and Dittmar, 2012). pfdir measures women directors
on board as a percentage of total board size.
Under some policy scenarios, when quotas are stipulated in
terms of absolute numbers rather than percentages as in the case of
India, it is necessary to measure the effect of gender diversity without
normalizing with respect to board size. An absolute measure is also
based on the idea of “critical mass theory” that it is the number of
women directors that matters in firm performance, that one woman
conveys tokenism, having two women signifies presence, and having
three makes a difference in terms of voice and their influence on board
deliberations;14 if board size increases alongside an increase in the
number of directors, a change in absolute numbers may not be reflected
in a change in percentage, yet board dynamics may change once the
number of women directors increases to reach a critical mass (Simpson
et. al., 2010). The choice of the measures of gender diversity under (i)
and (ii) are particularly relevant to the Indian scenario where the quota
has been defined in terms of absolute numbers.
14 Please see Kristie (2011) and Kramer et. al.(2007), cited in Liu et. al. (2014).
24
While the above measures of gender diversity do not distinguish
between the type of women directors, we also explicitly examine the
effects of women director by the type of position held by women outside
directors, namely woman independent director and woman grey director.
Analogous to our general definition of gender diversity above, we define
presence of woman independent director/grey director as a dummy
variable, (dfnedi/ dfgreydir), the number of women independent
director/grey director as (nfnedi/nfgreydir) and the percentage of women
independent/grey director (pfnedi/pfgreydir) on the board.
Control Variables
In addition, we follow the recent literature and control for the firm
specific characteristics that may also affect the firm performance.
Specifically, we include, the following, namely firm age (age), board size
(bodsize), leverage (levrg) and size measured as log of total assets (size)
respectively.
Since our sample firms comprise of both family and non-family
firms, we use a dummy to distinguish between the two ownership types.
Using the commonly used definition of family controlled firms in the
literature (Anderson and Reeb, 2003), we define the dummy variable fam
using the following criterion, fam equals one if the family/promoter
control in terms of voting rights is at least 20 per cent.
Finally, a key set of control variables that we use to examine how
the effect of women directors on firm performance changes with
variation in management control are defined in terms of whether the
promoter (founding family) of a firm is occupying a key managerial
position on the board. We consider two types of key managerial positions
in this respect, one that of a Chairperson and the other of a CEO. As
discussed briefly in the introduction, following (Luo and Chung, 2012),
25
we consider four types of management control across our sample firms
and define the following dummy variables:
(i) No Control (ctrl_1): ctrl_1=1 when the promoter is neither a
chairperson nor CEO; equals zero otherwise.
(ii) Full Control (ctrl_2): ctrl_2=1 when the promoter is both the
chairperson and the CEO; equals zero otherwise.
(iii) Operational Control (ctrl_3): ctrl_3=1 when the promoter is
CEO only; equals zero otherwise.
(iv) Strategic Control (ctrl_4): ctrl_4=1 when the promoter is
Chairperson only; equals zero otherwise.
Along with these variables we include industry dummies as
controls to account for the fact that some industries may be structurally
more women-oriented than others (services, fast moving consumer
goods for instance), and time dummies to account for changes in the
macroeconomic environment.
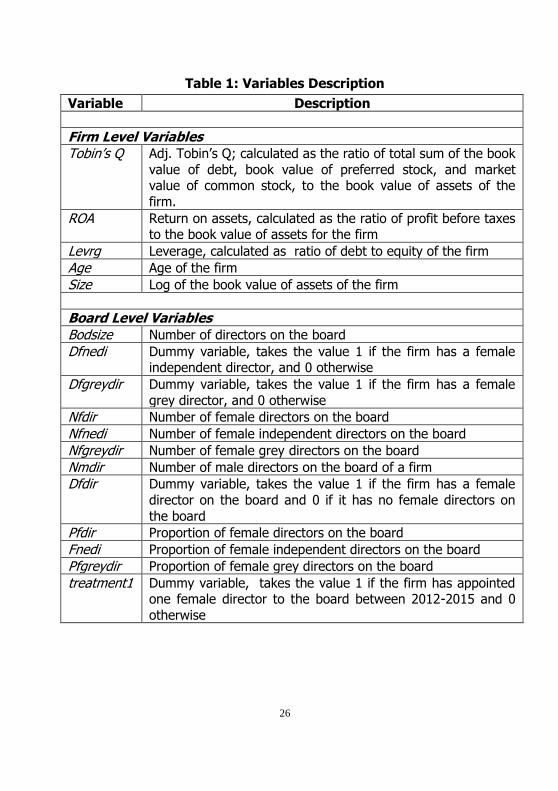
Table 1 provides the names and definitions of all variables used
in our empirical analysis.
26
Table 1: Variables Description
Variable Description
Firm Level Variables
Tobin‟s Q Adj. Tobin‟s Q; calculated as the ratio of total sum of the book
value of debt, book value of preferred stock, and market value of common stock, to the book value of assets of the
firm.
ROA Return on assets, calculated as the ratio of profit before taxes to the book value of assets for the firm
Levrg Leverage, calculated as ratio of debt to equity of the firm
Age Age of the firm
Size Log of the book value of assets of the firm
Board Level Variables
Bodsize Number of directors on the board
Dfnedi Dummy variable, takes the value 1 if the firm has a female independent director, and 0 otherwise
Dfgreydir Dummy variable, takes the value 1 if the firm has a female
grey director, and 0 otherwise
Nfdir Number of female directors on the board
Nfnedi Number of female independent directors on the board
Nfgreydir Number of female grey directors on the board
Nmdir Number of male directors on the board of a firm
Dfdir Dummy variable, takes the value 1 if the firm has a female
director on the board and 0 if it has no female directors on
the board
Pfdir Proportion of female directors on the board
Fnedi Proportion of female independent directors on the board
Pfgreydir Proportion of female grey directors on the board
treatment1 Dummy variable, takes the value 1 if the firm has appointed one female director to the board between 2012-2015 and 0
otherwise
27
Variable Description
treatment2 Dummy variable, takes the value 1 if the firm has appointed
one female director to the board in 2012 or 2013, and 0 otherwise
treatment3 Dummy variable, takes the value 1 if firm has appointed one
female director to the board between 2014 or 2015, and 0 otherwise
after1 Dummy variable, takes the value 1for the years 2012-2015, 0
otherwise
after2 Dummy variable, takes the value 1for the years 2012 and
2013, 0 otherwise
after3 Dummy variable, takes the value 1for the years 2014 and 2015, 0 otherwise
Control Variables ctrl_1 Dummy variable takes value 1 when the promoter is neither
a chairperson or CEO; equals zero otherwise.
ctrl_2 Dummy variable takes value 1 when the promoter is both a
chairperson or CEO ; equals zero otherwise.
ctrl_3 Dummy variable takes value 1 when the promoter is CEO
only; equals zero otherwise.
ctrl_4 Dummy variable takes value 1 when the promoter is Chairperson only ; equals zero otherwise.
fam Dummy variable with value 1 if promoter ownership in firm is
greater than 20 per cent, and 0 otherwise.
industry dummies
Industry dummies, one dummy for each of the 22 industry
groups, each taking value 1 for a particular industry, and 0
otherwise.
time dummies
Year dummies, one dummy for each of the years between
2005-2014, each taking value 1 for a particular year, and 0 otherwise
firm dummies
Firm dummies, one dummy for each of the 1348 firms, each
taking the value 1 for a particular firm, and 0 otherwise.
28
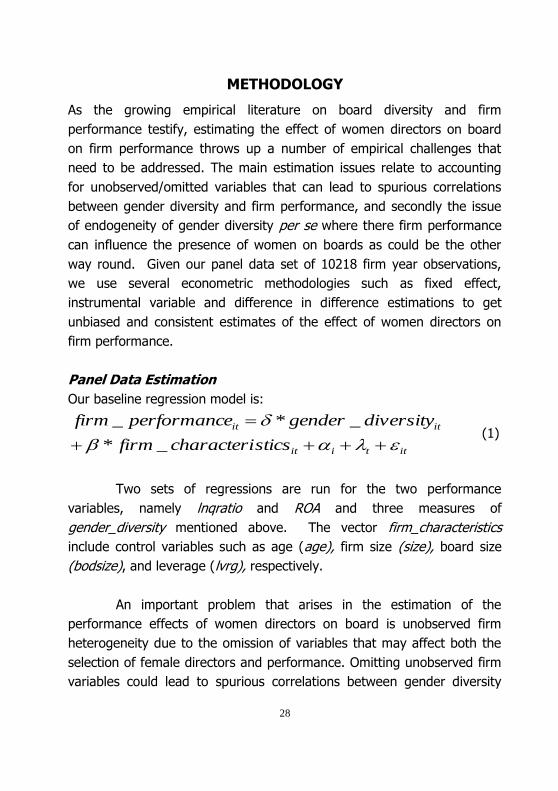
METHODOLOGY
As the growing empirical literature on board diversity and firm
performance testify, estimating the effect of women directors on board
on firm performance throws up a number of empirical challenges that
need to be addressed. The main estimation issues relate to accounting
for unobserved/omitted variables that can lead to spurious correlations
between gender diversity and firm performance, and secondly the issue
of endogeneity of gender diversity per se where there firm performance
can influence the presence of women on boards as could be the other
way round. Given our panel data set of 10218 firm year observations,
we use several econometric methodologies such as fixed effect,
instrumental variable and difference in difference estimations to get
unbiased and consistent estimates of the effect of women directors on
firm performance.
Panel Data Estimation
Our baseline regression model is:
ittiit
itit
sticscharacterifirm
diversitygendereperformancfirm
_*
_*_ (1)
Two sets of regressions are run for the two performance
variables, namely lnqratio and ROA and three measures of
gender_diversity mentioned above. The vector firm_characteristics
include control variables such as age (age), firm size (size), board size
(bodsize), and leverage (lvrg), respectively.
An important problem that arises in the estimation of the
performance effects of women directors on board is unobserved firm
heterogeneity due to the omission of variables that may affect both the
selection of female directors and performance. Omitting unobserved firm
variables could lead to spurious correlations between gender diversity
29
and performance and bias the estimated coefficients. For example, it is
plausible that firms with higher growth opportunities would have both
better performance as well as more female directors. A second example
would be the attitude of the CEO; a „progressive‟ CEO can choose cutting
age strategies for the firm which impacts firm performance positively,
and also hire more women directors. To address the problem of omitted
variable bias, we include firm fixed effects αi, in our main regression
model (1) along with year fixed effects, λt, to control for economy-wide
yearly fluctuations.
The second concern in studies investigative firm performance is
of reverse causality. Firms which are better performing can be more
attractive to women directors and better performing firms can also
pursue gender diversity as a goal (Adams and Ferreira, 2009; Liu et. al.,
2014) so that better quality women and hence the positive effect, and
not because women directors positively impact firm performance. If this
is the case, then the relationship between gender diversity and firm
performance can be spurious. We address this type of potential
endogeneity by using an alternative model specification with instrumental
variable (IV) and estimating our main regression (1) with the two-stage
least squares (2SLS) method. This is FE-IV method. We run the Hausman
test to test for endogeneity in gender diversity measures as well as for
the types of board positions held by women directors.
The problem of reverse causality in our opinion is specifically
relevant for women independent directors who are hired from the
managerial market. If on the other hand we consider women grey
directors on company boards, especially with respect to family firms, the
decision to appoint one would be more from the viewpoint of
consolidating family control and representing family interest on boards
(Anderson and Reeb, 2004). Grey directors in family firms are
hypothesized to impact performance in two conflicting ways, negatively
30
by siding with insider management to facilitate appropriation of private
benefits of control, or positively, by providing advice and counsel.
Whatever the case, it is unlikely that performance of a firm will attract
women grey directors; the decision to have grey directors, men or
women, could just be determined by control considerations irrespective
of how a firm is performing at any point of time. Further, unlike
independent directors, sorting between male and female grey directors
could be random depending on factors exogenous to the performance of
the firm, such as size of founding family, gender composition,
relationship with the promoter, succession norms, etc.
To take care of the problem of reverse causality with respect to
the presence of women directors on the whole or women independent
directors, we choose an instrument for the measures of gender diversity,
that has been used in the empirical literature. Following Adams and
Ferreira (2009), we define our instrument, male-female_board
connection, as the percentage of male directors on the board of the firm
under consideration who sit on other boards which have female directors.
The basis of choosing this instrument as elucidated by Adams and
Ferreira (2009) is that one of the reasons of low women representation
on company boards is the lack of social connections. One of the
mechanisms through which such social connections can be established is
through being present on boards where women directors are present.
The higher the fraction of men on a board are, sitting on boards of other
firms with women directors, the higher is the likelihood of the board
having a woman director. It is our contention that the instrument of
social connection that we adopt is particularly relevant for countries like
India with the dominance of firms affiliated to business groups and the
prevalence of interlocking directorates. For example, Sarkar and Sarkar
(2008) find in their study of multiple directorships in Indian firms that the
average busyness of independent directors are much higher compared to
the US. Further, an overwhelming majority of around 84 per cent of
31
directorial positions for inside directors in group affiliated companies
originate within group affiliates themselves with around 75 per cent of
these positions originating within a single groups, and the picture is no
different for independent directors with 67 per cent of their directorships
located within other group affiliates and 43 per cent concentrated within
a single group. Thus, there is an even higher likelihood in India that
social connections between men and women are likely to happen through
boards.
To estimate the effect of women director by type of director, for
reasons specified above, we run a fixed effects IV model to capture the
effect of women independent directors, and just a fixed effect model with
regard to women grey directors. One of the key estimations of interest
in our paper is the change, if any, in the effect of women directors , on
account of variation in the extent to which the founding family exerts
management control on a firm‟s board. To do so, we interact different
measures of gender diversity, with the three types of control dummies
(keeping no control, ctrl_1 as base) and estimate a fixed effects IV model
to take account of the effect of both omitted variables and reverse
causality.
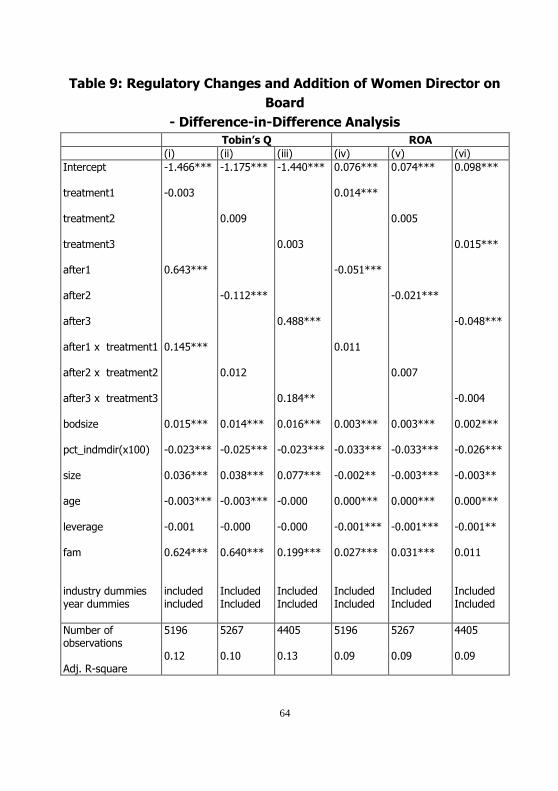
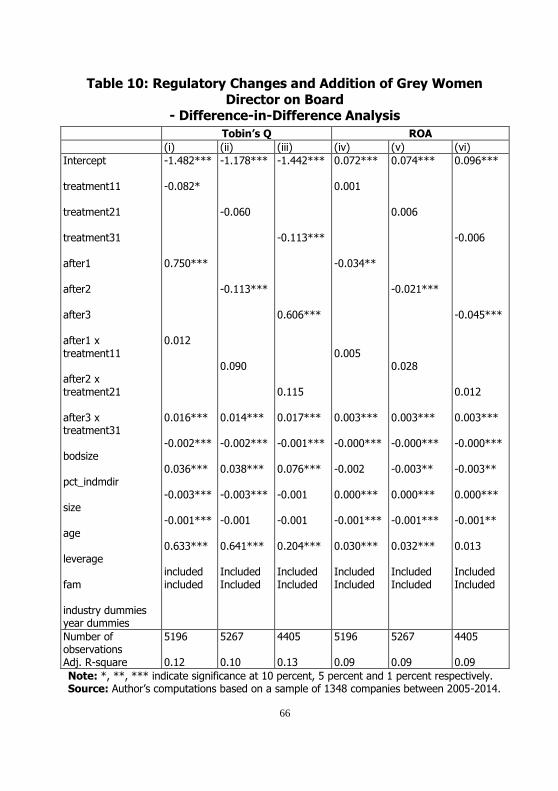
Difference-in-difference Analysis
The final set of estimations that we conduct to determine the effect of
women directors in family firms and ensure robustness of our results,
seeks to exploit the changes in the law in India with respect to the
inclusion of women on company boards. Specifically, the introduction of
gender quota in the Companies Act 2013, and prior to it in the
Companies Bill, 2011, can be considered as exogenous policy shocks,
using which we estimate the effect on performance of additions of
women directors on boards on account of the introduction of gender
quotas. Using a difference-in-difference (DID) approach, we examine
whether performance of firms improved or declined as a result of the
32
addition of one woman director, the minimum mandated by the law. In
the DID approach, the causal effect of an event, such as a regulatory
change, is estimated by analyzing the change in pre- and post-event
outcomes for a sample of firms that are affected by the event (the
treatment group) against the change in pre- and post-event outcomes for
a sample of firms that are unaffected the event (the comparison group).
Thus, it is necessary to define both a treatment group and a comparison
group as well as pre- and post-event time periods. The advantage of the
DID approach is that it controls for time-series variation in the outcome
variable that is common to all firms and separately identifies the effect of
the event.
From the point of view of DID estimation, the different phases in
the enactment and compliance of the gender quota in India throws up
three scenarios for estimating the effect of women directors - (i)
comparing the no appointments with the appointments post-2011 where
no distinction is made between policy intentions and policy enactment (ii)
comparing no appointments with appointments made in the transition
period up to the enactment of the Act to capture the effect of
appointments that were made pro-actively and perhaps strategically to
comply with expected quota to signal the market, and (iii) comparing the
effect of no appointments with post-2013 appointments to capture the
formal impact of the law.
We separately select our comparison group for each of the three
scenarios as the set of firms which did not appoint any woman director
during these time periods namely between 2012-2015, 2012-2013 and
2014-2015 respectively. This is important as these are the companies by
not appointing a woman director demonstrate the lack of willingness to
achieve gender diversity in their boards. This in turn provides us a clean
comparison sample. Similarly for each of the scenarios, the treatment
sample is also selected separately.
33
For DID we select a base set of firms which did not appoint any
women director voluntarily before 2011We begin with a sample of firms
which did not have any woman director on their board between 2001 and
2011 for the DID analysis. Our choice of 2011 is driven by the fact that it
is the first year when draft recommendation about at least one woman
director was introduced for the first time in the draft Companies Bill,
2011 and legally enacted two years later. This created the expectation
that firms would in all probability be required to appoint at least one
woman director on their boards. To estimate the before and after effect,
we construct the treatment group as a set of firms which had no women
director at any point of time, between 2001 and 2011, but appointed
only one woman director after 2011. Such an appointment clearly points
to gearing up for the quota regime. To treat the appointment of women
director following the quota as an event exogenous to firm performance,
we restrict the sample to only those companies who appointed one
woman director, and drop all other firms which appointed more than one
women director post 2011. The interaction term treatment*after captures
the effect of compliance of one woman director regulation of Companies
Act 2013.
To estimate the effect of treatment (changes in firm performance
on account of the addition of one woman on board), we estimate the
following equation:
ittjit
it
sticscharacterifirmaftertreatment
afterreatmentteperformancfirm
_***
**_ (2)
where firm_performance is the lnqratio or ROA, firm_characteristics is the
set of control variables, αj and λt are industry and time fixed effects and
εit is the error term. The variable treatment is specifically defined in terms
of three alternative dummy variables namely, treatment1, treatment2
and treatment3 respectively. The variable treatment1 takes the value
34
one if firm i has appointed one woman director between 2012 and 2015,
while the variable treatment2 takes the value one if firm i has appointed
one woman director between 2012 and 2013. These two variables
identify those firms that appointed one woman director on the board in
anticipation about the Act as well as the enactment of the Act itself.
In contrast, the variable treatment3 takes the value one if firm i
has appointed one woman director after 2013 i.e., in 2014 or 2015. This
variable identifies those firms which appointed a woman director after
the enactment of the Act. In similar spirit, the variable after is defined in
terms of three dummy variables namely, after1, after2, and after3.The
variable after1 takes the value one for years 2012 to 2015, the variable
after2 takes the value one for the years 2012 and 2013, while the
variable after3 takes the value one for the years 2014 and 2015.
Difference in difference is then captured by the generic
interaction terms treatment*after. For example treatment1*after1
captures the difference in difference in the performance of those firms
which appointed one woman director either in anticipation or passage of
the regulation in the years 2012 to 2015 vis-à-vis the control group, while
treatment3*after3 captures the difference in difference in the
performance of those firms which appointed one woman director only
after the passage of the regulation in the years 20-14 and 2015. The
difference-in-difference analysis is further extended to the type of woman
director by modifying treatment1, treatment2, and treatment3 as
treatment12/treatment13, treatment22/treatment23, and
treatment32/treatment33 respectively to define the treatment group as
firms that appointed grey/independent woman directors.
35
Empirical Analysis
Descriptive Statistics
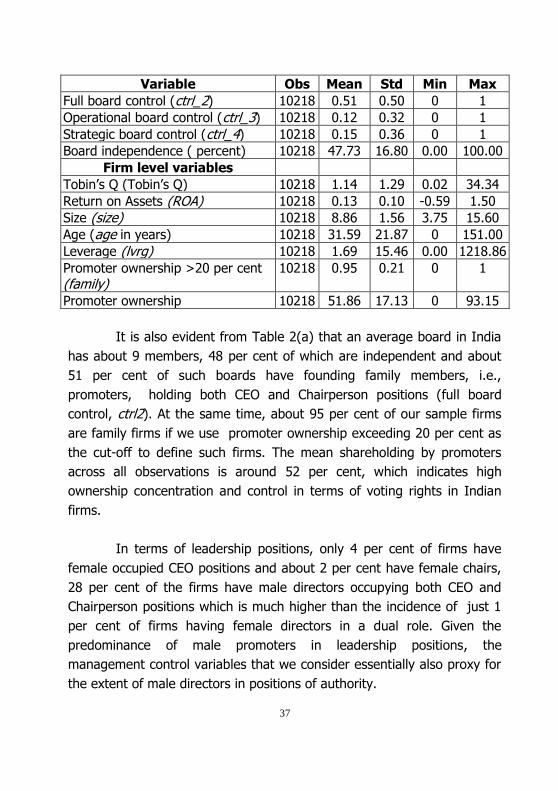
Table 2(a) describes the summary statistics of variables and describes
our sample for all firms in all years.
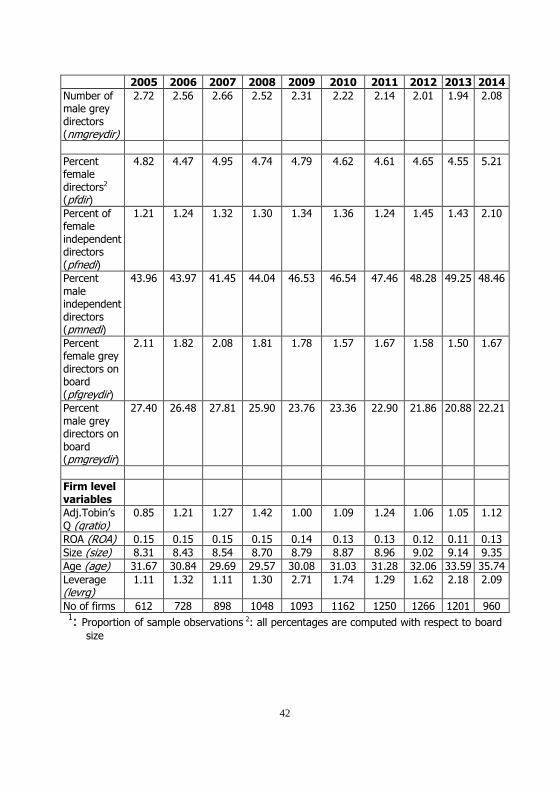
The mean percentage of female directors on sample board for all
years is 4.73 per cent, which is less than that reported by Sussmuth-
Dyckerhoff et. al. (2012) for the Asian region (6 per cent). More
specifically, this is significantly smaller than 10.2 per cent for China and
12 per cent for Vietnam as reported by Liu et al (2014) and Nguyen et.
al. (2015) respectively. These countries are different in their institutional
structures. Whereas in China, SOEs dominate and women directors are
nominated, Vietnam has very high women employment in general. On
average, 34 per cent of Indian boards have at least one women director.
However, most of these boards have one woman director as is evident
from the fact that 27 per cent of boards in our data have only one
woman director (onefdir). Also the table shows clearly that one woman
director is more of a norm in India given that only 7 per cent of firms
have two directors on their boards and only one per cent have more
than two women directors on their boards.
Comparing the incidence of female directors by type of
directorship, it is evident from the Table that female grey directors are
more common than female independent directors. While the percentage
of female grey directors is 1.73, that of female independent directors is
1.41 per cent. This is the case also with respect to the percentage of firm
year observations with independent and grey directors on boards, 14 per
cent and 16 per cent respectively. What is to be noted in the context of
family firms is that the presence of grey women directors is at least as
prevalent as the presence of independent women directors.
36
Table 2(a): Summary Statistics
Variable Obs Mean Std Min Max
Board Level Variables
Board size (bodsize) 10218 9.19 2.93 2.00 27.00
Has female director1 (dfdir) 10218 0.34 0.48 0 1
Has female executive director 10218 0.12 0.33 0 1
Has one female director1 (onefdir) 10218 0.27 0.44 0 1
Has two female director1 (twofdir) 10218 0.07 0.25 0 1
Has more than two female director1
(g2fdir) 10218 0.01 0.11 0 1
Has female chairperson1 10218 0.02 0.16 0 1
Has female ceo1 10218 0.04 0.19 0 1
Has female chairperson-ceo1 10218 0.01 0.07 0 1
Has male chairperson-ceo 10218 0.28 0.45 0 1
Number of female directors (nfdir) 10218 0.44 0.68 0 4
Note: Estimates in brackets is the number of firm year observations as a percentage of total firm year observations for our sample, 10218. ***, **, * indicate significance at 1 percent, 5 percent and 10 percent respectively.
Source: Author‟s computation based on a sample of 1348 companies between 2005-2014.
These observations also hold for proportion of board positions
held by women over the study period. For example, the proportion of
women directors on board increased by around 8 per cent from 4.82 per
cent in 2005 to 5.21 per cent in 2014. Over the years, board
independence has marginally increased from around 45 per cent to close
to 50 per cent. Of the total independent directors‟ positions, only in 2014,
2 per cent is held by women and rest 48 per cent is held by male
directors. Over the period 2005-2013 the proportion of grey directors
seems reducing in general. However, in 2014, the grey directors (both
male and female) have increased. This seems counteracting with the
increase in board independence in general.
The last panel of Table 3(a) shows the mean values of firm level
variables over the years. On an average stock market valuation has
increased marginally over the years whereas ROA remains same.
46
Leverage has significantly increased since 2013 compared to the
significant decrease in 2011.
Table 3(b) presents the descriptive statistics for selected board,
and firm characteristics across sub-samples of firm-years by family
control by ownership and family control through management. As can be
seen in the Table, while means tests show that board level variables do
not show statistically significant variation across firms distinguished by
family ownership control (family versus non-family), most of these
variables are significantly different across types of management control
as we have defined in our analysis. Specifically, compared to a no-control
scenario, if we consider the full control scenario, the proportion of firms
that have a female director and has female grey director are higher in the
latter than in the former. This is not the case with independent female
director whereby the proportion of firms with such director is significantly
lower under full control. This is along expected lines whereby firms with
full management control, if going for gender diverse board would prefer
a woman to be in the position of a grey director than as an independent
director whereas a firm under professional management is likely to give
less weight to such considerations. As can be noted from the Table, this
consideration holds true whenever a promoter is present as a key
management personnel, the difference with respect to no control being
the highest when promoter is a chairperson only in charge of strategic
decision making. Note also that the presence of female directors in key
positions in boards is higher in promoter controlled firms than with firms
with no control. Further, it is of interest to observe that while in the case
of independent directors, the percentage of male independent directors is
higher under all control types in comparison to the no control type, in the
case of female independent directors, this is just reversed, with female
independent directors being higher in firms with no promoter control in
management. In the case of grey directors too, the picture is different for
male and female directors across control types; while the percentage of
47
male grey directors is statistically lower in the presence of promoter
control, the percentage of female grey director is higher across all types
of promoter control as compared to no control. The above sets of
comparative estimates seem to suggest that there is indeed variation in
the extent and type of gender diversity across control types with
promoter control being associated with higher gender diversity. Further,
the estimates also seem to point out that in India as in many other
countries with family dominated firms, the family rather than the external
managerial market acts as a pool for women directors.
Finally, in Table 3(c), we compare the means of selected firm
and board characteristics across firm-years by the number of women
directors on board. Such a comparison is made in light of the policy of
gender quotas which require a minimum presence of women directors.
Keeping in the background, the Indian policy of listed firms mandated to
have at least one woman director irrespective of the type, we compare
the relevant estimates relative to a board with no woman director. The
estimates also are relevant in view of the debate on whether a critical
number of women directors is necessary for gender diversity to have a
positive effect on governance and performance without which gender
diversity would be nothing more than tokenism (Rhode and Packell,
2014; Liu et. al., 2014).
The comparison of estimates in Table 3(c) shows first that a
large majority of firm year observations (65.5 per cent) during the study
period pertains to the absence of a woman director, and a miniscule
percentage is associated with firms having more than two directors. The
percentage of firms voluntarily or by mandate appointing one director too
is also low, around 26 per cent, and lower than the estimate of 40 per
cent reported for US firms (Adams and Ferreira, 2009). Considering the
board size, firms with women directors have on the average larger
boards than firms with no woman director. In fact the board size is seen
48
to increase with increase in the number of women directors. Given the
average board size of 9 (Table 2(a)), having one woman director
amounts to around 11 per cent of women directors on board, which is
much less than the gender quotas set in most countries. Two directors,
which is also relatively rare in India would amount to a little over 20 per
cent which is much lower than typically the 33 to 50 per cent levels that
are fixed for countries that have instituted gender quotas.15
Turning to other firm level characteristics, estimates in Table 3(c)
along with means tests show that firms with women directors perform
better than firms without women directors, in terms of market value but
not with respect to profitability. Firms with women directors are also on
the average larger in size. An interesting point to note is that firms with
two women directors are older than firms with less than two, whereas
firms with more than two directors are younger by a much greater
margin than the rest of the firms.
Regression Results
Base Model
Table 4(a) and 4(b) present the results of standard fixed effects
regression (baseline model Equation (1) above) to investigate the effect
of gender diversity on firm performance for our sample of Indian listed
firms. We use two measures of performance: Tobin‟s q and ROA. Table
4(a) reports the results for Tobin‟s and Table 4(b) reports the results for
ROA respectively. All reported standard errors in all regressions are
adjusted for potential heteroskedasticity.
15 Norway and Denmark are two such countries
49
Table 4(a): Women Directors and Firm Performance - Regression
Results (Tobin’s Q) Two-way fixed effects
(industry and year fixed effects) Two-way fixed effects
(firm and year fixed effects)
(i) (ii) (iii) (iv) (v) (vi)
Intercept dfdir nfdir pfdir bodsize size age levrg industry dummies time dummies firm dummies
-0.7707**
0.0715***
0.01158***
0.0349*** -0.0020*** 0.0001
Included
Included No
-0.7421**
0.0390**
0.0115***
0.0356*** 0.00196*** 0.0001
Included
Included No
-0.7482**
0.00249** 0.0133***
0.0358*** -0.0020*** 0.0001
Included
Included No
-2.0763***
0.0379**
0.0189***
0.1285***
0.0001
No
Included Included
-1.016***
0.03642**
0.1828***
0.1281***
0.0001
No
Included Included
-2.0861***
0.0017 0.0200***
0.1287***
0.0001
No
Included Included
No. of Obs. No. cross-sections
No. of time series
10218 1348
10
10218 1348
10
10218 1348
10
10218 1348
10218 1348
10
10218 1348
10
Adj. R-square 0.07 0.07 0.07 0.63 0.63 0.63
Pr > F <0.0001 <0.0001 <0.0001 <0.0001 <0.0001 <0.0001
Note: *, **, *** indicate significance at 10 percent, 5 percent and 1 percent respectively. Source: Author‟s computations based on a sample of 1348 companies between 2005-2014.
Table 4(b): Women Directors and Firm Performance - Regression Results (ROA)
ROA Industry and Year Fixed Effects Firm and Year Fixed Effects
Intercept
dfdir
nfdir
pfdir
bodsize
size age levrg
industry dummies time dummies
firm dummies
0.1041**
0.0054*
0.0021***
-0.0004 0.0003*** -0.0003***
Included Included
No
-0.1065**
0.0025*
0.0021***
-0.0004 0.0002*** 0.0003***
Included Included
No
0.1054**
0.0002*
0.0023***
-0.0004 0.0002*** 0.0003***
Included Included
No
0.2241***
0.0086**
-0.0006
0.0122** -0.0001**
No Included
Included
0.2241***
0.0046**
-0.0006
0.0122** -0.0001**
No Included
Included
0.2221***
0.0005**
-0.0004
-0.0121**
-0.0002**
No Included
Included
No. of Obs.
No. cross-sections No. of time series
10218
1348 10
10218
1348 10
10218
1348 10
10218
1348
10218
1348 10
10218
1348 10
Adj. R-square 0.07 0.07 0.07 0.45 0.45 0.45
Pr > F <0.0001 <0.0001 <0.0086 <0.0001
Note: *, **, *** indicate significance at 10 percent, 5 percent and 1 percent respectively. Source: Author‟s computations based on a sample of 1348 companies between 2005-2014.
50
As defined earlier, we use three measures of women on board:
Presence of at least one woman director on board (dfdir), total number
of women directors on board (nfdir) and percentage of women on board
(pfdir), respectively. The first three columns in each of the tables indicate
our base model of firm performance that includes measure of women on
board along with the board and board specific control variables such as
board size, log(sales), age, and leverage. In addition these three
regressions contain year specific dummy variables and two-digit NIC
industry specific dummy variables to control for possible unobserved time
and industry related factors. As our earlier analysis shows, the proportion
of women on board varies significantly across industries. For example,
female directors are less prevalent in industries such as food and
beverages when compared to consumer goods and pharmaceuticals. The
next three columns of Tables 4(a) and 4(b) contain result of the
regressions where we replace the industry dummy variables with firm
specific dummy variables to control for observed firm level factors. The
results for base model for Tobin‟s q are reported in first three columns of
Table 4(a). The coefficient on presence of women on board is positive
and significant at the 5 per cent level. The coefficients on number and
percentage of women on board are also positive and significant at the 5
per cent level.
Firm Fixed Effects
To address the omitted variables bias discussed earlier, we add firm fixed
effects in the next three columns of Table 4(a) for each of the measures
of gender diversity. This is to check whether the positive relationship
estimated in the baseline regression with year and industry fixed effects
was driven by omitted variables bias. As is evident from the estimates
presented in columns (iv), (v) and (vi), compared to the baseline model,
the coefficients on the first two measures of gender diversity, namely
dfdir and nfdir are positive and statistically significant each with a p-value
of 0.05, whereas that with respect to gender diversity measured in
51
percentage terms, pfdir is not significant. Comparing coefficient values of
dfdir and nfdir, we also find that their marginal effects are lower for the
FE estimations. The change in the results, especially with respect to pfdir,
suggests, similar to other studies on gender diversity and firm
performance, that not accounting for unobserved firm heterogeneity can
be bias the results.
Table 4(b) reports the results of the base model and firm fixed
effects for ROA as performance measure. Here too, as in the case with
respect to market value in the baseline model, all the three measures of
gender diversity positively impact firm profitability and are statistically
significant with a p-value of 0.10 (cols (i)-(iii)). The results also hold
under firm FE estimation, and the marginal effects of all the three gender
diversity measures, unlike in the case of lnqratio appear to be higher as
compared to the baseline model. All the measures of gender diversity are
positive and statistically significant at the 5 per cent level.
As pointed out in almost all empirical studies on gender diversity,
and discussed above, reverse causality can also be a concern when the
causal effect of women board members on performance is analyzed. We
address this issue by using an instrument which should be correlated
with the presence, number and fraction of women directors on board but
uncorrelated with firm performance. By including the firm-fixed effects
along with IV estimation, we account for both unobservable firm
characteristics as well as reverse causality.
IV-Fixed Effects Estimation
As discussed above, the instrument that we choose for our analysis and
discussed in Section 3 is male-female_board connection. Table 5(a)
presents the test for endogeniety for the performance regressions. The
first three columns refer to qratio and last three columns refer to ROA.
We report Hausman test of endogeneity which essentially includes the
52
residuals from the auxiliary regression of the women participation
(presence, number and fraction) on the instrument - male-female_board
connection. The test statistic is significant at 5 per cent level for presence
(dfdir) and the number of women directors on board (nfdir) and not with
respect to the percentage of women directors (pfdir). This suggests that
the correlation between our measures of gender diversity and instrument
is significant for at least the first two measures.
Table 5(a): Firm Performance and Presence of Women on Board – Tests for Endogeneity
Tobin‟s Q ROA
(i) (ii) (iii) (iv) (v) (vi)
Intercept
male-
female_board connection
bodsize
size levrg
industry
dummies time dummies firm dummies
-0.3255***
0.00064***
0.0322***
0.0085
-0.00038**
No Yes
Yes
-0.6138***
0.000941**
0.0534***
0.0191
-0.00044**
No Yes
Yes
-1.5249
0.0070
0.1273***
0.0869
-0.0050*
No Yes
Yes
-0.3255***
0.00064***
0.0322***
0.0085
-0.00038**
No Yes
Yes
-0.6138***
0.000941**
0.0534***
0.0191
-0.00044**
No Yes
Yes
-1.5249
0.0070
0.1273***
0.0869
-0.0050*
No Yes
Yes
No. of Obs.
No. cross-
sections No. of time
series
10218
1348
10
10218
1348
10
10218
1348
10
10218
1348
10
10218
1348
10
10218
1348
10
Adj. R-square 0.74 0.77 0.78 0.74 0.77 0.78
Pr > Chisq (Hausman test)
0.0532 0.0409 0.1023 0.1731 0.1453 0.2102
Note: *, **, *** indicate significance at 10 percent, 5 percent and 1 percent respectively. Source: Author‟s computations based on a sample of 1348 companies between 2005-2014.
53
Table 5(b): Women Directors and Firm Performance -
Instrumental Variable Estimation with Fixed Effects (FE-IV)
Tobin‟s Q
(i) (ii) (iii)
Intercept
dfdir
nfdir
pfdir
bodsize
size
levrg
time dummies
firm dummies
-1.2990**
2.4268*
-0.0574
0.1058**
0.0011*
Included
Included
-1.0688*
1.6619*
-0.0679
0.0947**
0.0009*
Included
Included
-1.7484**
0.2233
-0.0077
0.1071**
0.0012
Included
Included
No. of Obs.
No. cross-sections
No. of time series
10218
1348
10
10218
1348
10
10218
1348
10
Note: *, **, *** indicate significance at 10 percent, 5 percent and 1 percent respectively. Source: Author‟s computations based on a sample of 1348 companies between 2005-2014.
The Hausman test results for endogeneity suggests that dfdir
and nfdir are endogenous when the firm performance is based on market
valuation, so that the use of IV regression to test for relationship
between women participation and firm performance would be
appropriate. This is not the case for pfdir at conventional levels of
significance. Further the Hausman test in Table 5(a) also indicates that
none of the three measures of women participation are endogenous in
case of ROA as performance measure. This suggests that firm fixed
54
effects can be used for regressions in the case of ROA so that the results
obtained in columns (iv-vi) in Table 4(b) can be considered as unbiased
and consistent estimates.
Table 5(b) shows the effect of gender diversity on performance
using Fixed Effects with IV estimated using 2SLS methodology. As is
evident from the estimates presented in the Table, consistent with our FE
results in Table 4(a), both dfdir and nfdir are positive and significant at
10 per cent level and pfdir has no statistically significant effect on market
value. Also, after controlling for both reverse causality and omitted
variables, we find that the economic significance of the coefficients of
both dfdir and nfdir are very strong as one standard deviation increase in
presence of women director (number of women directors) improves
market value by around 2.4 per cent and 1.7 per cent, respectively. With
respect to control variables board size has insignificant impact on firm
performance. Both size and leverage have a positive influence on firm
performance. This is consistent with the existing studies on India where
debt plays a significant role to limit agency problem along with the
concentrated ownership structure (Sarkar and Sarkar 2008).
The Effect of Family Control
An important subject of inquiry in this paper is whether the effect of
women directors on board is sensitive to the nature of founding family
control in the functioning of the board. As discussed earlier, we seek to
capture this in two ways, first through interacting each of the gender
diversity variable with the family dummy fam defined in terms of
ownership control, and second through interacting each of the gender
diversity variables with the management control dummies, ctrl_2, ctrl_3
and ctrl_4 with ctrl_1, the no-control scenario taken as the base.
Table 6 (a) introduces the interaction effect of gender diversity
with respect to our definition of family firm, fam and estimate the effect
55
using the FE-IV model specification. As can be seen from the estimates,
the coefficients of all three gender diversity variables, dfdir, nfdir and
pfdir are positive and significant with respect to market value.
Table 6(a): Women Directors and Firm Performance – Effect of
Family Ownership Tobin‟s Q IV model ROA FE Model
Intercept dfdir nfdir pfdir fam dfdir xfam nfdir x fam pfdir x fam bodsize size levrg time dummies firm dummies
-4.3321** 9.6042* 2.7505* -9.2321* -0.0017 0.0963** 0.0002 Included Included
-3.8195*** 6.8085** 2.2428** -6.5645** -0.0095 0.1014** 0.0002 Included Included
-4.1027*** 0.5415** 2.2966** -0.5134** 0.0148** 0.1046** 0.0002 Included Included
0.0162 0.7850 0.2443 -0.7511 -0.0022 -0.0145** -0.0001** Included Included
0.0547 0.5634 0.2058 -0.5430 -0.0028 -0.0141** -0.0005** Included Included
0.0331 0.0445 0.2085 -0.0420 -0.0008 -0.0138** -0.0001** Included Included
No. of Obs. No. cross-sections No. of time series
10218 1348 10
10218 1348 10
10218 1348 10
10218 1348
10218 1348 10
10218 1348 10
Note: *, **, *** indicate significance at 10 percent, 5 percent and 1 percent respectively. Source: Author‟s computations based on a sample of 1348 companies between 2005-2014.
56
Table 6(b): Women Directors and Firm Performance – Effect of
Founding Family (Promoter) Influence on Boards Tobin‟s Q IV model ROA FE Model
Intercept dfdir nfdir pfdir ctrl_2 ctrl_3 ctrl_4 dfdir x ctrl_2 dfdir x ctrl_3 dfdir x ctrl_4 nfdir x ctrl_2 nfdir x ctrl_3 nfdir x ctrl_4 pfdir x ctrl_2 pfdir x ctrl_3 pfdir x ctrl_4 bodsize size levrg time dummies firm dummies
-2.3982*** 3.6534* 1.0413** 0.8904** 0.8529* -3.2114* -2.9447* -2.8633* -0.0328 0.1120** 0.0008* Included Included
-2.1730*** 2.7607* 0.9774* 0.8389* 0.7585* -2.3355* -2.1493* -2.0416* -0.0445 0.1085** 0.0008* Included Included
-2.6109*** 0.3129 1.1243 0.9930 0.9170 -0.2699 -0.2483 -0.2549 0.0002 0.0987** 0.0008* Included Included
0.2188*** 0.0076 0.0058 -0.0006 0.0041 0.0027 0.0032 -0.0043 0.0076 -0.0006** -0.0001** Included Included
0.2207*** 0.0032 0.0056 -0.0003 0.0026 0.0027 0.0019 0.0004 -0.0006 -0.0121** -0.0001** Included Included
0.2188** 0.0003 0.0049 0.0008 0.0024 0.0004 -0.0001 0.0001 -0.0004 -0.0121** -0.0001** Included Included
No. of Obs. No. cross-sections No. of time series
10218
1348
10
10218
1348
10
10218
1348
10
10218
1348
10218
1348
10
10218
1348
10
57
Further, the coefficient of fam is positive and statistically
significant with respect to qratio but not with ROA suggesting that family
firms in India are valued higher than non-family firms. With regard to
the coefficients of particular interest, those with respect to the interaction
terms of fam each with dfdir, nfdir and pfdir, we find that in the market
value regression, these are negative and significant at 10 per cent, 5 per
cent and 5 per cent, respectively. While the positive sign on fam is in line
with the existing literature that higher ownership concentration in family
firms helps align the interests of inside shareholders-managers to outside
shareholders and positively impact market value, family ownership has a
negative impact on the effect of women directors on firm value. In other
words, family ownership impinges on the effectiveness of women
directors present on boards, with presence measured in how so ever
way. If we consider the total effect on family value in the presence of
women directors (adding the coefficient value of each gender diversity
variable with its corresponding interaction term), we find that the
negative effects of family firms on account of private benefits of control
almost washes away the positive benefits of family ownership. Consider
for instance, the coefficient value of dfdir of 9.60 suggests that the
market value of a board which has at least one woman director would be
around 9 per cent higher than a board with no woman director. However,
for family firms, owing to the coefficient value of -9.23 associated with
the interaction term dfdir x fam, the net effect of a board with woman
director relative to a board without such a director drastically decreases
to less than one per cent. The result shows that women have little
comparative advantage over men as directors in family firms. Generally
speaking, the estimates with respect to market value presented in Table
6(a), when connected with our discussion in Section 1 and Section 2
implies that the market perceives women, owing to their observable and
unobservable characteristics, to be less effective as directors when Type
II agency costs are present in a firm. This, in turn could be due to the
presence of women as grey directors connected with the founding family
58
who could facilitate rather than prevent the expropriation of minority
investors.
In contrast to our results with respect to Tobin‟s Q, once we
control for family control in the profitability regressions, the positive
effect of the gender diversity measures that was present in the fixed
effects regression in Table 4(b) disappear. When ROA is considered as a
firm performance measure, the coefficients of all the measures of gender
diversity as well as the coefficient of fam are insignificant.
Promoter Influence on Board
Table 6(b) takes into account the fact that along with the ownership
concentration, family can exert management control through holding key
positions on the board, namely as a CEO, or chairperson or both. As
discussed earlier, to examine whether promoter influence matters in the
effect of gender diversity, we use three control dummies ctrl_2, ctrl_3
and ctrl_4 to capture three types of promoter influence relative to no
influence. These are full control when promoter is both CEO and
chairperson (ctrl_2), operational control (ctrl_3) when promoter is only
the CEO and strategic control (ctrl_4), when promoter is only the
chairperson. As is defined, the extent of promoter control declines
relative to no control (ctrl_1), when one moves from ctrl_2 to ctrl_4. If
women directors are more deferential to authority, and in this case family
authority, or are sympathetic to family concerns and objectives, one
would expect that the effect of women directors will decline with increase
in authority.
The effect of gender diversity continues to remain insignificant
with respect to the accounting performance as showed in the last three
columns. The coefficients of ctrl_2-ctrl_4 are positive and significant
suggesting that when promoters are in key positions on the board, this is
beneficial for firm valuation. This is consistent with the Type II agency
59
perspective that controlling insiders have incentives to maximize firm
value. With regard to the gender diversity measures, as with the earlier
findings, board with at least one woman director fares better than a
board with no woman director. The coefficient of dfdir is significant at 10
per cent. Similarly, the coefficient of nfdir positive and significant, implies
that the number of women directors has a positive effect on
performance. Turning to the interaction terms, consistent with the effect
of family, promoter influence negatively impacts the performance effect
of women directors. This holds for both dfdir and nfdir, irrespective of the
nature of control. However, what is of interest to note is that the positive
effect of boards with women directors is neutralized the most when the
promoter has full control of the board, and neutralized the least when the
control is strategic. When one considers the total effect of women
directors after factoring in the nature of promoter control, the coefficient
values suggest that the net effect is still positive, but much lower than
the direct effect when control is not accounted for.
The effects of promoter control are not found to be significant if
we measure gender diversity in percentage terms, nor is it significant
with respect to profitability. These results are consistent with the results
we obtain when we control for family ownership in Table 6(a).
Type of Women Directors
Next, we investigate the effect of type of board positions held by women
directors by introducing presence, number and proportion of
grey(independent) women directors. Grey directors are the women
directors who are non-executive but not reported as independent. Table
7(a) reports the test for endogeneity for the independent women
directors. It can be argued that appointment of independent women
director depends on firm‟s existing board structure, performance or
industry. The results of Hausman test confirm the endogeneity and
validity of the instrument variable that is male-female connections with
60
respect to presence and number of women directors. Similar to gender
diversity in general, FE regressions on ROA is justified here as well.
Table 7(a): Test for Endogeneity of Presence of Women on Board
– Independent Directors
Tobin‟s Q ROA
Intercept male-female_board connection bodsize size levrg time dummies firm dummies
-0.2348** 0.0006*** 0.0171*** 0.0113 -0.0003** Included Included
-0.2905*** 0.0008** 0.0222*** 0.0091 -0.00014 Included Included
-0.9634 0.0047 0.0714*** 0.0717 -0.0042* Included Included
-0.2348** 0.0006*** 0.0171*** 0.0113 -0.0003** Included Included
-0.2905*** 0.0008** 0.0222*** 0.0091 -0.00014 Included Included
-0.9634 0.0047 0.0714*** 0.0717 -0.0042* Included Included
No. of Obs. No. cross-sections No. of time series
10218
1348
10
10218
1348
10
10218
1348
10
10218
1348
10
10218
1348
10
10218
1348
10
Adj. R-square 0.61 0.66 0.66 0.61 0.66 0.66
Pr > F (Hausman test)
0.0355 0.0827 0.1198 0.1583 0.1949 0.2254
Note: *, **, *** indicate significance at 10 percent, 5 percent and 1 percent respectively. Source: Author‟s computations based on a sample of 1348 companies between 2005-2014.
61
Table 7(b): Women Directors and Firm Performance –
Independent Directors
Instrumental Variable Estimation with Fixed Effects (FE-IV)
Note: *, **, *** indicate significance at 10 percent, 5 percent and 1 percent respectively.
Source: Author‟s computations based on a sample of 1348 companies between 2005-2014.
In unreported results we also confirm that the female grey
directors are not endogeneous which, as discussed above, is expected ,
as the appointment of grey directors is more likely to depend on founding
family composition and internal dynamics rather than on on firm or
industry specific factors.
Table 7(b) reports the results of FE-IV and FE regressions of
independent women directors. The coefficients for independent women
directors is positive and significant for both Tobin‟s q and ROA when
IV regression for Tobin‟s Q Fixed effects model for ROA
diversity is measured either as a dummy or in numbers, but not in
percentage terms. This suggests that market in general value firms
higher with presence of independent women directors than with boards
that do not have any, as well as with the number of independent women
directors. As in the earlier regressions, we do not find any effect of
independent women directors with respect to profitability.
Table 8 reports the results with respect to grey women directors.
The coefficients for all measures of grey women directors are
insignificant irrespective of the performance measure. Thus, grey
women directors have no effect on firm performance. One of the key
reasons for this, as discussed in the literature on grey directors is that
typically family ties impinge on the ability of such directors to monitor the
firm objectively and effectively.
Table 8: Women Directors and Firm Performance – Grey Directors Fixed Effects (FE) Estimation
Note: *, **, *** indicate significance at 10 percent, 5 percent and 1 percent respectively. Source: Author‟s computations based on a sample of 1348 companies between 2005-2014.
-2.09160*** -0.018230 0.0205*** 0.1288*** 0.0001 Included Included
-2.0911*** -0.01320 0.0205*** 0.1288*** 0.0001 Included Included
-2.0894*** -0.0021 0.0203*** 0.1288*** 0.0001 Included Included
0.2211*** 0.0012 -0.0003 -0.0121** -0.0002** Included Included
0.2211*** 0.0010 -0.0003 -0.0121** -0.0002** Included Included
0.2213*** 0.0001 -0.0003 -0.0121** -0.0002** Included Included
No. of Obs. No. cross-sections No. of time series
10218 1348 10
10218 1348 10
10218 1348 10
10218 1348 10
10218 1348 10
10218 1348 10
63
Difference-in-Difference Analysis
Table 9, 10 and 11 report the results for difference-in-difference analysis
to investigate the announcement of inclusion of one woman director
clause and the effect of Companies Act 2013. Table 9 reports the results
for the firms that appointed one woman director either by responding to
the announcement in 2011 or to the Companies Act 2013 mandate. First
three columns present the results for the market valuation using Tobin‟s
q as proxy for firm performance and last three columns present the DID
results for ROA as a measure of firm performance. The underlying
hypothesis is that the diversity enforced by the law-change itself would
increase firm value (Higgs, 2003; Page, 2007).The coefficient of the
interaction term of gender diversity (dfdir, nfdir and pfdir) and after is of
interest which captures the effect of mandatory addition of one women
member on boards of firms which had no women director between 2005
and 2011. The results are reported after controlling for industry fixed
effects and heteroscedasticity. The coefficients for treatment1*after1 and
treatment3*after3 are each positive and significant for the Tobin‟s q as
performance measure. This suggests that after the passage of new
Companies Act 2013, the market values of firms that have complied are
significantly higher.
64
Table 9: Regulatory Changes and Addition of Women Director on
Board
- Difference-in-Difference Analysis
Tobin’s Q ROA
(i) (ii) (iii) (iv) (v) (vi)
Intercept treatment1 treatment2 treatment3 after1 after2 after3 after1 x treatment1 after2 x treatment2 after3 x treatment3 bodsize pct_indmdir(x100) size age leverage fam industry dummies year dummies
-1.466*** -0.003 0.643*** 0.145*** 0.015*** -0.023*** 0.036*** -0.003*** -0.001 0.624*** included included
-1.175*** 0.009 -0.112*** 0.012 0.014*** -0.025*** 0.038*** -0.003*** -0.000 0.640*** Included Included
-1.440*** 0.003 0.488*** 0.184** 0.016*** -0.023*** 0.077*** -0.000 -0.000 0.199*** Included Included
0.076*** 0.014*** -0.051*** 0.011 0.003*** -0.033*** -0.002** 0.000*** -0.001*** 0.027*** Included Included
0.074*** 0.005 -0.021*** 0.007 0.003*** -0.033*** -0.003*** 0.000*** -0.001*** 0.031*** Included Included
0.098*** 0.015*** -0.048*** -0.004 0.002*** -0.026*** -0.003** 0.000*** -0.001** 0.011 Included Included
Number of observations Adj. R-square
5196 0.12
5267 0.10
4405 0.13
5196 0.09
5267 0.09
4405 0.09
65
The effect of announcement of draft bill in 2011 and the
mandate of Companies act 2013 is analyzed through difference-in-
difference methodology. treatment1, treatment2 and treatment3 are
dummy variables that equal one for firms who have appointed one
women director between 2012-2015, 2012-2013 and 2014-2015
respectively. Accordingly the time effects after1, after2 and after3 are
assigned that equals one for 2012 and after, 2012 and2013, 2014 and
2015 respectively to capture the effect of post announcement of 2011,
post 2011 but before 2013 mandate, and after 2013 mandate. The
interaction terms after*treatment are assigned respectively between each
type of after and treatment.
Regulatory Changes and Addition of Grey Women Director on
Board
- Difference-in-Difference Analysis
The effect of announcement of draft bill in 2011 and the mandate of
Companies act 2013 is analyzed through difference-in-difference
methodology. treatment1, treatment2 and treatment3 are dummy
variables that equal one for firms who have appointed one grey women
director between 2012-2015, 2012-2013 and 2014-2015 respectively.
Accordingly the time effects after1, after2 and after3 are assigned that
equals one for 2012 and after, 2012 and2013, 2014 and 2015
respectively to capture the effect of post announcement of 2011, post
2011 but before 2013 mandate, and after 2013 mandate. The interaction
terms after*treatment are assigned respectively between each type of
after and treatment.
66
Table 10: Regulatory Changes and Addition of Grey Women
Director on Board - Difference-in-Difference Analysis
Tobin’s Q ROA
(i) (ii) (iii) (iv) (v) (vi)
Intercept treatment11 treatment21 treatment31 after1 after2 after3 after1 x treatment11 after2 x treatment21 after3 x treatment31 bodsize pct_indmdir size age leverage fam industry dummies year dummies
-1.482*** -0.082* 0.750*** 0.012 0.016*** -0.002*** 0.036*** -0.003*** -0.001*** 0.633*** included included
-1.178*** -0.060 -0.113*** 0.090 0.014*** -0.002*** 0.038*** -0.003*** -0.001 0.641*** Included Included
-1.442*** -0.113*** 0.606*** 0.115 0.017*** -0.001*** 0.076*** -0.001 -0.001 0.204*** Included Included
0.072*** 0.001 -0.034** 0.005 0.003*** -0.000*** -0.002 0.000*** -0.001*** 0.030*** Included Included
0.074*** 0.006 -0.021*** 0.028 0.003*** -0.000*** -0.003** 0.000*** -0.001*** 0.032*** Included Included
0.096*** -0.006 -0.045*** 0.012 0.003*** -0.000*** -0.003** 0.000*** -0.001** 0.013 Included Included
Number of observations Adj. R-square
5196 0.12
5267 0.10
4405 0.13
5196 0.09
5267 0.09
4405 0.09
Note: *, **, *** indicate significance at 10 percent, 5 percent and 1 percent respectively. Source: Author‟s computations based on a sample of 1348 companies between 2005-2014.
67
Regulatory Changes and Addition of Independent Women
Director on Board
- Difference-in-Difference Analysis
The effect of announcement of draft bill in 2011 and the mandate of
Companies act 2013 is analyzed through difference-in-difference
methodology. treatment1, treatment2 and treatment3 are dummy
variables that equal one for firms who have appointed one independent
women director between 2012-2015, 2012-2013 and 2014-2015
respectively. Accordingly the time effects after1, after2 and after3 are
assigned that equals one for 2012 and after, 2012 and2013, 2014 and
2015 respectively to capture the effect of post announcement of 2011,
post 2011 but before 2013 mandate, and after 2013 mandate. The
interaction terms after*treatment are assigned respectively between each
type of after and treatment.
68
Table 11: Regulatory Changes and Addition of Independent
Women Director on Board - Difference-in-Difference Analysis
Tobin’s Q ROA
(i) (ii) (iii) (iv) (v) (vi)
Intercept treatment12 treatment22 treatment32 after1 after2 after3 after1 x treatment12 after2 x treatment22 after3 x treatment32 bodsize pct_indmdir size age leverage fam industry dummies year dummies
-1.452*** 0.069** 0.664*** 0.156** 0.014*** -0.002*** 0.035*** -0.003*** -0.000 0.616*** included included
-1.172*** 0.024 -0.113*** 0.066 0.014*** -0.002*** 0.038*** -0.003*** -0.001 0.639*** Included Included
-1.431*** 0.061** 0.542*** 0.148 0.015*** -0.002*** 0.076*** -0.000 -0.000 0.192*** Included Included
0.075*** 0.012*** -0.044*** 0.009 0.003*** -0.000*** -0.002 0.000*** -0.001*** 0.028*** Included Included
0.074*** 0.003 -0.021*** -0.004 0.003*** -0.000*** -0.003** 0.000*** -0.001*** 0.032*** Included Included
0.098*** 0.020*** -0.042*** -0.015 0.002*** -0.000*** -0.003** 0.000*** -0.001*** 0.011 Included Included
Number of observations Adj. R-square
5196 0.13
5267 0.10
4405 0.13
5196 0.09
5267 0.09
4405 0.09
Note: *, **, *** indicate significance at 10 percent, 5 percent and 1 percent respectively. Source: Author‟s computations based on a sample of 1348 companies between 2005-2014.
69
However, insignificant coefficient of treatment2*after2 suggests
no effect of the 2013 announcement on firms that responded to the
2011 announcement when gender quotas were finally enacted and
significant coefficient of treatment3 suggests the positive effect of
compliance of the Companies Act 2013. On average the market valuation
is higher for companies that appointed one woman director by
responding to the new Companies Act. This is in contrast with the effect
of quota that is being observed in Norway and suggests that the diversity
enforced by the law increases the firm‟s market value in India.
With regard to ROA too, as evident from the coefficients of
treatment*after variables, accounting performance is higher for firms
that appointed one woman director compared to the firms that did not
appoint any woman director when firms have appointed a woman
director between 2012-2015 and 2014-2015, and not in the interim
period, 2012-2013, between the drafting and the enactment of the
gender quota provision. One possible explanation for this could be that
once the provision was drafted, the first movers added women to their
boards predominantly as grey directors whereas those who were
appointed in the 2014-15 period were women independent directors.
Support for this conclusion comes from the underlying data that shows
that most of the post 2013 appointments were of independent directors
but this was not the case before 2013. When coefficients are compared,
the market valuation is higher for firms which complied to the Companies
Act mandate in 2013. These findings are consistent with our panel data
results in general that gender diversity is positively related to firm
performance in family firms.
Table 10 presents the DID results that investigate the effect of
announcement of the expected law mandate and the law itself and
appointment of “grey” director. This is essentially to test if the firms are
resorting to simple tokenism to comply. As hypothesized earlier, if
70
tokenism is the consideration, the forced change in board characteristics
will have no effect on firm value (Westphal, 1998; Helland and Sykuta,
2004; Farrell and Hersch, 2005). Insignificant coefficients of treatment1
and treatment3 suggest no effect of such tokenism.
Next, we investigate the effect of law when the firms responded
by appointing an independent woman director. Table 11 presents the
results. Positive and significant coefficient of treatment12 suggests the
positive effect of announcement of draft bill in 2011. Companies which
responded to the expectation about the gender diversity by appointment
of only one independent director experienced increase in firm value
compared to their counterpart (control group) which did not respond to
the expectation of the draft bill or to the Act itself. Another interesting
result is that the effect of actual mandate is not significant for the
companies that responded to the Act and not to the earlier
announcement. Such companies were valued higher on average
compared to their counterpart which did not appoint any woman director
or appointed grey woman director. With respect to the accounting
performance, the companies act or the announcement of the draft bill
does not have significant effect. However, the accounting performance of
firms that appointed independent woman directors is higher on average
but did not increase due to the mandate.
The results with respect to addition of independent women
directors under the DID estimation, together with the IV estimations
earlier suggests that independent women directors in family firms, even if
one in number on the board, are not perceived as tokens by the market.
Instead, the results suggest that women independent directors,
irrespective of their numbers on the board, contribute positively to firm
performance.
71
CONCLUDING COMMENTS
This paper seeks to contribute to the literature on gender diversity on
boards by analysing the relationship between women directors and firm
performance with respect to family firms. While there is a growing
empirical literature on the subject of women on corporate boards, much
of it is limited to widely held firms with separation of ownership and
control, and little is known about the effectiveness of women on the
boards of family firms with concentrated ownership and control.
Juxtaposing the literature on gender attributes to that of characteristics
of family firms and governance, this paper argues that women directors,
vis-à-vis men directors, may have comparative advantage in monitoring
and advising the management of family firms in some respects and
disadvantage in others, but in ways that could be different from their
roles in widely held firms. Considering the dominant attributes of women
in general, and women directors in particular, this paper argues that
attributes such as universalism and benevolence, along with issues
related to ascension of women beyond the glass ceiling can have
conflicting effects on firm performance, especially under the institutional
settings which give rise to concentrated ownership structures and
dominance of controlling owners on board. In such a scenario, the effect
of having women on board becomes an empirical question.
By applying panel data estimation methods and difference-in-
difference analysis, this paper finds robust evidence of a positive effect of
women directors on firm value. Further, when we disentangle the effect
of women directors by type of director, we find that women independent
directors have a positive effect whereas woman grey directors have no
effect. This positive effect of independent woman directors is also
confirmed by the diff-in-diff analysis where the higher valuation of firms
post the enactment of the gender quota in India in 2013 came from the
appointment of a woman independent director, and not a grey director.
The positive results with respect to women directors in general and
72
independent directors in particular that we obtain with respect to market
value are also confirmed with respect to profitability, where the
coefficients of all gender diversity measures are statistically significant.
Grey directors again have no effect on profitability.
One of the important contributions of this paper, in our opinion,
is how the effectiveness of women directors changes with changes in
firm governance structures. While this issue has received some attention
in the literature there is little formal evidence on it. Given that family
firms in India vary in the extent to which family members are present in
key management positions, we exploit this variation to test if the
effectiveness of women directors varies with the extent of promoter‟s
control. We find robust evidence that this is indeed true and the effect of
women director on firm performance depends significantly on the extent
of operational and strategic control exerted by the promoter.
Notwithstanding the negative effects under family control, the net effect
of women directors on board on market valuation remains to be positive.
This is however, not the case with regard to profitability. Our results
suggest that women attributes while beneficial for governance as such, is
discounted by the market in settings where decision making is controlled
by family.
Finally, the findings in our paper provide support to instituting
gender quotas in emerging economies like India with dominance of
family firms. Given the mandate of appointing at least one woman
director on board, our study finds that firms which have at least one
woman director on the board has higher market valuation and higher
profits compared to boards with none. What is interesting is that this
result is driven by independent woman directors and not by grey
directors with the latter being a reflection of mere tokenism. The strong
and consistent effect of woman independent directors in our study, in our
opinion, is perhaps a combination of the comparative advantages of
73
women as outside directors in family firms and the stronger forces of
selection that takes place in developing countries like India whereby
women have to overcome more obstacles and bear higher costs when
they make their choices for a high-profile career path. Taken together,
our results suggest that the institutional context in which women
directors function may have important bearing on how gender diversity
matters on corporate boards.
74
REFERENCES
Adams, R. B., Amir N. Licht and Lilach Sagiv (2009), Shareholderism:
Board Members‟ Values and the Shareholder-Stakeholder Dilemma, Working Paper. Available at:
Adams, R. B and D. Ferreira (2009), “Women in the Boardroom and Their Impact on Governance and Performance”, Journal of Financial Economics, 94(2): 291–309.
Adams, R. B. and P. Funk (2012), “Beyond the Glass Ceiling: Does
Ahern, K. R. and A. Dittmar (2012), “The Changing of the Boards: The
Impact on Firm Valuation of Mandated Board Representation”, The Quarterly Journal of Economics, 127(1), 137-197.
Anderson, Ronald, C. and David M. Reeb (2003), “Founding Family
Ownership and Firm Performance: Evidence from S and P 500,
Journal of Finance, 58, 1301-1328.
Anderson, Ronald C. and David M. Reeb (2004), “Board Composition: Balancing Family Influence in S and P 500 Firms”, Administrative Science Quarterly, 49, 209-237.
Bertrand, Marianne (2011), “New Perspectives on Gender,” in O.
Ashenfelter and D. Card (ed.) Handbook of Labor Economics, Elsevier, Edition 1, 4 (5).
Catalyst (2013), “Women on Boards”, May 31, Retrieved December
Firm Performance in China”, Journal of Corporate Finance, 28, 169-184.
Luo Xiaowei Rose and Chi-Nien Chung (2012), “Filling or Abusing the
Institutional Void? Ownership and Management Control of Public
Family Businesses in an Emerging Market”, Faculty and Research Working Paper, 2012/20/EFE, INSEAD.
Matsa, D. A. and A. R. Miller (2010), “A Female Style in Corporate
Leadership? Evidence from Quotas,” Working Paper,
Northwestern University, Evanston IL.
Maury, Benjamin (2006), “Family Ownership and Firm Performance: Empirical Evidence from Western European Corporations”,
Journal of Corporate Finance, 12 (2), 321-341.
77
McKinsey (2012), Women Matter: An Asian Perspective 2012, McKinsey
and Company. http://www.boardagender.org/wp-content/uploads/2010/12/2012-McKInsey-Women-Matter-An-
Asian-Perspective.pdf accessed on November 23, 2013.
Miller, Toyah and Maria del Carmen Triana (2009), “Demographic
Diversity in the Boardroom: Mediators of the Board Diversity-Firm Performance Relationship,” Journal of Management Studies, 46:5, 0022-2380.
Ministry of Corporate Affairs (2013), “The Companies Act, 2013,” August
29, Retrieved December 2013: http://www.mca.gov.in/Ministry/pdf/CompaniesAct2013.pdf
Nguyen, Hoa and Robert Faff (2007), “Impact of Board Size and Board
Diversity on Firm Value: Australian Evidence,” Corporate Ownership and Control, 4(2), 24-32.
Nguyen, Tuan, Stuart Locke and Krishna Reddy (2015), “Does Boardroon Gender Diversity Matter? Evidence from a Transitional Economy”,
International Review of Economics and Finance, 37, 184-202.
Nielsen ,Sabina and Morten Huse (2011), “The Contribution of Women on
Boards of Directors: Going beyond the Surface”, Corporate Governance: An International Review, 18 (2), 136–148, March
2010. Pieper, Torsten (2010), “Non Solus: Toward a Psychology of Family
Business”, Journal of Family Business Strategy, 1, 26-39.
Rhode, Deborah L. and Amanda K. Packel (2014), “Diversity on Corporate Boards: How Much Difference Does Difference Make?”, Delaware Journal of Corporate Law, 39, 378-426.
Sarkar, J. and S. Sarkar (2000), “Large Shareholder Activism in Corporate
Governance in Developing Countries: Evidence from India”, International Review of Finance, 1(3): 161-194.
Sarkar, J. and S. Sarkar (2009), Multiple Board Appointments and Firm
Performance in Emerging Economies: Evidence from India, Pacific Basin Finance Journal, 17, 271-293.
Schwartz, S. H. (1992) “Universals in the Context and Structure of Values: Theoretical Advances and Empirical Tests in 20
Countries”, in M. P. Zana (ed.), Advances in Experimental Social Psychology, Academic Press, New York, 1-65.
Zahra, S.A., Hayton, J.C. and C. Salvato (2004), “Entrepreneurship in
Family vs. Non-family Firms: A Resourcebased Analysis of the
Effect of Organizational Culture”, Entrepreneurship Theory and Practice, 28(4), 363–381.
MSE Monographs
* Monograph 22/2012A Macro-Fiscal Modeling Framework for forecasting and Policy SimulationsD.K. Srivastava, K. R. Shanmugam and C.Bhujanga Rao
* Monograph 23/2012Green Economy – Indian PerspectiveK.S. Kavikumar, Ramprasad Sengupta, Maria Saleth, K.R.Ashok and R.Balasubramanian
* Monograph 24/2013Estimation and Forecast of Wood Demand and Supply in TamilanduK.S. Kavi Kumar, Brinda Viswanathan and Zareena Begum I
* Monograph 25/2013Enumeration of Crafts Persons in IndiaBrinda Viswanathan
* Monograph 26/2013Medical Tourism in India: Progress, Opportunities and ChallengesK.R.Shanmugam
* Monograph 27/2014Appraisal of Priority Sector Lending by Commercial Banks in IndiaC. Bhujanga Rao
* Monograph 28/2014Fiscal Instruments for Climate Friendly Industrial Development in Tamil NaduD.K. Srivastava, K.R. Shanmugam, K.S. Kavi Kumar and Madhuri Saripalle
* Monograph 29/2014Prevalence of Undernutrition and Evidence on Interventions: Challenges for IndiaBrinda Viswanathan.
* Monograph 30/2014Counting The Poor: Measurement And Other IssuesC. Rangarajan and S. Mahendra Dev
* Monograph 31/2015
Technology and Economy for National Development: Technology Leads to Nonlinear Growth
Dr. A. P. J. Abdul Kalam, Former President of India
* Monograph 32/2015
India and the International Financial System
Raghuram Rajan
* Mongraph 33/2015
Fourteenth Finance Commission: Continuity, Change and Way Forward
Y.V. Reddy
Jayati SarkaEkta Selarka
MADRAS SCHOOL OF ECONOMICSGandhi Mandapam Road
Chennai 600 025 India
October 2015
WOMEN ON BOARD AND PERFORMANCE OF FAMILY FIRMS: EVIDENCE FROM INDIA
MSE Working Papers
Recent Issues
*Productivity, Energy Intensity and Output: A Unit Level Analysis of the Indian Manufacturing SectorSantosh K. Sahu and Himani Sharma
* Working Paper 120/2015Health Shocks and Coping Strategies: State Health Insurance Scheme of Andhra Pradesh, IndiaSowmya Dhanaraj
* Working Paper 121/2015Efficiency in Education Sector: A Case of Rajasthan State (India)Brijesh C Purohit
* Working Paper 122/2015Mergers and Acquisitions in the Indian Pharmaceutical SectorSantosh Kumar Sahu and Nitika Agarwal
* Working Paper 123/2015Analyzing the Water Footprint of Indian Dairy IndustryZareena B. Irfan and Mohana Mondal
* Working Paper 124/2015Recreational Value of Coastal and Marine Ecosystems in India: A Partial EstimatePranab Mukhopadhyay and Vanessa Da Costa
* Working Paper 125/2015Effect of Macroeconomic News Releases on Bond Yields in India China and JapanSreejata Banerjee and Divya Sinha
* Working Paper 126/2015Investigating Household Preferences for Restoring Pallikaranai MarshSuganya Balakumar and Sukanya Das
* Working Paper 127/2015The Culmination of the MDG's: A New Arena of the Sustainable Development GoalsZareena B. Irfan, Arpita Nehra and Mohana Mondal
* Working Paper 128/2015Analyzing the Aid Effectiveness on the Living Standard: A Check-Up on South East Asian CountriesZareena B. Irfan, Arpita Nehra and Mohana Mondal
* Working papers are downloadable from MSE website http://www.mse.ac.in
$ Restricted circulation
Working Paper 119/2015
* Working Paper 129/2015Related Party Transactions And Stock Price Crash Risk: Evidence From IndiaEkta Selarka and Subhra Choudhuryana Mondal