MT-CWR-092-013 AD-A247 005 ' 1I Ii I 1 ii !I~l liii, U~ ~ 11Annual Progress Report SHIELDED METAL ARC WELDING CONSUMABLES FOR ADVANCED HIGH STRENGTH STEELS (Work performed under Contract N00014-89-J-3170) S. Liu, G.L. Fredrickson, M.Q. Johnson, and G.R. Edwards Center for Welding and Joining Research Colorado School of Mines Golden, Colorado 80401 DTIC S ELECTE MAR 06 1992 D) February 1992 This document has been approved 92-05494. for public release nd :lale; its lir ;= !'
Transcript
MT-CWR-092-013
AD-A247 005' 1I Ii I 1 ii !I~l liii, U~ ~ 11Annual Progress Report
SHIELDED METAL ARC WELDING CONSUMABLESFOR ADVANCED HIGH STRENGTH STEELS
(Work performed under Contract N00014-89-J-3170)
S. Liu, G.L. Fredrickson, M.Q. Johnson, and G.R. Edwards
Center for Welding and Joining ResearchColorado School of MinesGolden, Colorado 80401
DTICS ELECTE
MAR 06 1992
D) February 1992
This document has been approved 92-05494.for public release nd :lale; its lir ;= !'
MT-CWR-092-013
Annual Progress Report
Shielded Metal Arc Welding Consumablesfor Advanced High Strength Steels 7rr\
(Work performed under Contract N00014-89-J-3170) (cc,),
UnfainoLJiced IArlington, Virginia 22217-5000 J-istificatiol
and Byf d Z.3 374Dis is itioii
David Taylor Research CenterFabrication Technology - Code 2815 Aiby Codes
Annapolis, Maryland 21402-5067 Dist avrJ/or0 PO Dist SpcuaI
Submitted by:
S. Liu, G. L. Fredrickson, M. Q. Johnson, and G. R. EdwardsCenter for Welding and Joining Research
Colorado School of MinesGolden, Colorado 80401
February 1992
Table of Contents:
Page
Abstract 3I. Introduction 3II. Development to Date 411. 1. Submerged Arc Welding 4II.1.1. Experimental Procedure 411.1.2. Results and Discussion 811. 1.2.1. Effects of Flux Chemical Composition -Viscosity 811.1.2.2. Effects of Flux Chemical Composition -Chemical Activity 1011.1.2.3. Weld Metal Chemistry 1411.1.2.4. Weld Metal Microstructure 2711.1.2.5. Weld Metal Mechanical Properties 4611.2. Shielded Metal Arc Welding 5511.2.1. Experimental Procedure 5511.2.2. Results and Discussion 5811.2.2.1. Electrode Weldability 5811.2.2.2. Electrode Performance 6211.2.2.3. Weld Metal Chemistry 6211.2.2.4. Weld Metal Microstructure 6811.2.2.5. Weld Metal Hydrogen Determination 68III. Conclusions to Date 75IV. On-going Tasks 76V. Acknowledgment 77VI. References 77VII. Research Personnel 78VIII. Related Publications and Presentations 78
2
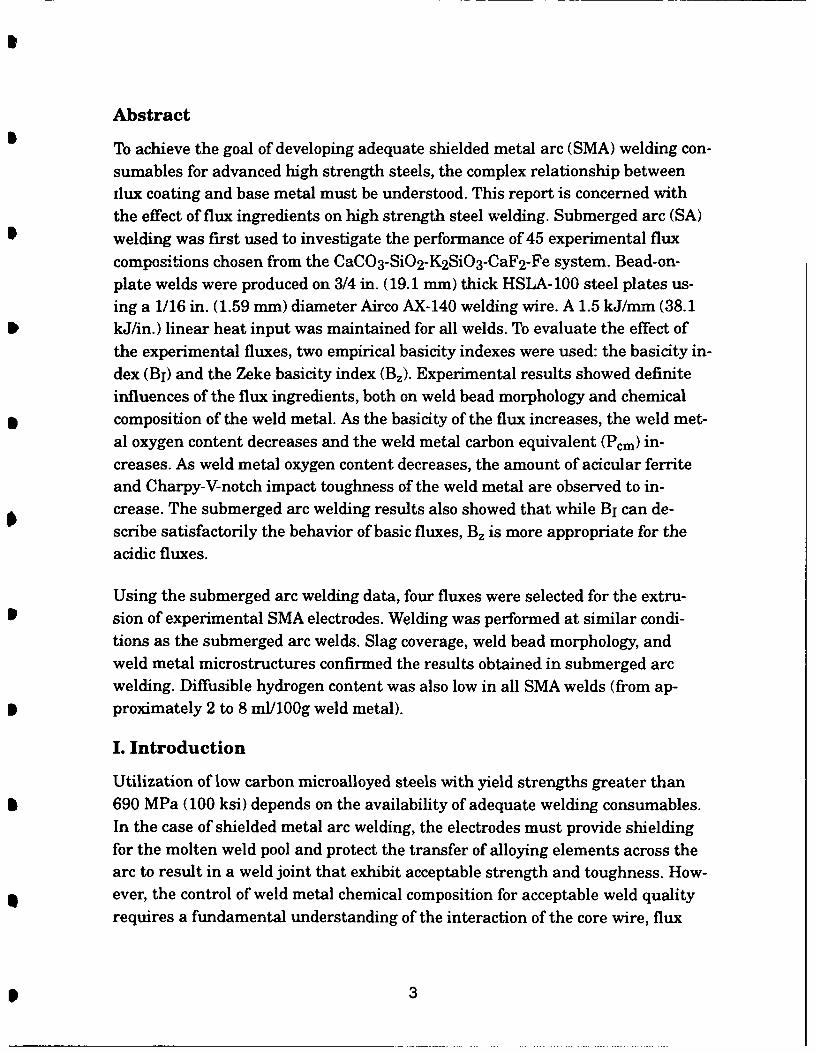
Abstract
To achieve the goal of developing adequate shielded metal arc (SMA) welding con-sumables for advanced high strength steels, the complex relationship betweenilux coating and base metal must be understood. This report is concerned withthe effect of flux ingredients on high strength steel welding. Submerged arc (SA)welding was first used to investigate the performance of 45 experimental fluxcompositions chosen from the CaCO 3-SiO 2-K2SiO3-CaF2-Fe system. Bead-on-plate welds were produced on 3/4 in. (19.1 mm) thick HSLA- 100 steel plates us-ing a 1/16 in. (1.59 mm) diameter Airco AX-140 welding wire. A 1.5 kJ/mm (38.1kJ/in.) linear heat input was maintained for all welds. To evaluate the effect ofthe experimental fluxes, two empirical basicity indexes were used: the basicity in-dex (BI) and the Zeke basicity index (B.). Experimental results showed definiteinfluences of the flux ingredients, both on weld bead morphology and chemicalcomposition of the weld metal. As the basicity of the flux increases, the weld met-al oxygen content decreases and the weld metal carbon equivalent (Pcm) in-creases. As weld metal oxygen content decreases, the amount of acicular ferriteand Charpy-V-notch impact toughness of the weld metal are observed to in-crease. The submerged arc welding results also showed that while BI can de-scribe satisfactorily the behavior of basic fluxes, Bz is more appropriate for theacidic fluxes.
Using the submerged arc welding data, four fluxes were selected for the extru-sion of experimental SMA electrodes. Welding was performed at similar condi-
tions as the submerged arc welds. Slag coverage, weld bead morphology, andweld metal microstructures confirmed the results obtained in submerged arcwelding. Diffusible hydrogen content was also low in all SMA welds (from ap-
0 proximately 2 to 8 ml/100g weld metal).
I. Introduction
Utilization of low carbon microalloyed steels with yield strengths greater than6 690 MPa (100 ksi) depends on the availability of adequate welding consumables.
In the case of shielded metal arc welding, the electrodes must provide shieldingfor the molten weld pool and protect the transfer of alloying elements across thearc to result in a weld joint that exhibit acceptable strength and toughness. How-
*1 ever, the control of weld metal chemical composition for acceptable weld qualityrequires a fundamental understanding of the interaction of the core wire, flux
3
coating, and base metal. This investigation has systematically varied the compo-
sition of the flux coatings of shielded metal arc electrodes for welding advanced
high strength steels. To minimize oxygen and hydrogen pickup in the weld metal,
a majority of the flux systems considered were basic in nature. While CaF2 and
CaCO 3 were the ingredients in the experimental fluxes that exhibit basic nature,K2 SiO 3 and Na2 SiO 3 , two commonly used binders, SiO2 and iron powder were
also added to simulate the flux composition of commercially available basicshielded metal arc electrodes. Each of the flux components was selected to evalu-ate its effect on slag formation, weld pool refining, and its ability to produce a
strong and tough weld deposit.
H. Development to Date
I.1. Submerged arc welding
I. 1.1, Experimental Procedure
Forty five quasi-ternary experimental fluxes were prepared from high purityCaCO 3 , CaF2 , SiO2 , K2 SiO3 .nH2 0, and Fe powder. These chemicals, at the right
amount and proportion, were thoroughly mixed and dried at 160 0C for three tosix hours. The baking removed moisture from the flux composition, particularlythe moisture associated with the potassium silicate binder (K2 SiO3 .nH2 0). Thefluxes were then crushed and sized to 14# Tyler mesh (1.7 mm screen aperture)to generate a flux consistency (granularity) adequate for the submerged arc weld-ing process. Following sizing, the fluxes were again baked, and stored in air-tight
jars until welding. The Oerlikon OP121TT flux was also used to produce welds
for comparison. Through a simple evaporation cxperiment it was determinedthat the hydrated potassium silicate binder (K2 SiO3 .nH20) used in this investi-gation was 50 wt. pct. potassium silicate (K 2SiO 3 ) and 50 wt. pct. water (H 20).
The coefficient n in the chemical formula of potassium silicate is approximsaelyequal to 8. Experimental flux composition data are all expressed in term- J the
dehydrated form of potassium silicate binder (K2SiO 3 ). The chemical r _rnpositionof the experimental fluxes investigated and their basicity index vall.es are re-
ported in Table I.
Notice that the fluxes have been renamed since the 1991 re-,Ort (Ref. 1): Al to A9(from the 1991 report) are now AA1 to AA9. Similarly, Al J w A18 are AB1 to
AB9; B1 to B9 are BA1 to BA9; C1 to C9 are CA1 to CA9; and finally, C10 to C18are CB1 to CB9.
4
Table I. Chemical Composition (in wt. pct.) of the expeimental fluxes.
The as-received HSLA-100 steel plates were cut into strips approximately 5 in.(127 m) wide and 8 in. (203 mm) long. The weld axis was perpendicular to the
direction of hot rolling. The steel coupons received blanchard grinding on both
faces and were degreased prior to welding.
The submerged arc welding process was used to produce all the experimental
welds. The welding parameters were: travel speed of 15 ipm (6.5 mn/s), welding
current of 320 A (wire feed rate of 225 ipm), welding voltage of 30 V, and a con-tact tip-to-work distance of 1 in., which resulted in a linear heat input of approxi-mately 1.5 kJ/mm (38.1 kJ/in.). All welds were bead-on-plate and produced using0.0625 in. (1.6 mm) diameter Airco AX-140 welding wire. Additional bead-in-
groove welds were also produced specifically for Charpy-V-notch testing. The V-
grooves were machined 4 mm (0.16 in.) deep with 600 included angle. The chemi-cal compositions of the steel plate and welding wire are given Table II.
Table II. Chemical composition (in wt. pct.) of HSLA-100 steel and
Airco AX-140 filler wire for welding high strength steels.
Each individual weld was examined with respect to bead morphology, hardness,weld metal microstructure, bulk chemical composition, and interstitial elements.Light microscopy was performed on selected weld specimens to establish the
trends of various microstructural constituents as a function of the welding fluxcomposition. Microstructural constituents were categorized into five classifica-tions: primary ferrite (PF), acicular ferrite (AF), ferrite with aligned secondphase (FS[A]), ferrite with non-aligned second phase (FS[NA]), and martensite-austenite-carbide microconstituents (MAC). In this report, primary ferrite wasdefined either as ferrite veins or polygonal grains associated with prior austenitegrain boundaries. Acicular ferrite (AF) is defined as small non-aligned ferritelaths found within prior austenite grains. Ferrite with aligned second phase isany grouping of two or more parallel laths of ferrite. Ferrite that completely sur-rounds microphases which are approximately equiaxed and randomly distributedis known as ferrite with non-aligned second phase (FS[NA]). Except for MAC, allmicrostructural constituents were identified according to the guidelines devel-oped by the International Institute of Welding (IIW) (Ref. 2). The quantitativemetallography data of these experimental welds are reported in Table III, whichalso included the weld made with the Oerlikon flux (weld HOP).
Additional welds were made using low carbon steel plates and processed follow-ing the same procedure described above. The low carbon steel weld results werecompared with those of the HSLA-100 steel welds.
Three compositions were chosen from each quasi-ternary flux system (AA, AB,BA, CA, and CB) to prepare welds for CVN impact toughness testing. The selec-tion was based on the weld metal microstructures that these fluxes produced.The cross-sectional dimensions of the sub-sized Charpy specimens are 5 mm by10 mm and the V-notches were 2.0 ± 0.025 mm deep with a notch tip radius of0.25 ± 0.025 mm, and an inside angle of 45 ± 10. The welds made using OerlikonOP121TT flux (HOP) were also tested. In addition, CVN specimens were ma-chined directly from the HSLA- 100 steel plate as control specimens. A total of sev-enteen sets of specimens were tested at six temperatures: -196, -150, -117, -98, -78, -50, 0, and 1000C. After testing, the percent brittle fracture surface of eachspecimen was measured using a computerized image analyzer and the percentlateral expansion was determined using a digital caliper. These measurements,together with the impact toughness data, are reported in Table IV.
7
Table III. Quantitative metallography data of selectedexperimental welds.
Weld ID I MAC PF AF FS[A] FS[NA]HOP 3.4 13.9 45.4 34.3 3.0
11.1.2.1. Effect of Flux Chemical Composition - Viscosity
In this report, a basic slag is defined as an ionic liquid oxide system with free oxy-gen ions (02 -) present; i.e., all oxygen ion sites associated with ionic acidic oxidespecies in the slag are filled and an excess of free oxygen ions (02 -) are present tomove as separate entities. An acidic slag is an ionic liquid oxide system with vir-tually no free oxygen ions (02 -) present. This slag would capture any free oxygen
8
Table IV. Charpy-V-notch impact energies at 60'C for the experimental
welds.
We!d ID Impact Lateral Expansion Brdte;e FractureToughness at Notch Surface
(ft-lb) (%) (%)
HSLA-100 61 42 20
HOP 35 22 30
HAA3 26 14 28
HAA5 25 11 32
HAA7 34 21 29
HAB3 24 13 30
HAB5 22 11 30HAB7 17 10 34
HBA3 21 13 32
HBA5 22 11 30
HBA7 19 10 39
HCA2 22 10 40
HCA4 19 10 37
HCA7 17 9 31
HCB2 31 17 25
HC4 26 15 29
HCB7 23 10 30
ions (02-) present in the system. Since all oxygen ion sites associated with ionicacidic oxide species are not filled, a deficiency of free oxygen ions (02-) is present.
A neutral slag is an ionic liquid oxide system with neither an excess nor a defi-
ciency of oxygen ions (02-). Examples of the three types of slags are provided be-
The oxygen ions (02-) from the calcium oxide (CaO) decrease the extent of polym-
erization of the silica (Si0 2 ) tetrahedral structure. The silica (Si02) network is
completely broken down (i.e., depolymerized) when the mole ratio of calcium ox-ide (CaO) to silica (Si0 2 ) reaches 2, which is the neutral slag condition. The sili-
cate ions (Si0 44-) and the calcium ions (Ca 2 +) have a much greater mobility with
respect to each other than do the silicon ions (Si 4+ ) and oxygen ions (02-) in the
9
pure silica (SiO2 ) slag. Therefore the viscosity of the silica-based slag decreased
with calcium oxide (CaO) additions.
Calcium fluoride (CaF2 ), like calcium oxide (CaO), also has the ability to depolym-erize the silica (SiO 2 ) tetrahedral structure in a liquid oxide slag system. In com-paring calcium oxide (CaO) to calcium fluoride (CaF 2 ), it is evident that one moleof each has the same potential to depolymerize the silica (SiO 2 ) tetrahedral net-work. In practice, however, it is found that calcium fluoride (CaF 2) is somewhatmore efficient at fluxing silica (SiO2 ) than calcium oxide (CaO). Note the way inwhich the term "flux" was used; i.e., flux: to add to in small amounts for the pur-pose of decreasing the viscosity of the slag. Here the solvent (SiO2 ) is the slagand the solute (CaO or CaF 2 ) is the fluxing agent.
For the reasons provided above, both BI and Bz can be used as an indica" .:n ofthe viscosity and liquidus temperature of the slag. As the BI value increases, theextent of depolymerization of the acidic oxide components increases, and the vis-cosity of the slag decreases. Since viscosity can be related to the liquidus tempera-ture of a slag, the liquidus temperature of the slag decreases with increasing BIvalue.
11.1.2.2. Effects of Flux Chemical Composition - Chemical Activity
An alternate argument can also be formed suggesting that the BI value can beused as an indication of the chemical activity of certain species in the slag 7or ex-ample, as the BI value increases; the activity of oxygen ions (02 ") decreases (e.g.,replacing SiO2 with CaO decreases the oxygen ion (02-) content of the slag sys-tem); the activity of the metal ions associated with the basic oxides increases(e.g., replacing SiO2 with CaO increases the calcium ion (Ca 2+ ) content of theslag system); and the activity of the metal ions associated with the acidic oxidesdecreases (e.g., replacing SiO2 with CaO decreases the silicon ion (Si4 + ) contentof the slag system).
The B, value represents the ionic fraction of excess (free) oxygen ions (02-) in thedissociated molten slag. Therefore, a basic slag has a positive B, value, a neutralslag has a B, value of zero, and an acidic slag has a negative B, value.
The Bz basicity index can be represented by the following mathematical expres-
sion (Ref. 3):
10
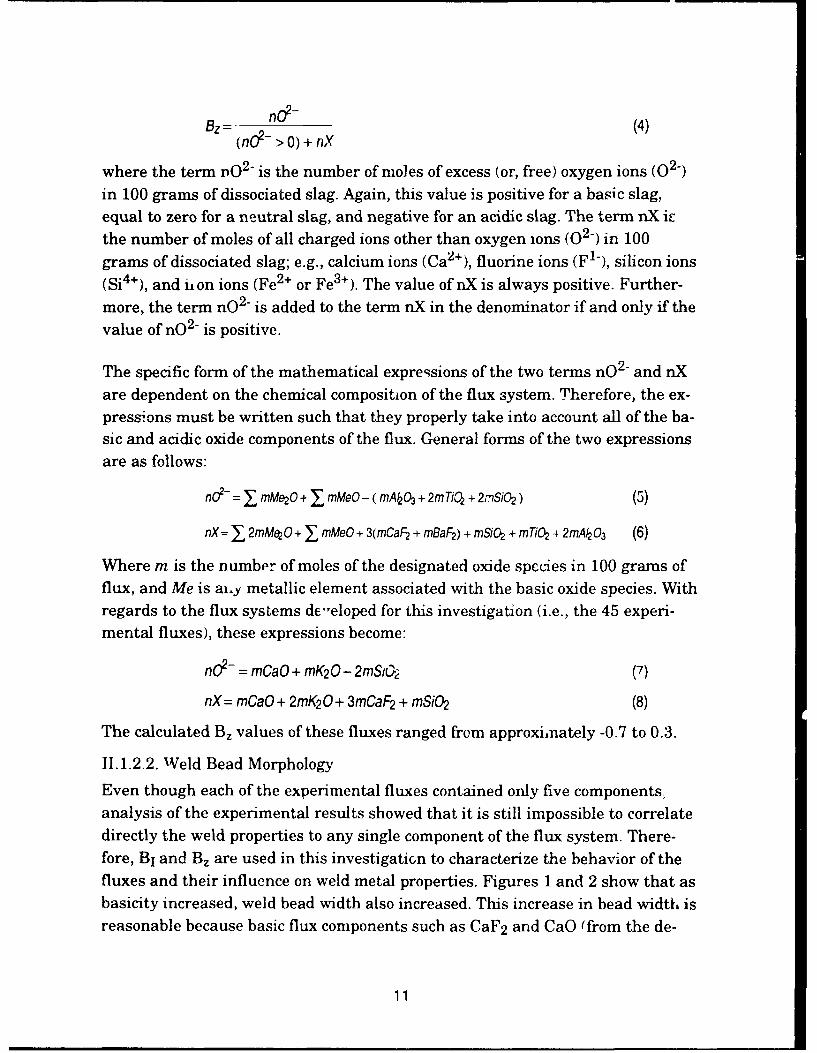
ez= (4)
(nO - > O) + nX
where the term 0 2 - is the number of moles of excess (or, free) oxygen ions (02-)in 100 grams of dissociated slag. Again, this value is positive for a basic slag,equal to zero for a neutral slag, and negative for an acidic slag. The term nX icthe number of moles of all charged ions other than oxygen ions (02-) in 100grams of dissociated slag; e.g., calcium ions (Ca 2+), fluorine ions (F1-), silicon ions(Si 4+), and U on ions (Fe2, or Fe3+). The value of nX is always positive. Further-more, the term n02- is added to the term nX in the denominator if and only if thevalue of n02- is positive.
The specific form of the mathematical expressions of the two terms n02- and nXare dependent on the chemical composition of the flux system. Therefore, the ex-pressions must be written such that they properly take into account all of the ba-sic and acidic oxide components of the flux. General forms of the two expressionsare as follows:
Where m is the number of moles of the designated oxide species in 100 grams offlux, and Me is ai.y metallic element associated with the basic oxide species. Withregards to the flux systems de"eloped for this investigation (i.e., the 45 experi-mental fluxes), these expressions become:
nO- = mCaO + mK20- 2mS,2 (7)
nX= mCaO + 2mK20+ 3mCaF2 + mSiO2 (8)
The calculated B, values of these fluxes ranged from approxinately -0.7 to 0.3.
11.1.2.2. Weld Bead Morphology
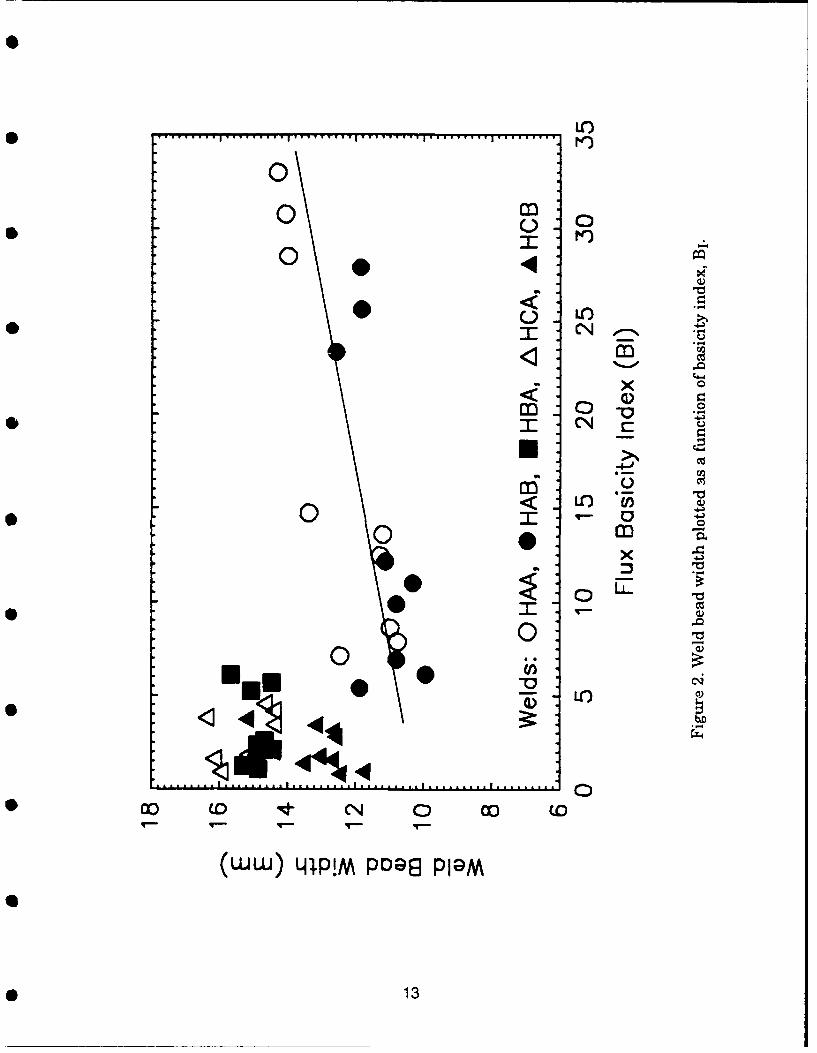
Even though each of the experimental fluxes contained only five components,analysis of the experimental results showed that it is still impossible to correlatedirectly the weld properties to any single component of the flux system. There-fore, BI and B, are used in this investigation to characterize the behavior of thefluxes and their influence on weld metal properties. Figures 1 and 2 show that asbasicity increased, weld bead width also increased. This increase in bead width isreasonable because basic flux components such as CaF 2 and CaO (from the de-
l1
- 0 0
to-
< - M
- 0
Cdu
* I 0m -
0~
. D
*00 CD 4 0 00 (.o
(wwLJ) ql1P!M PD;De PIaM
* 12
* LO
o L
0
0 LO
...... U . . . ..Lu
muuj .l~ Po-0l
* I13
composition of CaCO 3 ) are known to decrease the viscosity of a silicate-based
slag, which results in a more "runny" slag and a flattened bead. This explanation
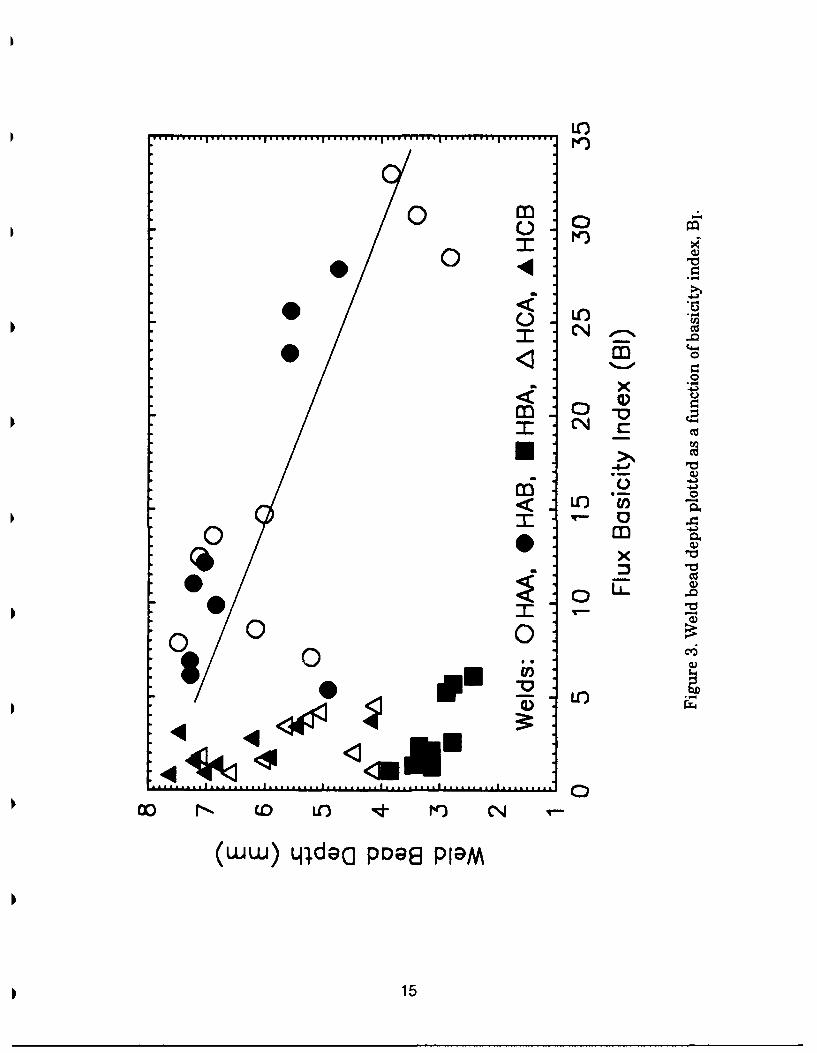
also agrees with other weld morphology data such as weld bead penetration,
which decreased with increasing flux basicity, Figure 3.
However, Figures 2 to 3 also showed a peculiar pattern that when BI was used to
describe the weld bead morphology, the data points that correspond to the weldsmade using fluxes with high SiO 2 and K2 SiO 3 concentrations were all grouped to-
gether. When B, was used, Figure 1, these same data points were well distrib-
uted, showing a clear trend that weld bead width increased with flux basicity. In-
stead, the data points that correspond to the more basic fluxes with high CaO
and CaF 2 are all grouped together. This indicates that, as an indicator of flux vis-
cosity and melting temperature, B, is capable of describing the behavior of high
silicate and silica fluxes. B1, on the other hand, is more appropriate for more ba-
sic fluxes.
Weld HAA7, shown in Figure 4a and 4b, further illustrates the influence of flux
composition on weld bead morphology. The regular surface ripple pattern, uni-
form toe line, and smooth bead-to-plate transition indicate that the molten slaghad good flow properties which provided good weld pool shielding and excellent
bead surface. This flux contained 31.6 wt.pct. CaF 2 , 42.7 wt.pct. CaCO3 , 5.3wt.pct. K2 SiO3 , and 21.1 wt.pct. Fe. the BI and B, of this flux were 28.5 and 0.18,
respectively.
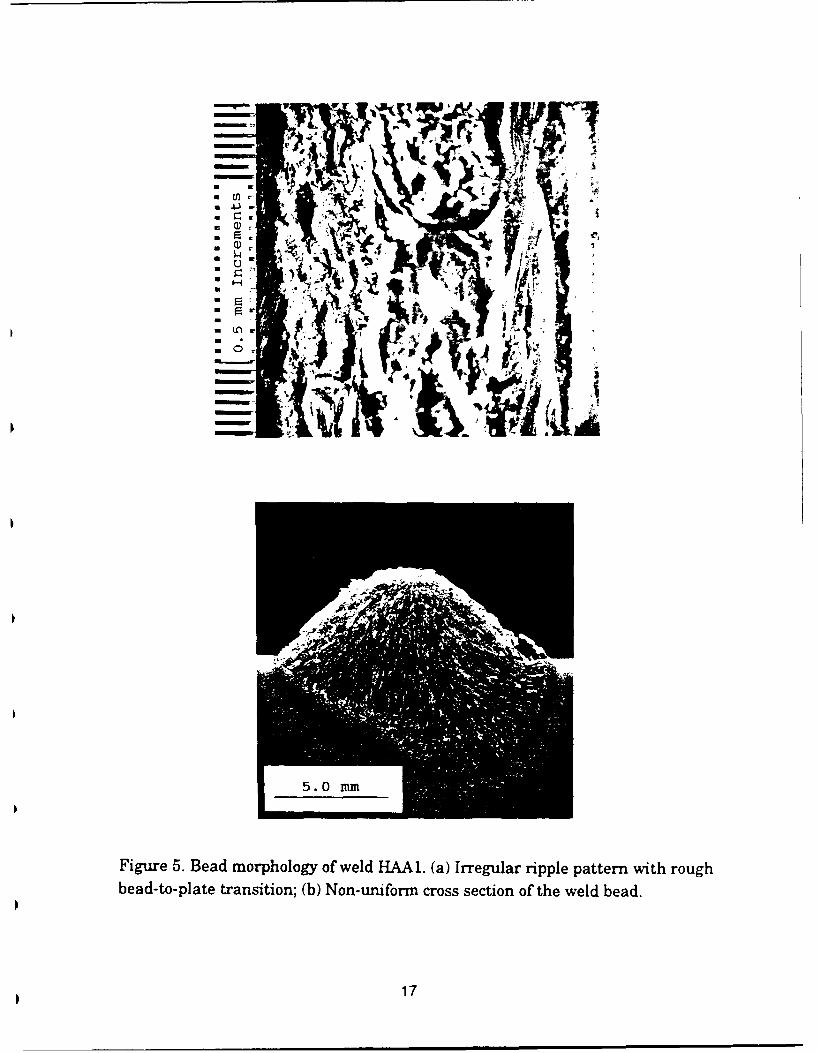
Weld HAA1, shown in Figure 5a and 5b, is the opposite of the previous example.
Rough bead surface, poor bead-to-plate transition, and irregular bead penetra-
tion indicate that the flux was too viscous and had a high melting temperature.
and 23.5 wt.pct. Fe. The the BI and BZ of this flux were 7.1 and 0.22, respec-tively.
11.1.2.3. Weld Metal Chemical Composition
0 Welding fluxes affect the weld metal chemical composition mainly by the amountof oxygen that they introduce into the weld pool. Depending on the base metal,
loss of alloying elements and the formation of oxide inclusions may be expected.Thus, it is extremely important to determine the amount of oxygen originated
from each of the major flux components.
it 14
on t0')
0 0044
0
* 0
1C5
x
ipm
LOU
..... ....
00~~~ 04- ( O 4 r
0w)qdC D8P9
c~j 15
r ~ A
5. mm
Figure 4Bedmrhlgofwl A7(a) Smot ripepter4ihgobea-toplae tanstio; () Uifom cossset fth ed ed
* 16
..: .... .. .4.
- .r
a4
. ~ 5 0r mm
>i • K 3
bedt-lt taio n (b o-nfr rs eto ftewl ed
*17
-- QA
*I
a,
Figure 5.Bead morpology of eld HAA1.(a) Irreg lri leatrnwhrog
bedt pae rnito;(b o-uior rssscio fth ed ed
U1
The experimental welds exhibited oxygen contents that varied from 200 to 900ppm, Figure 6. As the oxygen potential of the flux increased, indicated by the to-tal flux oxygen content, the weld metal oxygen content also increased. Among thefive components, CaF 2 contains no oxygen (atomic or ionic) and does not contrib-ute oxygen to the molten metal. The influence of CaF 2 on the final weld metaloxygen content could be attributed to other mechanisms discussed previously.Figure 7 shows that additions of CaCO 3 in the flux led to a decrease of weld met-al oxygen content. This observation clearly indicates the effect of CO 2 , the prod-uct of carbonate decomposition in arc shielding. CaO, also a product of carbonatedecomposition, is a strong oxide that does not give away its oxygen readily to theweld pool. K2SiO 3 , contrary to what was expected, did not increase the amount ofoxygen in weld metal, as shown in Figure 8. Out of the five components, SiO2 isthe only one that promoted an increase in weld metal oxygen content, Figure 9.Being a weak oxide, SiO 2 releases its oxygen with relatively ease and oxidizes
the weld pool.
Due to the high oxygen potential of the welding flux with respect to the base met-al, it is expected that the base metal composition will play only a minor role in ad-
justing the final weld pool oxygen content. Welds carried out on both HSLA-100steel and low carbon steel plates supported the above statement. Oxygen analy-ses show that the two weld pools were oxidized equally, Figure 10. Despite thelarger amount of alloying elements (manganese, nickel, and chromium) in theHSLA-100 steel plate, the low carbon steel (with much leaner composition) expe-
rienced similar oxygen pickup.
Figures 11 and 12 show that acidic fluxes provided a larger amount of oxygen inthe weld metal. Notice again the effectiveness of Bz in predicting the behavior ofacidic fluxes while BI is more sensitive to basic fluxes. It is, therefore, recom-mended that the applications of Bz and BI be limited to acidic and basic fluxes, re-spectively. However, both basicity indexes failed to describe the effect of K2 SiO 3 ,that is, decreased oxygen pickup with increasing potassium silicate. It is, there-fore, further suggested that the use of basicity index be limited to the descriptionof the physical properties of the welding slag only.
As indicated earlier, oxygen in weld metal could mean alloying element loss. In-deed, weld metal manganese content was observed to decrease from 1.1 to 0.9wt.pct., Figure 13. Weld HOP was made using the Oerlikon OP121TT flux which
contained some MnO and thus, exhibited higher manganese content in the weld
18
I0
0
mI C- 0
I0
00
04
I 0 C
'1 A
* --
([] dd jalooU~AO I14 1M
19)
0
x
0 04 0 00
0QE
00
C L. 0
M* 0ED m
* ) 0* 4Uox
0 0
o o~
Ci)
0* - 4 Itn
*([s] wdd) jualuoo U96AXO JD19 PI9M
* 20
x0
0 0
r')
y0
0 E00 0- W
44 0x 0o
XCN 0
440 0 O0
4 0
a) 0) 0:
([ol Ludd) 1ualuoo U95AXO ID19V P19M
21
I0
_ :3__ 0
4 0
4 C
cooo
00
c -4- C U
x CN0 C-
x 0
0 0
44-
0
* 0 0 O0- 0~
q--
* ([0] wdd) jualuooj U9bAXO IDWg~q P19M
* 22
0
*0
0 -
0
o 0tC)a
0 0
en -0
aC)
V C)
c 0
0 ) p
Db P-
00
0 0
23
U
o No
C4)
I0
-inn0
00
4 3:
000
0~~~Q~ M *-- 4 -4
I-0
44
04
X C13
C)u
* 0.4~J a
oocx
C130-
LOD
0 0 0 0 000
([0] wdd) jueuoo uab~(xo IDj9N PIGIM
25
0~
00
* C)IM
0
a as0
mLC) C:
C- a)0- 0
Q_ C) >-0)00
0 m N 0 m C*- 1.-I-*
-lod-1m 0UjO SU5DqIIAPO
260
metal than some of the other experimental welds. Besides manganese loss, sili-con loss was also observed. However, increasing weld metal silicon content with
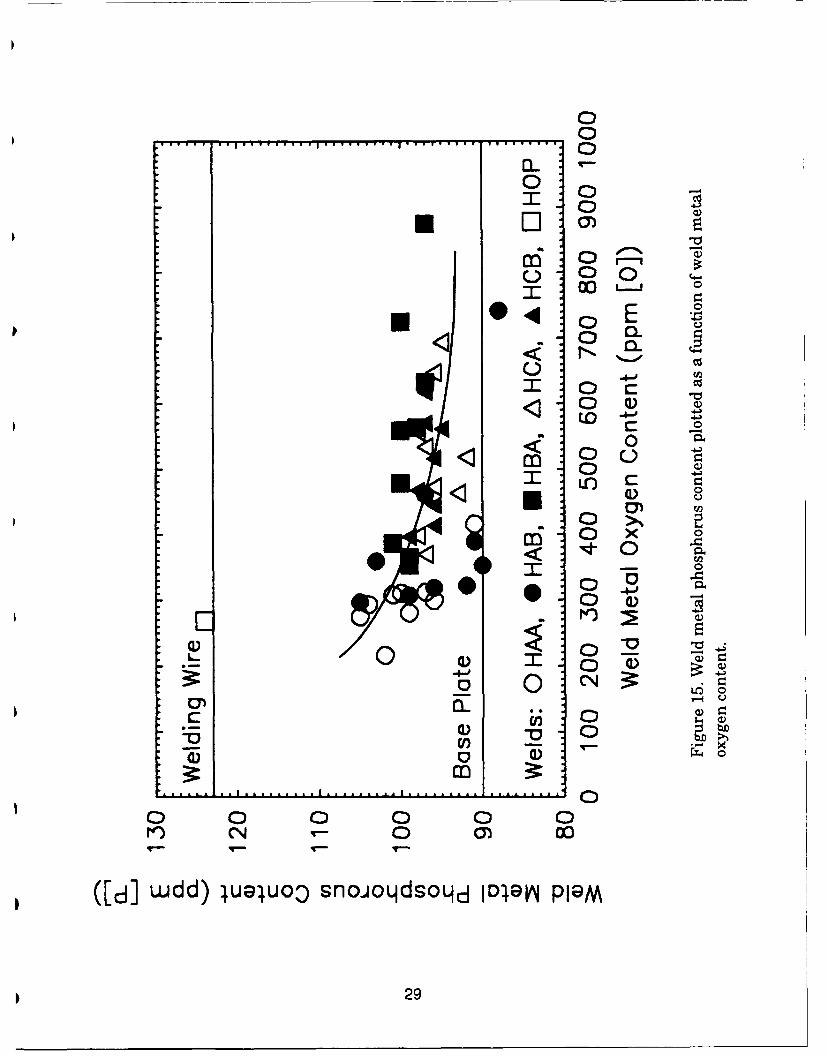
oxygen, as shown in Figure 14, indicates that inclusions rich in silicon and oxy-gen were entrapped in the weld metal. No significant changes in carbon, copper,nickel, and chromium were observed. Slight reduction in phosphorus was also ob-
served as shown in Figure 15.
These observations indicate that with the exception of manganese, the flux sys-
tems investigated are capable of providing both good shielding for the elementtransfer across the arc and weld pool recovery. In the case of manganese, adjust-
ments such as ferromanganese additions can be made to the flux formulation
such that adequate amounts of manganese be transferred to the weld metal.
With the variation in chemical composition, the chemical hardenability of theweld metal, indicated by Pcm, is also affected, as shown in Figure 16. Pcm is de-
fined as (Ref. 4):
Si Mn+Cu+Cr Ni Mo+ VPcm =C+ + 215-+ 5B (7)30 20 60 1
The observed decrease in Pcm with oxygen also hints that the weld metal me-
chanical properties has changed. Indeed, hardness increased with weld metalPcm and decreased with weld metal oxygen content, Figures 17 and 18.
1. 1.2.4. Weld Metal Microstructures
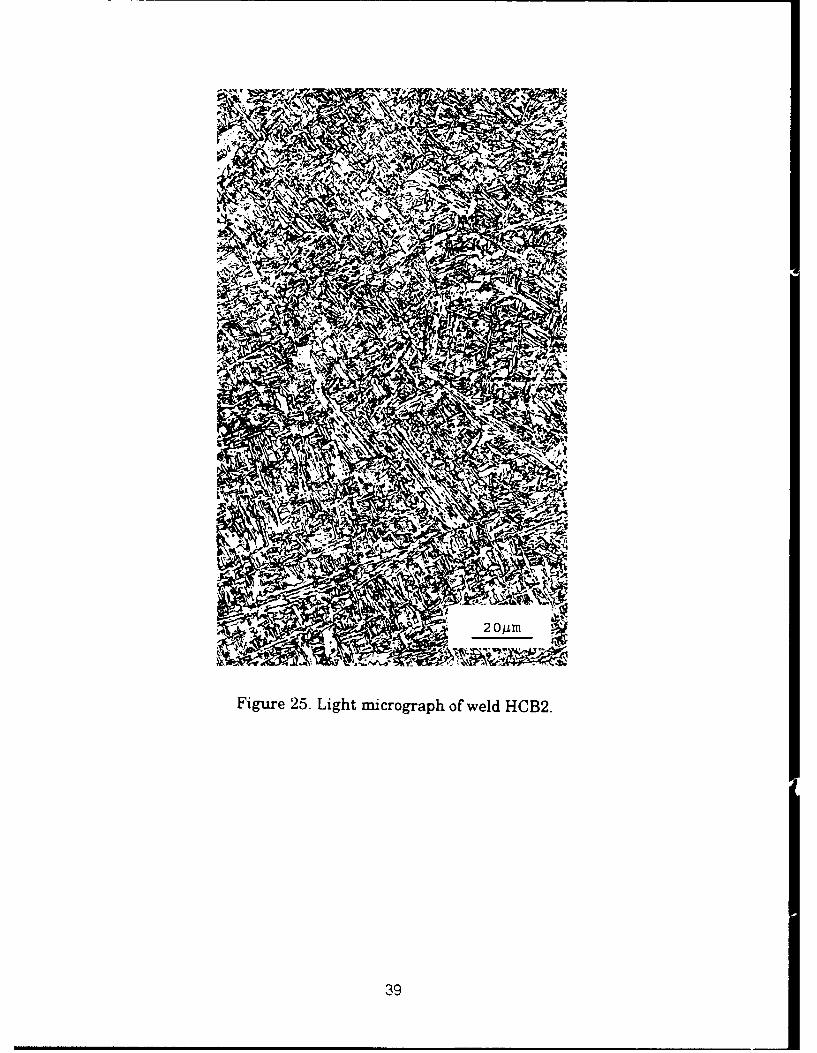
Figures 19 to 26 show the microstructures of some selected experimental welds.As can be seen in Table III, they all contained primary ferrite, acicular ferrite,ferrite with second phase aligned, ferrite with second phase non-aligned, andmartensite-austenite-carbide microconstituent. For comparison, micrographs of
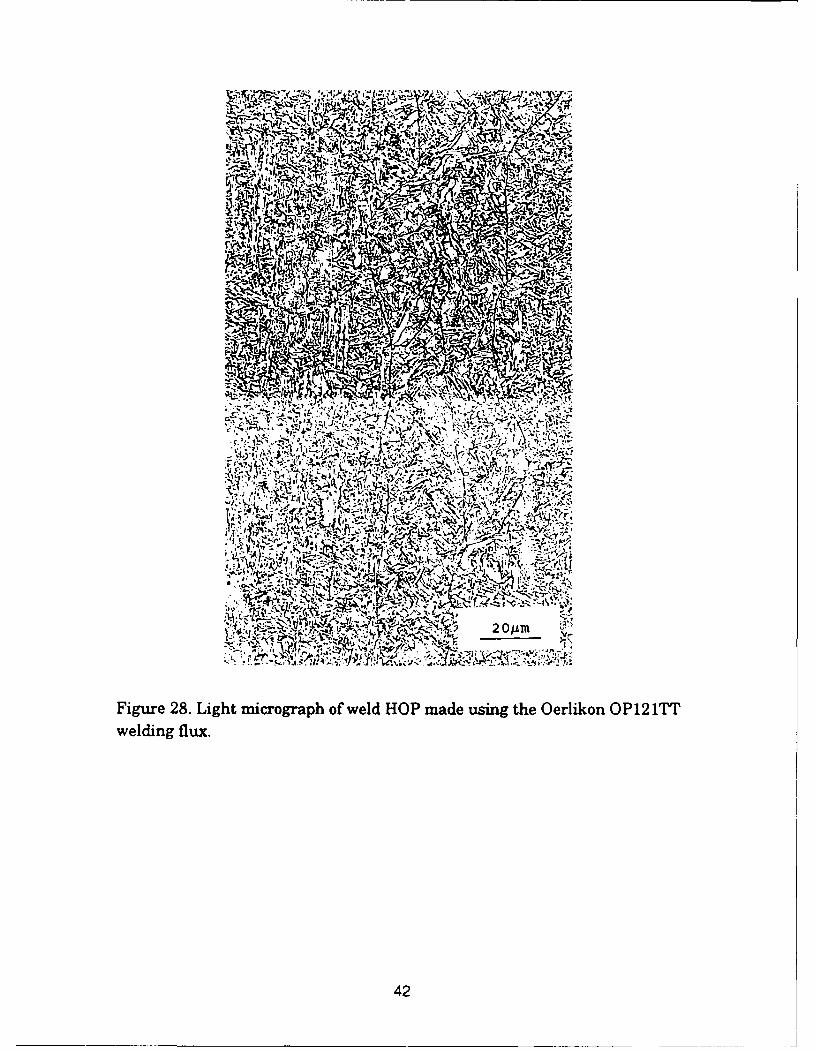
the base metal and weld HOP are shown in Figures 27 and 28, respectively.While the base metal showed predominately lath martensite and bainite, the mi-
crostructure of weld HOP is similar to that of the welds made using the experi-mental fluxes.
As a result of chemical composition variation, the weld metal microstructure alsoshowed changes. Further analysis showed that the amount of acicular ferrite de-
creased with weld metal oxygen content, Figure 29. However, the scatter in the
experimental data is considerable. A parallel study using low carbon steels re-sulted in significantly better correlation that the volume fraction of acicular fer-rite decreased with weld metal oxygen content, Figure 30. Similarly, Figure 31 in-
Figure 27. Light mcrograph of HSLA-100 steel showing the martensitic-bainiticmicros tructure.
41
v T
032
"Nm ~z
t,42
0
00
U La_
o-C)00
A 0E
0 0)'~0
0
U-0 -0
4 -oc
0q - -
oCC:)
(gd~~~~oA)~ 4)U0 WJG Df~VI1NP~
43X
00
C
00)
0 0 C 0
"-I
m0 c0L 0
@00
c
C X
C -v0
CN
C Io
o 0 0 0 0 0 0 0 0Mc r- CO UO .4- n) N
44
0*0
0
V-~
0) ~
I 0 E- .
0 :4-j0 (u
m (D -'* I c
0o
'1C4
C).
o0
0 0L
00
0 0 0 0 0 0 0to LO It'oC% -
(-zIoJA) JUaUO0 pQU511V
GSDq~d PUOO;S qlJ!M Gj!J.JA IDQ PIQM
45
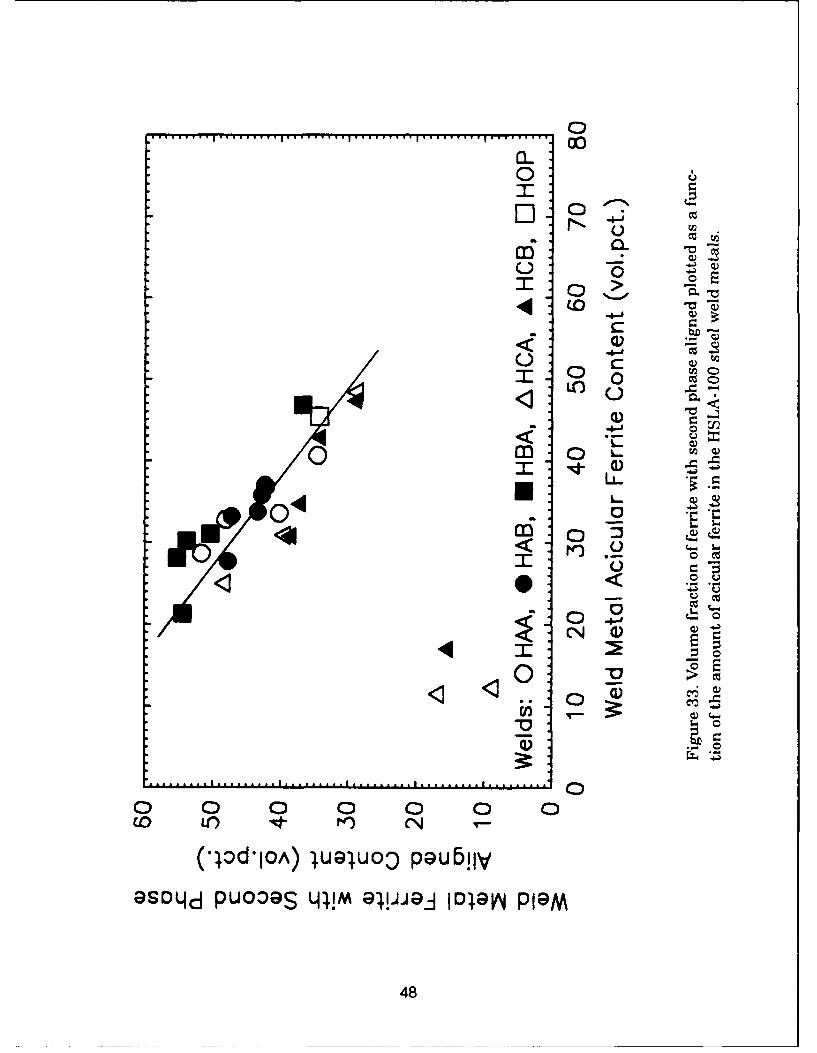
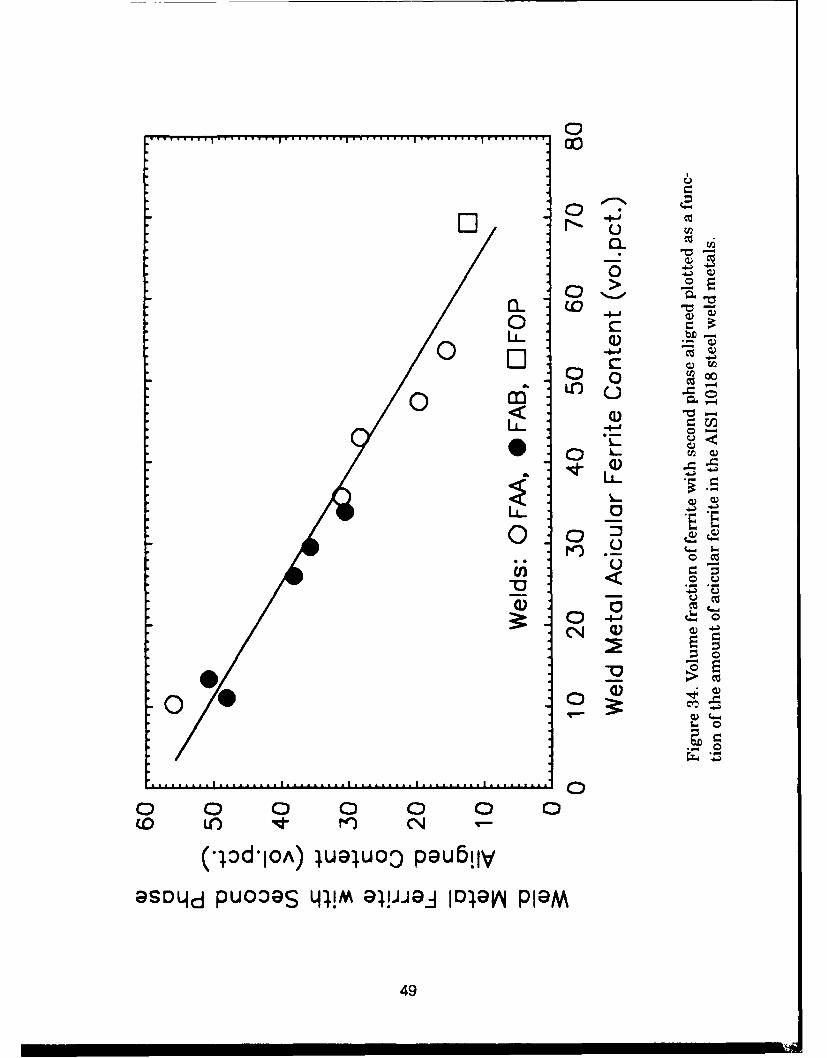
dicates that the amount of ferrite with second phase aligned increased with weldmetal oxygen content. However, the scatter in the experimental data was againconsiderable. The results from the low carbon steel welds showed a significantlybetter correlation that the volume fraction of ferrite with sccond phase aligned in-creased with weld metal oxygen content, Figure 32. When the volume fraction offerrite with second phase aligned was plotted versus the amount of acicular fer-rite, a clear trend was observed, Figure 33. As weld metal oxygen increased, fer-rite with aligned second phase increased at the cost of acicular ferrite. This was
again confirmed by the low carbon steel welding experiments, Figure 34. Excel-lent correlation between acicular ferrite and ferrite with aligned second phasewas observed.
The discussion above shows that the quasi-ternary experimental fluxes were ca-pable of modifying the microstructure of the HSLA-100 steel welds and that theflux oxygen potential determines the relative amounts of acicular ferrite and fer-rite with second phase aligned.
11.1.2.5. Weld Metal Mechanical Properties
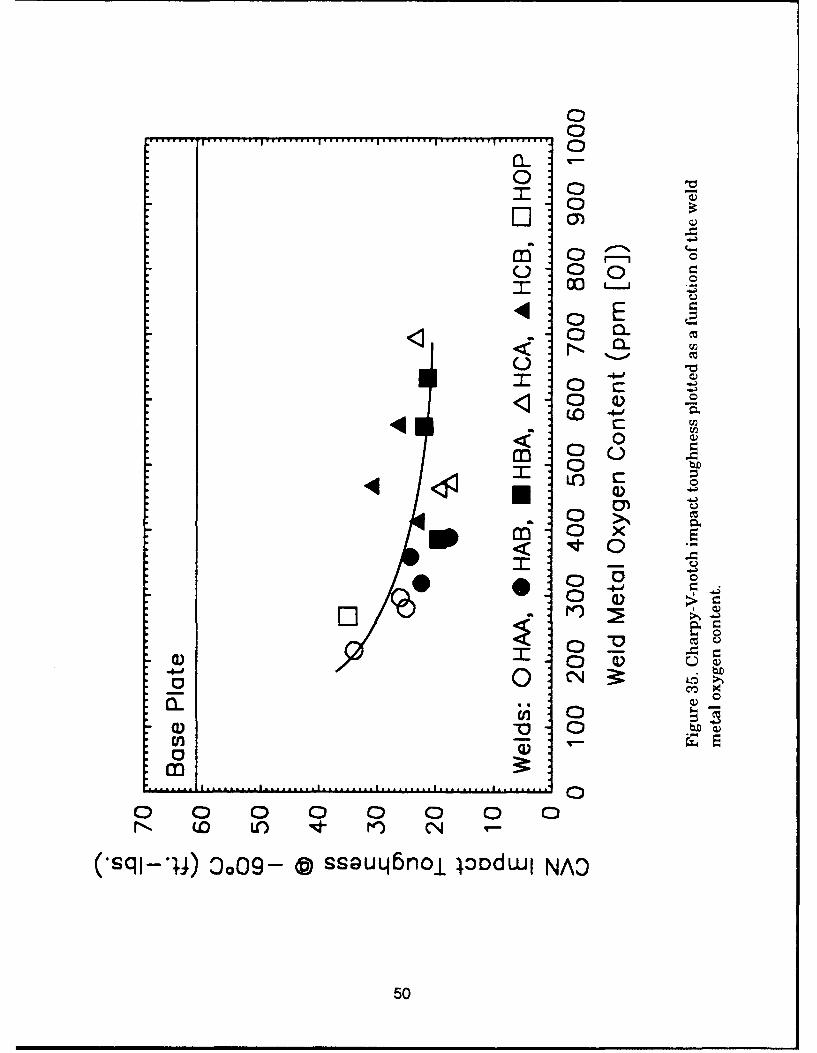
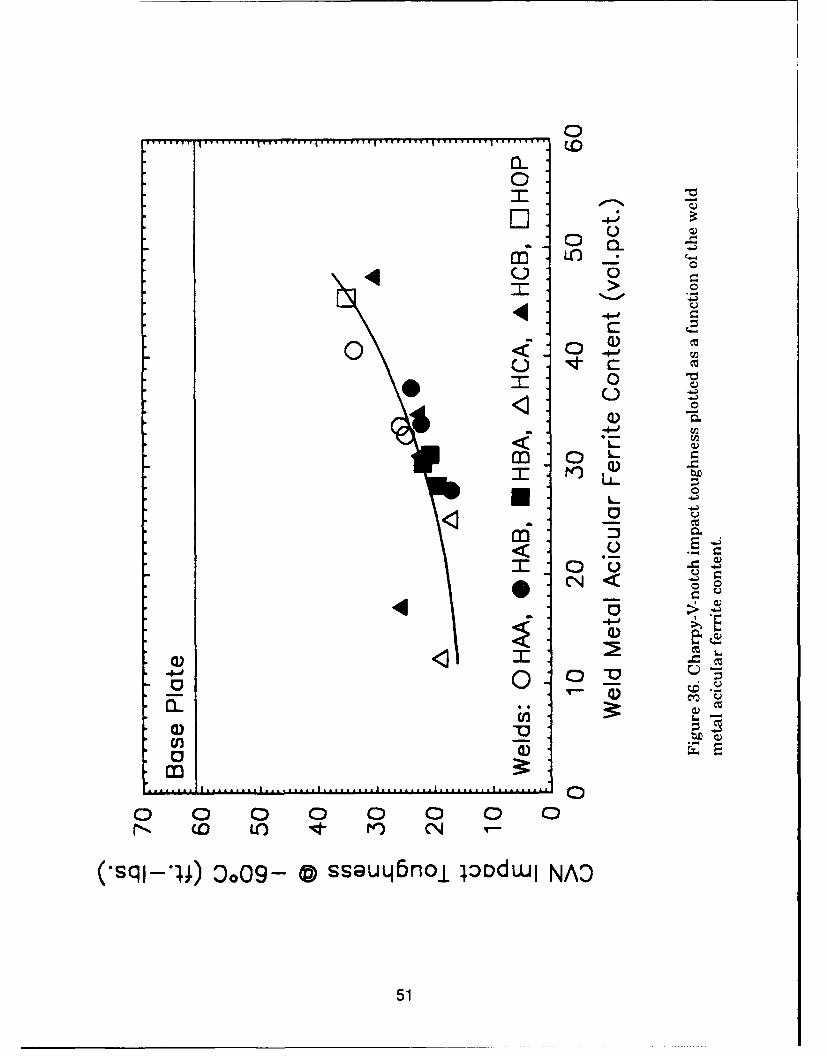
Some selected Charpy-V-notch testing results are reported in Table IV. Figures35 to 39 illustrate further the influence of the experimental fluxes on weld metaltoughness. As weld metal oxygen increased, result of the higher flux oxygen po-tential, the energy absorbed during Charpy-V-notch testing was observed to de-crease, Figure 35. Increasing volume fraction of acicular ferrite, decreasing oxy-gen in the weld metal, improved the toughness, Figure 36. The non-parallel na-ture of the acicular ferrite laths usually exhibit high resistance to crack propaga-tion and increase weld metal toughness.
Pcm also seems to play an important role in the determination of weld metaltoughness. There appears to be a threshold value of Pcm, approximately 0.29wt.pct, beyond which a minimum Charpy-V-notch energy of 20 ft-lb is observed,Figure 37. This threshold point also corresponds to a weld metal oxygen contentof 300 ppm, Figure 16. Careful examination of Figure 35, however, seems to indi-cate that if the weld metal oxygen exceeds 400 ppm, the energy absorbed duringCharpy-V-notch testing also approaches a minimum. As such, the flux that willprovide optimal performance in terms of microstructure and toughness is ex-
pected to result in a weld metal oxygen content between 300 to 400 ppm. Severalfluxes from the systems AB, BA, CA, and CB will meet the conditions above andwill be tested further in shielded metal arc welding.
46
0
*0
0 .
0.000
0000
0LL 0
ED~ C
C:.
* 0C00
0000
LL 0
0 C ) E
04 0 ~
0~
0 $.~ 0
00
0 0 0 0 0 0 0 0 0
(-Iod-JOA) JuGJuoO pQU611V
47
0~
E0
0 >E(0c
0LOU, -
-4.-j 0CT
0 m 0
04*-63
< rE-)QI~
o -
COC
(-IoJA) JU91U00 pgUb!IV
9SOdq PUOOOS qjM gl!'J9 ID~gn P19M
48
0-.-
O] C-Z
0
0 W4-
LL.* -4-
UC
0 0
0_020
(D
-S-
0 0 0 0 0 00
co 1 It n CN
(-pIoJA) JUa91uoD pgUfbIp
9SDHCd PU009S qjM gl!JJ~j IDJOV4 P19M
49
0
0
0L1 1
m E
C:) 0000
0 Q
0
00()
0 Q4'1 34w v
00
500
0~
0
c 4-j
m 0
10 E00
<<
0. 0 7
au
a 0) E
0 0 0 0 0 00r*-. D LO d- rn CN00
(-q-4-' 009 C CutboiOdw A
U) 51
• 0
7)
T - -4-'
. ). Q
:~ 0 .
, 0 00"4.)
m rj<
C
0_
, c) X r-o0 .0
Q00
m
0 0 0 0 0 0 0 00Nl~ (D Lfl -.I- PO
('sql-'I4) D0 09- a ssauqbno± loDdwI NAO
52
I I I I............................L
M~ 0 C.
En)0 4 0
M0
00
L--
00
4-0)
0 *6nE
(1)
L , U - I. ...
0 0 0 0 0 0 0 0N , CD tO 110- P N T
(*sql-,I) Xo9o- @ ssauLIbnoi lDdwl NAO
53
C
00 -
C) C
00
II
00'1z
0 _0
D D
00
0 0 0 0 0 0 0 ol
('sqj-*Il) ocog- @ ssauLq6noi jodwl NA3
54
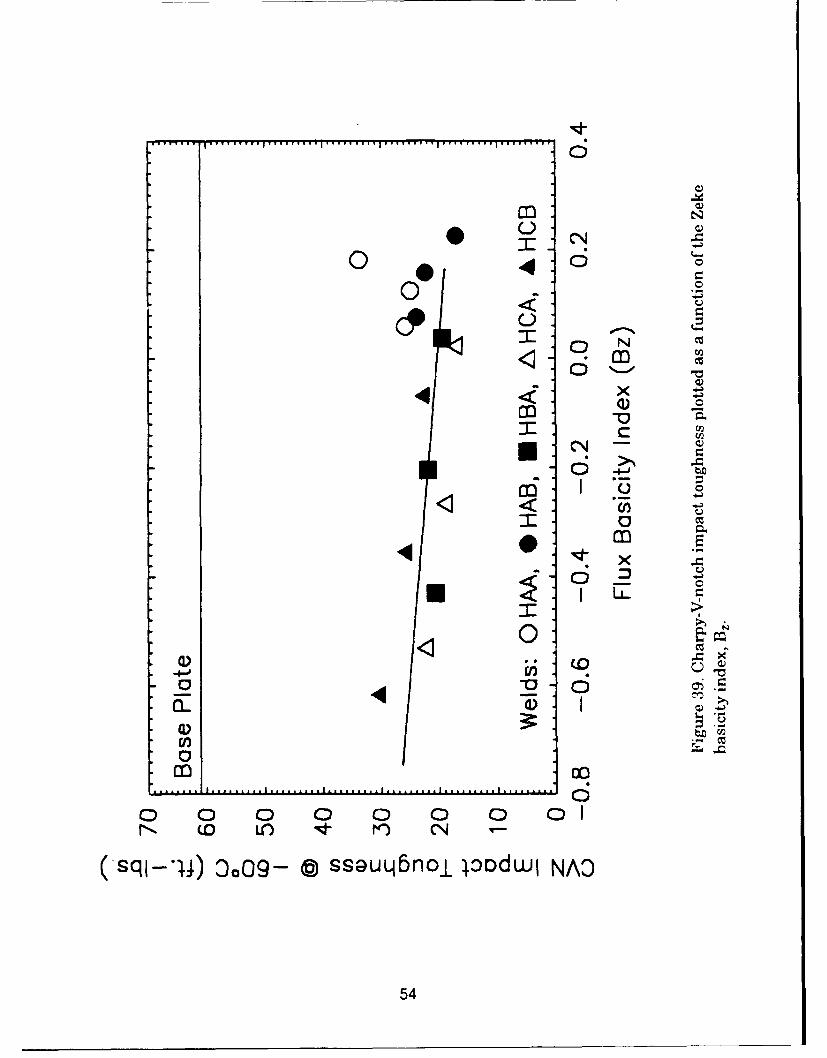
Again, basicity index should not be used to correlate microstructure nor mechani-cal properties. Figures 38 and 39 conclude similar observations.
II.2. Shielded Metal Arc Welding
11.2.1. Experimental Procedure
Based on the results obtained in the submerged arc welding matrix reported inthe previous section, four candidate shielded metal arc electrode coating composi-tions were selected. Fluxes AA7 and CB2 produced welds that exhibited the high-est toughness using sub-sized Charpy impact specimens. A larger relative volumefraction ratio of acicular ferrite to undesirable constituents such as ferrite withaligned second phase and primary ferrite was observed in welds prepared withfluxes AA7 and CB2. Fluxes CA9 and CB9 were also selected based on correla-tions determined by Charpy-V-notch testing and microstructural analysis. Thecompositions of the chosen fluxes are shown in Table I.
The high purity grade chemicals used during the submerged arc welding flux in-vestigation were very fine (-325 Tyler mesh) and did not produce an acceptableelectrode coating during extrusion. Good extrudability was achieved only when alarge amount of binder was used. The use of fine powders also resulted in arough surface finish and cracking of coatings after drying. Even though fine parti-cles provided good plasticity during extrusion, drying was not uniform; crackedcoatings consequently resulted. Coarse particles, while not as extrudable, al-lowed for fast and uniform drying of the coating. A combination of coarser flux in-gredients (-40 to +200 # Tyler mesh) required less binder and yielded electrodeswith a crack-free surface, visually comparable to many commercial electrodes.Coatings must have a proper balance of particle sizes to ensure the following:ease of extrusion, adequate strength to withstand handling, and morphologywhich permits immediate and continuous drying. A 50/50 wt. pct. mixture of po-tassium silicate and sodium silicate binders was used to increase the coating re-sistance to moisture pickup after baking, and to stabilize the arc during welding.
Initially, the dry flux components were weighed and mixed in a dry mixingblender. The binder was then weighed and incrementally added into the dry mixand blended by hand until an extrudable flux was obtained. Mixing by hand al-lowed for the determination of the appropriate amount of binder required for ex-trusion, through the "feel" of the consistency of the mix. When the right amountof binder has been added, the wet mix exhibited a uniform plasticity, indicating
55
the right consistency for extrusion. At this time, the amount of binder added to
the formulation was recorded. No known testing method can reproduce the tac-
tile sensing of the flux by hand. A drop wedge test, similar to that used in foun-
dry sand testing, is being developed in this study and may eventually replace the
empirical approach of determining the optimal plasticity point by tactile sensing.
After an extrudable mixture was obtained, the wet flux was compacted into a cy-
lindrical slug and placed into the extruding press. Extrusion pressure (ram
speed) was adjusted until a smooth and uniform coating was produced. The coat-
ing eccentricity was measured and the centering of the electrode relative to the
coating adjusted. After extrusion, the electrodes were allowed to air dry before
baking at 4500 C for one hour in an argon atmosphere. A baking schedule of
450'C fbr one hour is reported to yield weld metal diffusible hydrogen levels of
less than 5 ml H 2 per 100 g weld metal at standard temperature and pressure
(STP) (Ref. 4). The argon atmosphere was selected because evidence of oxidation
of the core electrode and iron powder in the flux coating was observed when the
electrodes were baked in air. After baking, the electrodes were stored in a holding
oven at 180 0C.
It was the intent of this study to use the Airco AX-140 welding wire as core elec-
trode for the extrusion of shielded metal arc electrodes, so that results of the
SMA welding results could be compared directly with those obtained in SA weld-ing. Unfortunately, the Airco AX- 140 wire used in the submerged arc welding re-
search was unavailable in 1/8" (3.2 mm) diameter because commercial production
was discontinued. An alternate alloyed steel core electrode (ER100S-1) was used.
The composition of this electrode is shown in Table V. Notice that the composi-
tion of ER100-Si core rod is slightly different from that of the Airco AX-140 elec-
trode used in the submerged arc welding experiments.
Coating moisture tests were conducted according to AWS A5.1-81 Section 13.12(Specifications for covered carbon steel arc welding electrodes) (Ref. 5), utilizing
the experimental apparatus is shown in Figure 40. The coating was combusted in
Table V. Chemical composition (in wt. pct.) of the ER100S-1 core
electrode used in the shielded metal arc welding experiments.
Core C Mn Si P S Ni IMo Cr Cu V TiIL electrode ID I,V____ _____________________I
Figure 40. Experimental apparatus for the determination of electrode coating
moisture content.
57
a stream of pure dry oxygen between 900 to 1000'C, and the moisture evolvedfrom the coating was absorbed in a glass tube that contained anhydrous magne-
sium perchlorate, Mg(CI0 4 )2 . The amount of moisture absorbed by the anhy-drous magnesium perchlorate was determined by the weight change of the con-tents of the glass tube. A coating moisture level of less than 0.2% was observedwhen the baking schedule described earlier was followed. Data reported in the lit-erature (Ref. 4) states that a coating moisture level of 0.2% is necessary to
achieve very low hydrogen levels in the weld metal.
Prior to welding, the test plates were prepared following the same procedure de-
scribed in the submerged arc welding section. Bead-on-plate welds were made us-ing the automatic shielded metal arc welding system developed. The use of this
system, shown in Figures 41a and 41b, produced high quality welds and elimi-nated the many inconsistencies introduced during manual welding. Current andvoltages were chosen to provide optimal slag coverage and appropriate bead mor-phology. A minimum voltage of 30 volts was established for the CB2 electrode.Currents higher than 120 amps caused the slag to burn off, thereby exposing thehot weld bead to the atmosphere. The heat input of these welds varied between
1.1 to 1.4 kJ/mm (27.9 to 35.6 kJlin.).
A Leco image analyzer was used to determine the dilution and bead irorphology
of the six SMA welds produced. The image analyzer provided more accuratemeasurements of the relative areas used to calculate dilution.
Diffusible hydrogen was measured according to AWS A4.3-86 (Standard Methodsfor Determination of the Diffusible Hydrogen Content of Martensitic, Bainitic,and Ferritic Weld Metal produced by Arc Welding) (Ref. 4) using the diffusible hy-
drogen collection equipment shown in Figure 42. The welds were produced onA36 steel test coupons. Immediately after the arc was extinguished the weld wasquenched in ice water and transferred to liquid nitrogen for further processingand storage. Diffusible hydrogen was collected in mercury-filled glass eudiometer
tubes maintained at 45°C for 72 hours. Prior to insertion into the eudiometer
tubes, the test coupons were warmed to 0°C, rinsed in acetone, and blown dry.
11.2.2. Results and Discussion
11.2.2.1. Electrode Weldability
When basic electrodes are used, a cup (arc barrel) is formed at the tip of the elec-trode which protects the arc column from the atmosphere during welding. The
58
A
B
Figure 41. Automatic shielded metal arc welding equipment setup.
59
Figure 42. Experimental apparatus for the determination of diffusible hydrogen.
60
size and shape of the cone is a function of many factors including arc stability,
melting temperature of the coating material, and coating thickness. A high arc
voltage was observed when a thick coating diameter was used. Since arc voltageis proportional to arc gap, a thick coating in the absence of arc stabilizers will re-sult in a large cone, long arc gap, and high arc voltage.
Coating thickness is typically expressed in terms of Ocoat/O4electrode, a ratio of thecoating diameter to electrode diameter. Typically, commercial low hydrogen elec-
trodes have a ratio Of Ocoat/Oelectrode=l. 7 0. Initially, a ratio of Ocoat/Oelectrode=l. 8 5was used for the CB2 flux composition, and a high voltage (40 volts) resulted. Arc
stabilizers such as TiO 2 or Na 2TiO3 could have been added to lower the weldingvoltage. However, addition of a strong deoxidizer such as titanium at the present
stage of research will not allow any direct correlation between the SA and theSMA welding research (arc stabilizers were not used in the SA welding experi-ments). Upon reducing the coating-to-electrode diameter ratio to 1.68 and usinga mixed sodium and potassium silicate binder, the voltage for the CB2 flux com-
position was reduced to 30 volts. The composition of flux AA7 also required a rela-tively high voltage (28 volts) during welding. Both of the compositions CA9 andCB9 were capable of welding with voltages lower than 25 volts without the aid of
arc stabilizers. These results are very encouraging since they indicate that a goodarc stability can be obtained with the experimental electrodes without significant
changes in the flux composition.
The compositions of the as-extruded flux coatings are listed in Table VI. The com-
positions are slightly different from the compositions specified in the SAW por-tion of this research because of the adjustments made to the binders to provide
an extrudable flux.
Table VI. Actual Composition of the experimental shielded metal arcwelding electrode coatings.
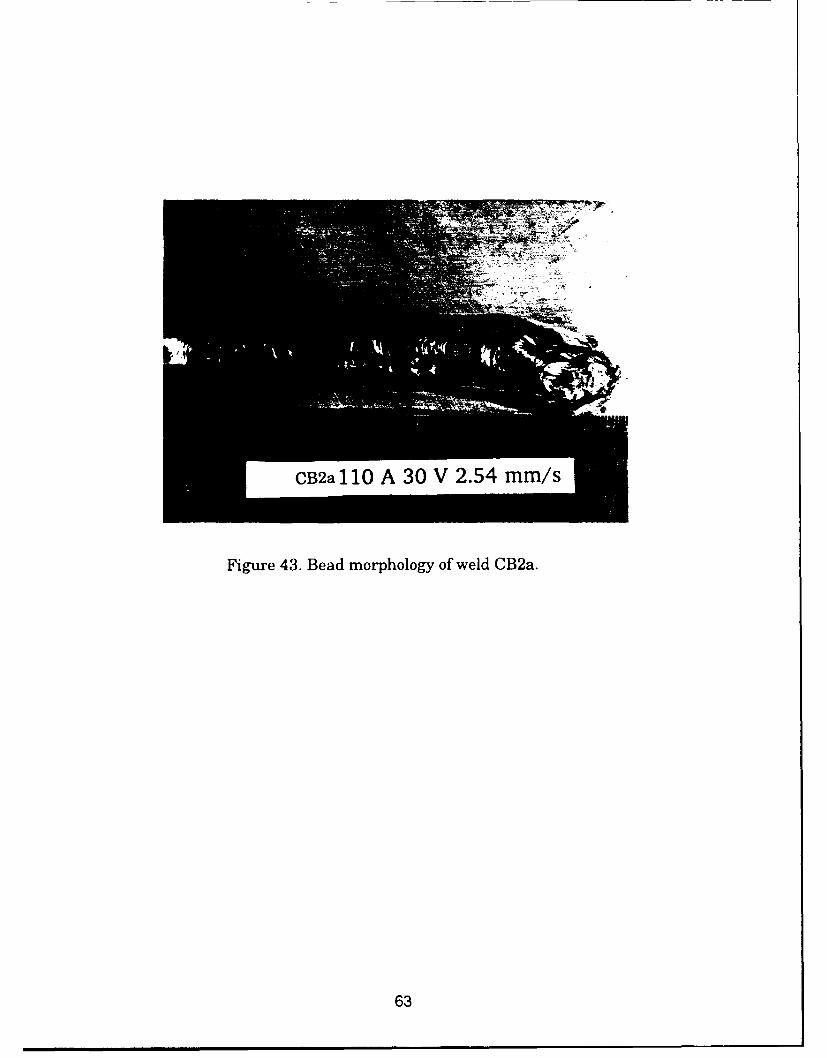
Performance of the electrodes in terms of bead morphology, slag detachability,and spatter are listed in decreasing order as follows: CA9, CB9, AA7, and CB2.Coating CA9 exhibited the best performance, and CB2, the worst. Both fluxesCB2 and AA7 established high welding voltages of 30 V and 28 V, respectively.However, high voltage in these electrodes may be due to the lack of arc stabi-lizers present in the flux and not related to the protective ability of the slag sys-tem. The flux composition CB2 did not produce an adequate slag at high weldingcurrents and voltages relative to the other experimental electrodes. When cur-rents in excess of 110 A were used, the slag became fluid and burned off leaving
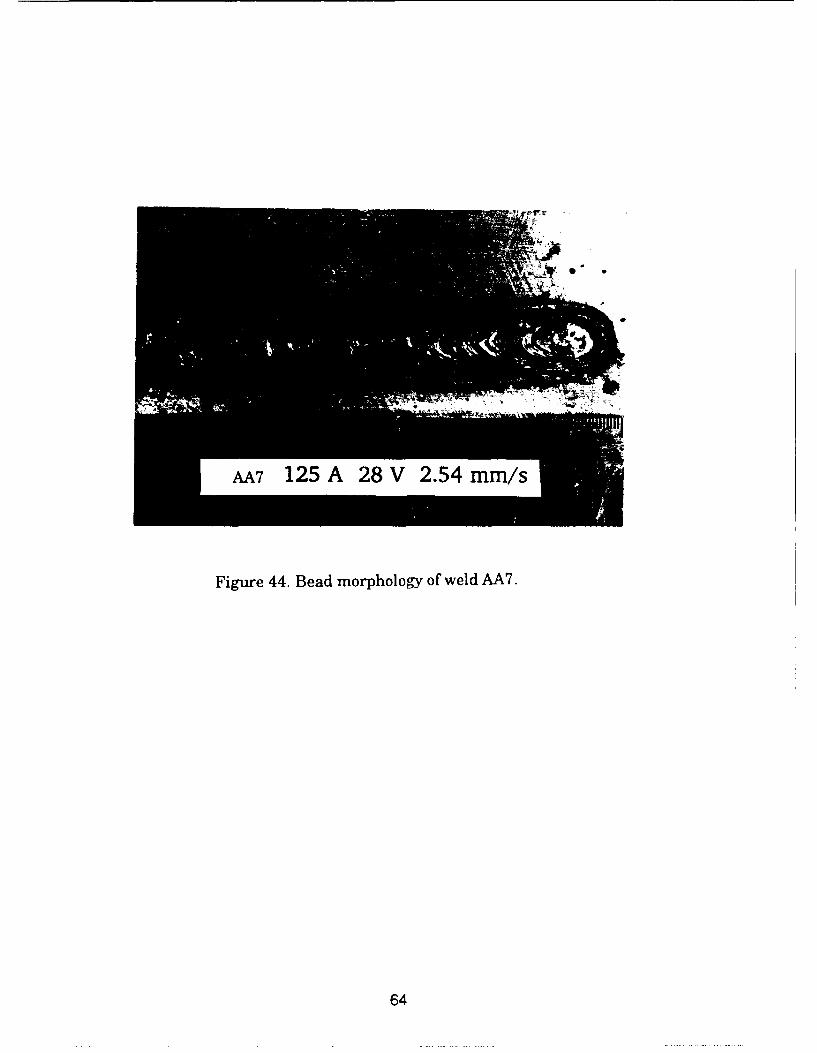
the weld bead uncovered. The surface quality of weld HCB2 is shown in Figure43. Electrode AA7 provided superior penetration and had adequate slag coverageeven at a heat input approaching 1.5 kJ/mm (38.1 kJ/in.). The high CaCO3 influx AA7 resulted in more spatter than observed using the other experimentalelectrodes. However, the appearance of the weld produced using the AA7 elec-trode resembled an commercial slag because of the absence of SiO 2 in the flux,Figure 44. Electrodes CB9 and CA9 produced superior bead morphology, slag cov-erage, and slag detachability, Figures 45 and 46. Both electrodes were capable ofwelding with less than 25 volts. These consumables exhibited good electrodeweldability, to the point of being comparable to many commercial electrodes.
11.2.2.3. Weld Metal Chemistry
Four welds were made with a constant heat input of 1.3 to 1.4 kJ/mm and twowelds were produced at 1.1 kJ/mm. The compositions of the SMA welds producedare listed in Table VII. Notice that the alloy contents in these welds are lowerthan those produced in the SA welding experiments (in particular, manganeseand chromium are low). This difference occurred because of the lower alloy con-tent of the ER100S-1 electrode relative to the Airco AX-140 electrode used in thesubmerged arc experiments.
Flux compositions CB9 and CA9 appear to provide the best alloy recovery. Thesecompositions also had the lowest penetration and lowest dilutions, as shown inTable VIII. Lower arc voltages in these two electrodes may also explain the
smaller alloy losses to the slag. Because of the shorter arc column, the chemicalelements being transferred are not as exposed to the atmosphere. Welds CB2 andAA7 experienced higher losses in manganese and chromium than the CA9 and
62
CB2a 110 A 30 V 2.54 mm/s
Figure 43. Bead morphology of weld CB2a.
63
AA7 125 A 28 V 2.54 mm/s
Figure 44. Bead morphology of weld AA7.
64
CB9. 145 A 24 V 2.54 mm/s
Figure 45. Bead morphology of weld CB9.
65
Figure 46. Bead morphology of weld CA9a.
66
Table VII: Chemical composition (in wt. pct.) of the experimental welds.
CB9 fluxes. Based on the calculation of compositional changes in the weld pool,the loss of hardenability elements in AA7 may be attributed to the lack of deoxi-dizers such as silicon present in the weld pool.
Table VIII. Dilution, bead width and depth of theexperimental welds.
Weld ID W~id Dilulon Bead Width Bead Depth(%) (mm) (mm)
CB2a 5 14.77 1.9
CB2b 43 13.1 2.9
CB9 41 12.2 1.3
CA9a 41 11.9 2.4
CA9b 44 12.8 -1.6
AA7 61 12.7 1 2.9
Interstitial oxygen analysis, currently in progress, may give further insight intothe loss of hardenability elements. Additions such as Fe-Si or Fe-Ti may be neces-sary to scavenge oxygen and minimize alloying element losses.
Estimates of the ultimate tensile strength of the experimental welds are shownin Table IX. Ultimate tensile strengths of 117-132 ksi were predicted for the ex-perimental welds based on the Brinell hardness data. Yield strencths are ex-pected to vary between 90 and 105 ksi. These strength values are encouragingsince they match well the properties of the HSLA-100 base plate used in this in-
67
vestigation. If a higher strength material is used, the strength of the weld metal
is also expected to increase.
Table IX: Hardness and Strength estimates for the experimental welds.
Weld ID Bnnell Hardness GUTS I_ (ksi) (ksi)
CB2a 2 120 110
CB2b 250 117 107
CB9 252 120 110
CA9a 237 112 102
CA9b 276 132 122
AA7 250 117 107
The lower levels of chromium and manganese compared to the SA welds may ex-plain the lower strengths observed. The lower alloy elements produced using the
ER100S-1 core electrode may be experimentally beneficial since the use of thiselectrode offers the flexibility of increasing the strength of welds by additions tothe flux of ferromanganese, ferrochromium or microalloying elements such as ti-
tanium, vanadium, and niobium. The specific effect of adding macro- and microal-loying elements on the microstructure and mechanical properties is worthy of fur-ther investigation. Such additions can be made in a systematic manner so that
the resultant changes in the microstructure and mechanical properties can becorrelated.
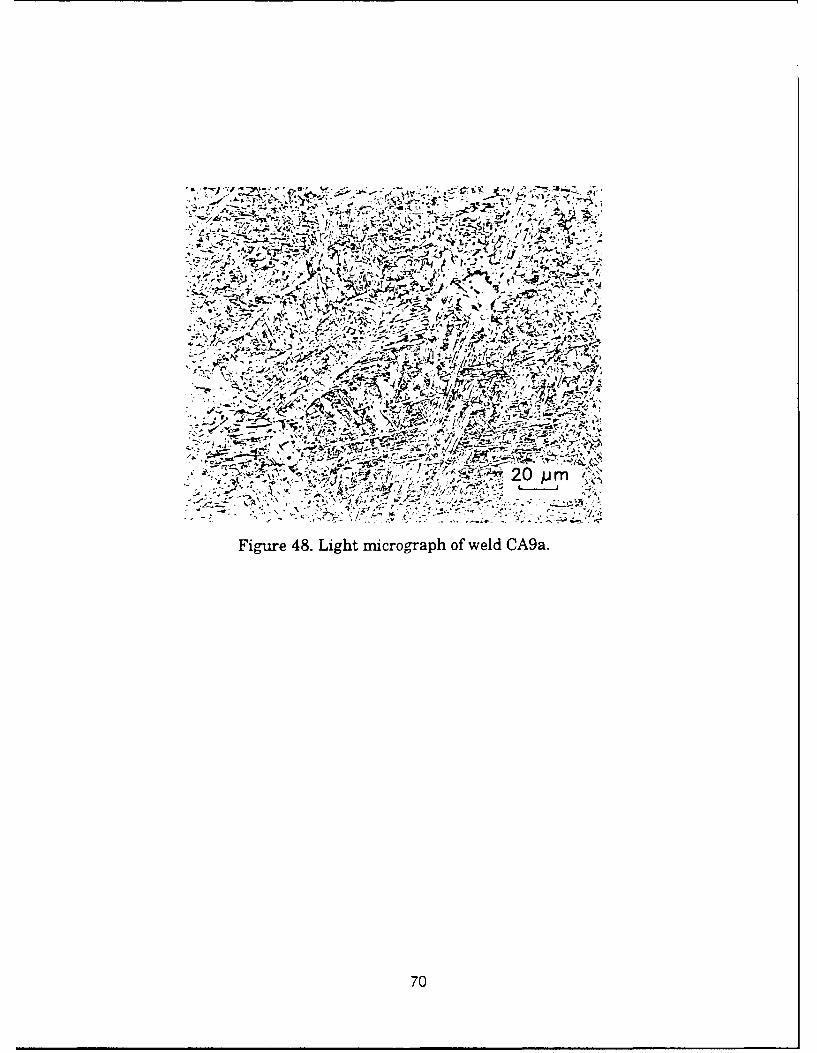
11.2.2.4. Weld Metal Microstructure
Figures 47 to 52 show a mixed microstructure of primary ferrite, AF, FS[A],FS[NA], and MAC. Overall, the microstructure is somewhat coarser than the mi-
crostructures obtained during the SA welding research, which seems to agreewith the lower alloying element content in the SMA welds. Charpy-V-notch test-ing is in progress to determine the toughness of these welds.
II 2.2.6. Weld Metal Hydrogen Determination
Diffusible hydrogen tests were conducted on all four SMA welding flux composi-
tions. Very low amounts of hydrogen were collected for electrodes AA7, CB9, andCA9, but CB2 had a slightly higher level. The results of the hydrogen tests arelisted in Table X. Diffusible hydrogen levels of less than 3 ml H 2 STP/100 g weld
68
-~q V - ..-
-' -- r-----
-r
d.I *- 3(;
20Opm 'i
Figure 48. Light micrograph of weld CA9a.
70
4 X' - *. .** - *~~a4.Vt '. _k~
A~~ V" X 2*
AP- .' - l.
kr 1. P'17' '
4M-W t..
~r - i I '(L$Pf
Figre49 Lgh microraph of wecldAt~ CA N
-- 'tg~ J4"~r'.71
41
72
5~~v t ' ,
xu %, A~"XSd
44"~
i~ V
- Ali -:'Z; ct
vS vt .
4'73
oe, I ., 11 ... $V~f i 5Sw
Fiur 52.' Ligh mirgap*fwed1
t**..74
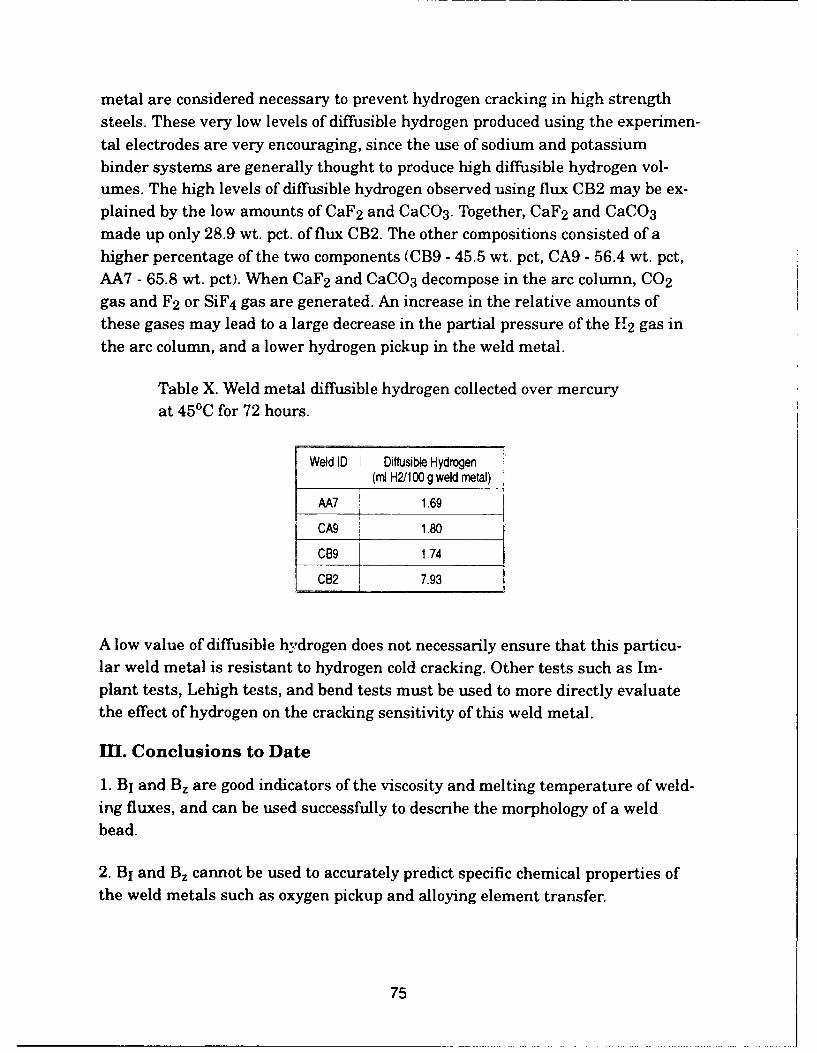
metal are considered necessary to prevent hydrogen cracking in high strength
steels. These very low levels of diffusible hydrogen produced using the experimen-
tal electrodes are very encouraging, since the use of sodium and potassiumbinder systems are generally thought to produce high diffusible hydrogen vol-umes. The high levels of diffusible hydrogen observed using flux CB2 may be ex-plained by the low amounts of CaF 2 and CaCO 3 . Together, CaF 2 and CaCO 3
made up only 28.9 wt. pct. of flux CB2. The other compositions consisted of ahigher percentage of the two components (CB9 - 45.5 wt. pct, CA9 - 56.4 wt. pct,
AA7 - 65.8 wt. pct). When CaF 2 and CaCO 3 decompose in the arc column, CO 2
gas and F 2 or SiF 4 gas are generated. An increase in the relative amounts ofthese gases may lead to a large decrease in the partial pressure of the H 2 gas inthe arc column, and a lower hydrogen pickup in the weld metal.
Table X. Weld metal diffusible hydrogen collected over mercury
at 45C for 72 hours.
Weld ID Diffusible Hydrogen1 (ml H2/1 00gweld metal)
AA7 1.69
CA9 1.80
C9 1.74
CB2 7.93
A low value of diffusible hydrogen does not necessarily ensure that this particu-lar weld metal is resistant to hydrogen cold cracking. Other tests such as Im-plant tests, Lehigh tests, and bend tests must be used to more directly evaluatethe effect of hydrogen on the cracking sensitivity of this weld metal.
M. Conclusions to Date
1. BI and B, are good indicators of the viscosity and melting temperature of weld-ing fluxes, and can be used successfully to describe the morphology of a weld
bead.
2. BI and B, cannot be used to accurately predict specific chemical properties of
the weld metals such as oxygen pickup and alloying element transfer.
75
3. Similar to low carbon structural steel weld metal microstructures, the finalweld metal microstructure of a high strength steel is largely determined by oxy-
gen content.
4. In high strength steel weld metal, as weld metal oxygen content increases, the
amount of acicular ferrite decreases while ferrite with second phase aligned in-
creases.
5. Weld metal toughness increases with decreasing oxygen and increasing acicu-
lar ferrite.
6. To obtain adequate microstructure (high AF/FS[A] ratio) and Charpy impact
toughness, the flux for welding a high strength steel must limit the weld metal
oxygen content between 300 to 400 ppm.
7. Using the SA welding results, SMA welding electrodes have been extruded and
welded with successfully, producing good quality welds.
8. The experimental SMA welding electrodes produced extremely low diffusible
hydrogen contents, less than 2 ml/100g of weld metal.
IV. On-Going Tasks
1. Alloy additions will be made to the SMA welding flux to increase the strengthlevels and refine the microstructure.
2. Charpy impact specimens will be used to evaluate the toughness of the welds
and the success of the alloying additions.
3. Interstitial oxygen, nitrogen, carbon, and sulfur analysis will be conducted.
4. Quantitative metallography will be performed to evaluate the percentage of
the different microstructural components observed.
5. Modifications of the flux coating will be made to enhance the performance of
the experimental electrodes in out-of-position welding.
6. A slag analysis will be conducted to define a relationship between flux composi-
tion and weld metal alloy content.
76
7. Multiple-pass welding will be used to generate full size Charpy specimens andsub-size tensile specimens. This will allow impact data from this study to be re-
lated to other studies.
8. Additional funding is requested to continue this unique research. A more fun-damental understanding of the relationships between SA and SMA welding
fluxes and a basic understanding concerning the role which individual slag ingre-dients play in protecting the weld pool are badly needed if consumables develop-ment for high strength steels are ever to escape the regime of "cut and try" em-
piricism.
V. Acknowledgment
The authors gratefully acknowledgment the research support of the Office of Na-val Research and David Taylor Research Center.
VI. References
1. G. R. Edwards and S. Liu. "Shielded Metal Arc Welding Consumables for an
Advanced High Strength Steel", CSM Report MT-CWR-091-006, 1991.
2. 1IW. "Guide to the Light Microscope Examination of Ferritic Steel Weld Met-
als", I1W DOC IX-1533-88, 1988.
3. J. Zeke. "Recommendation for Expressing the Flux Basicity by means of theOxygen Anion Ionic Fraction", I1W DOC XII-803-83, 1983.
4. B. Chew. "Moisture Loss and Regain by Some Basic Flux Covered Electrodes",Welding Journal 55(8):629, 1976.
6. AWS. "Standard Methods for Determination of the Diffusible Hydrogen ofMartensitic, Bainitic, and Ferritic Steel Weld Metal produced by Arc Welding",
AWS A4.3.86, 1986.
77
VII. Research Personnel
Dr. Glen R. Edwards - Co-Principal Investigator
Dr. Stephen Liu - Co-Principal Investigator
Mr. G. L. Fredrickson - M.S. Candidate (Conclusion: 04/1992)
Mr. M. Q. Johnson - M.S. Candidate
VIII. Related Publications and Presentations
1) G. L. Fredrickson, S. Liu, and G. R. Edwards. "An Investigation of SMAW Con-
sumables Development for HSLA-130 Steel", presented at the 1991 AWS Welding
Conference, Detroit, Michigan.
2) G. L. Fredrickson, M. Q. Johnson, S., Liu, and G. R. Edwards. "An Investiga-
tion of SMAW Consumables Development for HSLA-130 Steel", to be presentedat the 1992 AWS Welding Conference in Chicago, Illinois.
3) M. Q. Johnson, G. L. Fredrickson, S. Liu, and G. R. Edwards. "Consumable De-
velopment for Advanced High Strength Steels", to be presented at the 1992 Inter-
national Conference on Trends in Welding Research, Gatlinburg, Tennessee.
78
List of Figures
Figure 1. Weld bead width plotted as a function of the Zeke basicity index, B,.
Figure 2. Weld bead width plotted as a function of basicity index, B1.
Figure 3. Weld bead depth plotted as a function of basicity index, B1.
Figure 4. Bead morphology of weld HAA7. (a) Smooth ripple pattern with goodbead-to-plate transition; (b) Uniform cross section of the weld bead.
Figure 5. Bead morphology of weld HAA1. (a) Irregular ripple pattern with roughbead-to-plate transition; (b) Non-uniform cross section of the weld bead.
Figure 6. Weld metal oxygen content plotted as a function of the flux oxygen con-tent.
Figure 7. Weld metal oxygen content plotted as a function of the amount of oxy-gen from CaCO3 in the flux.
Figure 8. Weld metal oxygen content plotted as a function of the amount of oxy-gen from K2SiO3 in the flux.
Figure 9. Weld metal oxygen content plotted as a fanction of the amount of oxy-gen from SiO2 in the flux.
Figure 10. Oxygen content in HSLA- 100 steel welds versus oxygen content inAISI 1018 steel welds.
Figure 11. Weld metal oxygen content plotted as a function of the Zeke basicityindex, Bz.
Figure 12. Weld metal oxygen content plotted as a function of basicity index, B1.
Figure 13. Weld metal manganese content plotted as a function of weld metal oxy-gen content.
Figure 14. Weld metal silicon content plotted as a function of weld metal oxygencontent.
79
Figure 15. Weld metal phosphorus content plotted as a function of weld metal
oxygen content.
Figure 16. Weld metal Pcm plotted as a function of weld metal oxygen content.
Figure 17. Weld metal Brinell hardness plotted as a function of weld metal Pcm.
Figure 18. Weld metal Brinell hardness plotted as a function of weld metal oxy-
gen content.
Figure 19. Light micrograph of weld HAA3.
Figure 20. Light micrograph of weld HAA7.
Figure 21. Light nicrograph of weld HAB3.
Figure 22. Light micrograph of weld HAB7.
Figure 23. Light micrograph of weld HCA2.
Figure 24. Light micrograph of weld HCA7.
Figure 25. Light micrograph of weld HCB2.
Figure 26. Light micrograph of weld HCB7.
Figure 27. Light micrograph of HSLA-100 steel showing the martensitic-bainitic
microstructure.
Figure 28. Light micrograph of weld HOP made using the Oerlkon OP121TT
welding flux.
Figure 29. Volume fraction of acicul ar ferrite in HSLA- 100 steel weld metal plot-
ted as a function of weld metal oxygen content.
Figure 30. Volume fraction of acicular ferrite in AISI 1018 steel weld metal plot-
ted as a function of weld metal oxygen content.
80
Figure 31. Volume fraction of ferrite with second phase aligned plotted as a func-
tion of weld metal oxygen content in the HSLA- 100 steel welds.
Figure 32. Volume fraction of ferrite with second phase aligned plotted as a func-
tion of weld metal oxygen content in the AISI 1018 steel welds.
Figure 33. Volume fraction of ferrite with second phase aligned plotted as a func-
tion of the amount of acicular ferrite in the HSLA- 100 steel weld metals.
Figure 34. Volume fraction of ferrite with second phase aligned plotted as a func-
tion of the amount of acicular ferrite in the AISI 1018 steel weld metals.
Figure 35. Charpy-V-notch impact toughness plotted as a function of the weld
metal oxygen content.
Figure 36. Charpy-V-notch impact toughness plotted ss a function of the weldmetal acicular ferrite content.
Figure 37. Charpy-V-notch impact toughness plotted as a function of the weld
metal Pcm value.
Figure 38. Charpy-V-notch impact toughness plotted as a function of the flux
basicity index, BI.
Figure 39. Charpy-V-notch impact toughness plotted as a function of the Zekebasicity index, Bz.
Figure 40. Experimental apparatus for the determination of electrode coati-Ig
moisture content.
Figure 41. Automatic shielded metal arc welding equipment setup.
Figure 42. Experimental apparatus for the determination of diffusible hydrogen.