36
Business Data Analytics Marlon Dumas and Anna Leontjeva FirstName . LastName @ ut.ee MTAT.03.319 Lecture 1: Introduction
Business Data Analytics
Marlon Dumas and Anna Leontjeva
FirstName . LastName @ ut.ee
MTAT.03.319
Lecture 1: Introduction

Your background
Your expectations
Warm-up question
• We are a charity. We have a database containing 100K donors who have not donated in the past 12 months. We know their basic demographics, address and how much they have donated in past (and when). We do not have emails.
• Sending a mail asking for donation costs 60 cents/piece. When we mail out, the average donation comes at about 80 cents.
• Should we send a (postal) mail to all 100K donors?

What is Business (Data) Analytics?
Business Analysisvs
Business (Data) Analytics

Data Decision Objective
Business Data Analytics
The application of repeatable methods to use data in order to inform or make decisions
to achieve or maximize a business objective

Business Intelligencevs
Business (Data) Analytics

Business Intelligence vs. Analytics
• Do 18-30 y.o. male customers living in cities of 50K+ inhabitants buy more of product X than others?
• In which zip codes have the sales of product X increased the most in the months of June-July?
• If a customer buys product X, which other products might he/she buy?
• Are customers whose number of calls in the past 3 months is lower than the 12-months average more likely to churn in the next 6 months?
• Which customers are most likely to buy product X?
• How much will we sell of product X in each zip code next month?
• For each customer, which product are they most likely to buy given their current shopping cart?
• ???

Typical classes of analytics questions
• Clustering: Which objects belong together/are similar?
• Classification: Who likes X? Who will do X? …
• Regression: How much will X spend/buy/earn/donate …?
• Censored regression: How much will X spend/buy/earn/donate… knowing that they might not spend/buy/earn/donate at all…
• Forecasting: What will be the price/cost of X in future? What will be the average expenditure/income, etc. of a population in future?
• …

Business Intelligence vs. Analytics
Data collection & preparation
(manual/auto)
Hypothesis generation
(manual)
Hypothesis validation(manual)
Decision
(manual)Action
Data collection & preparation
(auto)
Decision Model
Construction
(auto)
Action
Group Exercise
• I am a marketing manager in a company that sells organic products online. Ihave demographic and purchasing data about every single customer - every single purchase they’ve made, every single visit to our web site, durations, pages visited, clicks they’ve made to our past email campaigns, etc.
• I can send 100K Christmas electronic flyers via email next month. My flyer design team offers me to produce up to six different flyers. I can choose the products included in each flyer and the layout of the products.
• I want to maximize the revenue resulting from this campaign. I don’t care about stock right now – assume we have infinite amounts of every product.
• I am fortunate enough to have a data analyst “guru” for one week. What should I ask him for?
• Approach this question using data analysis vs. data analytics?

Types of Business Analytics
Descriptive Predictive Prescriptive
What has happened?E.g. what top five
customer segments we have?Which pairs of products
are bought together?
What will happen?E.g. Who will buy?
Who will churn?
What to do to achieve my goals?When should I make my next
customer call, to whom and what should I tell them?

Other terms• Business Intelligence
• Dashboard and report extraction from enterprise databases for monitoring, data exploration and hypothesis validation
• (Statistical) Data Analysis
• Very useful for exploration & hypothesis validation; works with “small data”; driven by models
• Data Mining: Extracting patterns from data automatically
• Business analytics applies data mining to business problems
• Machine learning
• The algorithms behind data mining
• Data Science
• Catch-all term for data analysis, analytics, mining, machine learning, deep learning, Big Data processing, and other techniques

When & where to usebusiness analytics?

Business problems
CRM BRMBPM
Customer Relationship Management
Business Process
Management
Business Risk
Management

Application Areas of Business Analytics
CRM BRMBPM and ERP
Customer Relationship Management
Business Process Management & Enterprise
Resource Planning
Business Risk
Management
Marketing Sales, Customer Lifecycle Management (CLM)
Risk management Underwriting
Process optimization Inventory management, HR/Talent management, Facilities management

Customer segmentation:
Behavioral
Product/category based
Brand based
Customer Lifecycle Management
AcquisitionRetentionWin-back
Product Recommendations
BA in CRM
Up sell Cross sellNext sell
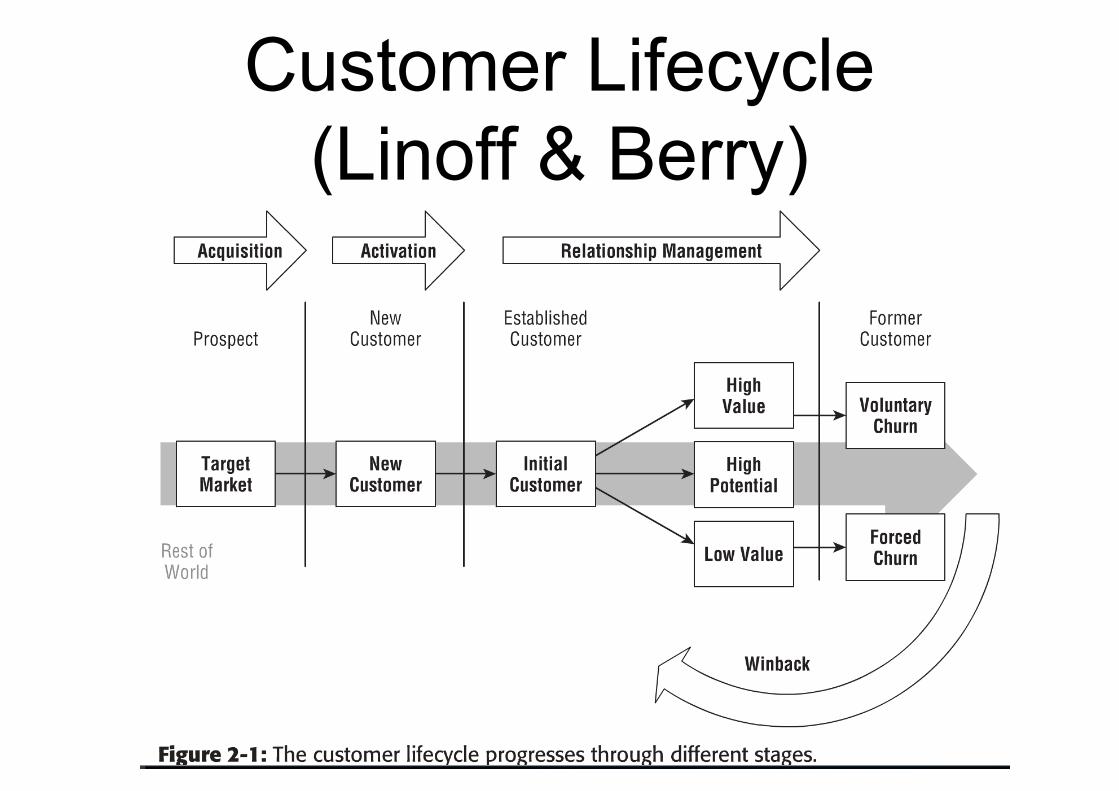
Customer Lifecycle(Linoff & Berry)

BA in BPM• Discover how a process is actually executed
• Including deviations with respect to how it should be done
• Identify root causes of poor process performance
• E.g. customer complains, defects, rework, delays, etc.
• Predict that a given execution of a process will end up in an undesirable outcome
• E.g. predict delays at runtime, before they happen

BA in BRM
Strategic and compliance
Financial and operational
industry changes?economic stability
merger and acquisition activity
recruitmentsupply chain
fraud detectioninvestments, portfolio
credit scoring
How business analytics works?
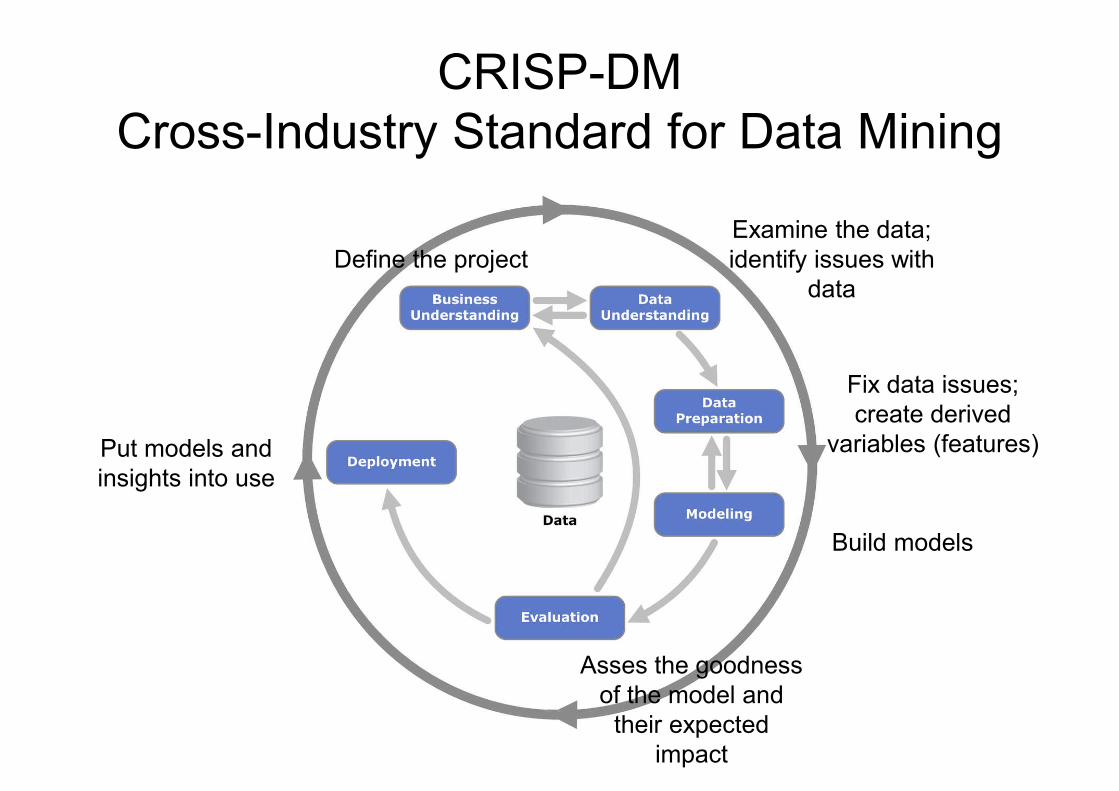
CRISP-DMCross-Industry Standard for Data Mining
Define the projectExamine the data; identify issues with
data
Fix data issues; create derived
variables (features)
Build models
Asses the goodness of the model and
their expected impact
Put models and insights into use
Who is involved?
• Business sponsor
• Domain expert(s)
• Analytics expert
• Data steward & database expert

Business understanding
• Define the business objective
• Formulate the question(s)
• Identify target variable
• Identify unit of analysis
• Identify attributes (also called features)
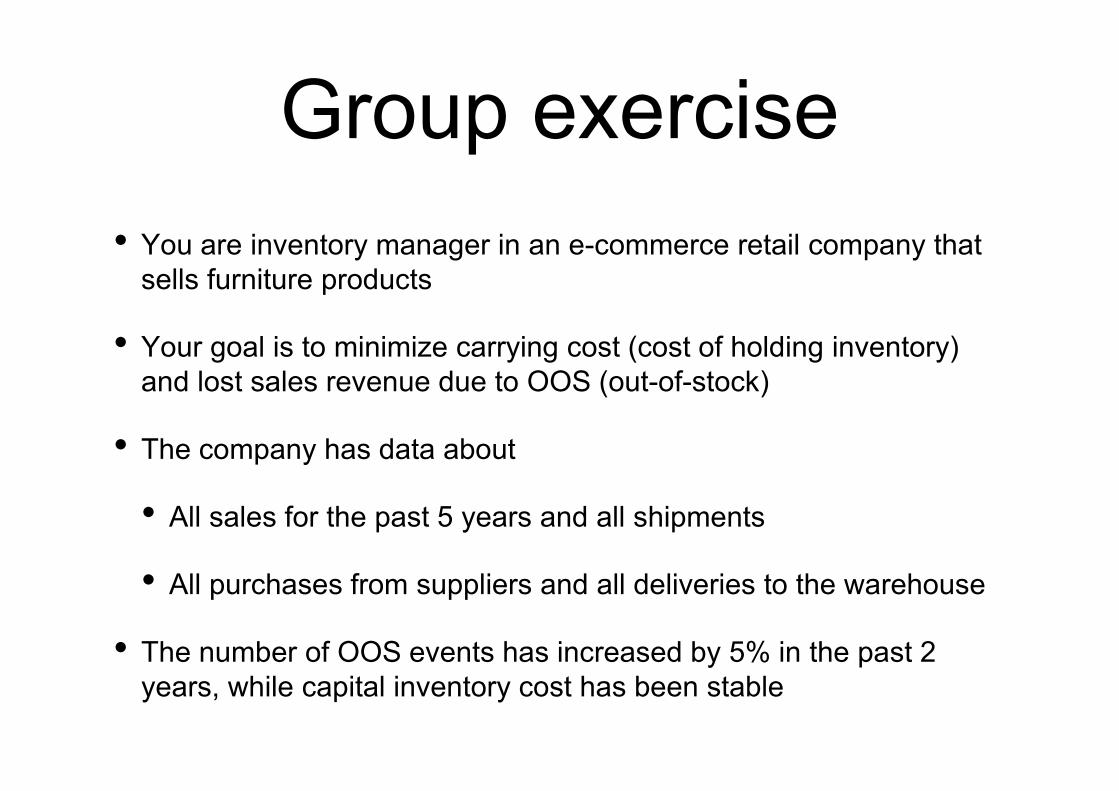
Group exercise
• You are inventory manager in an e-commerce retail company that sells furniture products
• Your goal is to minimize carrying cost (cost of holding inventory) and lost sales revenue due to OOS (out-of-stock)
• The company has data about
• All sales for the past 5 years and all shipments
• All purchases from suppliers and all deliveries to the warehouse
• The number of OOS events has increased by 5% in the past 2 years, while capital inventory cost has been stable
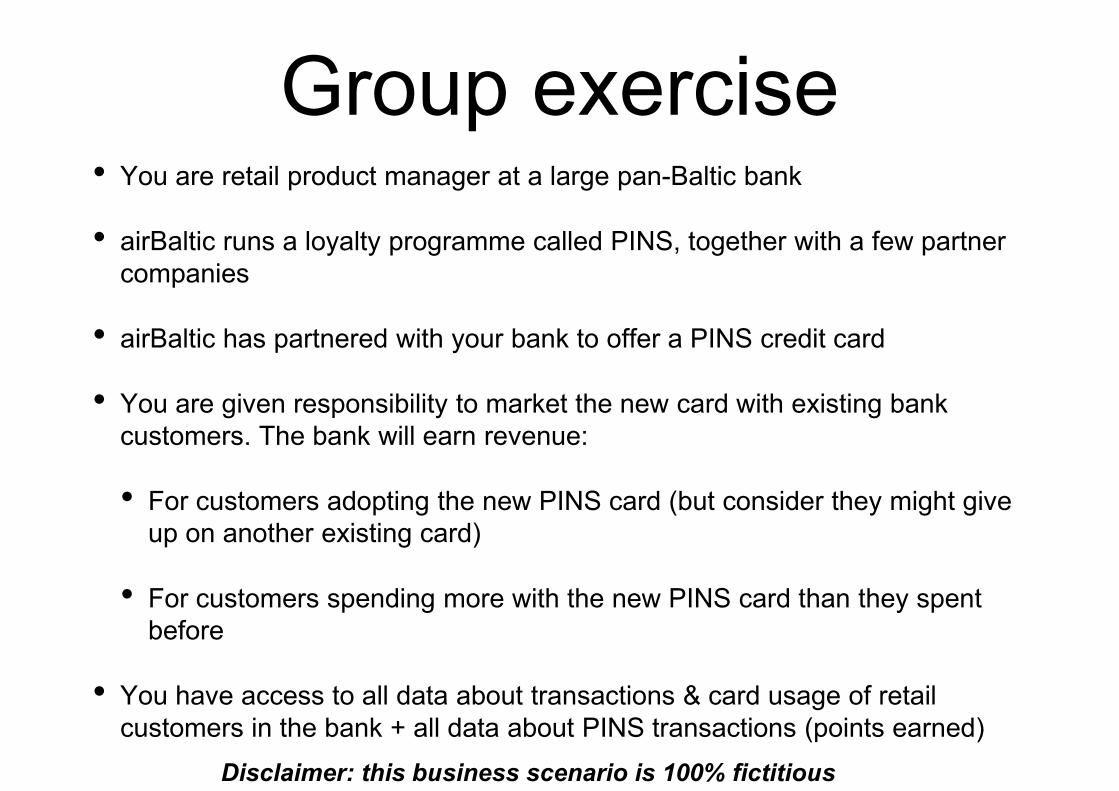
Group exercise• You are retail product manager at a large pan-Baltic bank
• airBaltic runs a loyalty programme called PINS, together with a few partner companies
• airBaltic has partnered with your bank to offer a PINS credit card
• You are given responsibility to market the new card with existing bank customers. The bank will earn revenue:
• For customers adopting the new PINS card (but consider they might give up on another existing card)
• For customers spending more with the new PINS card than they spent before
• You have access to all data about transactions & card usage of retail customers in the bank + all data about PINS transactions (points earned)
Disclaimer: this business scenario is 100% fictitious
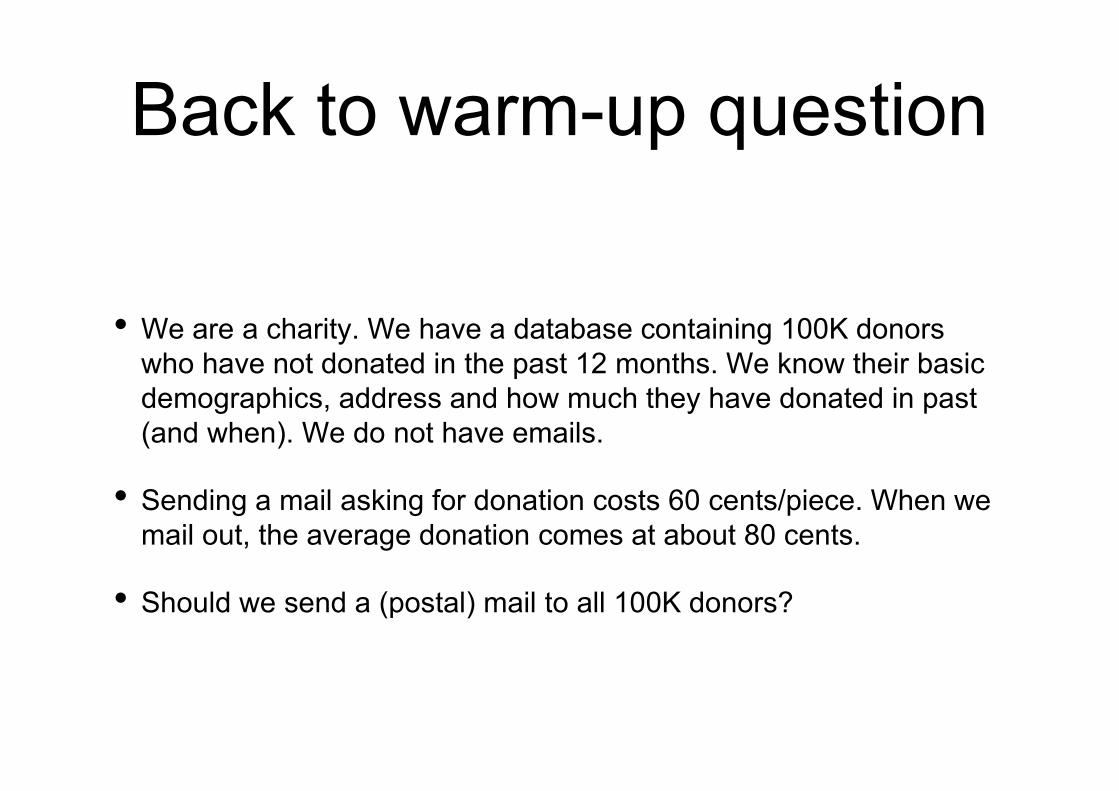
Back to warm-up question
• We are a charity. We have a database containing 100K donors who have not donated in the past 12 months. We know their basic demographics, address and how much they have donated in past (and when). We do not have emails.
• Sending a mail asking for donation costs 60 cents/piece. When we mail out, the average donation comes at about 80 cents.
• Should we send a (postal) mail to all 100K donors?

CRISP-DM & Course Structure
Lecture 1
Lecture 2
Lecture 3
Lectures 4-8
SIDH Datathon&
Your professional practice

Lecture Topics
1. Introduction (today)
2. Tools: descriptive analysis and visualization
3. Customer segmentation
4. Customer Lifecycle Management (CLM) - regression
5. CLM - classification problems
6. CLM - Cross-selling & up-selling recommendations
7. A/B testing in marketing
8. Time-series for investment portfolio management
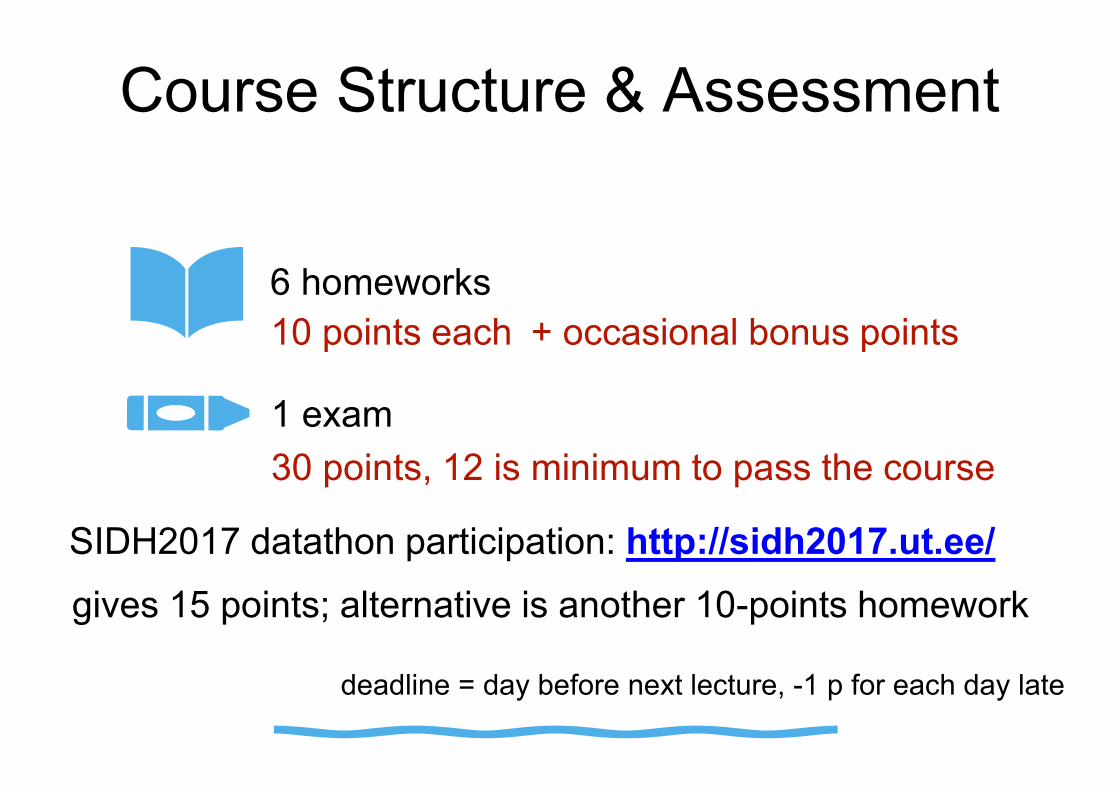
Course Structure & Assessment
1 exam
SIDH2017 datathon participation: http://sidh2017.ut.ee/
6 homeworks
10 points each + occasional bonus points
30 points, 12 is minimum to pass the course
deadline = day before next lecture, -1 p for each day late
gives 15 points; alternative is another 10-points homework

Course information
all the relevant information appears on courses webpage:
https://courses.cs.ut.ee/2017/bda/
Warm-up homework (no points, no submission)
https://courses.cs.ut.ee/2017/bda/fall/Main/Homework0

R
https://www.r-project.org/about.html
R is a language and environment for statistical computing and graphics.
R is an open source.

is a graphical development environment
https://www.rstudio.com/

RStudiohttps://www.rstudio.com/
Image from: http://r4ds.had.co.nz/
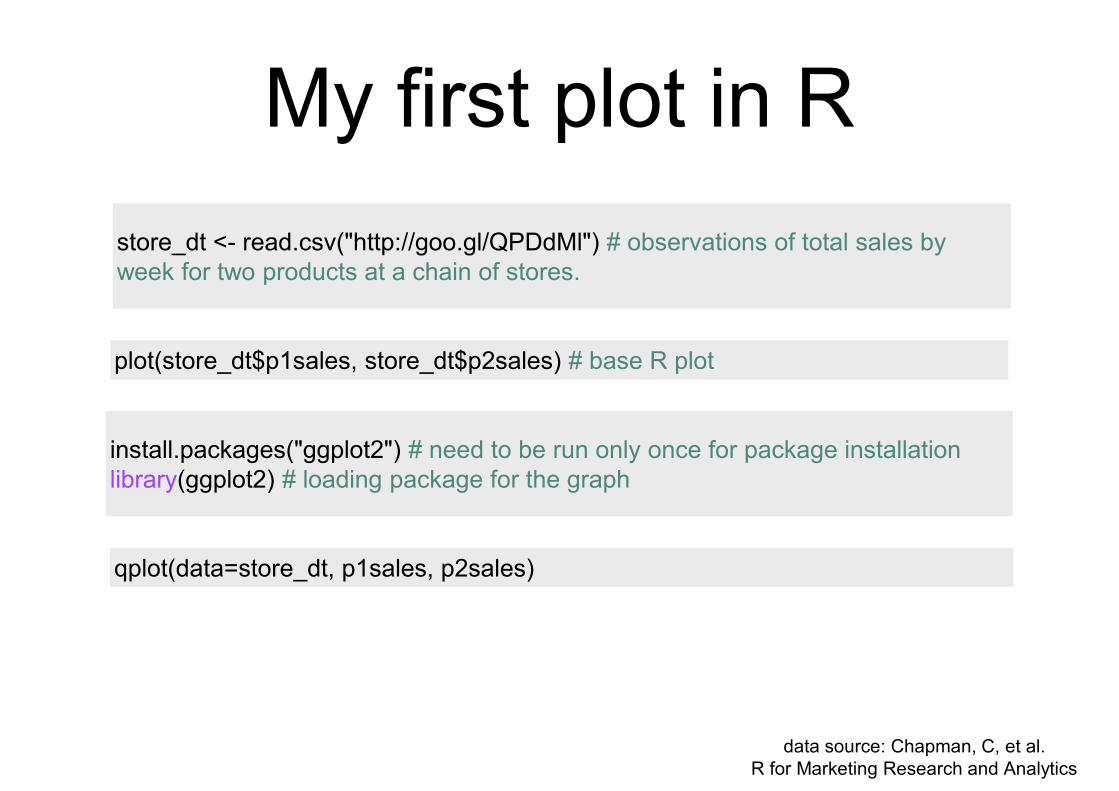
My first plot in R
qplot(data=store_dt, p1sales, p2sales)
store_dt <- read.csv("http://goo.gl/QPDdMl") # observations of total sales by week for two products at a chain of stores.
plot(store_dt$p1sales, store_dt$p2sales) # base R plot
install.packages("ggplot2") # need to be run only once for package installationlibrary(ggplot2) # loading package for the graph
data source: Chapman, C, et al. R for Marketing Research and Analytics

Homework
See course Web pageNo points given, nothing to submit, it’s for you to prepare!


