17
MTN Group Limited – A growth strategy Phuthuma Nhleko Group President and CEO

MTN Group Limited– A growth strategy
Phuthuma NhlekoGroup President and CEO
The emerging market opportunity
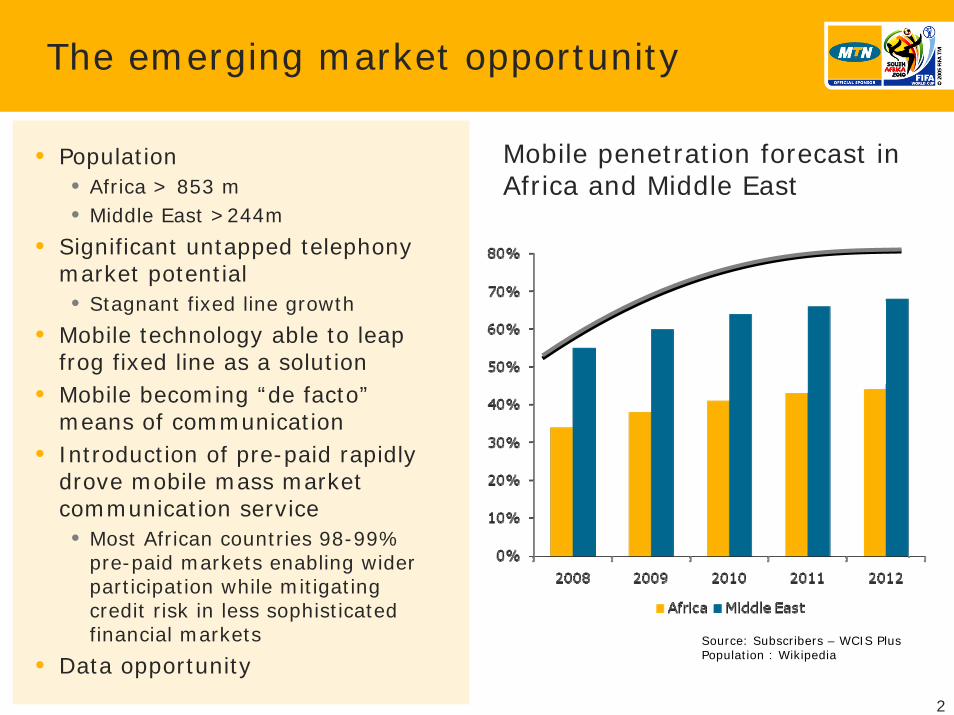
• Population • Africa > 853 m• Middle East >244m
• Significant untapped telephony market potential• Stagnant fixed line growth
• Mobile technology able to leap frog fixed line as a solution
• Mobile becoming “de facto”means of communication
• Introduction of pre-paid rapidly drove mobile mass market communication service• Most African countries 98-99%
pre-paid markets enabling wider participation while mitigating credit risk in less sophisticated financial markets
• Data opportunity
Mobile penetration forecast in Africa and Middle East
Source: Subscribers – WCIS PlusPopulation : Wikipedia
2

MTN’s opportunity
IranMarket size 52,5mMarket share 32%Penetration 50%GDP/capita 5,247
Cote d’IvoireMarket size 7.8mMarket share 40%Penetration 36%GDP/capita 1,250
UgandaMarket Size 14,9mMarket share 50%Penetration 19%GDP/capita 469
NigeriaMarket size 80mMarket share 43%Penetration 31%GDP/capita 1,490
CameroonMarket size 7.5mMarket share 60%Penetration 30%GDP/capita 1,290
South AfricaMarket Size 56mMarket share 36%Penetration 89%GDP/capita 6,170
GhanaMarket size 15,2mMarket share 52%Penetration 42%GDP/capita 786
MENAWECA
SEA
SyriaMarket size 11,7mMarket share 46%Penetration 38%GDP/capita 2,238
SudanMarket size 18,3mMarket share 25%Penetration 22%GDP/capita 1,631
AfghanistanMarket size 13mMarket share 29%Penetration 18%GDP/capita 457
Date : Sep 08Source GDP : IMF 2008 estimate
Group subscribers
80,736
Group ARPU$14
Population516.5m
Weightedaverage
penetration38.2%
3
Only key ops detailed

4
Building blocks of the growth strategy
To be the leader in telecommunications in emerging markets
Increased competitiveness
Execution excellence
ConsolidationLeverage existing footprint Convergence
Best practice Procurement synergies
Value proposition
Hub and cluster Diversification Skills
optimisation Brand
5
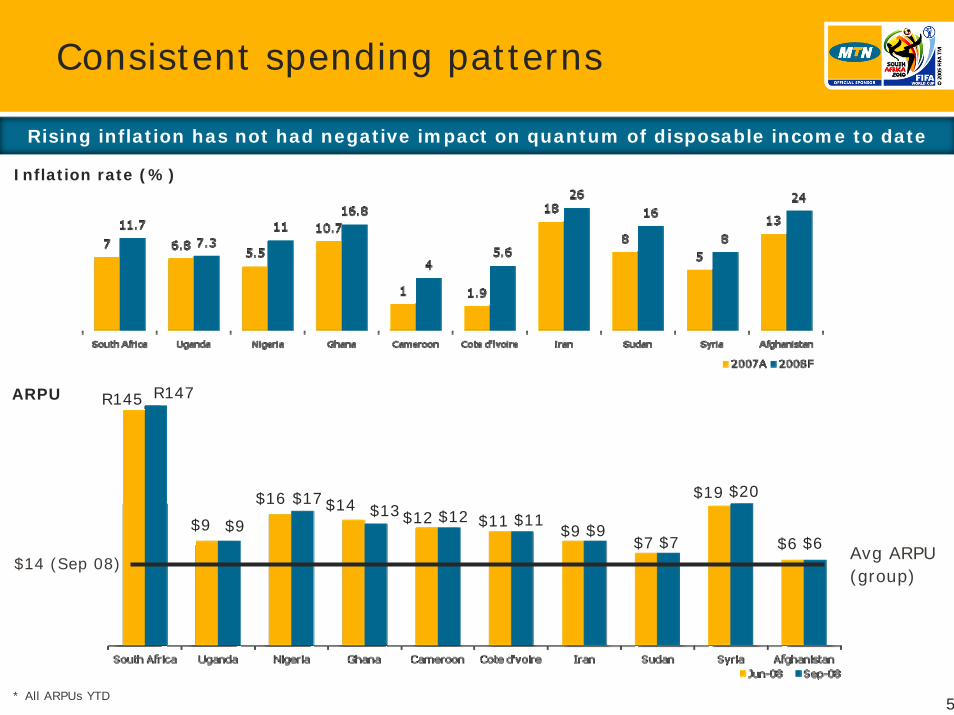
Consistent spending patterns
Avg ARPU (group)
$14 (Sep 08)
Rising inflation has not had negative impact on quantum of disposable income to date
R145 R147
$9
* All ARPUs YTD
Inflation rate (%)
$9
$16 $17 $14 $13$12 $12 $11 $11$9 $9
$19 $20
$7 $7 $6 $6
ARPU

6
FX backdrop
Exchange rates LC: USD

Well positioned
South Africa Uganda Nigeria Ghana Cameroon Cote
d’lvoire Iran Sudan Syria Afghani-stan
No of National
GSM operators
3 5 4 6 3 4 2 3 2 4
To launch - 1 1 2 - - 1 - 1 -
Market position 2 1 1 1 1 1 2 3 2 3
Market share
(Jun 08)36% 50% 43% 52% 60% 40% 32% 25% 46% 29%
Other ISP’sWimax CDMA
operator
CDMA operators
Fixed line & ISP’s
Fixed line and
CDMA
Fixed line & ISP’s
Strong fixed line
CDMA operators -BOT CDMA
operators
Well positioned in an increasing competitive environment
7

10,87710,877
Investing for growth
Investing to take advantage of the large market potential
9,7649,764
7,2127,212
5,2535,253
Capex spend in period
8
• Significant network infrastructure spend
• H1 spend represents 40% of ZAR25bn target for 2008 in line with 2007 H1 spend
• USD 3bn committed at Jun 08, including accelerated approvals for H1 2009 network capex
• 2006 marginal capex / subscriber impacted by Investcom acquisition
• 2008 capex spend in ZAR influenced by changes in fx rates (2008 target of ZAR25bn estimated at average fx rate of 7.22)
• Capex 2009 still under review
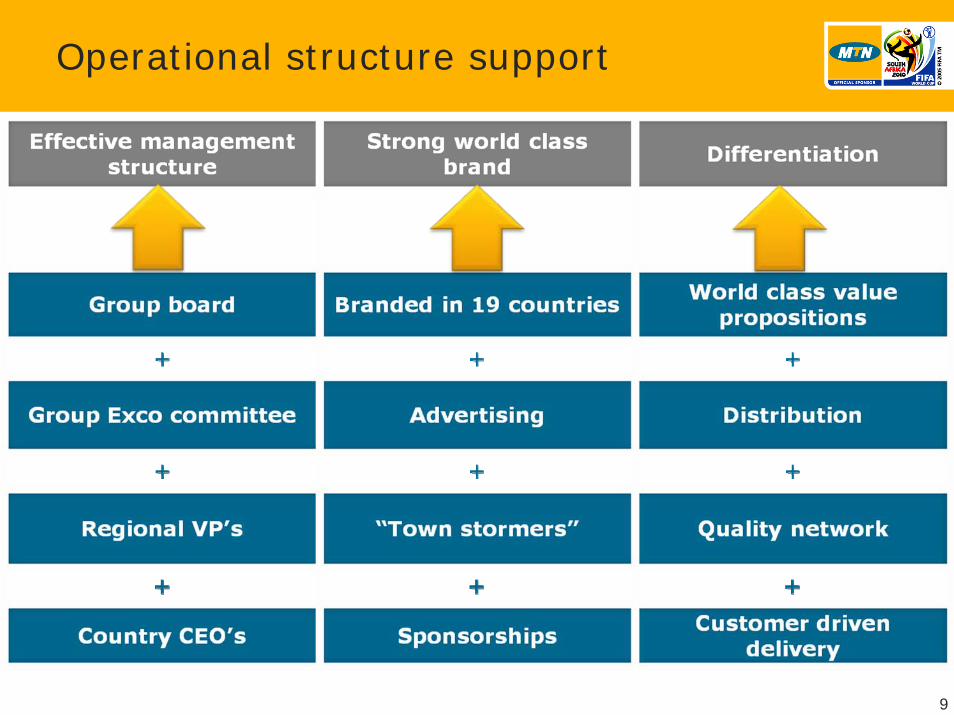
Operational structure support
9

Integrated service provision
• South Africa• Data as a % revenue – 12% (Jun08)
• Improved data propositions
• Purchase of Verizon (subject to CC approval)
• Nigeria• Data as a % of revenue -3% (Jun08)
• Renewed focus on leveraging VGC and XS Broadband
• Mobile TV
• Ghana• Launch of Blackberry
• Extensive Edge deployment
• Iran • Data as a % of revenue -8%
• SMS 93% of data revenue
• VAS launched
10
Positioning ourselves as an integrated service provider
Data RevenueZAR (million)
As % of revenue 4.9% 5.1% 5.9% 6.4%

Managing risks
11

Portfolio management
MTN Group
Total(Revenue ZAR million)
*** difference in HO companies* 9 months* 6 months
Increased diversification
51 595
12
15%15%
42%42%
46 128
16%16%
46%46%
38%38%43%43%
7%7%
41%41%
51%51%
40%40%
60%60%
19 405 23 73027 212
66%66%
34%34%32%32%
70%70%
73 417
MENA

Margin managment
EBITDA Contribution % EBITDA Margin %
Difference in HQ companiesComparatives June to June
2007SEA
2007
2007WECA
2008
2007MENA
2008
2007*MTN Group
2008
100
100
8
11
54
34
57
30
44.4
42.6
25.4
54.2
35.5
29.5
52.9
33.5
13

Other considerations
•World recession
•Economic slowdown in Africa and ME
•Slowing GDP growth although still positive
•Impact of oil and commodity prices
•Access to funding
•Balance sheet structure
•Local funding
•No material re-financing
•Strong cash flows
•Governance
•JSE / King code
•Management stability
14
Global backdrop MTN

15
Looking forward…

Thank you
Questions

© 2008 Mobile Telephone Networks. All rights reserved.17
Notice
The information contained in this document has not been verified independently. No representation or warranty express or implied is made as to and no reliance should be placed on the fairness, accuracy, completeness or correctness of the information or opinions contained herein. Opinions and forward looking statements expressed represent those of the Company at the time. Undue reliance should not be placed on such statements and opinions because by nature, they are subjective to known and unknown risk and uncertainties and can be affected by other factors that could cause actual results and Company plans and objectives to differ materially from those expressed or implied in the forward looking statements.
Neither the Company nor any of its respective affiliates, advisors or representatives shall have any liability whatsoever (based on negligence or otherwise) for any loss howsoever arising from any use of this presentation or its contents or otherwise arising in connection with this presentation and do not undertake to publicly update or revise any of its opinions or forward looking statements whether to reflect new information or future events or circumstances otherwise.
This presentation does not constitute an offer or invitation to purchase or subscribe for any securities and no part of it shall form the basis of or be relied upon in connection with any contract or commitment whatsoever.


