216
Annual Report and Accounts 2016 For the year ended 30 September 2016 Lonmin Plc MUCH ACHIEVED WELL REPOSITIONED
Lonmin P
lcA
nnual Report and A
ccounts for the year ended 30 Septem
ber 2016
www.lonmin.com
Lonmin PlcRegistered in England, Company Number 103002Registered Office: 4 Grosvenor Place, London SW1X 7YL
Annual Report and Accounts 2016For the year ended 30 September 2016
Lonmin Plc
MUCH ACHIEVEDWELL REPOSITIONED
See further information at www.lonmin.com
LONMIN HAS BEEN CHALLENGED MANY TIMES IN OUR
HISTORY, AND EACH TIME WE HAVE SEIZED THE
OPPORTUNITIES THOSE CHALLENGES HAVE PRESENTED.
Lonmin is a primary producer of Platinum Group Metals (PGMs).These metals are essential for many industrial applications,especially catalytic converters for internal combustion engineemissions, as well as their widespread use in jewellery andinvestment. Saleable by-products produced from our PGMmining include gold, copper, nickel, chrome and cobalt.
Our core operations, consisting of 11 shafts and inclines, are situated in theBushveld Igneous Complex in South Africa, a country which hosts nearly 80%of global PGM resources. We have been granted a New Order Mining Licenceby the South African government for our core operations, which runs to 2037and is renewable to 2067. We have resources of 181 million troy ounces(3PGE + Au) and 32 million ounces (3PGE + Au) of reserves.
www.lonmin.com
Lonmin PlcAnnual Report and Accounts 2016
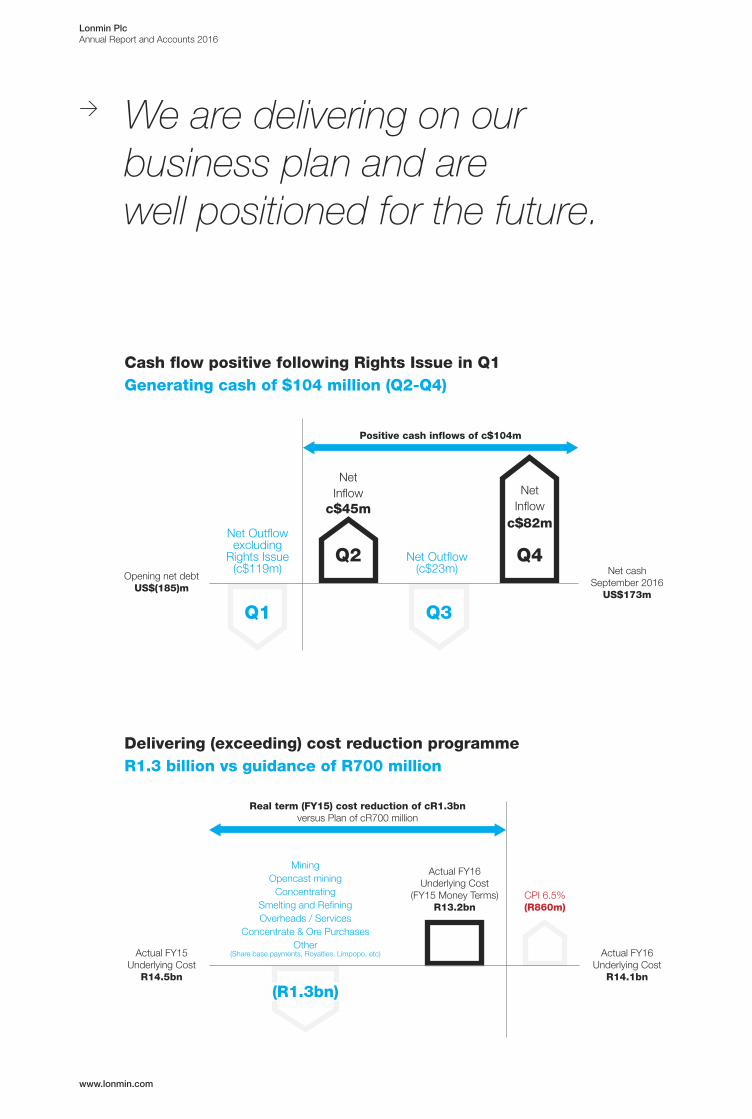
> We are delivering on ourbusiness plan and arewell positioned for the future.
Cash flow positive following Rights Issue in Q1Generating cash of $104 million (Q2-Q4)
Q2 Q4
Q1 Q3
Net Outflowexcluding
Rights Issue(c$119m)
Net Outflow(c$23m)
NetInflow
c$45mNet
Inflowc$82m
Net cashSeptember 2016
US$173m
Opening net debtUS$(185)m
Positive cash inflows of c$104m
Delivering (exceeding) cost reduction programmeR1.3 billion vs guidance of R700 million
(R1.3bn)
MiningOpencast mining
ConcentratingSmelting and RefiningOverheads / Services
Concentrate & Ore PurchasesOther
(Share base payments, Royalties, Limpopo, etc)
CPI 6.5%(R860m)
Actual FY16Underlying Cost
(FY15 Money Terms)R13.2bn
Actual FY16Underlying Cost
R14.1bn
Actual FY15Underlying Cost
R14.5bn
Real term (FY15) cost reduction of cR1.3bnversus Plan of cR700 million

Lonmin PlcAnnual Report and Accounts 2016
01 Underground locomotives have been fitted with anti-collision detection devices providing earlywarning of oncoming locomotives.
02 Underground employees are supplied with proximity detection devices providing early warningfor people and vehicles.
03 Ongoing innovation in the Processing Division was the foundation for the conceptualisation,construction and successful commissioning of the Other Precious Metals (OPM) plant at thePrecious Metals Refinery, which uses the latest third generation technology for improvedRhodium and Iridium recoveries. The OPM contributed to additional release of 25,280 ouncesof Rhodium and 13,068 ounces of Iridium.
Our belief is that Zero Harm is possible and ouraim is to provide a safe working environment forall of our employees, our contractors and thecommunities we operate in.
Our goal is for every person in the business tohave a personal understanding of, and respectfor, the importance of safety in the workplacethrough entrenching safety principles, increasingvisibility on fatality and injury prevention andencouraging a safe high performance culture.Zero Harm can be achieved if the risks that leadto serious or fatal accidents are managedconsistently – we need to reach our productiontargets to sustain the Company and our families,but safety always comes first.
> Safety comes first in everything we do…


Lonmin PlcAnnual Report and Accounts 2016
Our initiatives around employeewellness, financial literacy andcounselling as well as the technicalsolutions around debottleneckinglogistics continue to bear fruit. Likemost things, it is a journey, and one we cannot lose focus on if we are tosucceed for you, our shareholdersand indeed all our stakeholders.
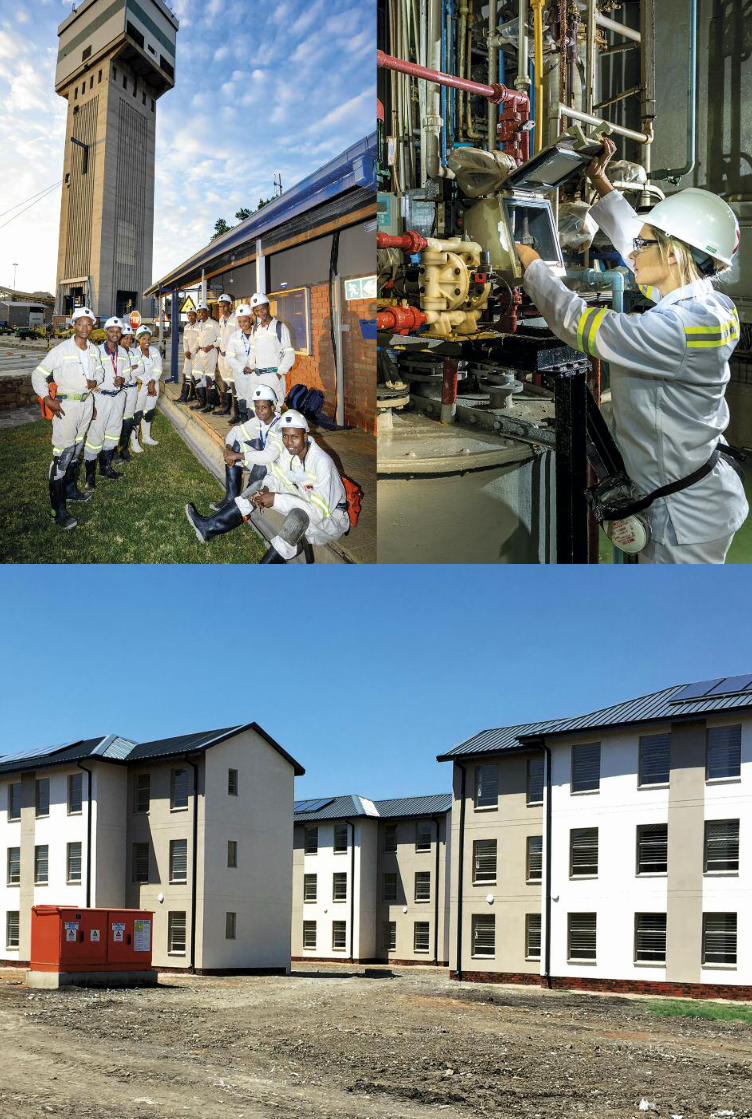
> Working better together. Improving relationships. … Building trust
01 Lonmin’s bursar students receive mining orientation at the Vulindlela Training Centre.
02 Removing a sample from the palladium circuit in the Primary Separation Departmentat the Precious Metal Refinery.
03 The employee infill apartments pictured have been built in the areas between existingconverted hostel blocks to utilise the space available and to access existing bulkinfrastructure. Phase 1 of construction saw 325 units completed at Karee inJanuary 2016.
Lonmin PlcAnnual Report and Accounts 2016
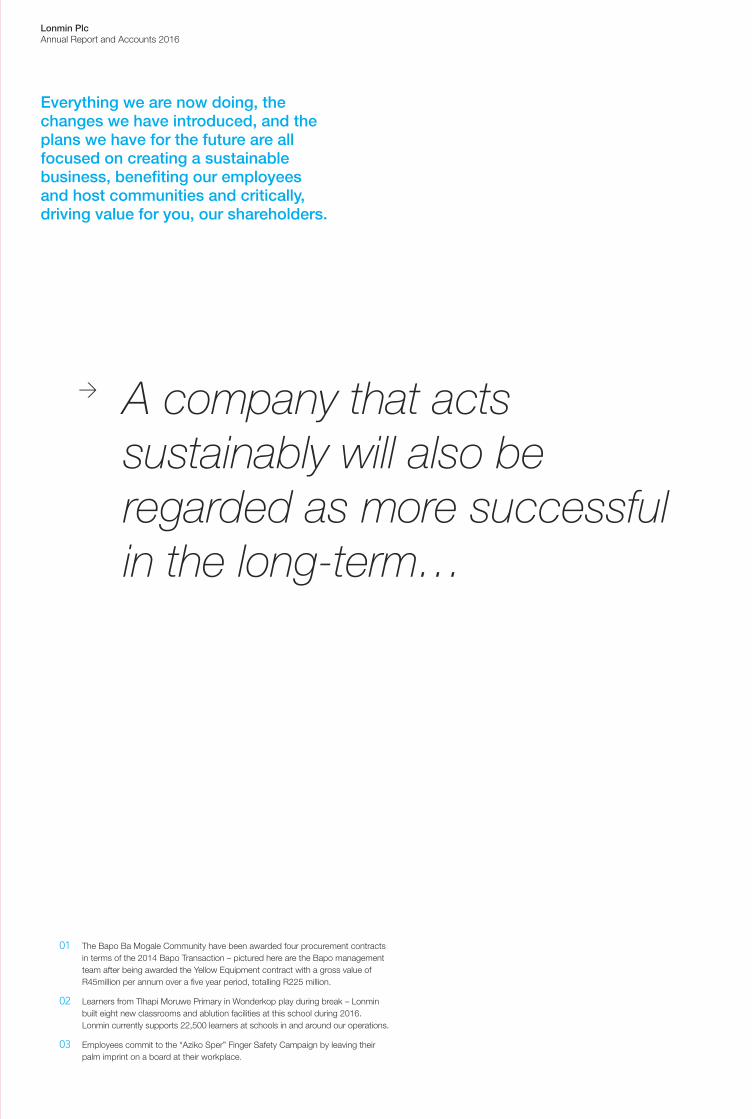
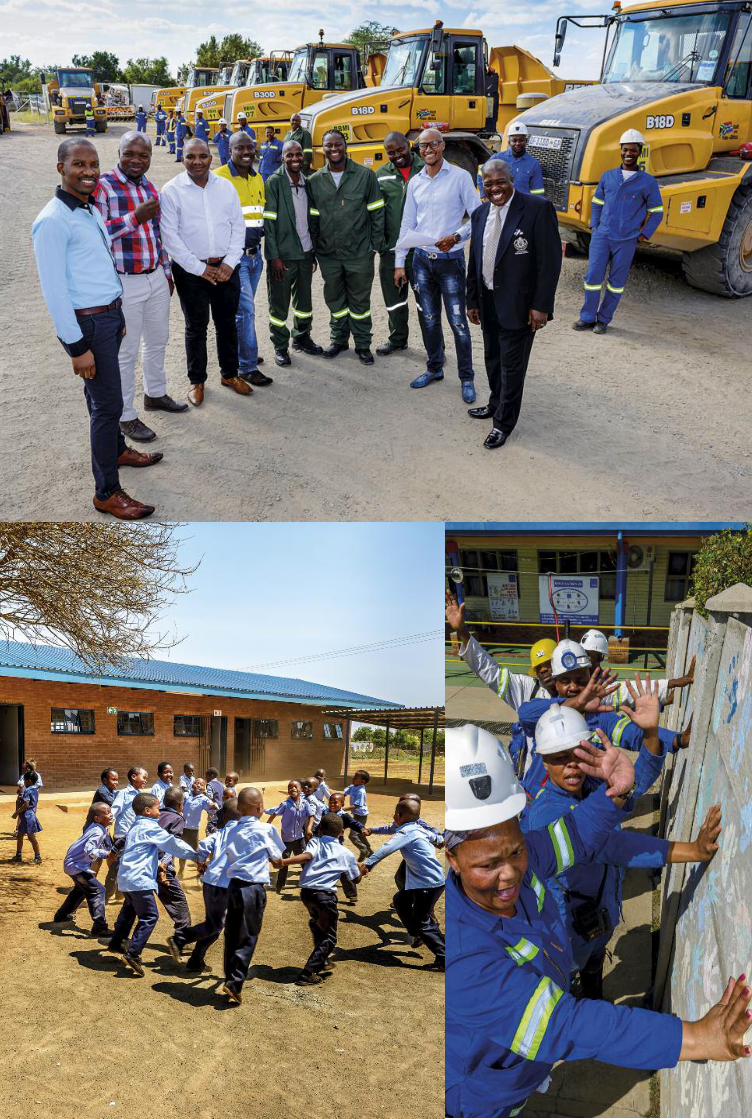
Everything we are now doing, thechanges we have introduced, and theplans we have for the future are allfocused on creating a sustainablebusiness, benefiting our employees and host communities and critically,driving value for you, our shareholders.
> A company that actssustainably will also beregarded as more successfulin the long-term…
01 The Bapo Ba Mogale Community have been awarded four procurement contractsin terms of the 2014 Bapo Transaction – pictured here are the Bapo managementteam after being awarded the Yellow Equipment contract with a gross value ofR45million per annum over a five year period, totalling R225 million.
02 Learners from Tlhapi Moruwe Primary in Wonderkop play during break – Lonminbuilt eight new classrooms and ablution facilities at this school during 2016.Lonmin currently supports 22,500 learners at schools in and around our operations.
03 Employees commit to the “Aziko Sper” Finger Safety Campaign by leaving theirpalm imprint on a board at their workplace.
Lonmin PlcAnnual Report and Accounts 2016
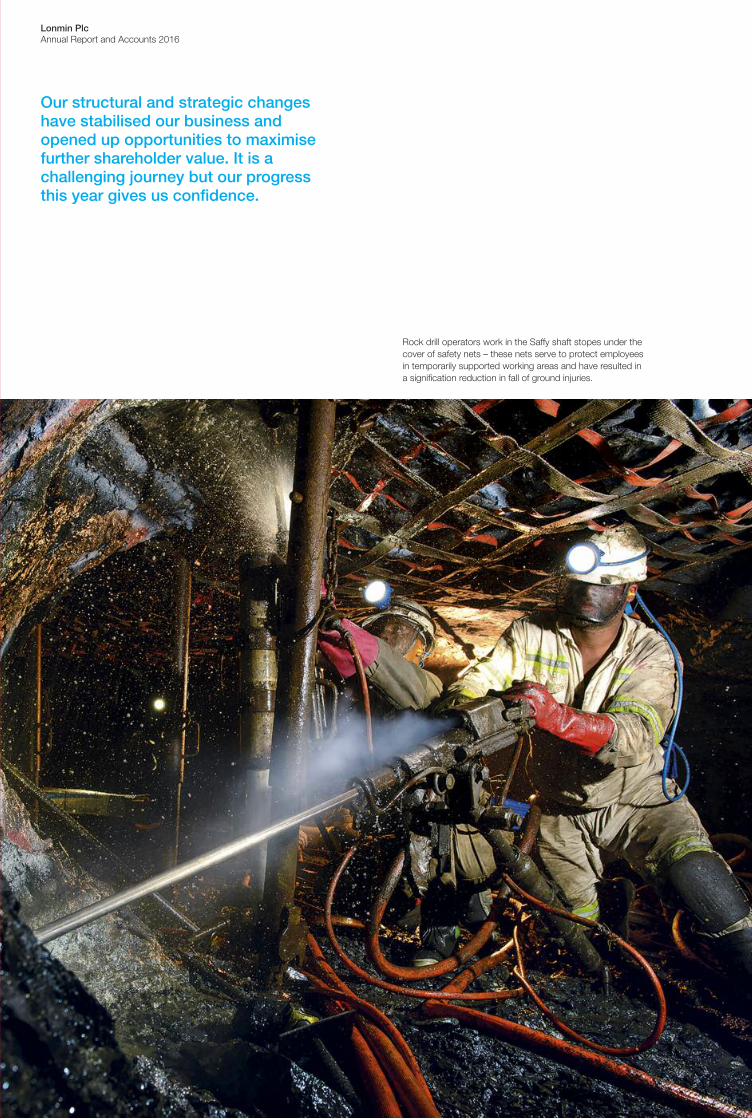
Our structural and strategic changeshave stabilised our business andopened up opportunities to maximisefurther shareholder value. It is achallenging journey but our progressthis year gives us confidence.
Rock drill operators work in the Saffy shaft stopes under thecover of safety nets – these nets serve to protect employeesin temporarily supported working areas and have resulted ina signification reduction in fall of ground injuries.
01 /Strategic R
eport02 /
Governance
03 /Financial S
tatements
04 /A Deeper Look
05 /Shareholder Inform
ation
www.lonmin.com
/ 01Lonmin PlcAnnual Report and Accounts 2016
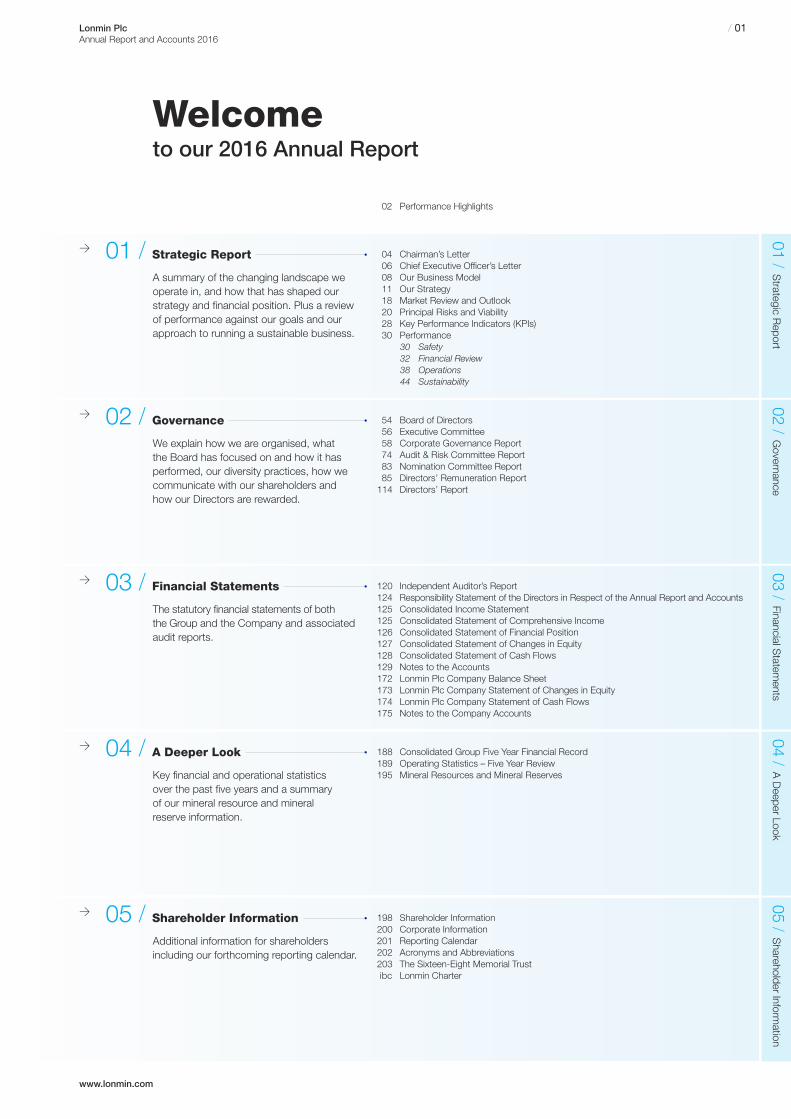
>04 Chairman’s Letter06 Chief Executive Officer’s Letter08 Our Business Model11 Our Strategy18 Market Review and Outlook20 Principal Risks and Viability28 Key Performance Indicators (KPIs)30 Performance
30 Safety32 Financial Review38 Operations44 Sustainability
02 Performance Highlights
01 / Strategic Report
A summary of the changing landscape weoperate in, and how that has shaped ourstrategy and financial position. Plus a reviewof performance against our goals and ourapproach to running a sustainable business.
>54 Board of Directors56 Executive Committee58 Corporate Governance Report74 Audit & Risk Committee Report83 Nomination Committee Report85 Directors’ Remuneration Report114 Directors’ Report
02 / Governance
We explain how we are organised, whatthe Board has focused on and how it hasperformed, our diversity practices, how wecommunicate with our shareholders andhow our Directors are rewarded.
> 03 / Financial Statements
The statutory financial statements of boththe Group and the Company and associatedaudit reports.
>188 Consolidated Group Five Year Financial Record189 Operating Statistics – Five Year Review195 Mineral Resources and Mineral Reserves
04 / A Deeper Look
Key financial and operational statisticsover the past five years and a summaryof our mineral resource and mineralreserve information.
>198 Shareholder Information200 Corporate Information201 Reporting Calendar202 Acronyms and Abbreviations203 The Sixteen-Eight Memorial Trustibc Lonmin Charter
05 / Shareholder Information
Additional information for shareholdersincluding our forthcoming reporting calendar.
Welcometo our 2016 Annual Report
120 Independent Auditor’s Report124 Responsibility Statement of the Directors in Respect of the Annual Report and Accounts125 Consolidated Income Statement125 Consolidated Statement of Comprehensive Income126 Consolidated Statement of Financial Position127 Consolidated Statement of Changes in Equity128 Consolidated Statement of Cash Flows129 Notes to the Accounts172 Lonmin Plc Company Balance Sheet173 Lonmin Plc Company Statement of Changes in Equity174 Lonmin Plc Company Statement of Cash Flows175 Notes to the Company Accounts

/ 02 Lonmin PlcAnnual Report and Accounts 2016
Performance HighlightsWe have now sustainably repositioned the business, not only to withstand the current low PGM price environment, but to also seize opportunities tomaximise value for shareholders and all our stakeholders.
Below we outline some key achievements of the year and guidance for 2017.
• Highlights– The successful completion of the reorganisation has improved Lonmin’s profitability and
resulted in the business being cash flow positive after capital expenditure despite thecontinuing low PGM pricing environment
– Underlying operating profit increased to $7 million from a loss of $134 million in the prior year– Cash improved from $69 million at end of first quarter to $173 million at year end– Liquidity improved from $422 million at end of first quarter to $537 million at year end– Sales of 735,747 Platinum ounces, exceeded the sales guidance of 700,000 Platinum ounces,
supported by our smelter clean-up and metal release from improved processing technology– Achieved cost reduction of R1.3 billion, 86% higher than the target of R700 million– Underlying costs decreased by 3.2% to R14.1 billion – unit costs increased by 4.0% to
R10,748, despite 8.2% increase in labour costs– Concentrator recoveries of 86.6% continue to be industry leading– Generation 2 shafts production of 8.1 million tonnes, 4.0% up on prior year on a comparable
basis, and productivity up 5.0%, notwithstanding rationalisation of the workforce by 19.0%– The planned decline of our Generation 1 shafts is on track, reducing our high cost production
in an oversupplied market– Saffy shaft production up 16.9% and has reached steady state– Average Rand full basket price (including base metals) up 7.5% on prior year, at R11,637
per PGM ounce– Peaceful and non-disruptive conclusion of multi-year wage agreement, reflects a maturing
relationship with the unions and employees– Preserved Immediately Available Ore Reserves (IAOR) which stand at 22.4 months,
providing us with operational flexibility
• Safety– Determined to continuously improve our overall safety performance– Saddened by the loss of four employees during the year despite our best efforts to achieve
Zero Harm in all our operations– Lost Time Injury Frequency Rate (LTIFR) improved by 8.1% to 4.97 (2015: 5.41)
• Guidance for financial year 2017– Platinum sales between 650,000 and 680,000 ounces– Unit costs remain under pressure; expected to be in the range of R10,800 to R11,300 per
PGM ounce– Capital expenditure to be funded from cash generated from operating activities and third
party funding. Our 2017 guidance is expected to be increased to approximately R1.8 billionwhich includes R400 million related to the Bulk Tailings Treatment (BTT) project

www.lonmin.com
StrategicReport
01 /Strategic R
eport02 /
Governance
03 /Financial S
tatements
04 /A Deeper Look
05 /Shareholder Inform
ation/ 03Lonmin Plc
Annual Report and Accounts 2016
04 Chairman’s Letter06 Chief Executive Officer’s Letter08 Our Business Model11 Our Strategy18 Market Review and Outlook20 Principal Risks and Viability28 Key Performance Indicators (KPIs)30 Performance
30 Safety32 Financial Review38 Operations44 Sustainability
01/
A summary of the changing landscape we operate in,and how that has shaped our strategy and financial position.Plus a review of performance against our goals and our approach to running a sustainable business.

/ 04 Lonmin PlcAnnual Report and Accounts 2016
Chairman’sLetter
“I am pleased with the strongerposition we are in but thereis still much to do and yourBoard is concentrated onensuring that your Companyachieves its targeted objectivesover the medium term. It is achallenging journey but ourprogress this year gives usconfidence.”
Brian BeamishChairman
Dea r Fellow Sha reholder,Early in the 2016 financial year your Company completed asuccessful Rights Issue which, together with the renewal ofour debt facilities, shaft closures, workforce reduction and theimplementation of a focused Business Plan, has put us in astronger position to steer Lonmin through the current low PGMpricing environment. The steps taken by the Board and ourExecutive Management team were necessary to reinforce thebusiness, while preserving the future value of our high qualityasset base and long-term mining rights. I would like to thankshareholders for their support and for understanding the realityof our position during what was a challenging period.
We were all deeply saddened by the loss of four employeesduring the year despite our best efforts to achieve zero harm inall our operations. I would like to add my heartfelt condolencesto those of our Chief Executive, Ben Magara, to the families andfriends of the deceased. Safety underpins all that we do and,as always, remains an absolute priority for the Group and ourExecutive Management.
For the last three quarters of the financial year, we havemanaged Lonmin to be cash flow positive after capitalexpenditure. As we stated in our Prospectus at the time ofthe Rights Issue, our objectives are to reduce fixed costs,keep capital expenditure to the minimum necessary, improveefficiencies, and, at the same time, preserve the Company’slong-term value. As part of this, we also announced thereorganisation of the business which saw us reduce our overallworkforce and focus on our core Generation 2 shafts.
The strength of Lonmin’s relationship with its unions has beenput to the test over the year with the reorganisation and wagenegotiations. By maintaining a constructive and regulardialogue throughout, your Company was able to keep joblosses to the minimum necessary, and, in October 2016,reached a satisfactory outcome to the current wage negotiations.Both achievements were gained without labour disputes orwork stoppages. This is a clear recognition of the work bothour Management and the unions have put into building andnurturing effective relationships. The focus must now be oncontinuing to rebuild morale throughout our operations,especially after the reorganisation.
Sustainability remains central to our business and is dependenton our relationship with our employees and fulfilling our socialand community responsibilities. We are pleased with theprogress we have made in employee wellness and remainconfident that these initiatives, including financial literacy andcounselling, will continue to yield encouraging results.
I am particularly pleased with our efforts to create a transformedorganisation. Our Historically Disadvantaged South Africanrepresentation at management level in Lonmin is now at 52.3%versus the Mining Charter’s required target of 40%.
Pleasingly, our focus on continuous improvement initiatives hasresulted in a downward trend in energy consumption per PGMounce, critical to the energy challenges in South Africa.
Many of the challenges we share with the wider industry arelinked to the broader systemic socioeconomic problems inSouth Africa. While we remain absolutely committed to playingour part in delivering changes and improvements to the extentthat our resources allow, it is only by working in partnership withall stakeholders – both state and-non state – that we can reallybegin to address these issues.
01 /Strategic R
eport02 /
Governance
03 /Financial S
tatements
04 /A Deeper Look
05 /Shareholder Inform
ation
www.lonmin.com
/ 05Lonmin PlcAnnual Report and Accounts 2016
Since the period end, we announced the acquisition of AngloAmerican Platinum’s 42.5% stake in Pandora Joint Venture,bringing Lonmin’s total ownership of the asset to 92.5%. Thisacquisition allows us to consolidate our position in this relativelyshallow and high grade mineral resource providing an attractiveoption for development by Eastern Platinum Limited in both theshort and longer term.
The year saw two Board changes. First the appointment ofKennedy Bungane as a Non-Executive Director. Kennedy isCEO of Phembani Group Proprietary Limited, which mergedwith Lonmin’s Black Economic Empowerment partnerShanduka Group (Proprietary) Limited (Shanduka). Kennedyhas a wealth of corporate experience and his appointment is inline with our original contractual arrangements with Shanduka.
In May, Simon Scott stepped down as Chief Financial Officerand as a Director of the Company. We wish Simon everysuccess in the future and thank him for his contribution to thebusiness over what was a very challenging period.
We were delighted to be able to welcome Barrie van der Merweas Simon’s replacement and as a member of the Board. Barriehas brought with him extensive knowledge and experience ofthe mining industry and the South African business environmentand has already made a significant contribution to the business.
As always, the Board is under constant review to ensure thatan acceptable balance of individuals is maintained and thatthe collective skills and experience of its members continueto be refreshed.
Looking at the year as a whole, I am pleased to be able toreport that Lonmin has now strengthened its ability to deal withthe difficult market conditions which are being experienced bythe PGM sector. There is still much to do but the Board and ourExecutive Management are concentrating their efforts to ensurethat your Company achieves its targeted objectives over themedium term to ensure sustainability and preserve long-termvalue for our shareholders. It is a challenging journey, but ourprogress this year reinforces our confidence. We continue toexplore options to create value for our shareholders, with theinitiation of the Bulk Tailings Treatment project, the sale of ourstake in a non-core gold exploration joint venture in Kenya andthe Pandora acquisition being excellent examples of what hasbeen achieved in this regard so far.
Your Board cannot recommend a dividend for the year, but myfellow Directors and I would like to thank all our shareholders fortheir continued support. I would also like to extend my thanksto my colleagues on the Board, our management team and allour workforce.
Yours faithfully,
Brian BeamishChairman

“Our structural and strategicchanges stabilised thebusiness, generated cashand have opened upopportunities to maximisefurther shareholder value.”
Ben MagaraChief Executive Officer
/ 06 Lonmin PlcAnnual Report and Accounts 2016
Chief ExecutiveOfficer’s Letter
Dea r Fellow Sha reholder,Improving cash and liquidity were our priorities for 2016 andthese results demonstrate good progress in these two areas.After our Rights Issue which strengthened our balance sheetand the renewal of our bank facilities, we delivered on ourpromises to our shareholders:
maintaining a strict focus on cash, which ensured that for•the three quarters following the successful reorganisationof the business we were cash flow positive after capitalexpenditure and improved operating profit to $7 million,from a loss of $134 million in 2015;
increasing our net cash position from $69 million with•total liquidity of $422 million at the end of quarter one, to$173 million with total liquidity of $537 million at the year end;
reducing costs by R1.3 billion, 86% higher than our target•as well as contained capital expenditure;
timely conclusion of a multi-year wage agreement; and•
preserving Immediately Available Ore Reserves, at•22.4 months, giving us operational flexibility.
Our structural and strategic changes stabilised the business,generated cash and have opened up opportunities to maximisefurther shareholder value. Our improving cash position and liquidityshows that we have repositioned the Company. Supported byour long-life, shallow ore resources, I am confident that we arecapable of meeting the immediate challenges and equipped totake advantage of any continued market improvement.
Safety is essential for good performance and remains our priority.With regret I confirm that Zilindile Ndumela, Goodman Mangisa,Fanelekile Giyama and Siphilo Makhende were fatally injuredduring the year. Our condolences go to their families and lovedones. Overall Lost Time Injury Frequency Rate improved by 8.1%.We remain determined to better our overall safety performanceand have further enhanced our focus on safety improvements.I absolutely believe Zero Harm is realistic and achievable.
Reorganisation
The reorganisation of the Group, in line with the Business Plan,was successfully completed in the first half of the year with atotal of 5,433 employees and contractors leaving the businessbetween 30 June 2015 and 31 March 2016. A further 1,428employees were reskilled and redeployed into vacant, moreproductive roles. The reorganisation, whilst successful in beingcompleted without business interruptions, did nonethelesshave a disruptive impact on mining production, with totaltonnes mined falling below our ambitious Business Plan target.
As the disruption created by the rationalisation process settlesdown, we expect the mining teams to start to improve levelsof production. Additionally, a number of initiatives have beenactioned to support the achievement of planned output for 2017.
Performance
Despite the reorganisation, we achieved Platinum sales of735,747 ounces, exceeding our guidance of 700,000 Platinumounces, assisted by the impressive efforts of our Processingteam, which released 73,186 Platinum ounces from the smelterclean-up project and metal release from our new Other PreciousMetals Plant (OPM). I would like to praise the Processing team’sentrepreneurial approach and high performance culture.
We mined a total of 10.3 million tonnes, a decrease of 8.8%on 2015, reflecting the planned decline in production from ourolder Generation 1 shafts, which are being wound down aspart of our strategy to reduce high cost production. 2016 sawthe orderly closure of our 1B shaft and the cessation of ownproduction from Newman shaft.
Tonnes mined from our core Generation 2 shafts were up 4.0%on a comparable basis. Saffy shaft, which is now operating atfull production, performed notably well, offsetting the weakerperformance of K3 and Rowland shafts, which were affected bythe redeployment and reskilling of employees; absenteeism ofkey personnel; and higher incidents of safety stoppages in thefirst nine months of the year. Productivity at our Generation 2shafts increased 5.4% to a five year high of 5.9 square metersper person.
We made efforts to improve the performance of our processingplants over recent years and the concentrators have achievedlevels of PGM recoveries amongst the highest in their history.We continue to pursue various initiatives to utilise our excessprocessing capacity; the Bulk Tailings Treatment (BTT) projectbeing an example of this.
Cash and Liquidity, Profitability, Cost Savings andCapital expenditure
The reorganisation resulted in the business delivering underlyingoperating profit of $7 million compared to underlying loss of$134 million in 2015 and meant the business was cash positiveafter capital expenditure for the last three quarters of the year.Our net cash position increased to $173 million (R2.4 billion)with total liquidity of $537 million (R7.5 billion) at the year end.We benefited from a cash flow injection of circa R350 million(around $24 million) realised from permanently reducing our metalin process stock following the commissioning of the OPM Plant.
01 /Strategic R
eport02 /
Governance
03 /Financial S
tatements
04 /A Deeper Look
05 /Shareholder Inform
ation
www.lonmin.com
/ 07Lonmin PlcAnnual Report and Accounts 2016
Underlying costs decreased by 3.2% to R14.1 billion. Wedelivered cost reductions of R1.3 billion (in real terms) over thecourse of the year, which was 86% ahead of our Business Plantarget of R700 million.
We contained unit costs to R10,748, a 4.0% increase yearon year, in spite of the 8.2% increase in labour wages and thedisruption from the reorganisation, which was marginally aheadof the revised guidance provided in our Q3 production report.The increase reflects the production challenges experienced in ourmining operations, where the majority of our costs are incurred,highlighting a need to build on our productivity improvements.
Capital expenditure was contained to $89 million, less thanour revised guidance of $105 million due to the delay of theBTT project. During 2016, $50 million competitive third partyfunding was secured for our BTT project with the first trancheof $9 million received in the fourth quarter.
During the year an impairment charge of $335 million wasincurred, reflecting the weakened rhodium price long-termoutlook and strengthened Rand to US Dollar exchange ratein the second half.
Wage Settlement
On 31 October, we announced our agreement with Associationof Mineworkers and Construction Union (AMCU) on wages andconditions of service. The agreement, effective from 1 July 2016to 30 June 2019, provides employees with a realistic andcompetitive outcome and was negotiated without any businessinterruptions, demonstrating the reducing risk in this area. The impact of this is an average annual increase of 7.6%.
Bapo Ba Mogale
Four contracts were awarded to the Bapo Ba Mogale (Bapo)under the terms of the 2014 Transaction and have beenimplemented. The award of these contracts has resulted inLonmin far exceeding the procurement undertakings given tothe Bapo. Our relationship with the Bapo continues to evolve aswe support them to build capacity and governance structureswithin their organisation.
Pandora
On 11 November, we entered into a sale and purchase agreementto acquire Anglo American Platinum’s (AAP) 42.5% stake inPandora, bringing our total ownership in the asset to 92.5%.The acquisition, for a minimum of R400 million (nominal terms)and a maximum of R1 billion, over six years, increases ourexposure to an asset with good long-term developmentpotential. The Pandora Joint Venture made an operating loss ofR109 million in 2016, with Lonmin’s 50% share being reflectedin these accounts. However, Lonmin received a contribution ofR117 million from ore purchase agreements, which offsets thejoint venture loss. Adjacent to our Saffy shaft, Lonmin expectsto be able to access additional ounces without having to incurfurther capital expenditure, allowing us to defer capital todeepen the Saffy shaft. Additionally, Lonmin will realise anannual rental fee of approximately R46 million, for a three-yearperiod, from AAP for the use of the Baobab concentrator inLimpopo. The transaction is expected to become unconditionalduring 2017 following the fulfilment of all conditions precedent.
The Market
During the year, the PGM pricing environment remained weakalthough the platinum market deficit has widened. In theshort-term we expect markets to remain subdued, howeverwe still believe the long-term market fundamentals are strong.
PGMs have a vital role to play as we move towards a greenerglobal economy. Platinum and palladium’s role in reducing harmfulemissions remains key and is of growing relevance for developingmarkets, which are increasingly adopting more stringentemissions standards. Growth in jewellery demand from India andthe United States has recently offset the slowdown in Chinaand we believe the drivers of platinum investment and demandare robust. When market sentiment improves, I am confident thatwe will see an improvement in platinum prices primarily becauseof the extended under-investment in the primary supply.
Outlook
We expect Platinum sales for 2017 to be between 650,000 and680,000 ounces which takes into account the positive impactof various initiatives such as the smelter clean-up. We remainvigilant in our cost control and expect our overheads andsupport services structures to align with our sales profile.Unit costs will remain under pressure until we see a sustainedimprovement in production throughput from mining and areexpected to be in the range of R10,800 to R11,300 per PGMounce. Like costs, our capital expenditure is predominantlyincurred in Rands. Therefore, going forward, our capitalexpenditure guidance will be provided in Rands rather thanUS Dollars. Our 2017 guidance is approximately R1.8 billion;the increase on previous guidance reflects the delay to theBTT project which is third party funded and accounts forR400 million. Capital expenditure will be maintained at theminimum level required for the safe and efficient running ofthe Group’s operating, as we continue to focus on our aimof being cash positive after capital expenditure.
Conclusion
Today, the business is well positioned with disruption fromthe reorganisation process reducing. The Mining Division hasstabilised following the reorganisation and is in a strong positionto move forward. We are focused on our core Generation 2shafts. We are well placed to drive essential and sustainedimprovements in productivity and a number of initiatives havebeen implemented to address mining’s performance. Gettingprofitable ounces out of the ground is an essential priority.
The work we do would not be possible without our employees.We continue on our journey to improve their wellbeing andfinancial literacy and have been encouraged by the results ofthe initiatives we put in place to achieve this. Our employeesdeserve decent living standards and must have a choice ofhow and where they want to live. Achieving our vision forsustainable, integrated settlements requires careful planning,consultation and coordination between all stakeholders –employees themselves, communities, potential funders,developers, unions, local municipalities and Government.To this end, Lonmin and its organised labour are reviewingemployee living standards as part of the human settlementsstrategy, which should realise a tactical plan that addressesemployees’ wishes, needs, security and affordability to ensurea fit-for-purpose and decent standard of living.
We have come a long way during 2016. I am particularlypleased with our return to profitability and the increase in ourcash position and liquidity. We are now well positioned toexplore options to maximise value for our shareholders andall our stakeholders; the acquisition of Pandora being a goodexample of this.
Yours faithfully,
Ben MagaraChief Executive Officer
/ 08 Lonmin PlcAnnual Report and Accounts 2016
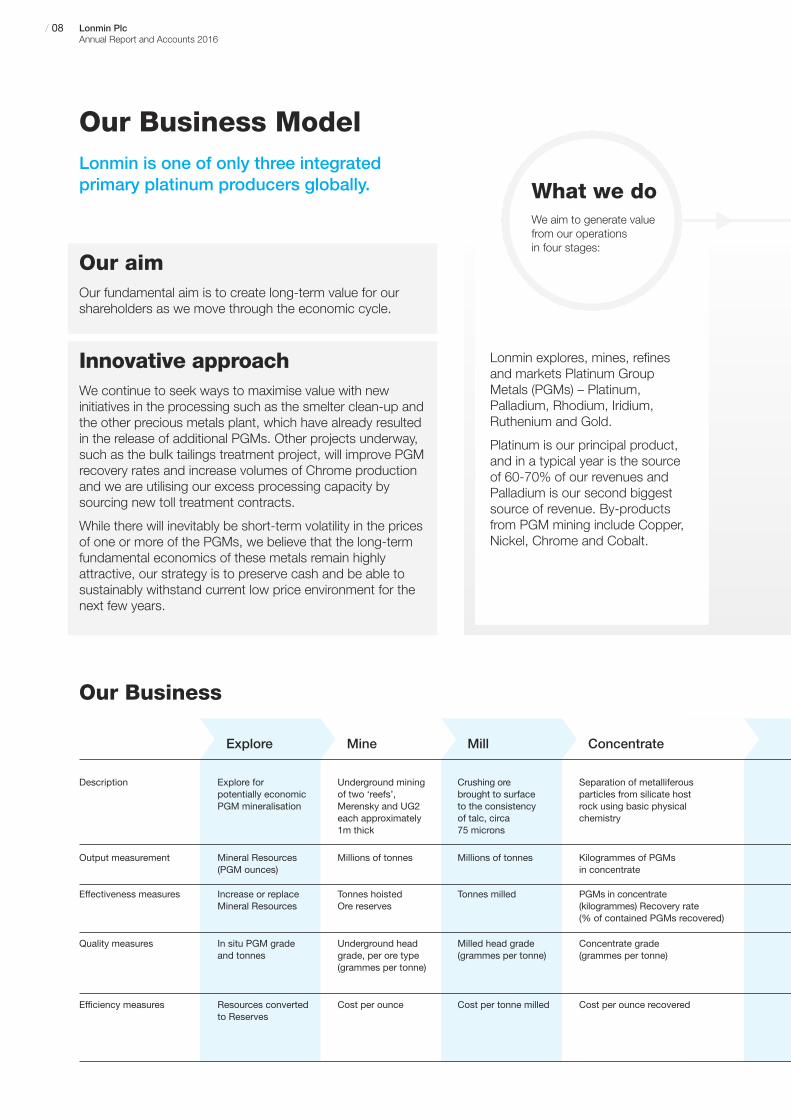
Our Business ModelLonmin is one of only three integratedprimary platinum producers globally.
Our aimOur fundamental aim is to create long-term value for ourshareholders as we move through the economic cycle.
Innovative approachWe continue to seek ways to maximise value with newinitiatives in the processing such as the smelter clean-up andthe other precious metals plant, which have already resultedin the release of additional PGMs. Other projects underway,such as the bulk tailings treatment project, will improve PGMrecovery rates and increase volumes of Chrome productionand we are utilising our excess processing capacity bysourcing new toll treatment contracts.
While there will inevitably be short-term volatility in the pricesof one or more of the PGMs, we believe that the long-termfundamental economics of these metals remain highlyattractive, our strategy is to preserve cash and be able tosustainably withstand current low price environment for thenext few years.
Lonmin explores, mines, refinesand markets Platinum GroupMetals (PGMs) – Platinum,Palladium, Rhodium, Iridium,Ruthenium and Gold.
Platinum is our principal product,and in a typical year is the sourceof 60-70% of our revenues andPalladium is our second biggestsource of revenue. By-products from PGM mining include Copper,Nickel, Chrome and Cobalt.
Our Business
MineExplore Mill Concentrate
Description Underground miningof two ‘reefs’,Merensky and UG2each approximately1m thick
Crushing orebrought to surfaceto the consistencyof talc, circa75 microns
Separation of metalliferousparticles from silicate hostrock using basic physicalchemistry
Output measurement Millions of tonnes Millions of tonnes Kilogrammes of PGMsin concentrate
Effectiveness measures Tonnes hoistedOre reserves
Tonnes milled PGMs in concentrate(kilogrammes) Recovery rate(% of contained PGMs recovered)
Quality measures Underground headgrade, per ore type(grammes per tonne)
Milled head grade(grammes per tonne)
Concentrate grade(grammes per tonne)
Efficiency measures Cost per ounce Cost per tonne milled Cost per ounce recovered
Explore forpotentially economicPGM mineralisation
Mineral Resources(PGM ounces)
Increase or replaceMineral Resources
In situ PGM gradeand tonnes
Resources convertedto Reserves
What we doWe aim to generate valuefrom our operationsin four stages:
01 /Strategic R
eport02 /
Governance
03 /Financial S
tatements
04 /A Deeper Look
05 /Shareholder Inform
ation
www.lonmin.com
/ 09Lonmin PlcAnnual Report and Accounts 2016
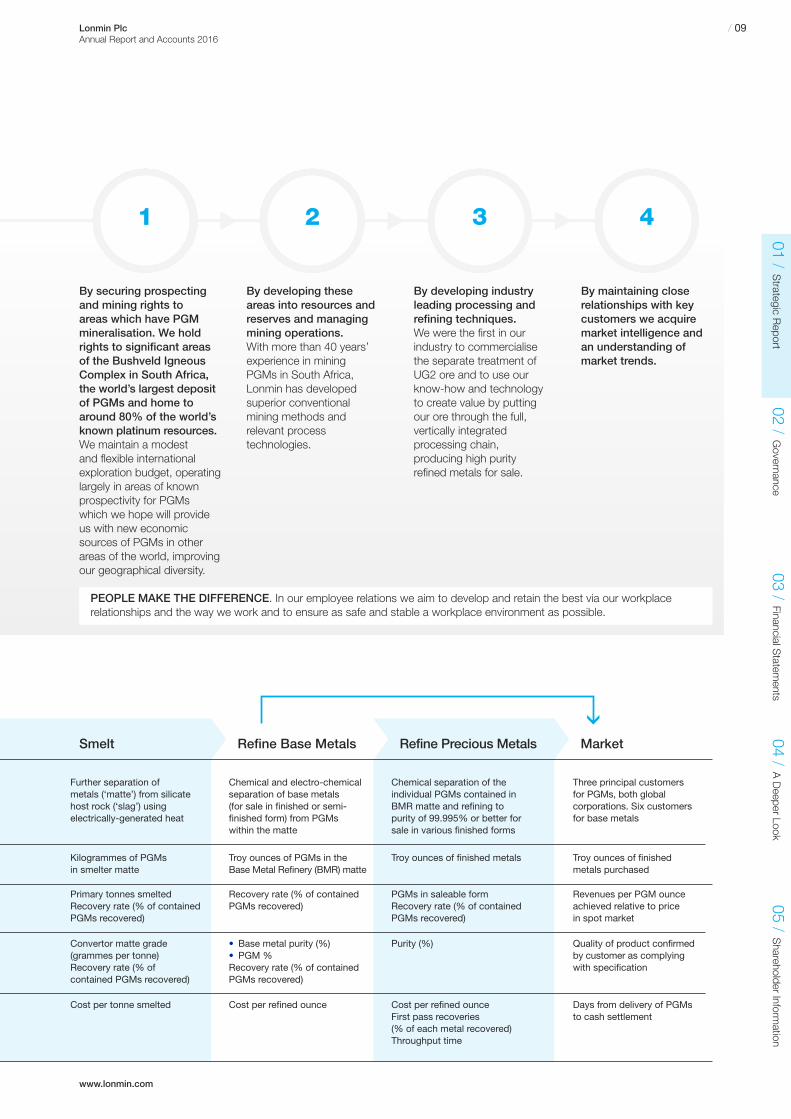
1 2 3 4
By developing theseareas into resources andreserves and managingmining operations.With more than 40 years’experience in miningPGMs in South Africa,Lonmin has developedsuperior conventionalmining methods andrelevant processtechnologies.
By developing industryleading processing andrefining techniques.We were the first in ourindustry to commercialisethe separate treatment ofUG2 ore and to use ourknow-how and technologyto create value by puttingour ore through the full,vertically integratedprocessing chain,producing high purityrefined metals for sale.
By maintaining closerelationships with keycustomers we acquiremarket intelligence andan understanding ofmarket trends.
PEOPLE MAKE THE DIFFERENCE. In our employee relations we aim to develop and retain the best via our workplacerelationships and the way we work and to ensure as safe and stable a workplace environment as possible.
Smelt Refine Base Metals Refine Precious Metals Market
By securing prospectingand mining rights toareas which have PGMmineralisation. We holdrights to significant areasof the Bushveld IgneousComplex in South Africa,the world’s largest depositof PGMs and home toaround 80% of the world’sknown platinum resources.We maintain a modestand flexible internationalexploration budget, operatinglargely in areas of knownprospectivity for PGMswhich we hope will provideus with new economicsources of PGMs in otherareas of the world, improvingour geographical diversity.
Further separation ofmetals (‘matte’) from silicatehost rock (‘slag’) usingelectrically-generated heat
Chemical and electro-chemicalseparation of base metals(for sale in finished or semi-finished form) from PGMswithin the matte
Chemical separation of theindividual PGMs contained inBMR matte and refining topurity of 99.995% or better forsale in various finished forms
Three principal customersfor PGMs, both globalcorporations. Six customersfor base metals
Kilogrammes of PGMsin smelter matte
Troy ounces of PGMs in theBase Metal Refinery (BMR) matte
Troy ounces of finished metals Troy ounces of finishedmetals purchased
Primary tonnes smeltedRecovery rate (% of containedPGMs recovered)
Recovery rate (% of containedPGMs recovered)
PGMs in saleable formRecovery rate (% of containedPGMs recovered)
Revenues per PGM ounceachieved relative to pricein spot market
Convertor matte grade(grammes per tonne)Recovery rate (% ofcontained PGMs recovered)
• Base metal purity (%)• PGM %Recovery rate (% of containedPGMs recovered)
Purity (%) Quality of product confirmedby customer as complyingwith specification
Cost per tonne smelted Cost per refined ounce Cost per refined ounceFirst pass recoveries(% of each metal recovered)Throughput time
Days from delivery of PGMsto cash settlement
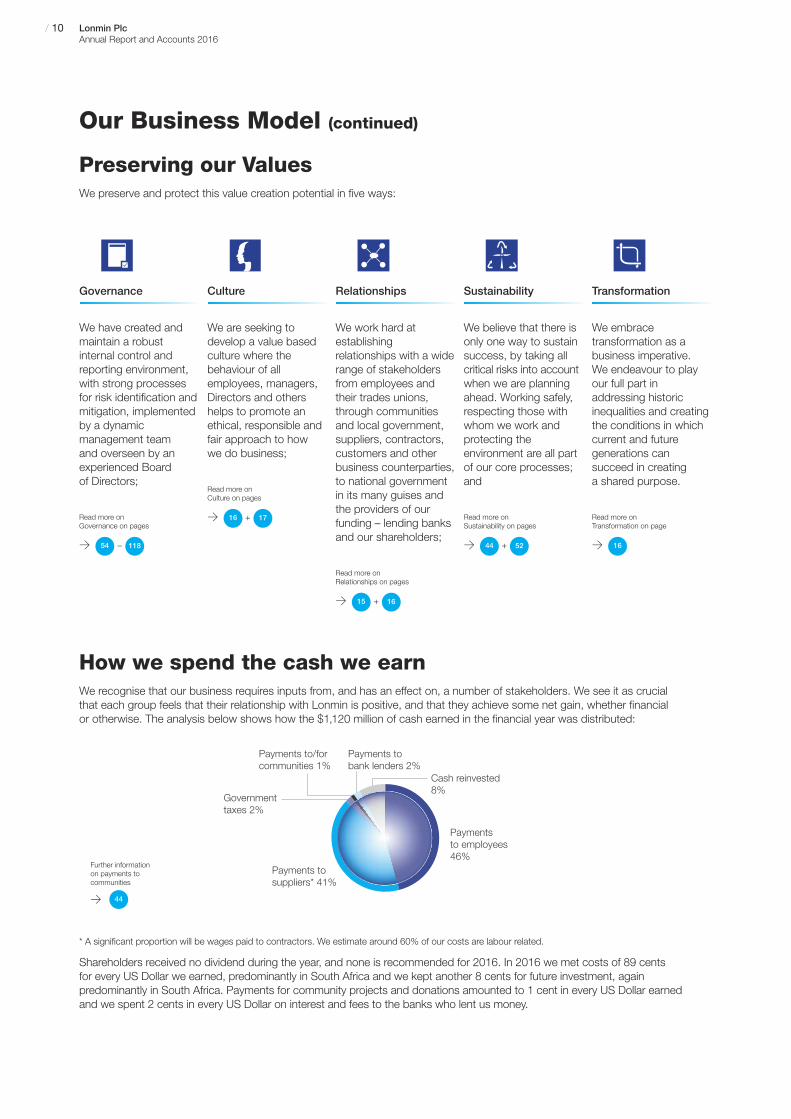
Preserving our ValuesWe preserve and protect this value creation potential in five ways:
Governance
We have created andmaintain a robustinternal control andreporting environment,with strong processesfor risk identification andmitigation, implementedby a dynamicmanagement team and overseen by anexperienced Board of Directors;
Read more onGovernance on pages
> 54
Culture
We are seeking todevelop a value basedculture where thebehaviour of allemployees, managers,Directors and othershelps to promote anethical, responsible andfair approach to how we do business;
Read more onCulture on pages
> 16
Relationships
We work hard atestablishingrelationships with a widerange of stakeholdersfrom employees andtheir trades unions,through communitiesand local government,suppliers, contractors,customers and otherbusiness counterparties,to national governmentin its many guises andthe providers of ourfunding – lending banksand our shareholders;
Read more onRelationships on pages
> 15
Sustainability
We believe that there isonly one way to sustainsuccess, by taking allcritical risks into accountwhen we are planningahead. Working safely,respecting those withwhom we work andprotecting theenvironment are all partof our core processes;and
Read more onSustainability on pages
> 44
Transformation
We embracetransformation as abusiness imperative. We endeavour to playour full part inaddressing historicinequalities and creatingthe conditions in whichcurrent and futuregenerations cansucceed in creating a shared purpose.
Read more onTransformation on page
> 16
/ 10 Lonmin PlcAnnual Report and Accounts 2016
Our Business Model (continued)
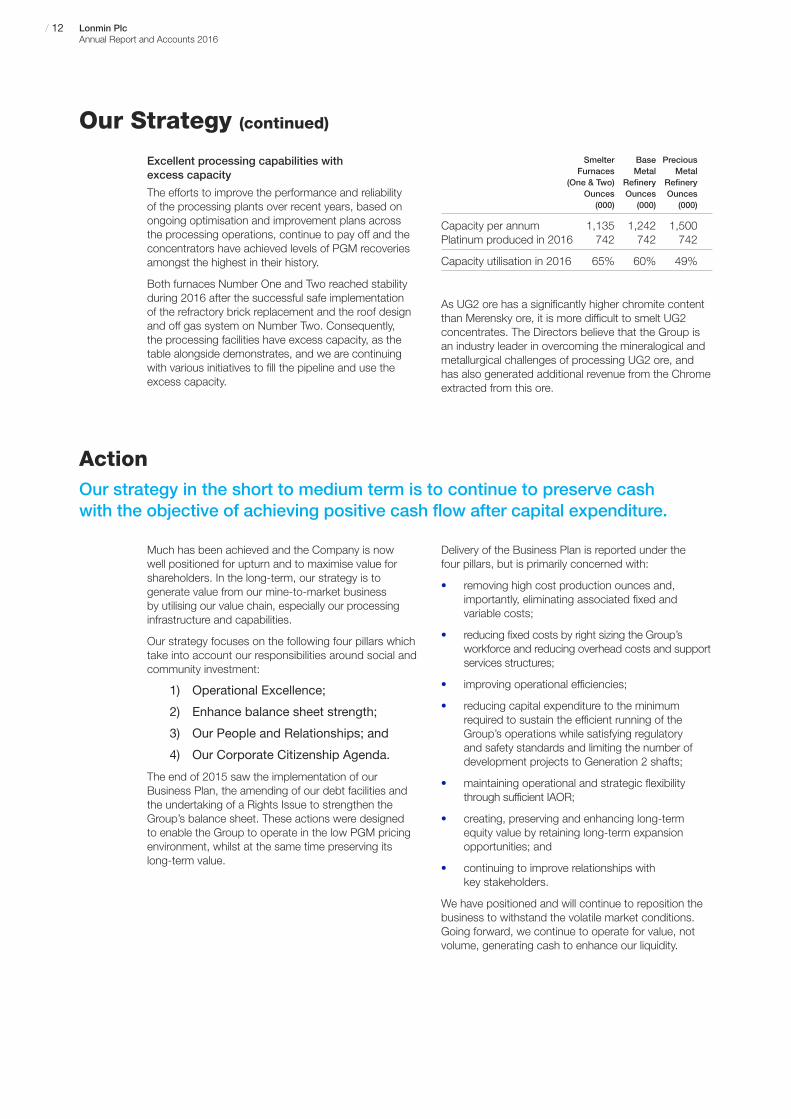
How we spend the cash we earnWe recognise that our business requires inputs from, and has an effect on, a number of stakeholders. We see it as crucialthat each group feels that their relationship with Lonmin is positive, and that they achieve some net gain, whether financial or otherwise. The analysis below shows how the $1,120 million of cash earned in the financial year was distributed:
* A significant proportion will be wages paid to contractors. We estimate around 60% of our costs are labour related.
Shareholders received no dividend during the year, and none is recommended for 2016. In 2016 we met costs of 89 centsfor every US Dollar we earned, predominantly in South Africa and we kept another 8 cents for future investment, againpredominantly in South Africa. Payments for community projects and donations amounted to 1 cent in every US Dollar earnedand we spent 2 cents in every US Dollar on interest and fees to the banks who lent us money.
Cash reinvested8%
Paymentsto employees46%
Payments tosuppliers* 41%
Governmenttaxes 2%
Payments tobank lenders 2%
Payments to/forcommunities 1%
> 44
Further information on payments tocommunities
16+
52+118–
17+

Background
01 /Strategic R
eport02 /
Governance
03 /Financial S
tatements
04 /A Deeper Look
05 /Shareholder Inform
ation
www.lonmin.com
/ 11Lonmin PlcAnnual Report and Accounts 2016
Our Strategy
At least 70% of platinum and rhodium supply is producedin South Africa, and Lonmin is one of only three integratedprimary PGM producers globally.
Quality asset base; large long-life reserves
The Group’s mineral resources provide a source ofsupply that is expected to last for decades at currentand anticipated future rates of mining of between600,000 – 700,000 Platinum ounces per annum. As at 30 September 2016, the Group’s mineral reserves and mineral resources were as follows:
(in Moz) 3PGE + Au(*1) Pt
Proved 2.3 1.4Probable 29.4 17.8
Total Mineral Reserves 31.7 19.2
Measured 7.3 4.6Indicated 102.6 56.7Inferred 70.7 39.7
Total Mineral Resources (*2) 180.6 101.0
(*1) – 3PGE + AU means Platinum, Palladium, Rhodium and Gold
(*2) – Resources are reported inclusive of reserves
The Western Limb of the Bushveld Igneous Complexcontains two economic sources of PGM bearing orethat occur as stratified layers, or ‘reefs’; UG2 andMerensky. While the ratio of platinum to other PGMs inthe two reefs is broadly similar, UG2 ore in the Group’sprincipal mining areas in the Bushveld Igneous Complexis generally of a higher grade than Merensky ore, andoccurs over a greater width, making this ore moreeconomic to extract, with a lower risk of dilution bymining waste material from above or below the payablereef. We will continue to predominantly mine the UG2reef rather than the Merensky reef, as we have over thelast twenty years, with UG2 ore typically comprisingapproximately 70 to 75% of the Group’s total production.
Low cost and shallow mining operations
Our mining operations at an average depth of 600metres below surface are shallower than the industryaverage of 900-1000 metres below surface with a wideUG2 reef averaging 124 cm, minimising dilution.
Marikana has a diverse portfolio of shafts at differentstages of their life cycle, which are split into threecategories, namely Generation 1, 2 and 3 shafts. TheGeneration 1 shafts are smaller, older shafts in the latterstages of their operational life. As detailed in the BusinessPlan outlined at the time of our Rights Issue, ourHossy shaft, previously a Generation 2 shaft, has beenreclassified as a Generation 1 shaft, and remains ontarget for planned closure in 2017. The Generation 2shafts are our larger, long-life and newer shafts. OurGeneration 3 vertical shaft, K4, continues to offerbrownfield replacement optionality for the Group andrepresents one of the most capital efficient projects.It currently remains on care and maintenance.
Optionality
In the longer term, the Directors believe the Group hasa number of attractive brownfield expansion opportunitiesthat could potentially be developed when the PGMpricing environment improves, including the K4 shaft,the Rowland MK2 resources, opening up of furtherlevels of Saffy shaft, the Pandora E3 deepening projectand E4 Pandora project. The Limpopo operations,currently on care and maintenance, also offer a uniqueopportunity to develop what the Directors believe to bea sizeable mechanised operation in a sustained higherprice environment. In addition, the Akanani Mining (Pty)Limited (Akanani) project offers the prospect of a large,long-life, low cost and highly mechanised mine whichgives us optionality in the long-term.
We sold our stake in a non-core gold exploration jointventure in Kenya for $5 million during the year, butthrough our joint ventures with Vale S.A. and WallbridgeMining Company Limited, we retain our internationalexploration projects in Canada. Limited work alsocontinues on the exploration licences that we hold inNorthern Ireland. While our international projects offeran opportunity of competitive advantage and areshallow or highly mechanisable, in line with theBusiness Plan, allocation of funds to such projects isrestricted and consequently activity will remain minimalon these projects through financial year 2017.
/ 12 Lonmin PlcAnnual Report and Accounts 2016
Our Strategy (continued)
Much has been achieved and the Company is nowwell positioned for upturn and to maximise value forshareholders. In the long-term, our strategy is togenerate value from our mine-to-market businessby utilising our value chain, especially our processinginfrastructure and capabilities.
Our strategy focuses on the following four pillars whichtake into account our responsibilities around social andcommunity investment:
1) Operational Excellence;
2) Enhance balance sheet strength;
3) Our People and Relationships; and
4) Our Corporate Citizenship Agenda.
The end of 2015 saw the implementation of ourBusiness Plan, the amending of our debt facilities andthe undertaking of a Rights Issue to strengthen theGroup’s balance sheet. These actions were designedto enable the Group to operate in the low PGM pricingenvironment, whilst at the same time preserving itslong-term value.
Excellent processing capabilities withexcess capacity
The efforts to improve the performance and reliabilityof the processing plants over recent years, based onongoing optimisation and improvement plans acrossthe processing operations, continue to pay off and theconcentrators have achieved levels of PGM recoveriesamongst the highest in their history.
Both furnaces Number One and Two reached stabilityduring 2016 after the successful safe implementation of the refractory brick replacement and the roof designand off gas system on Number Two. Consequently,the processing facilities have excess capacity, as thetable alongside demonstrates, and we are continuingwith various initiatives to fill the pipeline and use theexcess capacity.
Smelter Base PreciousFurnaces Metal Metal
(One & Two) Refinery RefineryOunces Ounces Ounces(000) (000) (000)
Capacity per annum 1,135 1,242 1,500Platinum produced in 2016 742 742 742
Capacity utilisation in 2016 65% 60% 49%
As UG2 ore has a significantly higher chromite contentthan Merensky ore, it is more difficult to smelt UG2concentrates. The Directors believe that the Group isan industry leader in overcoming the mineralogical andmetallurgical challenges of processing UG2 ore, andhas also generated additional revenue from the Chromeextracted from this ore.
Delivery of the Business Plan is reported under thefour pillars, but is primarily concerned with:
removing high cost production ounces and,•importantly, eliminating associated fixed andvariable costs;
reducing fixed costs by right sizing the Group’s•workforce and reducing overhead costs and supportservices structures;
improving operational efficiencies;•
reducing capital expenditure to the minimum•required to sustain the efficient running of theGroup’s operations while satisfying regulatoryand safety standards and limiting the number ofdevelopment projects to Generation 2 shafts;
maintaining operational and strategic flexibility•through sufficient IAOR;
creating, preserving and enhancing long-term•equity value by retaining long-term expansionopportunities; and
continuing to improve relationships with•key stakeholders.
We have positioned and will continue to reposition thebusiness to withstand the volatile market conditions.Going forward, we continue to operate for value, notvolume, generating cash to enhance our liquidity.
ActionOur strategy in the short to medium term is to continue to preserve cashwith the objective of achieving positive cash flow after capital expenditure.

1. Operational Excellence
Our main priority remains the performance of our Marikana operations which are some of the best in the industry, interms of quality, safety and efficiency. We believe our Marikana operations remain amongst the best hard rock narrowtabular mining operations in the Western Limb.
Profitability and returns are crucial. The Group is highly geared to the PGM pricing environment and the Rand / US Dollarexchange rate. We operate for value, not for volume. Given the present PGM market, we believe that the priority in theshort-term is to make sustainable improvements in productivity and cash and bolster liquidity.
To improve cash margins, we strive to ensure that our core Generation 2 shafts reach the most efficient and profitablepositions in terms of safety, costs, production and productivity as the Generation 1 shafts reach the end of their lives.
Safety•
Safety remains at the heart of all that we do. Our ambition to achieve Zero Harm starts with the safety, health and wellbeing of our employees and extends to everything we do including minimising the environmental impact of our operations.
Our approach to safety is defined in the Lonmin Safety and Sustainable Development Policy, Sustainable DevelopmentStandards and the Fatal Risk Control Protocols and the Lonmin Mining Life Rules, a set of non-negotiable rules thattarget the risk areas responsible for the majority of fatal or serious accidents.
Removing high cost production ounces•
The Business Plan accelerates our core strategy of focusing on our larger Generation 2 shafts and will result ina reduction of the sales profile for the Group to approximately 650,000 – 680,000 Platinum ounces for 2017 ashigh-cost production continues to be wound down. Our guidance has been revised upwards marginally to accountfor initiatives like the smelter clean-up.
The closure of inefficient areas and shafts will continue through 2017. As previously noted, our Hossy shaft remainson track for planned care and maintenance closure in 2017. Our Newman shaft has now ceased production fromLonmin crews. Newman is currently being mined by contractors and future extraction of the remaining ore reservesusing contract mining will be assessed annually.
Two Generation 1 shafts, E1 and W1, were initially intended to be put on care and maintenance. These contractormanaged shafts were subsequently allowed to continue mining following a revised cash generative contractordevelopment plan and more favourable terms. These shafts continue to produce profitable ounces and, as such, are expected to remain operational under the current contractor model for financial year 2017. The viability of theseshafts is reassessed annually.
• Long-term option – remaining on care and maintenance
01 /Strategic R
eport02 /
Governance
03 /Financial S
tatements
04 /A Deeper Look
05 /Shareholder Inform
ation
www.lonmin.com
/ 13Lonmin PlcAnnual Report and Accounts 2016
• Opencast
Generation 1
Generation 2
Generation 3
• E1, W1
• E2, E3 (incl. JV 100%)
• Newman
• 1B
• Hossy
• K3• Rowland• Saffy• 4B
• K4
8
Shafts Focus
4
4
8
8
4
4
4
4
n/a
• Merensky pit closed. UG2 low cost ounces opened –to close in 2017
Status
• Under contract mining – annual re-evaluation
• Delivering operational performance
• 1B – Closed Oct 2015. On care and maintenance
• Orderly closure and placed on care and maintenanceby end of FY17
• Continued operational performance• Continued operational performance• Continued operational performance• Continued operational performance
Tonnesmined in
2015 (’000 tonnes)
8• Lonmin own production stopped Oct 2016. Undercontract mining
Shafts of the future
230
328
1,002
765
220
2,7131,8721,7581,409
953
49
Tonnesmined in
2016 (’000 tonnes)
49
304
827
346
6
2,6871,7312,0551,588
Total Gen 2 7,7528,061
712
–
Total Gen 1/OC 3,4972,244Generation 2 contribution to total tonnes mined
Restructuring programme on track – focusing on core Generation 2 shafts in an oversupplied market
4%
36%
78% 69%

/ 14 Lonmin PlcAnnual Report and Accounts 2016
Our Strategy (continued)
1. Operational Excellence (continued)
Reducing fixed costs•
We remain vigilant in containing our costs. Overheads and support services structures are constantly reviewed toalign with the reduced sales profile.
We delivered cost reductions of R1.3 billion (in financial year 2015 money terms) over the course of 2016, which is 86%ahead of our Business Plan target of R700 million, achieved through the reduction in the size of the Group’s workforce,overhead costs and support service structures, controlling of variable cost in line with lower mining / concentratingproduction and total cost of ownership projects. However, the lower than expected output from mining, due to lowerproductivity achievements, has resulted in a downward revision of our total cost reduction target for the two-yearperiod ended 30 September 2017 from R2.3 billion to R1.8 billion in real terms.
Also reflecting the challenges experienced in achieving efficiencies and productivity improvements in the MiningDivision over the course of the year, the Group’s unit cost per PGM ounce produced exceeded our guidance.While these are industry wide issues, productivity and efficiency improvements remain key focus areas for the Groupgoing forward and a number of initiatives are already underway to address mining’s performance. We are revising theGroup’s unit cost per PGM ounce produced to a range of R10,800-11,300 for the year ended 30 September 2017and will review the guidance for 2018 in due course.
Maintaining reduced capital expenditure•
Capital expenditure will be maintained at the minimum level required for the safe and efficient running of the Group’soperations. Aligning our capital expenditure guidance with costs, this is now being provided in Rand rather than inUS Dollars. The Group expects total capital expenditure for the year ending 30 September 2017 to be increased toapproximately R1.8 billion, which includes R400 related to the BTT project, which should be sufficient to keep theGroup’s existing assets in operation and to comply with legislative, Safety, Health and Environmental and Socialresponsibility requirements without compromising our bank covenants.
The Group continues utilising capital portfolio optimisation tools with the aim of ensuring that capital expenditure isinvested only in the most cash generative development projects available to the Group with the aim of predominantlyfunding capital expenditure through free cash flow generated by operating activities.
At K3 future project capital is expected to be spent on ore reserve development to access an additional two levels(25 and 26) on the UG2 decline, whilst extraction of the Rowland MK2 UG2 resource via the existing Rowland shaftinfrastructure is anticipated to result in production from this area from 2018 onwards.
The Group’s planned capital expenditure includes the expansion capital expenditure for the BTT project. In total,approximately R400 million is included for this project in the total planned capital expenditure for the financial year 2017.
Maintaining operational and strategic flexibility•
We intend to maintain a clear strategic focus on the Group’s mineral resources, mining and processing infrastructureat Marikana. Prior investment in this area means as at 30 September 2016 the Group had IAOR equating to 22.4months of mining at planned levels of production. This provides Lonmin with a competitive advantage, givingoperational and strategic flexibility for market upturn.
Creating, preserving and enhancing long-term equity value•
We seek to identify projects which add value by making use of our excess processing capacity. As part of theseefforts, and in line with our focus on low cost ounces and near term cash, work is underway on the BTT project.Additionally, during the year, we signed a toll treating contract with Jubilee Platinum Plc, which will commence duringfinancial year 2017, producing 12,000 Platinum ounces in 2017 and 17,000 Platinum ounces per annum thereafter.
The BTT involves the re-mining of Lonmin’s Eastern Tailings Dam and the reprocessing of 26 million tonnes of tailingsmaterial at a rate of 300,000 tonnes per month. Once at steady state, the project is expected to deliver the lowestcost ounces in the Lonmin portfolio, producing about 29,000 ounces of Platinum per year or some 55,000 ouncesof PGM (from tailings with a grade of 1.42 grammes per tonne with a recovery rate of 35%). The project is expectedto be mined by a contractor over a seven-year period and to be commissioned and ramped up to full productionduring the 2018 financial year. The Chrome is expected to be recovered in a new Chrome spiral plant and the containedPGMs are expected to be recovered in the Group’s UG2 concentrator. Further to this project, there are a number ofadditional tailings dams available for life extension in the Western Dam, for potential exploitation in the future.

01 /Strategic R
eport02 /
Governance
03 /Financial S
tatements
04 /A Deeper Look
05 /Shareholder Inform
ation
www.lonmin.com
/ 15Lonmin PlcAnnual Report and Accounts 2016
1. Operational Excellence (continued)
Creating, preserving and enhancing long-term equity value (continued)•
Post period end we announced that we had entered into a Sale and Purchase Agreement to acquire AngloAmerican Platinum’s (AAP) 42.5% stake in the Pandora Joint Venture (the Transaction). The Pandora Joint Venturemade an operating loss of R109 million in 2016, with Lonmin’s 50% share being reflected in these accounts.However, Lonmin received a net contribution of R117 million from ore purchase agreements, which offsetsthe joint venture loss. The Transaction allows Lonmin to consolidate its position in this relatively shallow andhigh-grade mineral resource, providing an attractive option for development in both the short and longer term.One of the benefits is that this will facilitate Lonmin being able to access the Pandora Joint Venture ore reserve fromour adjacent Saffy shaft. This is a low- to no- capital option to produce additional ounces and also allows us to defercapital to deepen the Saffy shaft. The Pandora Joint Venture contributed 32,509 Platinum ounces to Lonmin in the2016 financial year.
The agreement is for a deferred cash payment of 20% of the distributable free cash flows generated by the Pandora E3operations on an annual basis for a period of six years, subject to a minimum total deferred consideration of R400 million(in nominal terms) and a maximum total consideration of R1 billion (in nominal terms). AAP will also receive 20% of anyproceeds of any Pandora Joint Venture resources that are disposed of within that six year period. AAP will be grantedcontinued access to, and full operational control of our Baobab concentrator for a further period of three years from the date of completion of the Transaction. AAP will pay Lonmin, with immediate effect, an annual rental fee ofapproximately R46 million. The Transaction is expected to become unconditional during 2017 following the fulfilmentof all conditions precedent.
2. Enhance Balance Sheet Strength
At the beginning of financial year 2016, we carried out a Rights Issue and amended debt facilities to strengthen thebalance sheet.
Our stated aim at that time was to manage the business to be cash flow positive after capital expenditure whilstmaintaining optionality to grow production over time when pricing improves.
We achieved this in 2016 and intend to deliver on this going forward. Our balance sheet will be managed prudentlyand conservatively with future capital expenditure being funded from free cash flow generated by operations.
3. Our People and Relationships
Black Economic Empowerment (BEE)•
Our BEE equity ownership is at least 26% and we strive to maintain this in line with the requirements of theMining Charter.
Continuing to improve relationships with key stakeholders•
Our efforts to solidify and improve relations with our employees and their representative trade unions continue.We accept that building trust and strong relationships is a never ending journey.
We continue to enhance our role as the primary source of communication by seeking to communicate directly withemployees. We believe that this direct engagement, through the existing line management structures and periodiccommunication forums, forms part of the way we work and the basis of creating empowered, high performanceteams. Through the leadership development and team effectiveness training programmes, we continue toencourage our managers to manage this direct engagement.
Management and unions continue to engage on a regular basis at different levels to ensure timely communicationand resolution of issues at appropriate levels.
We also have regular engagement with our majority union, AMCU, in line with our Relationship Charter.

/ 16 Lonmin PlcAnnual Report and Accounts 2016
Our Strategy (continued)
3. Our People and Relationships (continued)
Transformation•
Lonmin embraces transformation as a business imperative and has made significant progress in this regard. We arecommitted to playing our part in addressing historic inequalities and creating the conditions in which current andfuture generations can succeed in creating a shared purpose. The Mining Charter requires a focus on increasing thenumber of Historically Disadvantaged South Africans (HDSAs) in management and the number of women in mining.
Transformation is monitored and overseen at Board level by the Social, Ethics and Transformation Committee.Transformation considerations are incorporated into recruitment, succession, skills development and talentmanagement functions to develop an internal pipeline of HDSAs, including women. Lonmin’s bursary and graduatedevelopment programmes prioritise HDSAs in order to build the future supply of appropriate candidates. Targetsrelating to transformation are included in the Corporate Balanced Scorecard that is used to measure performancefor the incentive scheme.
People•
Our mining model is labour intensive and our people make the difference and are the vehicle by which our strategy is effected through the day to day operations.
The Company values the contribution made by all its employees and recognises that morale and retention remainunder pressure as a result of the reorganisation and continuing cost constraints, which have limited salary increasesand development opportunities.
We believe that our employees deserve decent living standards and should have a choice of how and where theywant to live. These choices should allow for personal circumstances, affordable and market-related rates andintegration into the broader society during their employment with us. Lonmin and its organised labour are reviewingemployee living standards as part of its new human settlement strategy.
Progress against our human resources targets is measured through monthly reporting of key internal indicators aswell as integrating certain targets as part of the Lonmin corporate objectives. Lonmin’s human resources strategy,policies and procedures align with our operating country’s labour laws and other relevant frameworks, guidelines and codes of practice. These include in South Africa, the social development requirements of the Minerals andPetroleum Resource Development Act (MPRDA) that are defined in the Company’s Social and Labour Plan (SLP),the human rights provision in the International Council on Mining and Metals principles of sustainable developmentand the United Nations Global Compact.
The Company also reports to the Department of Minerals and Resources (DMR) against the broad-based economicdevelopment requirements of the Mining Charter, which include housing and living conditions, employment equityand human resource development (HRD).
As announced in October 2013, Lonmin remains committed to spending R500 million over the five-year period to2018 towards employee accommodation and community bulk services.
4. Our Corporate Citizenship Agenda
Stakeholder engagement and corporate communication•
Our business begins and ends with relationships and the quality of those relationships are central to our success andthat of our stakeholders. Genuine stakeholder engagement and relationship building has allowed us to understandstakeholder expectations and to communicate on key issues transparently, consistently and in a timely manner.
Social licence to operate•
Maintaining our social licence to operate through securing the trust and acceptance of communities andstakeholders is material as they host our operations. This is achieved through:
stakeholder engagement to ensure realistic expectations are understood and managed;•
community investment initiatives to address social issues;•
transformation initiatives to meet the Government’s social and economic development goals;•
ethical business practices that include a commitment to upholding human rights; and•
corporate and community partnerships.•
This is very much work in process and is based on an acknowledgement that trust must be restored andcommunities healed.
01 /Strategic R
eport02 /
Governance
03 /Financial S
tatements
04 /A Deeper Look
05 /Shareholder Inform
ation
www.lonmin.com
/ 17Lonmin PlcAnnual Report and Accounts 2016
4. Our Corporate Citizenship Agenda (continued)
Social Labour Plans (SLP)•
Our commitment to corporate citizenship defines our duty to contribute to the wellbeing and development of thecommunities that host, and are affected by, our operations. This duty is formalised in the SLP obligations under the terms of our mining rights. Our broader social licence to operate depends on strong relationships with our hostcommunities. The Company’s ability to build financial capital in the long-term is critically dependent on a predictableand stable operating environment, which is only possible if we have good relationships with our immediatecommunities and labour sending areas.
Investing in the long-term social, economic and infrastructural development of our host communities translates into an investment in our current and future employee base, and ultimately is a direct investment in the sustainabilityof the mines themselves.
Human Rights•
Lonmin is committed to respecting the human rights of both its workforce and those who may be affected by its operations, and continues to seek to implement the United Nations Guiding Principles on Human Rights (the Guiding Principles) throughout its operations.
In August 2015, a human rights working group was established, comprising representatives from all areas of thebusiness including risk, security, health and safety, environment, labour, community, supply chain, legal, companysecretarial and communications.
Lonmin’s current human rights policy was adopted by the Board in November 2015. The policy is explicitly informed by the Guiding Principles, as well as the United Nations Universal Declaration of Human Rights and other international instruments. Respect for human rights is also enshrined in Lonmin’s Code of Business Ethics.
Lonmin recently commissioned a gap analysis study, which was undertaken and completed during financial year2016. This study sought to analyse Lonmin’s human rights policy and procedural framework in the context of theGuiding Principles and best practice in the mining industry. The findings are currently being assessed by the internal working group.
As part of the ongoing process, Lonmin is embarking on development of an internal human rights due diligencechecklist to help ensure full compliance with the relevant policies and systems. A pilot study, focusing on the issueof women in mining, has been commissioned and is expected to be carried out early in financial year 2017. A newhuman rights training programme in relation to the Guiding Principles is also scheduled to be rolled out to Lonmin’smanagers and executives during financial year 2017.
Modern Slavery Act and procurement•
As stated in the human rights policy, Lonmin’s human rights commitment includes a prohibition on modern slavery in all its forms, including human trafficking and forced or compulsory labour. Lonmin also seeks to ensure that itscounterparties conduct their own operations in line with these standards.
Lonmin’s vendor approval process already requires potential suppliers to answer specific questions in relation tohuman rights, including whether the supplier has its own human rights policy and whether it provides human rightstraining to its staff. In addition, the standard terms and conditions applicable to contracts with suppliers requireLonmin’s counterparties to adhere to a range of legislation relevant to human rights, including the South AfricanLabour Relations Act (66 of 1995), the Basic Conditions of Employment Act (75 of 1997), the Compensation forOccupational Injuries and Diseases Act (130 of 1993), as well as Lonmin’s own Sustainable Development Standardsand Code of Business Ethics. These acts and standards contain wide-ranging human rights stipulations, including asto health and safety at work, working hours, freedom of association, the prohibition of child labour, non-discriminationand freedom from forced labour and corporal disciplinary practices.
In addition to the above, Lonmin is currently undertaking a review of its procurement application processes, with the intention of further improving its ability to identify and exclude from its supply chain product and serviceproviders whose operations fall short of meeting Lonmin’s standards.
Further details, including the Lonmin’s human rights policy, can be found on Lonmin’s website:
www.lonmin.com
/ 18 Lonmin PlcAnnual Report and Accounts 2016
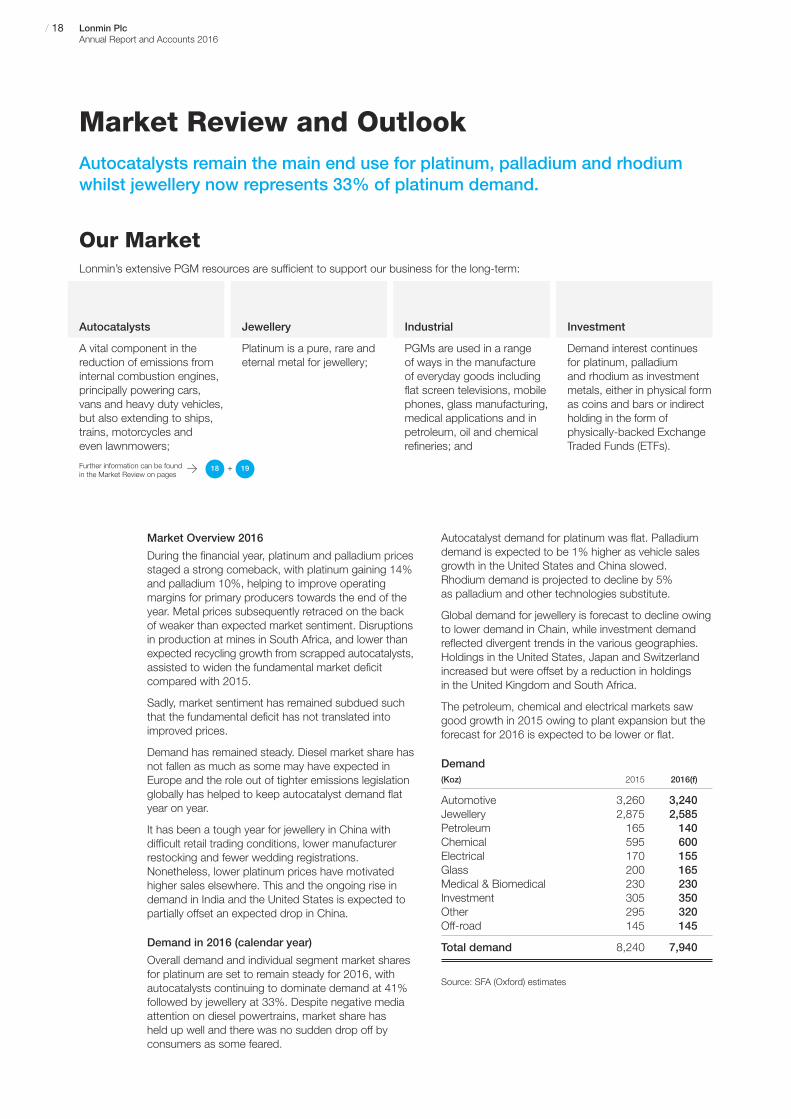
Market Review and OutlookAutocatalysts remain the main end use for platinum, palladium and rhodiumwhilst jewellery now represents 33% of platinum demand.
Our MarketLonmin’s extensive PGM resources are sufficient to support our business for the long-term:
Autocatalysts
A vital component in thereduction of emissions frominternal combustion engines,principally powering cars,vans and heavy duty vehicles,but also extending to ships,trains, motorcycles andeven lawnmowers;
Investment
Demand interest continuesfor platinum, palladiumand rhodium as investmentmetals, either in physical formas coins and bars or indirectholding in the form ofphysically-backed ExchangeTraded Funds (ETFs).
Industrial
PGMs are used in a rangeof ways in the manufactureof everyday goods includingflat screen televisions, mobilephones, glass manufacturing,medical applications and inpetroleum, oil and chemicalrefineries; and
Jewellery
Platinum is a pure, rare andeternal metal for jewellery;
Market Overview 2016
During the financial year, platinum and palladium pricesstaged a strong comeback, with platinum gaining 14%and palladium 10%, helping to improve operatingmargins for primary producers towards the end of theyear. Metal prices subsequently retraced on the backof weaker than expected market sentiment. Disruptionsin production at mines in South Africa, and lower thanexpected recycling growth from scrapped autocatalysts,assisted to widen the fundamental market deficitcompared with 2015.
Sadly, market sentiment has remained subdued suchthat the fundamental deficit has not translated intoimproved prices.
Demand has remained steady. Diesel market share hasnot fallen as much as some may have expected inEurope and the role out of tighter emissions legislationglobally has helped to keep autocatalyst demand flatyear on year.
It has been a tough year for jewellery in China withdifficult retail trading conditions, lower manufacturerrestocking and fewer wedding registrations.Nonetheless, lower platinum prices have motivatedhigher sales elsewhere. This and the ongoing rise indemand in India and the United States is expected topartially offset an expected drop in China.
Demand in 2016 (calendar year)
Overall demand and individual segment market sharesfor platinum are set to remain steady for 2016, withautocatalysts continuing to dominate demand at 41%followed by jewellery at 33%. Despite negative mediaattention on diesel powertrains, market share hasheld up well and there was no sudden drop off byconsumers as some feared.
Autocatalyst demand for platinum was flat. Palladiumdemand is expected to be 1% higher as vehicle salesgrowth in the United States and China slowed.Rhodium demand is projected to decline by 5%as palladium and other technologies substitute.
Global demand for jewellery is forecast to decline owingto lower demand in Chain, while investment demandreflected divergent trends in the various geographies.Holdings in the United States, Japan and Switzerlandincreased but were offset by a reduction in holdingsin the United Kingdom and South Africa.
The petroleum, chemical and electrical markets sawgood growth in 2015 owing to plant expansion but theforecast for 2016 is expected to be lower or flat.
Demand(Koz) 2015 2016(f)
Automotive 3,260 3,240Jewellery 2,875 2,585Petroleum 165 140Chemical 595 600Electrical 170 155Glass 200 165Medical & Biomedical 230 230Investment 305 350Other 295 320Off-road 145 145
Total demand 8,240 7,940
Source: SFA (Oxford) estimates
> 18 19+Further information can be foundin the Market Review on pages
01 /Strategic R
eport02 /
Governance
03 /Financial S
tatements
04 /A Deeper Look
05 /Shareholder Inform
ation
www.lonmin.com
/ 19Lonmin PlcAnnual Report and Accounts 2016
Supply in 2016 (calendar year)
A recovery in PGM prices has helped to provide periodsof improved Rand free cash flow to producers in SouthAfrica, with expansion projects more forthcomingtowards the end of the financial year.
Primary platinum supply will continue to shrink owing toextended under investment and this will ultimately driveprices higher.
During 2015 and throughout 2016, recycling growthrates were constrained by the ongoing low scrap steelprices, limiting the amount of end-of-life autocatalystsbeing collected by recyclers. However a recentrecovery in both scrap steel and PGM prices hashelped kick-start a recovery in autocatalyst collectionrates but scrap steel prices remain well below pre-2015levels, thus continuing to hold back PGM recycling.
Supply(Koz)
Region 2015 2016(f) Variance
South Africa 4,465 4,250 -4.8%Zimbabwe 405 475 17.3%North America 365 395 8.2%Russia 710 680 -4.2%Other 200 200 0.0%
Primary Supply 6,145 6,000 -2.4%
Recycling 1,705 1,745 2.3%
Total Supply 7,850 7,745 -1.4%
Source: SFA (Oxford) estimates
Sales
In 2016 Lonmin sold 735,747 ounces of Platinum intothe market. Platinum sales contributed 65% to turnover.Palladium was the second highest contributor to therevenue basket with the 334,319 ounces sold,constituting 18% of Lonmin’s income. Combined salesof Rhodium, Ruthenium and Iridium contributed a further12.5% and Gold and base metals made up the balance.
PGM Prices
During the financial year platinum outperformed bothpalladium and rhodium. However, the average price of each metal was substantially lower than was seen in FY2015. Refer to the Financial Review section (pages 32 to 37 for details on average prices.
Platinum in October 2015 was at $908 per ounce,but fell to a multi-year low of $814 per ounce on21 January 2016, before rallying and closing at $1,034on 30 September 2016. The Rand started at 13.92 tothe US Dollar in October 2015 and fell to a record lowof R16.87 on 18 January 2016 against the US Dollar,dragging the platinum price down in US Dollar terms.
The South African economy remained weak and theaverage exchange rate achieved for FY2016 was14.77 to the US Dollar.
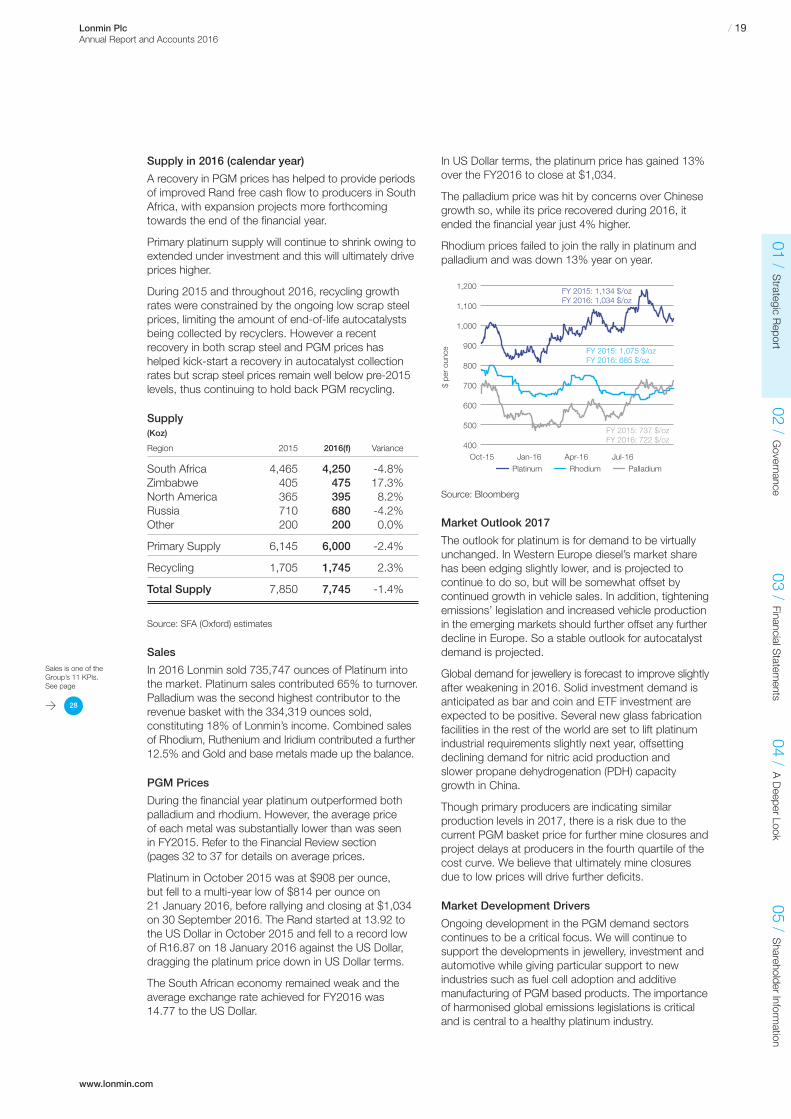
In US Dollar terms, the platinum price has gained 13%over the FY2016 to close at $1,034.
The palladium price was hit by concerns over Chinesegrowth so, while its price recovered during 2016, itended the financial year just 4% higher.
Rhodium prices failed to join the rally in platinum andpalladium and was down 13% year on year.
Source: Bloomberg
Market Outlook 2017
The outlook for platinum is for demand to be virtuallyunchanged. In Western Europe diesel’s market sharehas been edging slightly lower, and is projected tocontinue to do so, but will be somewhat offset bycontinued growth in vehicle sales. In addition, tighteningemissions’ legislation and increased vehicle productionin the emerging markets should further offset any furtherdecline in Europe. So a stable outlook for autocatalystdemand is projected.
Global demand for jewellery is forecast to improve slightlyafter weakening in 2016. Solid investment demand isanticipated as bar and coin and ETF investment areexpected to be positive. Several new glass fabricationfacilities in the rest of the world are set to lift platinumindustrial requirements slightly next year, offsettingdeclining demand for nitric acid production andslower propane dehydrogenation (PDH) capacitygrowth in China.
Though primary producers are indicating similarproduction levels in 2017, there is a risk due to thecurrent PGM basket price for further mine closures andproject delays at producers in the fourth quartile of thecost curve. We believe that ultimately mine closuresdue to low prices will drive further deficits.
Market Development Drivers
Ongoing development in the PGM demand sectorscontinues to be a critical focus. We will continue tosupport the developments in jewellery, investment andautomotive while giving particular support to newindustries such as fuel cell adoption and additivemanufacturing of PGM based products. The importanceof harmonised global emissions legislations is criticaland is central to a healthy platinum industry.
$ pe
r ou
nce
FY 2015: 737 $/ozFY 2016: 722 $/oz
RhodiumPlatinum
400
500
600
700
800
1,000
900
1,100
1,200
Palladium
FY 2015: 1,075 $/ozFY 2016: 685 $/oz
FY 2015: 1,134 $/ozFY 2016: 1,034 $/oz
Oct-15 Jan-16 Apr-16 Jul-16
> 28
Sales is one of theGroup’s 11 KPIs.See page

/ 20 Lonmin PlcAnnual Report and Accounts 2016
Principal Risks and ViabilityLonmin’s top principal risks are described on the following pages together withtheir potential impact, mitigating strategies and the perceived change in theserisks since the previous financial year.
These risks have been ranked on a residual basis according to the magnitude of potential impact, probability and taking intoaccount the effectiveness of existing controls. The risks represent a snapshot of the Company’s current risk profile. This is not anexhaustive list of all risks the Company faces. As the macro environment changes and country and industry circumstances evolve,new risks may arise or existing risks may recede or the rankings of these risks may change.
Ranked Risks
1. Operational execution
2. Price and market volatility
3. Employee and union relations
4. Safety performance
5. Community relations
6. Utilities
7. Changes to the political, legal, social and economic environment,including resource nationalism
8. Lack of geographical and product diversification
9. Loss of critical skills
Description
Failure to deliver against production and cost targets can result from a variety of reasons, including, poor productivity,high absenteeism, safety stoppages,industrial action, difficult geologicalconditions as well as ineffective control of operational expenditure.
Impact
Poor operational delivery can lead to notachieving the Business Plan deliverableswhich includes a decline in profitability and cash generation, which in turn posethreats to our liquidity position and impacts profitability.
Mitigation
Critical measures implemented to addressthis exposure were:
Enhanced focus on improving•operational attendance levels whichincluded the root cause analysis and mitigation of absenteeism;
Change
This risk remains unchanged due to the ongoing impact of the Section 54operational stoppages experienced as wellas other operational challenges experienced.The downside risk was however offset to some extent through the excellentProcessing performance during the year.
KPI
Refined Pt, Productivity, Unit Cost R/oz,Capex
Further information
> 38
The rollout of operational performance•bonuses at targeted operational levels.Rigorous performance monitoringagainst business plan targets (cost and production);
A more rigorous approvals framework•(delegation of authority) wasimplemented;
Continued DMR engagement •to address safety stoppages andincreased operational focus toimprove overall safety performanceand culture;
Productivity improvement plans have•been established to enhance currentresource efficiency;
Operational oversight was improved•through rigorous tracking of crewperformance by the Business SupportOffice; and
As part of ensuring that potential•operational bottlenecks are managed,the Theory of Constraints methodwas implemented across variousoperational areas.
1. Operational execution – The ability to deliver required operational performance (production and efficiency) could addor destroy value to Company shareholders
43-

01 /Strategic R
eport02 /
Governance
03 /Financial S
tatements
04 /A Deeper Look
05 /Shareholder Inform
ation
www.lonmin.com
/ 21Lonmin PlcAnnual Report and Accounts 2016
Description
Commodity price and currency volatilityexacerbates the uncertainties in managinga mining business. This is especiallybecause mining requires long planninghorizons to plan new mines and makedecisions regarding the expansion andcontraction of existing operations. Thesedecisions often need to be made based onassumptions regarding future metal prices(which drive revenue) and exchange rates(in our case primarily the USD/Randexchange rate as the majority of our costand capital expenditure are incurred inSouth African Rand). When these cashflows are less than anticipated, it can havea significant negative financial impact on the business.
Impact
The uncertainty related to metal price and exchange rate assumptions used inlong-term planning can lead to incorrectplanning decisions and have negativefinancial consequences. In addition, volatilemetal prices may also affect the decisionsmade by our customers and may result inthem considering substituting our productswith other alternatives.
This information serves as input •to the forecasting processes;
A detailed cost response strategy •has been implemented, including the responsible closure of Hossy shaft,resizing of concentrator capacity andall overheads;
In addition, the Company has•embarked on developing an in-housemarket intelligence portal to assist inimproving its ability to forecast prices;and
The Company is refocusing its market•development strategy to focus onareas with maximum potential.
Change
Risk in this area remains unchanged from 2016 as metal and currency marketscontinue to remain volatile accompanied bythe significant decline in the platinum price.This was more than offset by theweakening of the Rand.
KPI
Pt $ Price, R/$ FX, Basket Price
Further information
> 18
Mitigation
Measures implemented to addressexposure:
Quarterly review of supply and•demand dynamics of key productsand the factors that could affect metal price volatility and forecastingprocesses;
Longer term volume contracts with•key customers to mitigate off-take risk;
Weekly short-term cash flow forecasts•to manage liquidity and pro-activelyflag negative cash flow impacts;
Monthly Price Risk Committee•meetings, as well as consideration offorward selling and hedging strategiesas and when appropriate;
The Company collects market•information from a number of differentsources to better understand thesupply and demand dynamics of keyproducts and the factors that couldaffect metal price volatility. Thisincludes the participation in variouslocal and international Platinum related forums and associations;
2. Price and Market Volatility – Fluctuations in the USD/Rand exchange rate may result in favourable or unfavourable cash flows
19+
Description
The industrial relations environment has stabilised over the last 12 months as evidenced by the improved dialoguebetween unions and Companymanagement. Whilst the environment hasremained stable, the potential for volatilityremains, which could result in disruptionsto operations and have a material adverseeffect on the Company’s financial position.
Impact
Various internal as well as external factorscould influence the employee relationsspace and could lead to disruption ofoperations and breakdown of employer-union relations.
Change
The Industrial Relations environment has improved as the Company concluded a three-year wage agreement.
KPI
ER Structures (Number of meetings)
Further information
> 44
Mitigation
To ensure open and transparent dialogue,appropriate structures have been establishedto enable effective union engagement acrossall levels. These structures includes a FutureForum which enabled the consultationprocess for voluntary severance as well asthe Section 189 process. A relationshipbuilding programme and charter to governrelations between unions and the Companyhave been established. As part of enhancingemployee ownership, a Employee ProfitShare Scheme has been established.
3. Employee and Union relations – Optimal relations can significantly enhance operational execution and improveemployer – employee relationships, whilst a breakdown in relations could result in production stoppages as well as a breakdown of trust
46-
/ 22 Lonmin PlcAnnual Report and Accounts 2016
Principal Risks and Viability (continued)
Description
Employee injuries and / or work stoppagesdue to Section 54’s will impact theCompany’s ability to achieve productionand financial targets.
Impact
Poor safety performance has a direct impacton the life of employees, contractors andtheir families and risks such as fall-of-ground,tramming, working at heights, scraping andrigging incidents, exposure to gases, fire,molten metal, electrocution and many otherhazards have to be controlled to reduceand eliminate fatalities and injuries. A failurein safety processes could result in injuryor loss of life, which would have tragicimplications for employees, their families and the communities. It would also severelydisrupt operations and could result in safetystoppages which have a direct impact on thepeople, cost and reputation. The failures in safety procedures may be caused byemployees or poor management practices.DMR could also temporarily suspend partor all of the operations under the MineHealth and Safety Act (commonly referredto as a Section 54 stoppage) and this havean impact on the working rhythm, cost andproduction. This suspension could potentiallyresult in Lonmin’s Operating licencebecoming under scrutiny by the regulator.
Change
Collaboration between Lonmin, theregulator and unions have started to show results, as we have experienced areduction in the duration and frequency ofSection 54 stoppages and more localisedapplication of the stoppages in the fourthquarter on the year.
KPI
LTIFR
Further information
> 30
Mitigation
Safety awareness and training such as rollout of the Du Pont leadershipprogramme, called the Lonmin SafetyLeadership DNA programme. Thisprogramme develops individual’s safetycompetencies, knowledge of the safetytheory, how to apply it and practise safetymanagement. Structured workplacecoaching is also part of this programmewhich is conducted one-to-one to bridgeindividual competency gaps and to improvesafety performance over time. Training hasbeen delivered to executive and seniormanagement, union health and safetystructures and 16 ‘train the trainers’candidates. Safety Improvement Plans are being implemented with an enhancedfocus on accident analysis and pro-activepreventive measures. Visible FeltLeadership (VSL) is such a pro-activemeasure which has been acceleratedduring this year. VSL is senior managementbeing visible in the operational areasconfirming that safety is a core belief andshowing passion to work safely. Safetyaudits are also conducted and includeinternal and external audits that measurethe safety maturity of each operationalbusiness unit. Cross-site safety auditssupport learnings across the operationsand the sharing of best practices.
4. Safety Performance – A good safety performance increases employee morale and productivity and lowers costs whilst a poor safety performance reduces productivity, damages company reputation and results in unfavourableregulatory intervention
31+
01 /Strategic R
eport02 /
Governance
03 /Financial S
tatements
04 /A Deeper Look
05 /Shareholder Inform
ation/ 23Lonmin Plc
Annual Report and Accounts 2016
Description
Mining is conducted in areas wherecommunities are present and thecommunities have various expectationsof the mines, such as employmentopportunities, socio-infrastructure supportand business opportunities. When theseexpectations are not met, it may result inconflict and unrest.
Impact
As many of our employees live locally, any disruptions within the communities can have a direct impact upon production.The failure to deliver social upliftmentprojects, triggering protests or violence and corporate reputational damage canresult, if the relationship with thesestakeholders is not managed effectively.Lonmin has acknowledged the importantrole of communities as a critical stakeholderand has implemented various engagementplatforms and development initiatives toensure appropriate upliftment. Procurementhas become another focus area ascommunities view it as an opportunity to improve their livelihood throughimproved income. Lonmin has identifiedthis need and has introduced procurementopportunities for communities.
Mitigation
The development of a revised stakeholderstrategy with emphasis on continuous
Ba Mogale resulted in community trustsbeing entitled to a minimum of R5 millionper annum and the provision of R1.65 billionworth of procurement contracts.
Change
Our relationships with local communities that surround our operations have improvedtremendously since the 2014 transaction.However, the socioeconomic challengesthat face the Bojanala district in whichLonmin resides, have put a lot of pressureon the community and its leadership to an extent that the gains seem to be erodedby the challenges. The procurementopportunities given to the Bapo community,particularly the visible bus service, havegiven hope to the communities that Lonminis keeping its promises. The level of trustbetween the communities and Lonmin hasimproved significantly. Despite this, Lonminstrives for improvement with pressure fromthe regulator as well as access toopportunities through local procurement.Lonmin needs to develop and implement a clear strategy around this, to meet localand DMR expectations.
KPI
SLP Expenditure: Health, Education and Social Infrastructure
Further information
> 44
engagement at all levels and all communities(Bapo and non-Bapo communities) as wellas involvement of the communities in theimplementation of the SLP. Greaterconsultation with stakeholders whichincludes upliftment measures to beinitiated. This approach has increasedcommunity ownership of both thechallenges facing communities and thesolutions provided as part of the SLPimplementation plan.
As part of enhancing relations withcommunities, the Company has reviewedits engagement process and implementeda revised stakeholder managementprocess. In order to improve governanceand project execution of community relatedinvestments, a procurement frameworkwith appropriate project management office capabilities have been established.
Other aspects of community investmentincluded the establishment of a CadetteTraining programme as part of theCompany enhancing its potential futureemployment capacity. Formal engagementstructures have also been established inthe form of bilateral forums with Bapo,Madibeng and Rustenburg communities.The engagement meetings addressesemployment, economic development,community infrastructure programmes andthe SLP status. The transaction with Bapo
5. Community relations – A sound relationship with surrounding communities will enhance relations and organisationalreputation whilst a failure to do so could result in disruption of operations or community unrest
49-
Description
The higher than inflation tariff based increasesin electricity and the Company’s inability toreduce this cost any further, have impactedthe operating costs of Company operations.A stable electricity environment, in terms ofpricing is critical in ensuring its long-termsustainability. Water utilisation has also beenchallenging, both from an infrastructure pointof view as well as availability. Capacitydeterioration within local municipalities is alsoadding to this challenge. The establishmentof informal settlements resulted incommunities requesting water and electricitysupply as a basic need and keeps adding to the burden of local municipalities andindustries for service delivery.
Impact
Supply constraints in respect of energy or water could impact upon our ability tooperate effectively and meet our productiontargets. Furthermore, cost increases inrespect of these utilities impact our margins.Water availability is becoming a criticalcomponent of any business to survive and still remains a basic human need.
From a water optimisation perspective,the Company has implemented waterconservation and demand managementinitiatives. The process as to how wateris being monitored and managed isaligned with how power is being managedin the business.
Change
Current supply constraints and proposedtariff increases in respect of energy andwater have a significant impact on theCompany’s ability to operate effectively andto meet our production targets. From anenergy perspective the risk in this arearemains unchanged due to aging powerstations that could result in an increase inthe amount of unplanned outages, howeverfrom a water perspective it has increaseddue to lower precipitation levels and ongoingimpact of climate change.
KPI
Water and Electricity usage
Further information
> 50
Mitigation
Ongoing implementation of the electricityconservation programme as well as wateroptimisation through demand management.An integrated water management plan forLonmin has been developed with the goalto reduce Rand Water reliance as far aspossible, within the operations, and tomaximise the recovery and re-use of allother sources of water. Longer term plansto treat some streams of these alternativesources to potable level to make thebusiness more independent of Rand Water.Explore further opportunity to supplycommunities out of such streams. As partof ensuring optimal electricity usage, Lonminis a member of the Eskom energy intensiveuser groups, as well as conducts Monthlyand Daily electricity consumption andreporting. Additional initiatives to ensureoptimal usage is the Electricity conservationprogramme and loadshedding contractualagreements to manage supply sideconstraints. As part of ensuring appropriatecontinuity during an outage, the Companyhas implemented risk based scenarioplanning based on available Eskom capacity.
6. Utilities – Access to secure energy and water as well as the optimal use of the input resources are critical for mining operations
www.lonmin.com
/ 24 Lonmin PlcAnnual Report and Accounts 2016
Principal Risks and Viability (continued)
Description
The Company is subject to the risksassociated with conducting business inSouth Africa, including but not limited tochanges to the country’s laws and policiesregarding taxation, royalties, divestment,repatriation of capital and resourcenationalism. The latter is a broad term thatdescribes the situation where a governmentattempts to assert increased authority, controland ownership over the natural resourceslocated in its jurisdiction.
The MPRDA Amendment Bill currentlyremains the subject of Parliamentary debate.In particular, beneficiation is a majorconsideration with the Bill proposing that theMinister be granted a discretion to declarecertain minerals as strategic, that the Ministerdetermine what percentage of strategicminerals are to be made available locally and the developmental price at whichstrategic minerals are to be sold, as well as the Minister being able to determine theconditions applicable to export permits. In addition, the Davis Commission is currentlylooking at the tax regime with a view todetermining whether additional taxesincluding a carbon tax should be imposed onmining companies. The mining industry isalso awaiting clarity of the interpretation of theapplicability of the “Once Empowered AlwaysEmpowered (OEAE)” principle. Currentlyengagements on not only the OEAE principle,but the new Mining Charter are taking place.The DMR has also recently come under
Mitigation
Lonmin participation in the Chamber ofMines process to engage the DMR withregards to concerns regarding the revisedMining Charter, as well as broadengagement with government regarding this exposure. Appropriate governancestructures in the form of Executive andBoard Committees are being established to ensure ongoing reporting of progressagainst agreed SLP targets. Bilateral andindustry level discussions with the DMR andother government agencies are ongoing.Lonmin and other mining companies arecontinuing to engage with the South Africangovernment and the broader community in order to raise awareness of the risksassociated with resource nationalism.
Change
The risk in this area has increased due touncertainty regarding certain policy decisionsi.e. BEE requirements and strategic minerals. Other factors include the impact of politicalparty actions, as well as the lack of clarity in terms of our social licence to operate.
KPI
Not applicable
Further information
> 46
pressure to demonstrate that it is takingaction to monitor compliance withundertakings made in the SLP’s submitted bymining companies. This has led to the DMRissuing s93 Notices to mining companies ona more regular basis. Lonmin has receiveds93 notices in respect of its Housing andLiving Conditions obligations and continuesto engage with the DMR to reach aconstructive solution. In addition, theDepartment of Trade and Industry isattempting to legislate a policy of creatingblack industrialists.
Impact
The ongoing debates in respect of resourcenationalism have created policy uncertaintyand this has inevitably led to a decline in investor appetite for South Africaninvestment risk. If some of the issues underconsideration are implemented, this couldhave a material adverse effect on the Group’sfuture. For example, profits could benegatively impacted by the imposition of additional taxes and revenue could beimpacted by the sale of metals at discounteddevelopmental prices. The obligation to sell locally could impact long-term supplyagreements with our customers and give rise to concerns about security of supplyfrom South Africa, potentially expediting the growth of the recycling industry and increasing substitution concerns.
7. Changes to the political, legal, social and economic environment, including resource nationalism
49-
01 /Strategic R
eport02 /
Governance
03 /Financial S
tatements
04 /A Deeper Look
05 /Shareholder Inform
ation
www.lonmin.com
/ 25Lonmin PlcAnnual Report and Accounts 2016
Description
Lonmin’s principal operating subsidiaries areconcentrated in one geographical location,which increases the level of risk of localiseddisruptions having an impact on the majorityof our operations. In addition, Lonmin is aPGM producer and does not have exposureto other commodities or sectors.
Impact
Local events in the vicinity of Marikana have the potential to disrupt Lonmin’soperations in this area, which represent all of the Company’s operating mines aswell as the majority of our processingoperations. Such a disruption couldsignificantly impact the Group’s operatingand financial performance.
Change
The risk remain unchanged due toconcentration risk of Marikana Operations.
KPI
Not applicable
Further information
> 11
The Group is also a focused PGM producerand is not exposed to other commodities.In times when the PGM market isdepressed the Company’s financialperformance is likely to be negativelyimpacted as it does not have exposure to alternative commodities that may have a different economic cycle and offset thisPGM pricing weakness.
Mitigation Plans
The Company continues to review itsportfolio of projects, which includesLimpopo and Akanani. These projects arelocated in other parts of South Africa and if developed would provide some degree of geographic diversification. Otheropportunities that could mitigate the riskarising from lack of geographical andproduct diversification are also reviewedfrom time to time.
8. Lack of geographical and product diversification
14-
Description
Due to the depressed mining sector, the risk of the loss of critical skills remainshigh. Uncertainties related to a Company’sfinancing and sustainability following therecapitalisation of the business earlier thisyear contributed to employees looking fornew opportunities.
Impact
The loss of critical skills could negativelyimpact safety, production and the ability to deliver against targets. In order to retainour skilled labour, we continuously reviewmarket related remuneration packages as compared to the incentive and retentionschemes offered by Lonmin. Thiscontinuous monitoring of remunerationpractices and matching the packagesoffered by our peers in order to attract and retain employees of a suitable calibrecan result in increased costs.
Change
The risk remains high despite a general highnumber of job losses in the mining sector.One is not always able to replace criticalskills who understand the business and theenvironment with resources available in themarket and therefore it remains a key risk to the organisation.
KPI
Critical skills employee turnover level
Further information
> 44
Mitigation
Implementation of a scheme to retain key critical skills. Ongoing review andanalysis of our remuneration practices inorder to ensure that we remain competitiveand are able to attract and retain the skillsrequired during this challenging time.We also use counter-offers selectively inorder to retain the most critical employees. The implementation of an employeevalue proposition which focuses onemployee wellbeing.
As part of ensuring the development and retention of critical skills IndividualDevelopment Plans, succession planningand retention strategies for scarce skillshave been established. Ongoing monitoringof remuneration practices which matchesLonmin peers are monitored in an ongoingmanner. Graduate development, mentorshipprogrammes and internship programmeshave also been established to ensuredevelopment of existing and future humanresources capacity.
9. Loss of Critical Skills
48-
/ 26 Lonmin PlcAnnual Report and Accounts 2016
Principal Risks and Viability (continued)
Principal risks facing the Group
The Board monitors the Group’s risk management and internal control systems on an ongoing basis, and carries out a robust assessment of the principalstrategic risks, their potential impact and the mitigatingstrategies in place as described on pages 20 to 25.The principal risks include those that would threaten theGroup’s strategic business model, future performance,liquidity and solvency.
For the purposes of assessing the Group’s viability, theDirectors considered in detail all of the principal risksin three groups. Some of these, for example changesin government policy, are not sensibly analysednumerically but could have serious repercussions(for example resource nationalisation and other threatsto our licences). However, other elements such asPGM prices and exchange rates can be modelledto show the limits of our financing arrangements, andthe management presented to the Board an array ofscenarios and stress tests to illustrate this. The Directorsconsidered also the correlations between theseparameters, which provide some natural offsets insome cases. The Directors further considered thoseelements that are essentially within our control,such as costs, safety and productivity drivers of ourbusiness. These matters are kept under constantreview and are specifically considered as part of theBoard Strategy Review.
Sufficiently adverse movements in these parameters,if not countered by timeous management action, andif persisting for a lengthy period, can threaten theviability of the organisation, as can some of thenon-measurable risks. The management has establishedregular cash flow forecasting tools, and the Boardconsiders these matters as part of the budgeting andresults oversight process to ensure that any suchtrends receive urgent attention.
As described on pages 11 to 17, the Board andExecutive Management have a Business Plan to dealeffectively with the principal risks outlined above.
How we assess the Group’s prospects
The Board Strategy Review is performed on an annualbasis where the Board and Executive Managementdiscuss and debate the Group’s strategy. The BoardStrategy Review considers scenario analysis toencompass a wide spectrum of potential outcomes for key global uncertainties. Over the last year theBoard established a sub-committee to oversee strategydevelopment and execution which meets more regularlythan the full Board. This ensures that all options availableto the Group to improve viability and value creation arecontinuously reviewed. This includes consideration ofall strategic options ranging from business structurethrough to merger, sale and acquisition opportunities.
Executive Management annually prepares a Life ofBusiness Plan (LoBP) which covers a period in excessof 40 years detailing operational plans to exploit theGroup’s long-life mineral resources. The LoBP forecaststotal mining production volumes and costs over the lifeof the mine based on geological modelling and capitalexpenditure budgets. Capital allocation is determinedbased on portfolio optimisation models with the aim ofensuring that capital expenditure is invested only in themost valuable ore reserve development and expansionprojects that are available to the Group.
Mining production and cost forecasts are thenaggregated with concentrating, processing andoverhead costs. Key financial assumptions includingPGM prices, Rand / Dollar exchange rates and costescalations are reviewed and incorporated into theLoBP. The LoBP output is incorporated into a WorkingCapital Model (WCM) which produces short andmedium term financial forecasts. A detailed annualbudget covering the following year is prepared andreviewed by the Board on an annual basis.
The key assumptions applied in the LoBP and WCMare disclosed on note 31 to the financial statementsunder impairment of non-financial assets on page 168.During the Board Strategy Review described above theDirectors have interrogated the key assumptions andhave satisfied themselves that they are appropriate.
The financial forecasts from the WCM are thensubjected to stress testing using the key downsiderisks listed below which are tested both separatelyand in combination:
weaker US Dollar PGM prices;•
a stronger Rand / US Dollar exchange rate;•
lower than planned production; and•
higher than planned cash costs.•
Viability Statement

01 /Strategic R
eport02 /
Governance
03 /Financial S
tatements
04 /A Deeper Look
05 /Shareholder Inform
ation
www.lonmin.com
/ 27Lonmin PlcAnnual Report and Accounts 2016
The period over which we assess longer term viability
Within the context of the planning cycle described above,the Board has and continues to review all potentialstrategic options, the resource extraction plan andproduction metrics over the period covered by the LoBP.Given the inherent uncertainty involved in setting keyfinancial assumptions, specifically PGM prices andRand / Dollar exchange rate, the period over whichthe Directors consider it possible to form a reasonableexpectation as to the Group’s longer term viability,based on the planning and the stress testing describedabove, is the three-year period to November 2019.
Engineering contractor completes her inspection of theOther Precious Metals plant.
Assessment of longer term viability
Based on a robust assessment of the principal risksfacing the Group, a well-developed strategicmanagement Board process and stress testing ofvarious drivers described above, the Directors havea reasonable expectation that the Group will be ableto continue in operation and meet its liabilities as theyfall due over the period to November 2019.

/ 28 Lonmin PlcAnnual Report and Accounts 2016
Key Performance Indicators (KPIs)We use the following 11 Key Performance Indicators (KPIs)to measure our performance
Relevance to Strategy:
❶ Operational Excellence❷ Our People❸ Corporate Strategy❹ Corporate Citizenship
Remuneration
Some KPIs are used as a measure inthe incentive plans for the remunerationof executives. These are identified withthe symbol
> 85
See the Directors’ RemunerationReport from page 85 for more detail.
Safety ❶
4.163.50 3.34
5.414.97
0
1
3
2
4
5
6
2012 2013 2014 2015 2016Financial year
Per
milli
on m
an h
ours
wor
ked
Sales ❶
702 696
442
752 736
0
200
400
600
800
2012 2013 2014 2015 2016Financial year
ounc
es (0
00’s
)
DefinitionLTIFR is measured per million hours workedand reflects all injuries sustained at workwhere the injured is unable to return to workon the next shift.
CommentThe LTIFR improved by 8% compared to theprevious year. This was due to intensifiedfocus on a number of safety initiatives,including visible felt leadership and directemployee engagement.
DefinitionPlatinum ounces sold are those ounceswe produce either as refined ounces orrecoverable ounces sold in concentrate,at 99.95% purity.
CommentPlatinum sales exceeded guidance of700,000 ounces in 2016, as we benefitedfrom the smelter clean-up initiative as wellas various efficiency enhancement projectsat the Smelting and Refining operations.
> 30 See Performance / Safetypages for more detail
> 18 See Market Reviewpages for more detail
3.33.8 3.7
4.13.8
2012 2013 2014 2015 2016Financial year
Cen
tare
s (0
00,0
00’s
)
0
1.0
2.0
3.0
4.0
5.0
5.5 5.8
2.9
5.6 5.9
0
1
3
2
4
5
7
6
2012 2013 2014 2015 2016Financial year
m2
per
min
ing
empl
oyee
DefinitionIAOR in square metres or centares, excludespartially developed ore reserves in line withindustry best practice.
CommentOur IAOR at Generation 2 shafts at ourMarikana operations remain healthy andcontinue to provide operational flexibility.Overall, the IAOR decreased slightly, in linewith our strategy which allowed for the orderlyclosure of high cost shafts.
DefinitionSquare meters mined per total employeeincluding contractors (up to shaft headexcluding all central services) The KPIis focused on our Generation 2 shafts(K3, 4B, Rowland and Saffy).*
CommentProductivity improved by 5% in 2016, largelydriven by improved performances at Saffy &4B shafts notwithstanding the productionlosses associated with safety stoppages.Labour reductions at all shafts, as a resultof the restructuring, also contributed tothe improvement. We expect that as ourproductivity improvement projects and safetyinitiatives gain further momentum during2017, more improvements can be delivered.
* Historical information has been restated to excludeHossy which is scheduled for closure in 2017 andis now reported as part of Generation 1 shafts.
> 39 See Performance / Miningpage for more detail
> 39 41+ See Performance / Miningpages for more detail
9,1828,84310,748
13,538
10,339
0
4,000
8,000
12,000
16,000
2012 2013 2014 2015 2016Financial year
Ran
d pe
r P
GM
oun
ce
DefinitionCost per unit is key to being able to operateprofitably through down cycles. This measureincludes direct mining, concentrating, smeltingand refining costs as well as services costincluding marketing cost associated withsupporting the operations. Once-off (specialitems) and non-trading costs are excluded.
CommentThe unit costs achieved of R10,748 perounce reflects an increase well below thecurrent inflationary levels, albeit above ouroriginal guidance due to the productionshortfall in mining. This was partially offsetby the benefits associated with the costcontainment and productivity improvementprojects as they gained momentum.
> 32
See Performance / Financeand Operating Statisticspages for more detail
Development ❶ Productivity ❶Unit Costs ❶
LTIFR 4.97 Platinum ounces sold 736,000
Cost of Production per PGMounce R10,748
Immediately Available Ore Reserves3.8 million centares
Generation 2 Mining Operations5.9m2 per total employee
31+19+
37– 194+

01 /Strategic R
eport02 /
Governance
03 /Financial S
tatements
04 /A Deeper Look
05 /Shareholder Inform
ation
www.lonmin.com
/ 29Lonmin PlcAnnual Report and Accounts 2016
Employee Relations ❷
86
1,658
252
6,382
270
1,000
3,000
2,000
4,000
6,000
5,000
7,000
2012 2013 2014 2015 2016Financial year
Tonn
es
Underlying Operating Profit ❸
767
164
52
-134
-300
-200
0
-100
100
200
400
300
2012 2013 2014 2015 2016Financial year
$ m
illion
DefinitionProduction tonnes missed due to socialdisruptions and industrial action is consideredto be an indicator of the employee and socialrelations climate.
CommentThe minimal loss of production due to socialdisruptions or industrial action demonstratesthe continued progress made in improvingrelationships with employees, unions andcommunities.
DefinitionFor any business the ultimate aim is togrow underlying Earnings Before Interestand Taxation (EBIT) and deliver value toshareholders. Underlying EBIT excludes theeffect of once-off and non-trading items.
CommentThe Company is highly geared towards metalprices and costs, which drives volatility inprofitability. Notwithstanding metal pricesdecreasing further during 2016, the Companymoved from a loss making position togenerating profit in 2016 due to cost cutting.Detailed variance analysis is set out onpage 32, under Financial Review.
> 44 See Performance / Peoplepages for more detail
> 32 33+ See Performance / Financepages for more detail
Processing Recoveries ❶
82.4 85.0 86.2 87.2 89.6
0
20
60
40
80
100
2012 2013 2014 2015 2016Financial year
Rec
over
y (%
)
DefinitionThe instantaneous recovery rate is the productof the recoveries achieved at each step ofthe processing value chain and measures theefficiency of the recovery of metals.
CommentThe instantaneous recovery rate achievedin 2016 reflected further improvementsversus historical performances. The smelterclean-up project supported by variousoptimisation and improvement plans acrossour processing operations delivered theseexceptional results.
> 41 See Performance / Processingpage for more detail
Transformation ❹
52.4
49.4
47.248.4
50.3
2012 2013 2014 2015 2016Financial year
%
44
46
48
50
52
54
Energy Efficiency ❶
4.40
4.77
5.04
5.32
4.68
4.00
4.20
4.60
4.40
4.80
5.00
5.40
5.20
2012 2013 2014 2015 2016Financial year
GJ/
PG
M o
z
DefinitionThis KPI measures the percentage ofHDSAs in management as defined by theMining Charter.
CommentWe are pleased to report a further increase of4.6% in our HDSA representation to 52.4%,despite the restructuring process, whichremains well above the Mining Charter targetof 40%.
DefinitionTotal gigajoules of direct (gas, petrol, diesel,coal) and indirect (electricity) energyconsumption per ounce of PGMs producedincluding toll processed material.
CommentContinued focus on improvement initiativesin this area has resulted in the developmentof a pleasing downward trend.
> 44 See Performance / Peoplepages for more detail
> 50 See Performance / Our environmentpages for more detail
Free Cash Flow ❸
-31
-159 -154
-246-167
-400
-300
-100
-200
0
100
300
200
2012 2013 2014 2015 2016Financial year
$ m
illion
DefinitionTrading cash flow after capital expenditureand minority dividend payments.
CommentExcluding restructuring cost and the timingof benefits associated with the reorganisation,the Company operated on a cash neutralbasis after capital expenditure. Followingthe Rights Issue during the first quarter ofthe year, the subsequent three quartersgenerated cash of $104 million.
> 32 See Performance / Financepages for more detail
PGM Instantaneous RecoveryRate 89.6%
Tonnes of production missed dueto disruptions: 86,000 tonnes
$7 million
$(31) million HDSA ManagementRepresentation 52.4%
Energy consumption per ounceof PGMs produced
33+
52–
49–
/ 30 Lonmin PlcAnnual Report and Accounts 2016
PerformanceSafety
Our safety strategy is centred on the belief that Zero Harm is possible.We continue our pro-active safety management procedures, nurturinga culture focused on safety.
Our goal
Our goal is for every person in the business to havea personal understanding of, and respect for, theimportance of safety in the workplace throughentrenching safety principles in the organisation andincreasing visibility on safety matters.
Our safety strategy is centred around three key objectives:
fatality prevention;•
injury prevention; and•
a safe high performance operational culture.•
Our current safety performance is not acceptable andour focus on safety improvements remains a key priorityfor the Group. We do believe Zero Harm is achievableand we strive to realise this. We believe continuing tointegrate our operational and sustainability strategieswill help deliver this.
Significant achievements
K3 shaft achieved 6 million fatality free shifts on•22 July 2016, with the last fatality on 26 April 2013.
4B/1B shaft won the JT Ryan Safety Award for•the fourth consecutive year; in recognition of itsfatal-free safety performance.
4B/1B shaft achieved 10 million fatality free shifts,•with the last fatality at 1B shaft on 20 March 2004.
Saffy shaft achieved 3 million fatality free shifts on•13 April 2016.
EPC concentrator achieved 4 years LTI free on•6 July 2016.
Retained OHSAS 18001 at all processing plants.•
The LTIFR improved to 4.97 per million man hours•worked from 5.41 in the prior year.
Performance
Despite most safety indicators showing improvements,regrettably four of our colleagues were fatally injured.Mr Zilindile Ndumela, Mr Goodman Mangisa,Mr Fanelekile Giyama and Mr Siphilo Makhendesuccumbed to injuries suffered in separate incidentsat Rowland and E3 shafts in October 2015, April andMay 2016. Two of the incidents involved falls of groundand two were ore pass incidents. We deeply regret theloss of our colleagues and extend our deepestcondolences to their families and friends.
Each incident was thoroughly investigated and reportedto the DMR. Lessons learned from each incident wereimplemented into action plans and shared across
operations. Our continuing efforts to prioritiseimproving safety performance in a collaborativeway is demonstrated by the Tripartite Safety Daywe held on 14 July 2016 at Rowland and E3 shafts,incorporating our key stakeholders including the DMRand AMCU. Alongside our Chief Executive OfficerBen Magara, the focus on safety was also reiteratedto employees by Mr Joseph Mathunjwa, the Presidentof AMCU, and Mr Monageng Mothiba, PrincipalInspector of Mines for the Rustenburg region.
We had 50 Section 54 stoppages imposed at operationsin financial year 2016, compared to 36 stoppages infinancial year 2015, which resulted in 164 productiondays lost compared to 173 days lost in 2015. Section54 stoppages were enforced more broadly and weretaking longer to lift in the first nine months of the year.Not only do safety stoppages affect production, theyalso have a negative impact on safety routines and caremust be taken to safely shut down work areas so thaton their return, workers do not enter a work area thatis hazardous. We continued to engage proactively withthe DMR throughout and as shaft management developa better understanding and working relationship withthe inspectorate and with the Union, we are experiencinga reduction in the duration and frequency of Section 54stoppages and more localised application of thestoppages. We are encouraged that this collaborationwith the DMR has started to show results, as we haveexperienced decreasing Section 54 stoppages in thefourth quarter of the year, as elaborated under themining section on page 38. The rest of our shaft andoperational managers are now actively focusing onimproving their interaction with the inspectorate and theunions, to align objectives and manage expectationson safety stoppages.
The increased focus on proactive safety management andconsequence management led to the decrease in levelthree safety incidents to 11, compared to 21 in 2015.The LTIs reduced from 473 in 2015 to 409 in 2016.Finger injuries were identified as a major contributor tolost time injuries, which led to the ‘Aziko Sper’ campaign.This included various awareness campaigns and the rollout of a new glove, in an effort to reduce finger injuries.Since inception of the campaign we have seen adecrease of 14% in finger-related injuries. We haveintensified our focus on a number of safety initiativesthrough visible felt leadership and direct employeeengagement. This includes continued focus on FatalRisk Control Protocols relating to fall-of-ground andScraping and Rigging, the current MOSH1 initiatives, theroll out of the proximity detection systems, complianceaudits on contractors and contractor management.
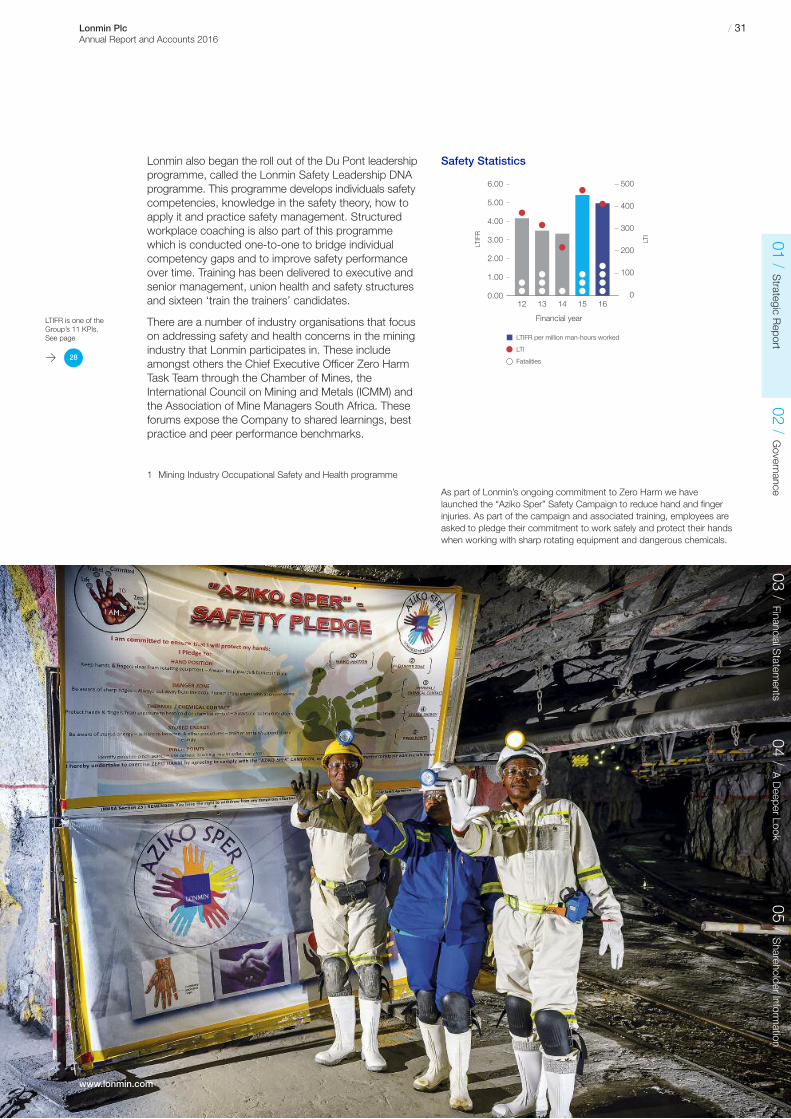
01 /Strategic R
eport03 /
Financial Statem
ents04 /
A Deeper Look
05 /Shareholder Inform
ation
www.lonmin.com
/ 31Lonmin PlcAnnual Report and Accounts 2016
As part of Lonmin’s ongoing commitment to Zero Harm we havelaunched the “Aziko Sper” Safety Campaign to reduce hand and fingerinjuries. As part of the campaign and associated training, employees areasked to pledge their commitment to work safely and protect their handswhen working with sharp rotating equipment and dangerous chemicals.
12 13 14 15 16
Financial year
LTIF
R
0
100
300
200
400
500
LTI
0.00
1.00
2.00
3.00
4.00
5.00
6.00
LTIFR per million man-hours worked
LTI
Fatalities
Safety StatisticsLonmin also began the roll out of the Du Pont leadershipprogramme, called the Lonmin Safety Leadership DNAprogramme. This programme develops individuals safetycompetencies, knowledge in the safety theory, how toapply it and practice safety management. Structuredworkplace coaching is also part of this programmewhich is conducted one-to-one to bridge individualcompetency gaps and to improve safety performanceover time. Training has been delivered to executive andsenior management, union health and safety structuresand sixteen ‘train the trainers’ candidates.
There are a number of industry organisations that focuson addressing safety and health concerns in the miningindustry that Lonmin participates in. These includeamongst others the Chief Executive Officer Zero HarmTask Team through the Chamber of Mines, theInternational Council on Mining and Metals (ICMM) andthe Association of Mine Managers South Africa. Theseforums expose the Company to shared learnings, bestpractice and peer performance benchmarks.
1 Mining Industry Occupational Safety and Health programme
02 /Governance
> 28
LTIFR is one of theGroup’s 11 KPIs.See page

/ 32 Lonmin PlcAnnual Report and Accounts 2016
During the three quarters following the restructuring the Group’s business generated $104 million of cash.At 30 September 2016 the Group had net cash of $173 million after taking into account a $150 million drawnterm loan and $215 million of undrawn debt facilities available resulting in total liquidity1 of $537 million. It remainsour overall objective to be at least cash neutral after capital expenditure in this low-price environment.
Quarterly Net Cash Analysis
Financial Review
In the first half of the financial year we completed the significantreorganisation and restructuring of the Company. This followed onfrom raising fresh equity through a Rights Issue raising $373 millionnet of fees and an amendment of our debt facilities, extending their maturity to May 2019 with an option to extend to 2020.
Q1 = Net Outflow excludingRights Issue (c$119m)
Q2 = Net Inflow(c$45m)
Q3 = Net Outflow(c$23m)
Q4 = Net Inflow(c$82m)
Sales150koz pt
290koz PGMBasket Price
$769/oz
Sales211koz pt
409koz PGMBasket Price
$713/oz
Sales163koz pt
315koz PGMBasket Price
$796/oz
Sales211koz pt
391koz PGMBasket Price
$902/oz
(185)
232 (351)373 69
275 (230)
114
245 (269)
91
362 (280)
173
(300)
(200)
(100)
0
100
200
300
400
Openin
g net
debt
Cash i
nflow
s fro
m sales
Net Cas
h outf
lows
Proce
eds f
rom R
ights
Issue
Net ca
sh Q
1
Cash i
nflow
s fro
m sales
Net Cas
h outf
lows
Net ca
sh Q
2
Cash i
nflow
s fro
m sales
Net Cas
h outf
lows
Net ca
sh Q
3
Cash i
nflow
s fro
m sales
Net Cas
h outf
lows
Net ca
sh S
eptem
ber 2
016
$m
Positive cash inflows of $104 million
PGM prices were volatile during the year with theplatinum price ranging from a low of $816 per ounceon 21 January 2016 to a high of $1,184 on 10 August2016. On average the platinum price for the financialyear was 11% lower than the prior year. However,the completion of the restructuring of the businessin the first half of the year, continued focus on costmanagement, capital expenditure discipline and theweakening of the Rand by 23% against the US Dollarresulted in improved profitability compared to the prioryear. We achieved cost reductions of R1.3 billion(real terms) compared to the prior year and comparedto a targeted reduction of R700 million. The cost ofproduction per PGM ounce for the year was R10,748.
The year on year increase in unit costs was limited to4%, well below current inflationary levels and despite an8.2% increase in labour costs and a very challengingoperating environment that was hard hit by safetystoppages as well as the disruption from restructuringthe workforce which resulted in 5,433 employees andcontractors leaving the Group and 1,428 employeesbeing reskilled and redeployed into vacant, moreproductive roles. Further details on unit costs can befound in the Operating Statistics section of the Report.Underlying Earnings Before Interest, Tax, Depreciationand Amortisation (EBITDA) for 2016 was $109 million,an increase of $89 million on 2015 and an underlyingoperating profit of $7 million was realised compared toan underlying operating loss of $134 million in 2015.
Performance (continued)
1 Liquidity is defined as cash on hand plus undrawn committed debt facilities
> 194
Further details ofunit costs canbe found in theOperating Statisticson page
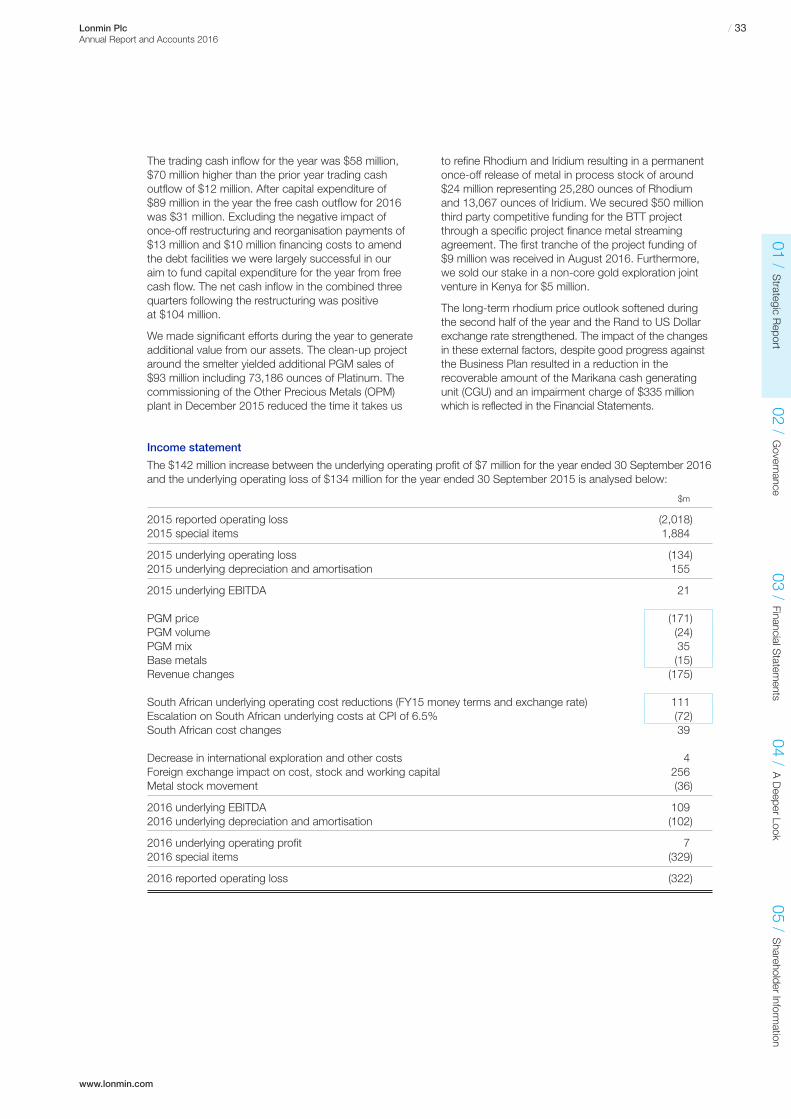
01 /Strategic R
eport02 /
Governance
03 /Financial S
tatements
04 /A Deeper Look
05 /Shareholder Inform
ation
www.lonmin.com
/ 33Lonmin PlcAnnual Report and Accounts 2016
Income statement
The $142 million increase between the underlying operating profit of $7 million for the year ended 30 September 2016and the underlying operating loss of $134 million for the year ended 30 September 2015 is analysed below:
$m
2015 reported operating loss (2,018)2015 special items 1,884
2015 underlying operating loss (134)2015 underlying depreciation and amortisation 155
2015 underlying EBITDA 21
PGM price (171)PGM volume (24)PGM mix 35Base metals (15)Revenue changes (175)
South African underlying operating cost reductions (FY15 money terms and exchange rate) 111Escalation on South African underlying costs at CPI of 6.5% (72)South African cost changes 39
Decrease in international exploration and other costs 4Foreign exchange impact on cost, stock and working capital 256Metal stock movement (36)
2016 underlying EBITDA 1092016 underlying depreciation and amortisation (102)
2016 underlying operating profit 72016 special items (329)
2016 reported operating loss (322)
The trading cash inflow for the year was $58 million,$70 million higher than the prior year trading cashoutflow of $12 million. After capital expenditure of $89 million in the year the free cash outflow for 2016was $31 million. Excluding the negative impact ofonce-off restructuring and reorganisation payments of $13 million and $10 million financing costs to amendthe debt facilities we were largely successful in our aim to fund capital expenditure for the year from free cash flow. The net cash inflow in the combined threequarters following the restructuring was positive at $104 million.
We made significant efforts during the year to generateadditional value from our assets. The clean-up projectaround the smelter yielded additional PGM sales of $93 million including 73,186 ounces of Platinum. Thecommissioning of the Other Precious Metals (OPM)plant in December 2015 reduced the time it takes us
to refine Rhodium and Iridium resulting in a permanentonce-off release of metal in process stock of around$24 million representing 25,280 ounces of Rhodiumand 13,067 ounces of Iridium. We secured $50 millionthird party competitive funding for the BTT projectthrough a specific project finance metal streamingagreement. The first tranche of the project funding of$9 million was received in August 2016. Furthermore,we sold our stake in a non-core gold exploration jointventure in Kenya for $5 million.
The long-term rhodium price outlook softened duringthe second half of the year and the Rand to US Dollarexchange rate strengthened. The impact of the changesin these external factors, despite good progress againstthe Business Plan resulted in a reduction in therecoverable amount of the Marikana cash generatingunit (CGU) and an impairment charge of $335 millionwhich is reflected in the Financial Statements.

/ 34 Lonmin PlcAnnual Report and Accounts 2016
Performance (continued)
$m Rand
2015 – underlying South African operating costs (1,218) (14,550)
Cost reductions in FY2015 money terms and exchange rate (Rand / USD 12.0):Underground mining 64 757Opencast mining 5 61Concentrating 15 182Smelting and refining 4 45Overhead, centralised services and other 14 171Ore and concentrate purchases 9 111
111 1,327
Escalation, assuming South African CPI of 6.5% (72) (860)Translation gains on underlying costs due to movement in exchange rate 216 –
2016 – underlying South African operating costs (963) (14,083)
Revenue
Total revenue for the year ended 30 September 2016of $1,118 million reflects a decrease of $175 millioncompared to the prior year. As noted in the Overview,the US Dollar PGM prices achieved were significantlylower than the prior year despite the platinum pricesteadily increasing since January 2016, reversing thedownward trend in the prior year. The average pricesachieved on the key metals sold are shown below:
Average metal pricesYear ended 30 September
2016 2015$/oz $/oz
Platinum 978 1,095Palladium 589 718Rhodium 671 998
PGM basket (including by-product revenue) 796 902
Rand PGM basket (includingby-product revenue) R11,637 R10,829
The US Dollar PGM basket price (including by-products)decreased by 12% compared to the 2015 average price,resulting in a reduction in revenue of $171 million. Itshould be noted that whilst the US Dollar basket pricedecreased compared to 2015, in Rand terms the basketprice (including by-products) increased by 7% driven bythe weaker Rand.
The PGM sales volume for the year to 30 September 2016was 2% lower compared to the year to 30 September2015, which had a negative impact on revenue of $24 million.
$m
2015
PGM Volum
es
PGM Pric
es
PGM Mix
Base M
etals
1,29335(24)
(171)(15) 1,118
2016
0
200
400
600
800
1,000
1,200
1,400
The mix of metals sold increased revenue by $35 millionmainly due to the higher proportion of Rhodium sold in2016 as a result of the commissioning of the OPM plantin December 2015. Base metal revenue decreased by$15 million as a result of a reduction in prices comparedto 2015.
Revenue
Costs
The positive impact of the removal of high costproduction and reorganisation are evidenced across allour operations with underlying South African operatingcosts decreasing by $111 million in FY2015 moneyterms and excluding the impact of the weaker Rand.Total costs in Rand in 2016 were R14,083 million.In 2015 money terms the total costs for 2016 wouldhave been R13,223 million (assuming South AfricanConsumer Price Index (CPI) of 6.5%). With actualcosts of R14,550 million in 2015, this means that on alike-for-like basis, 2016 total costs were R1,327 millionlower than the prior year, almost double the guided costsavings of R700 million. The movements in operatingcosts are shown in the table below:
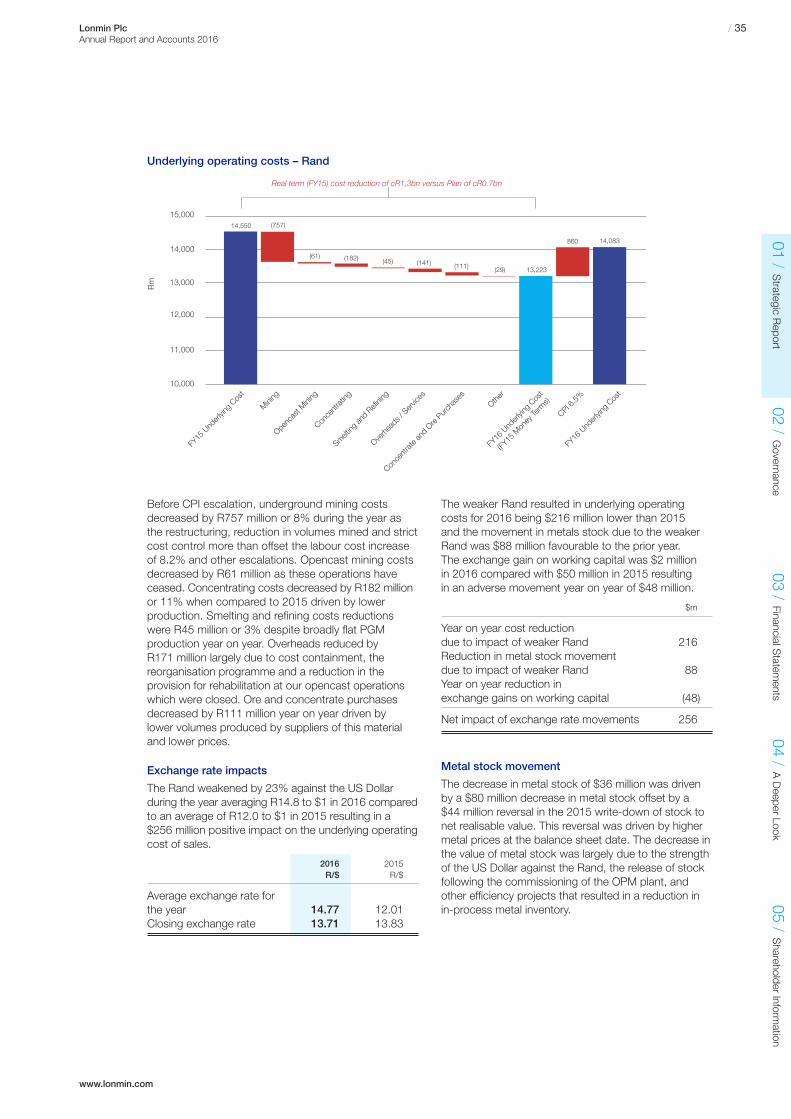
01 /Strategic R
eport02 /
Governance
03 /Financial S
tatements
04 /A Deeper Look
05 /Shareholder Inform
ation
www.lonmin.com
/ 35Lonmin PlcAnnual Report and Accounts 2016
The weaker Rand resulted in underlying operatingcosts for 2016 being $216 million lower than 2015and the movement in metals stock due to the weakerRand was $88 million favourable to the prior year.The exchange gain on working capital was $2 millionin 2016 compared with $50 million in 2015 resultingin an adverse movement year on year of $48 million.
$m
Year on year cost reduction due to impact of weaker Rand 216Reduction in metal stock movementdue to impact of weaker Rand 88Year on year reduction in exchange gains on working capital (48)
Net impact of exchange rate movements 256
Metal stock movement
The decrease in metal stock of $36 million was drivenby a $80 million decrease in metal stock offset by a $44 million reversal in the 2015 write-down of stock tonet realisable value. This reversal was driven by highermetal prices at the balance sheet date. The decrease inthe value of metal stock was largely due to the strengthof the US Dollar against the Rand, the release of stockfollowing the commissioning of the OPM plant, andother efficiency projects that resulted in a reduction inin-process metal inventory.
Before CPI escalation, underground mining costsdecreased by R757 million or 8% during the year asthe restructuring, reduction in volumes mined and strictcost control more than offset the labour cost increaseof 8.2% and other escalations. Opencast mining costsdecreased by R61 million as these operations haveceased. Concentrating costs decreased by R182 millionor 11% when compared to 2015 driven by lowerproduction. Smelting and refining costs reductionswere R45 million or 3% despite broadly flat PGMproduction year on year. Overheads reduced byR171 million largely due to cost containment, thereorganisation programme and a reduction in theprovision for rehabilitation at our opencast operationswhich were closed. Ore and concentrate purchasesdecreased by R111 million year on year driven bylower volumes produced by suppliers of this materialand lower prices.
Exchange rate impacts
The Rand weakened by 23% against the US Dollarduring the year averaging R14.8 to $1 in 2016 comparedto an average of R12.0 to $1 in 2015 resulting in a$256 million positive impact on the underlying operatingcost of sales.
2016 2015R/$ R/$
Average exchange rate forthe year 14.77 12.01Closing exchange rate 13.71 13.83
14,550
(182)
(757)
(61)
(29)(141)(45)
(111)
860
13,223
14,083
10,000
11,000
12,000
13,000
14,000
15,000
FY15
Und
erlyin
g Cos
t
Mining
Openc
ast M
ining
Conce
ntrati
ng
Smelting
and
Refinin
g
Overh
eads
/ Serv
ices
Conce
ntrate
and
Ore Purc
hase
sOthe
r
FY16
Und
erlyin
g Cos
t
(FY15
Mon
ey Te
rms)
FY16
Und
erlyin
g Cos
t
CPI 6.5%
Rm
Real term (FY15) cost reduction of cR1,3bn versus Plan of cR0.7bn
Underlying operating costs – Rand

/ 36 Lonmin PlcAnnual Report and Accounts 2016
Performance (continued)
Net finance costsYear ended 30 September
2016 2015$m $m
Net bank interest and fees (11) (25)Interest and fees capitalised 1 19Foreign exchange gains on net cash / (debt) 15 12Dividends received from investment 1 1Unwinding of discount on environmental provision (9) (10)Other (2) (1)
Underlying net finance costs (5) (4)
HDSA receivable – accrued interest 27 18HDSA receivable – exchange losses (60) (28)HDSA receivable – impairment – (227)Foreign exchange gains on the Rights Issue proceeds 5 –
Net finance costs (33) (239)
Underlying total net finance costs increased by $1 millionto $5 million for the year ended 30 September 2016.
Net bank interest and fees incurred in the year at $11 million were $14 million lower than 2015 due theimpact of the strengthened balance sheet andaccordingly the reduction in drawn debt facilities. Interesttotalling $1 million was capitalised to assets compared to$19 million in 2015 as the debt facilities at asset levelwere repaid in December 2015. Exchange gains on netcash in 2016 amounted to $15 million compared with$12 million exchange gains on net debt in 2015.
The HDSA receivable, being the Sterling loan toPhembani Group (Proprietary) Limited (Phembani)accrued interest and attracted an exchange loss.The loan was granted to Shanduka Resources Group(Proprietary) Limited, our former BEE partner, whichhas now merged with Phembani, and the merged entityoperates as Phembani Group (Proprietary) Limited.The gross loan, excluding prior years impairments of$376 million, drew an exchange loss for the year of$60 million (2015 – $28 million) due to the significantweakening of Sterling against the US Dollar in 2016 onthe back of the uncertainty following the referendumresult regarding the UK’s exit from the EU. Prior yearsimpairments are based in US Dollar, being the Group’sfunctional currency, resulting in no exchange gains.Accrued interest of $27 million in 2016 was higher thanthe $18 million charged in 2015 due to a 2.5% increasein the rate of interest charged on the loan from July2015. The balance of the receivable at 30 September2016 was $69 million (2015 – $102 million).
The $5 million foreign exchange gains on the RightsIssue comprise the gains on translation of advancedcash proceeds received prior to the effective date of the Rights Issue as well as hedging gains on forwardexchange contracts entered into to minimise the risk of the exposure to currency fluctuations on the Randand Pound Sterling proceeds.
Depreciation and amortisation
Depreciation and amortisation decreased by $53 millionyear on year mainly due to the impairment of assets inSeptember 2015. The reduced production from theGeneration 1 shafts, in line with our plans for placementon care and maintenance, also had an impact on thedepreciation charge as depreciation is calculated on aunits-of-production basis, spreading costs in relation to proven and probable reserves.
Special operating costs
Special operating costs for the year ended 30 September 2016 were made up as follows:
Year ended 30 September
2016 2015$m $m
Impairment of non-financialassets (335) (1,811)Restructuring and reorganisation costs 21 (59)Debt refinancing costs (10) –Share based payments (5) –BEE transaction – (14)
(329) (1,884)
The revised rhodium price outlook and the strengtheningof the Rand since our Interim results in March 2016offset optimisation improvements in our mining plan andresulted in the value in use of the Marikana CGU decliningbelow the carrying amount of the non-financial assetsof the operations of $1,625 million. The recoverableamount of the Marikana CGU was $1,290 million. As aresult of the impact of the changes in these externalfactors and despite good progress made in the yearagainst the Business Plan, a special impairment chargeof $335 million is reflected in the Financial Statements(2015 – $1,465 million). In 2015 the special impairmentcharge was $1,811 million of which $1,465 million relatedto the Marikana operation and $346 million related tothe full impairment of the Limpopo and Akanani assets.See note 31 to the Financial Statements for details.
The planned reorganisation of the business wasachieved at a lower cost due to the reskilling andredeployment of employees combined with a greaterproportion of contractors departing as well as naturalattrition resulting in a $21 million reversal of the 2015provision for restructuring costs. Costs incurred toamend the bank debt facilities amounted to $10 millionwhile the adjustment to reflect the Rights Issue andshare consolidation in 2015 resulted in the accelerationof share based expenses to the amount of $5 million.For the period ended 30 September 2015, $14 millionwas incurred in relation to the BEE transactionconcluded in December 2014 which largely comprised$13 million for the lock-in premium paid to the BapoBa Mogale Traditional Community (the Bapo) as wellas legal and consulting costs of $1 million related tothe transaction.
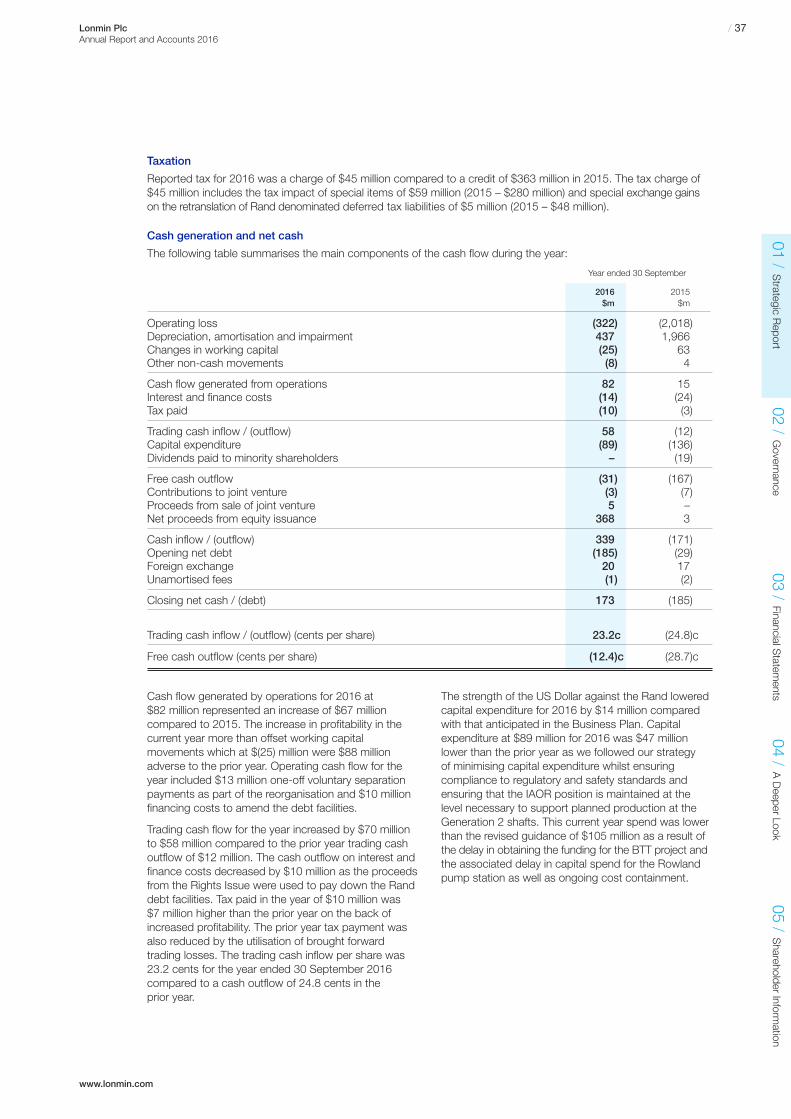
01 /Strategic R
eport02 /
Governance
03 /Financial S
tatements
04 /A Deeper Look
05 /Shareholder Inform
ation
www.lonmin.com
/ 37Lonmin PlcAnnual Report and Accounts 2016
Cash flow generated by operations for 2016 at $82 million represented an increase of $67 millioncompared to 2015. The increase in profitability in thecurrent year more than offset working capitalmovements which at $(25) million were $88 millionadverse to the prior year. Operating cash flow for theyear included $13 million one-off voluntary separationpayments as part of the reorganisation and $10 millionfinancing costs to amend the debt facilities.
Trading cash flow for the year increased by $70 millionto $58 million compared to the prior year trading cashoutflow of $12 million. The cash outflow on interest andfinance costs decreased by $10 million as the proceedsfrom the Rights Issue were used to pay down the Randdebt facilities. Tax paid in the year of $10 million was $7 million higher than the prior year on the back ofincreased profitability. The prior year tax payment wasalso reduced by the utilisation of brought forwardtrading losses. The trading cash inflow per share was23.2 cents for the year ended 30 September 2016compared to a cash outflow of 24.8 cents in the prior year.
Taxation
Reported tax for 2016 was a charge of $45 million compared to a credit of $363 million in 2015. The tax charge of$45 million includes the tax impact of special items of $59 million (2015 – $280 million) and special exchange gainson the retranslation of Rand denominated deferred tax liabilities of $5 million (2015 – $48 million).
Cash generation and net cash
The following table summarises the main components of the cash flow during the year:
Year ended 30 September
2016 2015$m $m
Operating loss (322) (2,018)Depreciation, amortisation and impairment 437 1,966Changes in working capital (25) 63Other non-cash movements (8) 4
Cash flow generated from operations 82 15Interest and finance costs (14) (24)Tax paid (10) (3)
Trading cash inflow / (outflow) 58 (12)Capital expenditure (89) (136)Dividends paid to minority shareholders – (19)
Free cash outflow (31) (167)Contributions to joint venture (3) (7)Proceeds from sale of joint venture 5 –Net proceeds from equity issuance 368 3
Cash inflow / (outflow) 339 (171)Opening net debt (185) (29)Foreign exchange 20 17Unamortised fees (1) (2)
Closing net cash / (debt) 173 (185)
Trading cash inflow / (outflow) (cents per share) 23.2c (24.8)c
Free cash outflow (cents per share) (12.4)c (28.7)c
The strength of the US Dollar against the Rand loweredcapital expenditure for 2016 by $14 million comparedwith that anticipated in the Business Plan. Capitalexpenditure at $89 million for 2016 was $47 millionlower than the prior year as we followed our strategy of minimising capital expenditure whilst ensuringcompliance to regulatory and safety standards andensuring that the IAOR position is maintained at thelevel necessary to support planned production at theGeneration 2 shafts. This current year spend was lowerthan the revised guidance of $105 million as a result ofthe delay in obtaining the funding for the BTT project andthe associated delay in capital spend for the Rowlandpump station as well as ongoing cost containment.

/ 38 Lonmin PlcAnnual Report and Accounts 2016
Performance (continued)
Operations
The business is well positioned following the disruption of the reorganisation.Mining has stabilised, Processing has delivered industry-leading recoveriesand we have exceeded our sales guidance. Getting profitable ounces out ofthe ground remains our priority in this low pricing environment.
Whilst we had a high number of Section 54 safetystoppages in the first nine months of the year, we areexperiencing a reduction in the duration and frequencyof Section 54 stoppages as a result of our continuedinteraction with the Department of Minerals and theunions, as more fully explained under safety on pages30 to 31. Accordingly, we have experienced animproving trend in production losses, and in the fourthquarter of the year, only 95,000 tonnes were lost due toSection 54 safety stoppages and MISS, compared to297,000 tonnes in the last quarter of the prior year.
Tonnes Mined
Tonnes Lost
Equivalent Platinum Ounces Lost
Key features
Refined production of 741,890 Platinum ounces•
Sales of 735,747 Platinum ounces, exceeded the•sales guidance of 700,000 Platinum ounces
Mined Platinum ounces of 659,754•
Smelter clean-up project implemented during the•current year released 73,186 ounces of Platinum,boosting the instantaneous recovery rate to 89.6%
Concentrator recoveries of 86.6% continue to be•industry leading
Produced 10.3 million tonnes from underground•mining, a decrease of 8.8% on prior year, with thedecrease primarily from Generation 1 shafts in linewith our strategy
Generation 2 shafts production of 8.1 million tonnes,•4.0% up on prior year comparable production
Productivity (measured as square meter per total•employee) on Generation 2 shafts up 5.0%,notwithstanding rationalisation of the workforce by 19.0%
Underlying costs decreased by 3.2% to •R14,083 million, but unit costs increased by 4% toR10,748, despite 8.2% increase in labour costs
Average Rand full basket price (including base•metals) up 7.5% on prior year, at R11.637 perPGM ounce
Mining
Tonnes mined at 10.3 million were 8.8% lower than the 11.3 million from the prior year, mostly as a result of the decline in production from the Generation 1shafts of 1.1 million tonnes, in line with our strategy toreduce high cost production in a low price environment.
This production level was achieved in spite of therationalisation of the workforce by 19% or 6,861people, comprising a reduction of 5,433 employeesand contractors and the efficient reskilling andredeployment into vacant, more productive roles of1,428 employees. The vacancies were predominantlyas a result of a deliberate freeze on recruitment andlosses due to natural attrition.
A total of some 592,000 tonnes of production was lost in the year due to Section 54 safety stoppages and management induced safety stoppages (MISS),equivalent to 39,000 Platinum ounces lost, comparedto 872,000 tonnes lost in the prior year.
20162014 2015
Generation 2 Generation 1 Opencast Total0
2
4
6
8
10
12
Tonn
es m
ined
(’00
0 to
nnes
)
Financial year
Tonn
es lo
st (’
000
tonn
es)
0
1,000
2,000
3,000
4,000
5,000
6,000
7,000
8,000
Section 54safety stoppages
Managementinduced safety
stoppages
Industrial action(5 month strike
in 2014)
Total tonnes
lost
Financial year
20162014 2015
Oun
ces
lost
(’00
0 to
nnes
)
0
100
200
300
400
500
Section 54safety stoppages
Managementinduced safety
stoppages
Industrial action(5 month strike
in 2014)
Totaltonnes
lost
Financial year
20162014 2015
> 28
Tonnes ofproduction lostis one of theGroup’s KPIs.See page

An aerial view of Rowland shaft, one of our Generation 2 shafts thatrepresent around 78% of Lonmin’s total tonnage production.
01 /Strategic R
eport04 /
A Deeper Look
05 /Shareholder Inform
ation
www.lonmin.com
/ 39Lonmin PlcAnnual Report and Accounts 2016
03 /Financial S
tatements
02 /Governance
Since we are commencing an orderly shut down andplacement on care and maintenance of Hossy shaft,this shaft is now reported as a Generation 1 shaft andprior periods have been restated accordingly.
Immediately Available Ore Reserves (m² ’000)2015 2016 Variance
K3 1,054 1,030 (2)%Rowland 576 504 (12)%Saffy 733 765 4%4B 635 556 (12)%
Generation 2 2,998 2,855 (5)%Generation 1 908 751 (17)%K4 188 188 0%
Total 4,094 3,794 (7)%
The ore reserve position of the Marikana miningoperations at 3.8 million square metres represents anaverage of 22.4 months production.
The overall decrease of 5% at the Generation 2shafts is largely driven by a 12% reduction at bothRowland and 4B shafts. The drop in Rowland availableore reserve is due to current levels reaching theextremities of Rowland’s lease area, but the lateralextensions into MK2 and K3 ground scheduled for2017/2018 are expected to open new ore reserves.
The drop in 4B available ore reserves is due to adepleting shaft block, as we reach the extremities ofthe lease area, but development into the 1B block onMerensky is expected to start realising ore reservesfrom 2018 for 4B shaft.
The decrease in the ore reserve position at theGeneration 1 shafts can be largely attributed to Hossyand Newman shafts depletion and the plannedcurtailment of development.
Productivity: m2 per Mining Employee UndergroundShafts Excluding Central Mining Services
Productivity measured as square meters per miningemployee at our Generation 2 shafts improved again,and for the year increased by 5% to 5.9 compared to5.6 from the prior year.
20162014 2015
Generation 2 Generation 1 TotalFinancial year
0.0
1.0
2.0
3.0
4.0
5.0
6.0> 28
ImmediatelyAvailable OreReserves andProductivityare two of theGroup’s 11 KPIs.See page
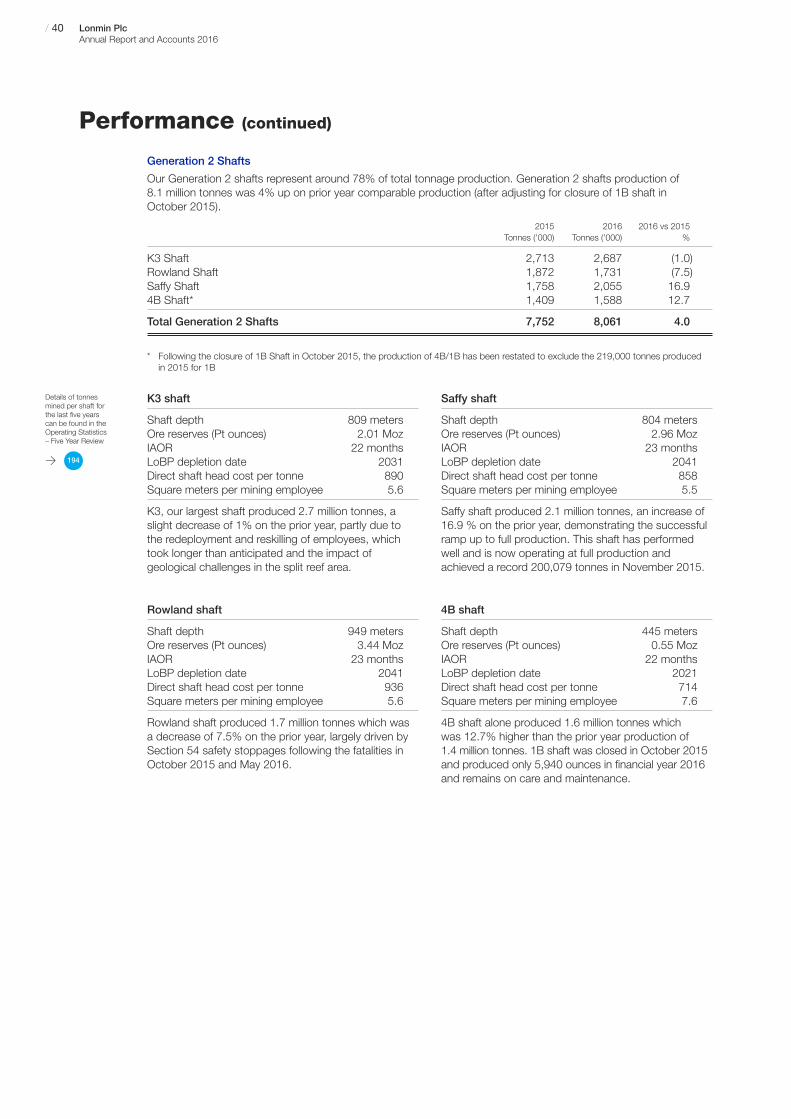
/ 40 Lonmin PlcAnnual Report and Accounts 2016
Performance (continued)
> 194
Details of tonnesmined per shaft forthe last five yearscan be found in theOperating Statistics– Five Year Review
Saffy shaft
Shaft depth 804 metersOre reserves (Pt ounces) 2.96 MozIAOR 23 monthsLoBP depletion date 2041Direct shaft head cost per tonne 858Square meters per mining employee 5.5
Saffy shaft produced 2.1 million tonnes, an increase of16.9 % on the prior year, demonstrating the successfulramp up to full production. This shaft has performedwell and is now operating at full production andachieved a record 200,079 tonnes in November 2015.
4B shaft
Shaft depth 445 metersOre reserves (Pt ounces) 0.55 MozIAOR 22 monthsLoBP depletion date 2021Direct shaft head cost per tonne 714Square meters per mining employee 7.6
4B shaft alone produced 1.6 million tonnes whichwas 12.7% higher than the prior year production of1.4 million tonnes. 1B shaft was closed in October 2015and produced only 5,940 ounces in financial year 2016and remains on care and maintenance.
K3 shaft
Shaft depth 809 metersOre reserves (Pt ounces) 2.01 MozIAOR 22 monthsLoBP depletion date 2031Direct shaft head cost per tonne 890Square meters per mining employee 5.6
K3, our largest shaft produced 2.7 million tonnes, aslight decrease of 1% on the prior year, partly due tothe redeployment and reskilling of employees, whichtook longer than anticipated and the impact ofgeological challenges in the split reef area.
Rowland shaft
Shaft depth 949 metersOre reserves (Pt ounces) 3.44 MozIAOR 23 monthsLoBP depletion date 2041Direct shaft head cost per tonne 936Square meters per mining employee 5.6
Rowland shaft produced 1.7 million tonnes which wasa decrease of 7.5% on the prior year, largely driven bySection 54 safety stoppages following the fatalities inOctober 2015 and May 2016.
Generation 2 Shafts
Our Generation 2 shafts represent around 78% of total tonnage production. Generation 2 shafts production of8.1 million tonnes was 4% up on prior year comparable production (after adjusting for closure of 1B shaft inOctober 2015).
2015 2016 2016 vs 2015Tonnes (’000) Tonnes (’000) %
K3 Shaft 2,713 2,687 (1.0)Rowland Shaft 1,872 1,731 (7.5)Saffy Shaft 1,758 2,055 16.94B Shaft* 1,409 1,588 12.7
Total Generation 2 Shafts 7,752 8,061 4.0
* Following the closure of 1B Shaft in October 2015, the production of 4B/1B has been restated to exclude the 219,000 tonnes producedin 2015 for 1B
01 /Strategic R
eport02 /
Governance
03 /Financial S
tatements
04 /A Deeper Look
05 /Shareholder Inform
ation
www.lonmin.com
/ 41Lonmin PlcAnnual Report and Accounts 2016
> 13
Further details ofactions being taken onthe higher cost shafts(Hossy, Newman, 1B,W1, E1) can be foundin the Strategy section
> 29
InstantaneousRecovery Rateis one of theGroup’s 11 KPIs.See page
Generation 1 shafts
Our Generation 1 shafts are reaching their end of livesand, as expected, production has declined.
Hossy shaft
Hossy shaft produced 0.7 million tonnes, a decreaseof 25.2% compared to the prior year, due to depletionof the available ore reserves as all development hasbeen stopped. Hossy shaft will be put on care andmaintenance by the end of financial year 2017.
Newman shaft
Newman shaft produced 0.3 million tonnes which was a decrease of 54.7% on the prior year as plannedand has now ceased own production from Lonmincrews. Newman is currently being mined by contractorsand future extraction of the remaining ore reservesusing contract mining will be assessed annually.
Pandora E3 Joint Venture
Pandora production (100%) at 0.5 million tonnes was13.4 % lower than the prior period, driven by Section54 safety stoppages following the fatalities in May and July 2016.
W1, East 1 and East 2 shafts
W1, East 1, East 2 are shafts at the end of their livesand together produced 0.6 million tonnes comparedwith 0.7 million tonnes in the prior year. Contractorshave continued to run W1, East 1 and East 2 (we runthe engineering for East 2), and are responsible for allthe costs associated with such shafts, but retain theflexibility to cease production if required.
These shafts are expected to remain operational underthe current contractor model for financial year 2017.The viability of these shafts is reassessed annually.
Business Improvement Initiatives
The Business Support Office continually facilitates andmonitors the implementation of business improvementinitiatives by line management, aimed at increasingproductivity and improving performance.
Pursuant to the successful rationalisation of the workforceby 19%, we experienced an increase in productivity atour Generation 2 shafts from 5.6 square meters per manin 2015 to 5.9 square meters per man in 2016. As thedisruption created by the rationalisation process settlesdown, we expect the mining teams to return to the longrun target levels of production. Whilst we are pleasedwith the implementation of our Business Plan and withour strategy to reduce high cost production in a lowprice environment, we have yet to fully harness theproductivity gains, and mining has not been able todeliver the planned tonnes for Generation 2 shaftsduring the 2016 financial year for a variety of reasons,including redeployment and reskilling of employeestaking longer than anticipated, absenteeism of keypersonnel reducing the planned blasts per month andhigher incidences of safety stoppages in the first ninemonths of the year.
We remain focused on improving productivity andrecognise that multiple challenges remain and a stepchange is needed to realise further improvement.In parallel with the ongoing implementation of theinitiatives set out below, additional stoping crews willbe deployed in order to further support the achievementof planned output, as our healthy ore reserve positionallows for this.
The current initiatives being implemented to improveproductivity are:
establishing a labour skills buffer;•
addressing employee absenteeism;•
introducing a programme aimed at the•empowerment of frontline supervisors; and
implementing the Theory of Constraints framework•in order to improve the optimisation of half levels atGeneration 2 shafts.
Further progress has been made in the current year onthe initiative to improve the performance of the bottom20% of stoping crews, and the performance of thesebottom 20% crews at Generation 2 shafts has increasedto an average of 216 square meters per crew in thecurrent year from 200 square meters per crew in theprior year. The impact is to increase the overall averageoutput for stoping crews on these Generation 2 shaftsto 316 square meters per crew in the current year from296 square meters per crew in the prior year.
Processing
The efforts to improve the performance and reliabilityof the processing plants over recent years, based onongoing optimisation and improvement plans acrossthe processing operations, continue to pay off and theconcentrators are achieving levels of PGM recoveriesamongst the highest in their history, with theinstantaneous recovery rate having increased to89.6% for the current year, from 87.2% in the 2015financial year, benefitting from the once-off smelterclean-up project.
Concentrating
Concentrating continued to deliver excellentunderground and overall recoveries for the year at86.7% and 86.6% respectively, despite the plantinstability caused by the stoppages experienced due to periods of insufficient ore supply from our miningoperations and lower opening stock than in 2015.
Total tonnes milled for the year at 10.4 million tonneswere marginally higher than tonnes mined of10.3 million tonnes, but 12.1 % lower than prior year of11.8 million tonnes. The average run time was downand production was affected by not having sufficientore supply from the mining operations.

/ 42 Lonmin PlcAnnual Report and Accounts 2016
Performance (continued)
Smelting and Refining
The Smelters, the BMR and Precious Metal Refinery(PMR) have been the subject of significant and ongoingmanagement attention over the years, which hasembedded a strong culture of “excellence in processing”,and continue to deliver strong performance followingthe initiatives undertaken.
Refined production of 741,890 Platinum ounces wasachieved, notwithstanding mined ounces of 659,754,a decrease of 2.3% on the refined production from prioryear. Total PGMs produced were 1,440,724 ounces,a decrease of 0.5% on prior year.
The innovative smelter clean-up project was implementedduring the current year and released 73,186 ounces ofPlatinum during the year. The smelter clean-up projectwas one of the initiatives aimed at improvingperformance, having identified the opportunity toincrease low cost refined Platinum production to makeup for the shortfall in mined ounces. The productionprocess for the smelter clean-up project involves thereprocessing of stock piles of used refractories andsome revert tails generated during the slag plantconstruction, which contain low grade PGMs. Theclean-up project is expected to continue into the firsthalf of the 2017 financial year.
The ongoing innovation in the processing division wasthe foundation for the OPM plant at the PMR, whichuses the latest third generation technology whichimproves Rhodium and Iridium recoveries. The OPMcontributed to additional release of 25,280 ounces ofRhodium and 13,068 ounces of Iridium.
Bulk Tailings Treatment
As part of our strategy to focus on increasing productionof low cost ounces, we secured funding for the BTTproject through a specific project finance metal streamingarrangement during the fourth quarter of the current year,and work has already started on the project.
We achieved higher grade and good recoveries, butplatinum-in-concentrate production before concentratepurchases for the year of 663,575 saleable Platinumounces was 9.6% down on prior year, due to lowertonnes mined and milled.
Underground milled head grade at 4.60 grammes pertonnes (5PGE+Au) increased by 2.1% compared to the4.51 grammes per tonne achieved in 2015. The overallmilled head grade was 4.59 grammes per tonne, up2.7% on the prior year. The ore mix milled, with reducedopencast Merensky, and improvements in the shafthead grades, were the main factors resulting in thehigher head grade.
Underground Ore Milled Grade
Year on year stability
Underground Ore Concentrator Recoveries
Sustained improvement in recovery rate
0.00
1.00
2.00
3.00
4.00
5.00
12 13 14Financial year
gram
mes
per
tonn
e
15 16
4.56 4.60 4.48 4.51 4.60
84.0
85.0
86.0
87.0
88.0
12 13 14Financial year
%
15 16
86.1
87.0 87.086.8 86.7
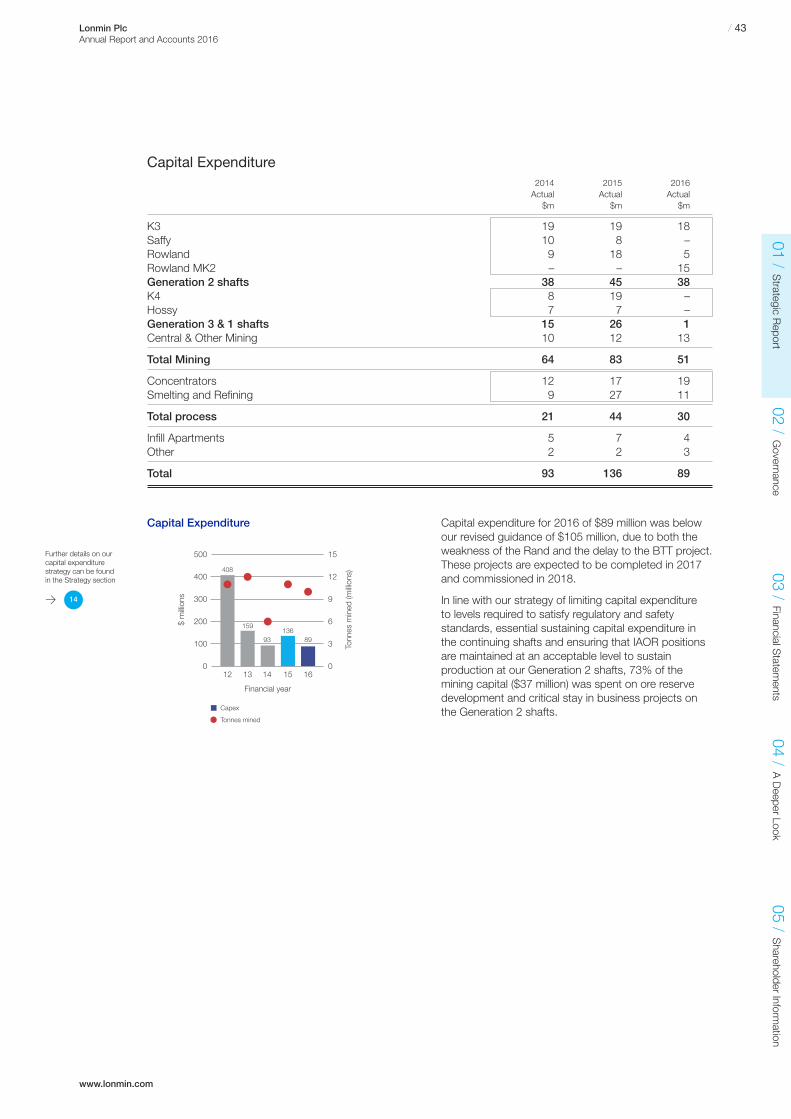
01 /Strategic R
eport02 /
Governance
03 /Financial S
tatements
04 /A Deeper Look
05 /Shareholder Inform
ation
www.lonmin.com
/ 43Lonmin PlcAnnual Report and Accounts 2016
Capital Expenditure Capital expenditure for 2016 of $89 million was belowour revised guidance of $105 million, due to both theweakness of the Rand and the delay to the BTT project.These projects are expected to be completed in 2017and commissioned in 2018.
In line with our strategy of limiting capital expenditureto levels required to satisfy regulatory and safetystandards, essential sustaining capital expenditure inthe continuing shafts and ensuring that IAOR positionsare maintained at an acceptable level to sustainproduction at our Generation 2 shafts, 73% of themining capital ($37 million) was spent on ore reservedevelopment and critical stay in business projects onthe Generation 2 shafts.
Capital Expenditure2014 2015 2016Actual Actual Actual$m $m $m
K3 19 19 18Saffy 10 8 –Rowland 9 18 5Rowland MK2 – – 15Generation 2 shafts 38 45 38K4 8 19 –Hossy 7 7 –Generation 3 & 1 shafts 15 26 1Central & Other Mining 10 12 13
Total Mining 64 83 51
Concentrators 12 17 19Smelting and Refining 9 27 11
Total process 21 44 30
Infill Apartments 5 7 4Other 2 2 3
Total 93 136 89
12 13 14 15 16
Financial year
$ m
illion
s
0
100
200
300
400
500
Capex
Tonnes mined
Tonn
es m
ined
(milli
ons)
0
3
6
9
12
15
408
159
93136
89
> 14
Further details on ourcapital expenditurestrategy can be foundin the Strategy section
/ 44 Lonmin PlcAnnual Report and Accounts 2016
Performance (continued)
Sustainability
Acknowledging all the social and labour challenges of the past, Lonminstrives to conduct business in a sustainable, socially and environmentallyresponsible manner, openly and transparently going beyond compliance,to address the spirit of the Mining Charter.
Social Labour Plans (SLP)
Key highlights of the 2016 performance include:
Total SLP investment of around R270.8 million,•excluding BEE procurement spend (2015 –R304 million);
Management HDSA representation of 52.4%•(2015 – 50.3%);
Women representation of 9.1% (2015 – 8.8%)•of permanent employees;
Total HRD spend of around R156.9 million•(2015 – R183 million) which represented 2.3%of payroll (2015 – 2.6%);
Limited delivery on all HRD programmes, due to•the restructuring in the first half of the year, duringwhich 1,428 employees were reskilled to reducejob losses as well as training constrained tomandatory / compliance training only in an effort toreduce cost and ensure the viability of the business;
Exceeding all preferential procurement targets for•capital, services and consumables; and
Completed building of first phase of in-fill apartments•– 325 units (225 single units, 100 family units) at acost of R90 million. Construction of an additional168 units (128 single units, 40 family units) inphase 2 commenced in June 2016 and is expectedto be completed by January 2017 at an estimatedcost of R69 million.
People
Reorganisation
Our pro-active response to the deteriorating PGMmarket conditions has repositioned our business.As a result, the reorganisation, initiated in 2015 andconcluded in March 2016, contributed to a headcountreduction of 5,433 people, and 1,428 employees werereskilled and redeployed into vacant, more productiveroles. Forced retrenchments were limited to 62 people.The reduction was achieved through active engagementsand consultation with the trade unions. That theprocess was completed without strike action or anysignificant operational disruptions is a tribute to thestrong relations built with and the emerging maturityof the majority union, AMCU.
Support offered to the employees during therestructuring included a dedicated help desk, a SMShelpline, easy access to payroll services and financialadvice from the external financial advisor, as well aspension and provident fund service providers. Thecounselling service offered emotional support and anystudy assistance or debts to the Company accruedduring the 2014 strike were written off for those exitingthe Company. The voluntary and forced separationpackages included severance pay and access to aportable skills training programme. Lonmin has a policyin place to assist so as to act in a manner that is bothsubstantially and procedurally fair in the event thatretrenchments are required.
Workforce profile
As at 30 September 2016, our total workforce was32,793, compared to 35,669 in September 2015,of which 25,296 were permanent employees and7,497 were contractors. The decrease in headcount isattributable to the reorganisation programme initiatedlast year, natural attrition and a greater proportion ofcontractors departing.
HDSAs in management
We have two methods of measuring our transformationperformance. The regulatory employment equity scoreis informed by legal parameters which include whitewomen. Scoring 52.4% (2015 – 50.3%) we onceagain surpassed the required target of 40% atmanagement level.
Our focus is to create a pipeline of strong internalcandidates, particularly HDSAs and women, to takeLonmin into the future. This is done, inter alia throughour bursary and graduate development programmesand prioritised recruitment.
Women in mining
Lonmin is committed to cultivating a workingenvironment that welcomes the contribution of womenin a traditionally male-dominated industry. In 2016,women comprised 9.1% of permanent employees(2015 – 8.8%) and 6.3% (2015 – 6.0%) of core miningpositions were occupied by women. We actively seekto attract and retain more women into the workforcebut this remains challenging.
> 29
HDSAs inmanagementis one of theGroup’s 11 KPIs.See page
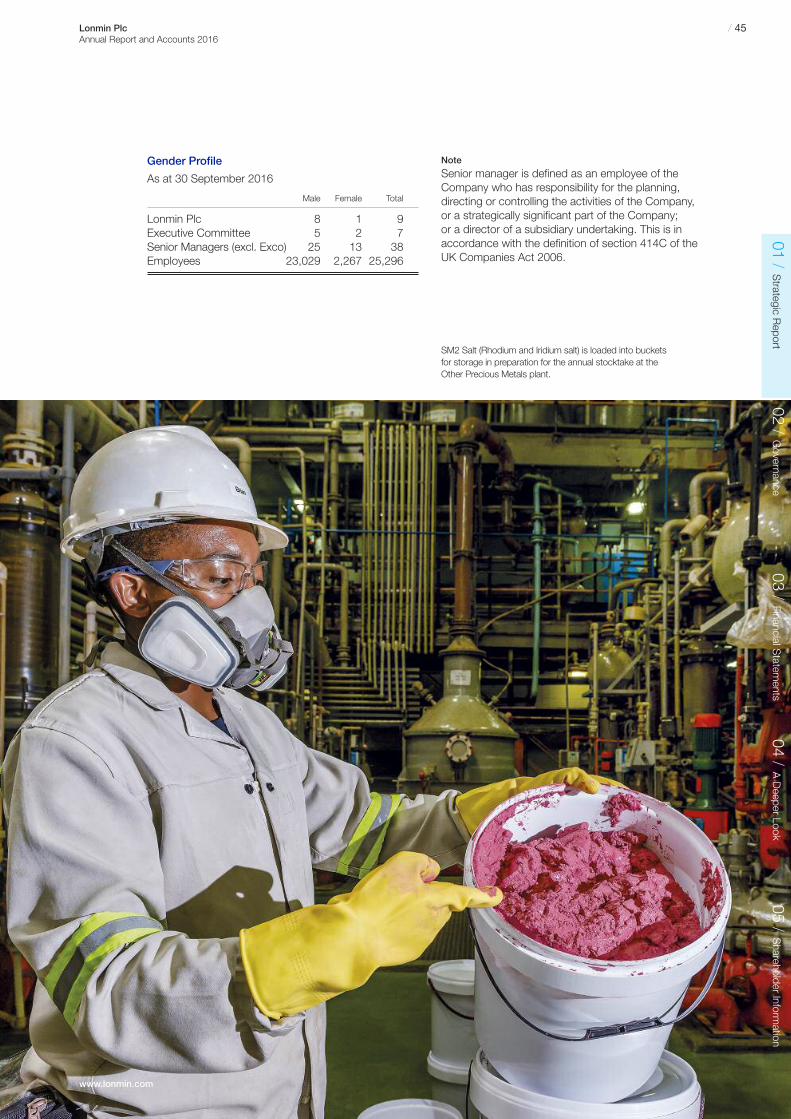
SM2 Salt (Rhodium and Iridium salt) is loaded into bucketsfor storage in preparation for the annual stocktake at theOther Precious Metals plant.
01 /Strategic R
eport02 /
Governance
03 /Financial S
tatements
04 /A Deeper Look
05 /Shareholder Inform
ation
www.lonmin.com
/ 45Lonmin PlcAnnual Report and Accounts 2016
Gender Profile
As at 30 September 2016
Male Female Total
Lonmin Plc 8 1 9Executive Committee 5 2 7Senior Managers (excl. Exco) 25 13 38Employees 23,029 2,267 25,296
Note
Senior manager is defined as an employee of theCompany who has responsibility for the planning,directing or controlling the activities of the Company,or a strategically significant part of the Company;or a director of a subsidiary undertaking. This is inaccordance with the definition of section 414C of theUK Companies Act 2006.

AMCU 81%
NUM 5%
Solidarity 3%UASA 3%
CEPPWAWU 1%
No Union 7%
/ 46 Lonmin PlcAnnual Report and Accounts 2016
Human Resources development
The industry shortage of critical skills is a risk to Lonmin’sability to achieve its strategic goals. The Company’semployee development initiatives aim to develop therequired skills in our employees to create an empoweredand productive workforce, subject to the impact of thecost cutting measures and restructuring.
Lonmin’s total investment in employee developmentdecreased to R156.9 million (2.3% of annual payroll)compared to R183 million in 2015 (2015: 2.6%)in 2016, as a result of the restructuring and cashpreservation measures.
The Company is taking the necessary steps to ensurethat the skills pipeline remains appropriate to meet ourforecasted needs.
Union relations
We respect and support our employees’ rights tocollective bargaining and freedom of association,and for unions to negotiate terms and conditions ofemployment on behalf of their members. Lonminsupports our workers’ rights to choose their organisedlabour representatives. We are committed to amulti-union environment, which aspires to peacefulco-existence of all unions registered with the Company.
Lonmin interacts with unions on an ongoing basis andat different levels, through the various union structuresand management interactions with union representatives.
Relationships with our majority union, while challenging,have strengthened and matured. This contributedsubstantially to the successful implementation of theworkforce restructuring, reduced work stoppages andthe successful resolution of the 2016 wage negotiations.
Wage settlement
The Company announced on 31 October 2016, thesettlement of the negotiations with AMCU about wagesand conditions of service. The three-year agreement,which is effective from 1 July 2016 to 30 June 2019,provides employees with a realistic and competitivesettlement and ensures the continued sustainability ofLonmin. We are pleased that the negotiation processwas concluded in a timely fashion and primarily withoutstrike action, which was the desire of all parties involved.
The key points of the agreement are:
Increases for Category 4 to 9: R1,000 per year •or 7% (whichever is greater) on basic salary
Increases for Officials (B and C band): 7% on Total•Cost to Company for each year of the agreement
Living Out Allowance increases by R100 in each•year of the agreement
Allowances calculated off pensionable basic•
Rock drill operators allowance increases by 6%•in each year
Performance (continued)
Holiday Leave Allowance calculated off Normal•Basic from year 2 (1 July 2017)
Medical contributions for Category 4-9 employees•will increase in January of each year. The medicalaid contributions increase will be based on themedical aid inflation as determined by the Board ofTrustees of the medical aid. The increase isestimated to be 13.5%.
At the end of this wage agreement, a rock drill operatorat Lonmin will earn R12,296 (basic salary) and aguaranteed package of R19,455.
The impact of these wage agreement for this bargainingunit is an increase of 7.8% in financial year one, 8.0%in financial year two and 7.1% in financial year threeor an average of 7.6% over the three-year period.
Below is an example of the basic agreed guaranteedpackages for Category 4 – 9 employees. These figuresexclude overtime and safe production bonuses whichmake up a significant part of employees’ wages.
Lowest paid entry level underground employee
Basic Cash GuaranteedDate Salary Remuneration Package
Current 8,713 11,614 13,4521 July 2016 9,713 12,768 14,672
1 July 2017 10,713 14,126 16,199
1 July 2018 11,713 15,328 17,588
Rock drill operators
Basic Cash GuaranteedDate Salary Remuneration Package
Current 9,296 13,152 15,0851 July 2016 10,296 14,363 16,368
1 July 2017 11,296 15,770 17,950
1 July 2018 12,296 17,043 19,455
The union representation at our operations is as follows:
Union Representation
> 21
Employee and Unionrelations is one of theprincipal risks of theGroup. See page
> 15
Further details on ourrelationships can befound in the Strategysection. See page

01 /Strategic R
eport02 /
Governance
03 /Financial S
tatements
04 /A Deeper Look
05 /Shareholder Inform
ation
www.lonmin.com
/ 47Lonmin PlcAnnual Report and Accounts 2016
Health
The Health Department provides comprehensivehealthcare to improve the quality of life of ouremployees and their families in accordance withLonmin’s safety, health and environmental strategy.
Health services are accessible to employees throughthree clinics and a hospital at the Marikana operations,and a clinic each in Limpopo and at the PMR in Brakpan.
The health complex covers four broad areas:
Occupational health and hygiene, including risk•assessment and monitoring of exposures thatcan be detrimental to employee health, medicalsurveillance, rehabilitation and functionalassessment;
Primary healthcare is available on a 24 hour /•365 days a year basis from the hospital and clinicsat Marikana. This includes management of injuriesand lifestyle diseases such as hypertension anddiabetes and treatment of HIV / Aids and TB;
Emergency care is offered through the emergency•and disaster management department, whichincludes Netcare 911 ambulances on site forserious injuries and illnesses that require immediatestabilisation and transportation to the hospital; and
The Wellness programmes proactively address•HIV / Aids and promote health. Initiatives includepeer educators, awareness campaigns, healthdays and talk topics. There is also an employeeassistance programme available to employeesand their immediate family.
Living Conditions
Integrated human settlement strategy
In recent years Lonmin’s human settlements initiativeshave been focused on achieving a series of sustainable,integrated housing initiatives. During this journey, theCompany has come to recognise that these initiativeswill require a multitude of strategic partnerships withproperty developers, providers of capital, micro-lendinginstitutions, local municipalities as well as provincial and national government. We consult regularly on thisstrategy with government, local authorities, employeesand their representatives, whose involvement has beenvital so far.
To this end, Lonmin and its organised labour arereviewing employee living standards as part of itsnew human settlements strategy. We believe thatour employees deserve decent living standards andshould have a choice of how and where they wantto live allowing for personal circumstances, affordableand market-related rates and integration into thebroader society during their employment at Lonmin.
To assist in achieving these important objectives,Lonmin issued a formal request for expressions ofinterest nationwide to partner with the Company reviewthe existing human settlement strategy. The reviewedstrategy should realise a tactical plan that addressesemployees’ wishes, needs, security and affordability toensure a fit-for-purpose and decent standard of living.We believe that the living conditions of our employeesand their families have a direct influence on their generalwellbeing and on their ability to focus and perform intheir working environments. At the same time, wecontinue to work on collaborative projects such as theSpecial Presidential Package to improve infrastructureand service provision. Achieving our vision for sustainable,integrated human settlements requires careful planning,consultation and coordination between all stakeholders,including employees, communities, potential funders,developers, unions, local municipalities and all levelsof government.
Affordable accommodation
The Marikana Housing Development Company is aSection 21 non-profit company that was establishedfor this purpose. It manages the 1,149 two-bedroomhomes Lonmin has made available for outright purchaseor on a rent-to-buy scheme since 2005. The sellingprice of these 45 meters squared homes is R62,426,including land. To date, 369 people (2015: 325) havetaken ownership of these houses.
While affordability and access to mortgage fundingcreate serious challenges, marketing and educationprogrammes are being ramped up to encourageemployees to purchase the houses.
Infill apartments per SLP commitments
All 128 single sex hostel blocks were successfullyconverted into renovated single and family apartmentblocks at a total cumulative cost of R387 million in2014. The Infill Apartment project develops the areasbetween the existing converted blocks to utilise thespace available and to access the existing installed bulkinfrastructure around the converted hostels. Lonmincommitted to spend R500 million over five years in termsof its SLP commitments, to develop 1,240 modernapartments. The scope of the project includes sportand recreation, paving and landscaping, transformingthe space into employee housing villages.
Phase 1 of construction saw 325 units completed atKaree in January 2016 at a cost of R90 million, withlandscaping and paving still underway. Determinationof the rentals for these units will be finalised post thewage negotiations with the majority union.
Construction of another 168 apartments are inprogress, as part of Phase 2 at a cost of R70 million.Phase 3 and Phase 4 of the apartments programme isscheduled to be rolled out in 2017 and 2018 respectively.
/ 48 Lonmin PlcAnnual Report and Accounts 2016
Performance (continued)
> 24
Regulatory risk is oneof the principal risksfor the Group. Seepage
Collaboration projects
These are long-term projects that rely on collaborationwith multiple partners and stakeholders. The collaborationprojects include Marikana Extension 2, MarikanaExtension 5 and Mooinooi.
Marikana Extension 2
Lonmin contributed 50 hectares of serviced land fordevelopment following the announcement of theSpecial Presidential Package initiative in 2013. This land,known as Marikana Extension 2, was donated directly tothe Department of Human Settlements, the North WestPublic Safety and Liaison Department and RustenburgLocal Municipality. An estimated 2,658 dwellings ofvarious typologies is expected to be constructed on theland, which will benefit community members, includingLonmin employees. At the close of phase 1 in March2016, 292 breaking-new-ground units had beenconstructed by the provincial government and 252community residential rental units. As agreed with thestakeholders from the provincial government and localmunicipality offices, at the inception of the agreement,70% of the units constructed are allocated to LonminCategory 4 – 9 employees. Phase 2 construction ofscoped units is yet to commence and at the time ofpublishing this report the Company could not ascertaina clear commitment from the relevant stakeholders bywhen this will be completed.
Marikana Extension 5
Feasibility studies to construct units continue on the134 hectares of unserviced land at Marikana Extension 5.Lonmin is seeking to enter into partnerships withprospective developers in order to develop more housingunits and facilitate access to decent accommodation.
Mooinooi
Initial feasibility studies conducted by the Company haveindicated that 25 hectares available for development inMooinooi could accommodate 2,500 high density units.Rezoning and consolidation of the various servicedstands are being pursued with the Madibeng LocalMunicipality to partner with prospective developers forsuch an undertaking. Concurrent with the rezoningapplication we are in discussion with Madibeng toenhance the bulk services supply and infrastructure.
The request for expressions of interest for LonminEmployee Housing Strategy will cover these initiatives.
Transformation through Enterprise Developmentand Procurement
Lonmin is committed to the principle of transformationand our contribution to South Africa’s transformationagenda has a direct impact both on our reputationand on our social licence to operate. Transformationis promoted throughout the business and is acommitment in terms of the Mining Charter, specificallythrough the ownership and procurement clauses thatseek to accelerate the participation of HDSAs in themainstream economy.
BEE equity ownership
In November 2014, Lonmin successfully completedthree BEE transactions which cumulatively gave theCompany an additional 8% equity empowerment.Lonmin achieved the target of 26% BEE ownership by31 December 2014 as required by the Mining Charter.These transactions support the improvement anddevelopment of local communities and align theinterests of communities, employees and shareholders.
At the beginning of financial year 2016, the BapoCommunity indicated that it did not have the financialresources to participate in the Rights Issue. In order to retain its BEE equity ownership at 26% following the Rights Issue, the Directors therefore concluded that it was in the best interests of Shareholders for the Company to issue sufficient new Shares atUS$0.000001 per share to the Bapo Community inorder to maintain its proportional interest in Lonmin on a post-Rights Issue basis.
The Bapo BEE Shares were issued in a separateplacing to the Rights Issue and the Bapo Communityagreed not to take up or trade its Rights. The effect of the Bapo BEE Placing was to maintain the BapoCommunity’s current minority holding of less than 3%.of the Shares following issue of the New Sharespursuant to the Rights Issue. As the Bapo BEE Shareswere issued in addition to the offer of New Shares underthe Rights Issue, they had a minor dilutive effect on theother Shareholders in Lonmin. The Bapo Communityagreed to accept a ten-year lock-in period with regardto the Bapo BEE Shares acquired by it under the Bapo BEE Placing.
Once empowered always empowered principle
The historical “Once Empowered Always Empowered”principle continues to be a subject of legal clarityinvolving the Chamber of Mines on behalf of the industryand the South African government’s Department ofMinerals and Resources.
The New Mining Charter
The 2010 Mining Charter contained targets until 2014.Various stakeholders are engaging to agree the termsfor a new Mining Charter. In the interim the 2014 targetscontinue to apply.
Bapo transactions
Four contracts have been awarded to the Bapo interms of the 2014 Bapo transaction and have beenimplemented. These are:
The Yellow Equipment contract with a gross value•of R45 million per annum over a five-year period,totalling R225 million;
The Ore Transport contract with a gross value of•R25 million per annum and R125 million in total;
A PPE contract worth R100 million per annum and•R500 million in total; and
A bussing contract worth R100 million per annum•over an eight-year period, totalling R800 million.

01 /Strategic R
eport02 /
Governance
03 /Financial S
tatements
04 /A Deeper Look
05 /Shareholder Inform
ation
www.lonmin.com
/ 49Lonmin PlcAnnual Report and Accounts 2016
The awarding of these contracts has resulted in Lonmincomplying with (and exceeding by R1.45 billion) itsprocurement undertakings given to the Bapo.
Governance within the Bapo entities that manage theabove contracts remains a work in progress. Cash flowsand liquidity concerns are also a focal point for the Bapo.
Employee Profit Share Scheme (EPSS)
The EPSS was implemented in 2014 and aims toprovide our employees with economic partnershipand ownership whilst simultaneously sharing theresponsibilities and involvement that this ownershipbrings. The implementation of this EPSS enabled Lonminto receive an HDSA equity accreditation of 3.8%.
Community trusts
2014 saw the establishment of two separate communitytrusts. Each trust holds 0.9% of the ordinary shares inLonplats, and is entitled to dividend payments whichhave been mandated for upliftment projects in therespective communities. To the extent that no dividendis payable in a particular year, each community trust willbe entitled to a minimum annual payment of R5 millionescalating in line with CPI each year. The first transferof R5 million to each trust was made during the year.The funds are managed by ward councillors through aboard of trustees, which is mandated to disburse fundsfor upliftment projects in the respective communities.The establishment of these trusts, governance structuresand initial capital, could encourage other investors tocontribute to enable more substantial development.
While these transactions have been successfullyconcluded, there has been a challenge to thetransaction by a faction within the Bapo Community.Lonmin continues to engage with all stakeholders toresolve the issues of concern.
Preferential procurement
Lonmin’s preferential procurement strategy requiresprocurement adjudication to favourably weight supplierswith broad-based black economic empowerment(B-BBEE) credentials, female representation and,where possible, Greater Lonmin Community (GLC)companies. Certain procurement areas are ring-fencedfor GLC and BEE suppliers only, and only GLCcompanies are invited to tender for capital items.
The Mining Charter sets targets of procuring 70% ofservices, 50% of consumable goods and 40% of capitalgoods from HDSA owned suppliers. Lonmin recognisesthe importance of actively involving citizens who werepreviously excluded from the mainstream of the economyand has far exceeded these procurement targets.
The biggest challenge we face is increasing the numberof black women-owned suppliers in our vendor base.We are making an effort to address this area throughvarious enterprise development initiatives and projects,such as the manufacturing of personal protectiveequipment. The procurement department works closelywith the enterprise development department to developlocal suppliers that show potential.
Preferential procurement performanceCapital Consumablegoods goods Services
Year (%) (%) (%)
Target 40 50 702012 50 54 642013 64 58 552014 67 67 682015 64 74 762016 72 72 50
Community Relations andOur Corporate Citizenship Agenda
Stakeholder Engagement and CorporateCommunication
Our continued focus on communication andtransparency has gone a long way to aligning theCompany and our stakeholders to a shared vision of asustainable and profitable Lonmin through all cycles.
Community Value Proposition
The Community Value Proposition project, now in itsthird year, has enabled the Company to deliver focusedsocial investment that is impactful and sustainable.Our investment includes community education andskills development, community healthcare, infrastructuredevelopment and enterprise development.
Community education and skills development
Lonmin community education programme providessupport to 22,500 school going learners in the GLC in avalue chain of the key areas of education: infrastructuredevelopment; learner support; parent support; schoolnutrition and sports; arts and culture. Community skillsdevelopment programmes include engineering andartisan training; portable skills; adult education andtraining; and community study assistance.
Community healthcare
Lonmin provide holistic healthcare to employees andthe broader community comprising awareness,promotion, prevention and infrastructure development.
Infrastructure development
Lonmin’s infrastructure development includes bulkwater infrastructure, road upgrades, waste removal andlighting to improve public safety. We continue to workwith all tiers of government to ensure coordination andalignment in the provision of social infrastructure.
Enterprise development
Lonmin is the anchor supporter of the Shanduka BlackUmbrellas’ Mooinooi incubator established to scout,train, mentor and assist local entrepreneurs andemerging black businesses with support services thatenable them to flourish.

/ 50 Lonmin PlcAnnual Report and Accounts 2016
Performance (continued)
Financial yearFresh water consumption (’000m3)
Water efficiency (m3/PGMoz)
12 13 14 15 160
2,000
4,000
6,000
8,000
10,000
Fres
h w
ater
con
sum
ptio
n (’0
00m
3 )
0
2
4
6
8
Wat
er e
ffici
ency
(m3 /
PG
Moz
)
Financial yearEnergy consumption (Terajoules)2
Water efficiency (GJ/PGMoz)2
12 13 14 15 160
1,000
3,000
5,000
2,000
4,000
6,000
7,000
Ene
rgy
cons
umpt
ion
(Ter
ajou
les)
2
0
1
2
4
6
5
3
Ene
rgy
effic
ienc
y (G
J/P
GM
oz)2
Our EnvironmentOur strategic commitment to operational excellenceand ethical business practices require us to minimisethe environmental footprint of our operations and,where necessary, mitigate or remediate our impacts.This is achieved by improving the efficiency with whichwe use input resources such as energy and water.
While the resource-intensive nature of the primaryproduction of PGMs remains a challenge for theplatinum industry, these metals play an important rolein reducing pollutants through technologies includingcatalytic converters and fuel cells.
The Company’s ISO 14001 environmental managementsystem is well managed and we have maintained ourcertification through annual third-party verification.The ISO 14001 environmental management system isa self-regulatory tool that promotes the minimisationand management of potential environmental impacts.A range of internal and external audits are conductedto monitor and verify the integrity of the environmentalmanagement system and the Company’s overallenvironmental performance.
Climate change poses a range of risks and opportunitiesto the mining industry. Physical risks that could havean effect on our operations include changes in weatherpatterns (i.e. extreme drought, flood, precipitation,temperature) which in turn may lead to water shortages,water discharges, increased operating costs, negativeeffects on local communities, impacts on the supplychain and biodiversity loss. The issue of water scarcityis likely to be further exacerbated by climate changeand may lead to operational closures and down timeswhere water is not available in sufficient quantities tosustain the operations and our people.
Lonmin’s business strategy addresses climate changethrough various mitigation and adaptation initiatives,including energy efficiency and energy security projects,seizing opportunities in PGM marketing, investmentin fuel cell technology, feasible renewable energy toreduce emissions and water conservation anddemand management.
Water management
South Africa is a water scarce country from a resourceavailability perspective. This is exacerbated by variouschallenges impacting the availability of this importantand critical resource including climate change, agingand poor maintenance of infrastructure, illegal waterconnections, and the current drought conditions.
The Water Conservation and Demand ManagementStrategy aims to secure access to sufficient water tosupply our operations and sustain our LoBP, optimisefreshwater consumption and use process water moreefficiently and minimise contamination of ground andsurface water resources around our operations,ultimately to reduce our closure liabilities.
We continue to investigate opportunities to reuse waterand identify alternative water sources outside of RandWater supply, including borehole water and thepossibility of establishing water treatment facilities.Through the closed reticulation system, 15.4 millionmeters cubed (2015: 13.4 million meters cubed) ofwater was recycled and reused during 2016.
We also support local municipalities and communitiesthrough the treatment of five megalitres of waste waterfrom communities per day at two waste water treatmentplants and tanker discharge points. The Companyalso provides maintenance support to the municipalityservices and will remove blockages, when notified.As part of our environmental management inspectionson our infrastructure we also inspect municipalinfrastructure related to waste water treatment. We notifyour municipalities and remedy where possible.
Fresh Water Consumption and Water Efficiency1
Energy
Lonmin’s energy management strategy is based on theSANS 50001 standard. While electricity supply stabilisedduring the year, we continue to communicate regularlywith Eskom regarding agreed demand levels, powerinterruptions and supply constraints.
Electricity forms the majority of Lonmin’s energyconsumption and is used in many critical applicationsincluding powering surface and underground ventilationfans, dewatering pumps, material handling equipment,processing plants and winder plants. Given thatelectricity accounts for approximately 7.5% of ourannual expenditure including capital expenditure,energy efficiency initiatives are important for costcontainment and business viability, as well as tominimise greenhouse gas emissions.
During 2016, Lonmin energy efficiency projects included:
Optimising the compressed air reticulation systems•through the implementation of focused energycontrol room for these systems; and
Tracking the performance of our roll over projects•including lighting efficiency roll out and the 45kWenergy-efficiency underground fans. Savings ofR28 million, 35000mWh, and 35,000 CO2
emissions were realised for this project in 2016.
Energy Consumption and Energy Efficiency
> 29
Energy consumptionis one of the Group’sKPIs. See page

01 /Strategic R
eport02 /
Governance
03 /Financial S
tatements
04 /A Deeper Look
05 /Shareholder Inform
ation
www.lonmin.com
/ 51Lonmin PlcAnnual Report and Accounts 2016
Carbon emissions
Lonmin’s most significant source of greenhouse gas(GHG) emissions relates to indirect emissions (scope 2)arising from the use of electricity from a predominatelycoal-based power generation system.
Our target is to reduce scope 1 and 2 GHG emissionsby 4% by 2017 from a 2012 baseline year. In 2016,absolute GHG tonnes of CO2 increased by 5.9%against the 2012 baseline for scope 1 and 2 emissions.
However GHG efficiency (i.e. intensity) has improvedby 5.4% from 1.212 tCO2e/PGM ounce in 2015 to1.146 tCO2e/PGM ounce in 2016. In total, Lonminemitted 1,665 ktCO2e in 2015 (2015: 1,758 ktCO2e). The scope of emissions reporting increased this year to include scope 1 emissions from the Mooinooi landfillsite and waste water treatment works at the Marikanaoperations, these sources accounted for 0.5% of the2016 carbon profile, however are not yet included in the target and performance.
1 Water efficiency, indicating consumption per PGM ounce produced (m³ per PGM ounce)
2 Conversion: one terajoule = 1,000 Gigajoules; one Megawatt = 0.0036 terajoules (2006 IPCC Guidelines for national Greenhouse GasInventories, Volume 2 Energy, Chapter 1 Introduction)
Scope 173,147.07 tonnes (CO2e)
4.4%
Scope 21,587,336.86 tonnes (CO2e)
95.3%
Scope 34,735.75 tonnes (CO2e)
0.3%
Scope 3 emissions Total emissionsScope 1 emissions Scope 2 emissions
12 13 14 15 160
200
400
600
800
1,000
1,200
1,400
1,600
1,800
Tonn
es C
O2e
(’00
0)
Financial year
SourceScope 1
(tonnes CO2-e)Scope 2
(tonnes CO2-e)Scope 3
(tonnes CO2-e)Total Emissions in
2016 (tonnes CO2-e)
Marikana 70,035.47 1,505,123.37 3,390.09 1,578,548.93
PMR 2,569.52 17,966.32 95 20,630.97
Limpopo 542.09 64,247.17 0.00 64,789.25
Group – – 1,250.52 1,250.52
Total 73,147.07 1,587,336.86 4,735.75 1,665,219.67
Scope 1 Direct emissions from operations that are owned or controlled by Lonmin; Scope 2 Energy indirect emissions from electricity;Scope 3 All indirect emissions that occur outside of Lonmin, upstream and downstream
GHG Scope 1
Scope 11: Direct emissions from operations that are owned or controlled by Lonmin:
Mobile combustion (19,646.3tCO2e)•
Stationary combustion (38,062.4tCO2e)•
Explosives (5,868.83tCO2e)•
Non-combustion product use (248.83tCO2e)•
Disposal of waste to landfill•(Lonmin operated and owned) (9,200.100tCO2e)
Waste Water Treatment Works •(Lonmin operated and owned) (120.54tCO2e)
Carbon footprint scope 1, 2 and 3 contribution (%) Total GHG emissions (’000 tonnes C02e)
/ 52 Lonmin PlcAnnual Report and Accounts 2016
Performance (continued)
Waste management
Mining, processing and refining of metals generateextensive amounts of general and hazardous wastethat must be properly managed to avoid impacts onthe natural environment and surrounding communities.Lonmin’s governance planning and managementprogrammes aim to prevent and reduce wastegeneration, and facilitates alignment to procedures inorder to prevent, reduce, and recycle wherever possible.
The Lonmin Waste Management Standard defines ourapproach to waste management in the business toensure compliance and reduce the Company’s impacton the environment. The Standard has been integratedinto Key Performance Indicator audits and standardoperating procedures across all operations.
General and hazardous waste is tracked againsttargets to minimise waste disposed to landfill. Our30 September 2017 target is to reduce general wasteto landfill by 5%, from the 2012 baseline year. Generalwaste to landfill decreased by 15% in 2016 comparedto the 2012 baseline year.
Our five-year target (for 30 September 2017) is toreduce hazardous waste to landfill by 5% off the 2012baseline year. In 2016, hazardous waste to landfillshowed a 10% decrease from the 2012 baseline year.The operation of the desulphurisation plant hasimproved, in conjunction with the decrease inproduction, as well as unforeseen plant shut downs,which has resulted in a decrease in waste generation.
The community waste swop shop at Wonderkop in the North West continues to be a highlight and receiveda commendation from the Northwest ProvincialDepartment of Environment. The viability of a mobilewaste swop shop, to reach a number of differentcommunity areas, is being investigated.
Air quality
Lonmin acknowledges its responsibility to continuouslymanage and minimise the impact of emissions fromour operations on ambient air quality. The Air QualityAct regulates air quality in South Africa throughAtmospheric Emission Licences (AELs) and focuses onboth source and impact on the ambient environment.Amendments to the five-year AELs at the smelter, basemetals refinery, precious metals refinery and Assaylaboratory were approved during the year.
Sulphur dioxide (SO2), Particulate Matter (PM) andNitrogen Dioxide (NOx) are the three pollutantsregulated for our activities at our smelter. SO2 emissionsare minimised through air pollution control equipmentincluding the completed fugitive capture system. Thechemical process used to remove the SO2 generatescalcium sulphite (CaSO3), which is a hazardous wastestream. We continue to research alternative technologythat could generate a by-product rather than a wastestream. SO2 emissions averaged 13.6 tonnes per day,an increase from 11.2 tonnes per day in 2015, due totest-work being conducted on the optimization of limeconsumption, to reach 2020 AEL limits, as well as loweravailability on the Regeneration Thickener.
Biodiversity and land
The ecosystem vulnerability of the operational area isnot only impacted on by mining and related activities,but by various other influences such as humansettlement, poor agricultural practices, industry andbusiness. Lonmin therefore view biodiversity as amaterial aspect because rehabilitation is a keyregulatory and financial requirement for the Company.Biodiversity is also linked to annual closure liabilities andbecause biodiversity and ecosystem services integrityis material for sustainability of the natural environmentand our stakeholders.
The updated biodiversity action plan (BAP) for theMarikana Operations covers all mining operations andmeets the requirements of the relevant legislation,regional and national conservation plans and theMining and Biodiversity Guidelines. Our approach tobiodiversity management aligns with the ICMM Principlesand their position statement on mining and protectedareas as well as with the DMR Biodiversity Guidelines.
Internal and external audits verify compliance with landmanagement legislation, EMP Performance Assessmentcommitments and ISO 14001 requirements. Activitiesduring prospecting and exploration are managedthrough the Environmental Drilling Standard with regardto on-site operational environmental requirements andrehabilitation. Where third parties have access to partsof our operations through their mining rights, we ensurethat they are held accountable to our standards.
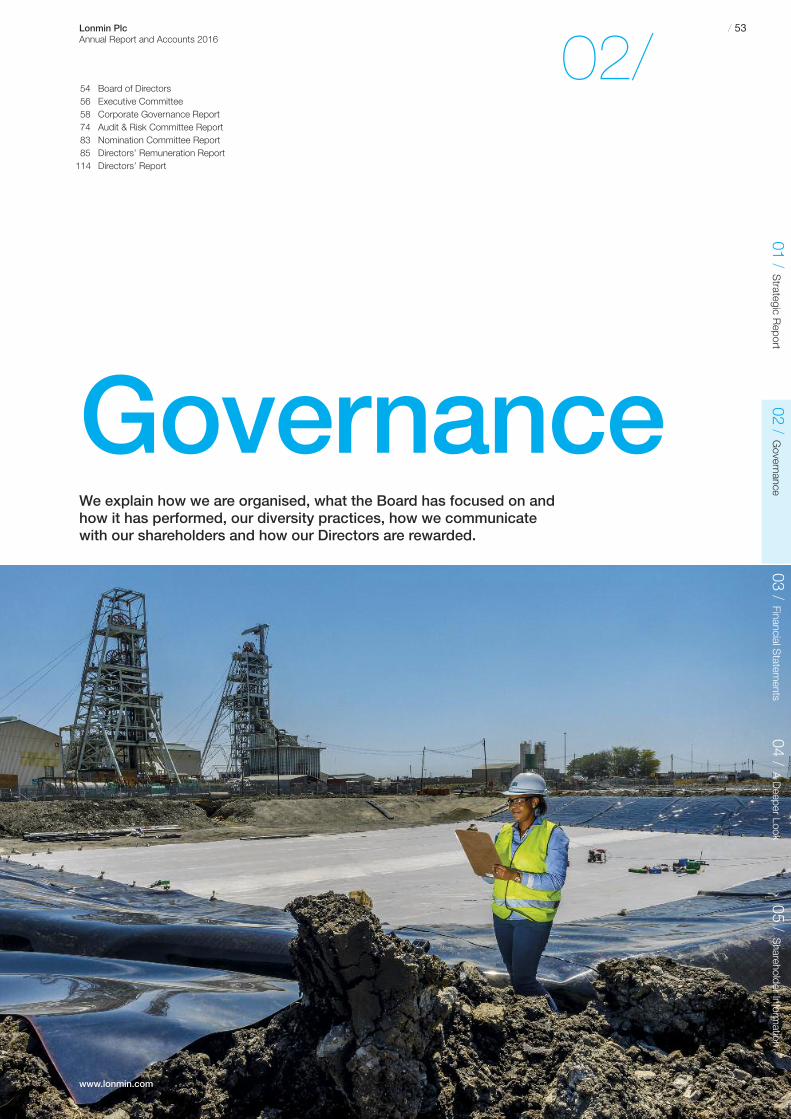
www.lonmin.com
Governance
01 /Strategic R
eport02 /
Governance
03 /Financial S
tatements
04 /A Deeper Look
05 /Shareholder Inform
ation/ 53Lonmin Plc
Annual Report and Accounts 2016
54 Board of Directors56 Executive Committee58 Corporate Governance Report74 Audit & Risk Committee Report83 Nomination Committee Report85 Directors’ Remuneration Report114 Directors’ Report
02/
We explain how we are organised, what the Board has focused on andhow it has performed, our diversity practices, how we communicatewith our shareholders and how our Directors are rewarded.

/ 54 Lonmin PlcAnnual Report and Accounts 2016
Board of Directors
Brian Beamish (59), Non-executive Chairman (British and South African)
Independent: No
Appointed to the Board: 1 November 2013
Experience:• Former Group Director, Mining and Technology at Anglo American, where he worked for 36 years• Non-executive director of JSE-listed Anglo American Platinum Limited from May 2010 to 30 September 2013• Previous executive roles include four years as Operations Director of Anglo Platinum and COO and subsequently CEOof Anglo American’s global Base Metals business
• Overall career-long experience of the mining industry, largely gained in operational roles in South Africa and latterly inother parts of the world, particularly South America
Qualifications:• Graduate in mechanical engineering from Wits University and of the PMD programme at Harvard Business School
External commitments: None
Ben Magara (49), Chief Executive Officer (CEO) (Zimbabwean)
Independent: No
Appointed to the Board: 1 July 2013
Experience:• Former Chief Executive Officer of Anglo Coal South Africa and the Executive Head responsible for Engineering andCapital Projects at Anglo Platinum
• Director of Anglo American South Africa (2006-2013)• Chairman of Richards Bay Coal Terminal and the Eskom 2008 Coal Working Group• Extensive experience in both underground and surface mining, comprising both hard and soft rock mining
Qualifications:• Graduate mining engineer from the University of Zimbabwe• Has completed various management programmes including the Accelerated Development Programme at the LondonBusiness School, UK and the AMP at the Gordon Institute of Business Science, at the University of Pretoria
• Additional experience in the energy and logistics industries
External commitments: None
Barrie van der Merwe (40), Chief Financial Officer (CFO) (South African)
Independent: No
Appointed to the Board: 17 May 2016
Experience:• Former CFO of Debswana Diamond Company, the world’s leading producer of rough diamonds by value and a jointventure between the Botswana government and De Beers, between 2012 and 2015
• Previously held several senior financial management positions with Anglo American Plc and Anglo Platinum, spanning10 years between 2002 and 2012 (the most recent being head of finance, reporting directly to Anglo Platinum’s thenfinance director)
• Held several non-executive directorships, including at Morupule Coal Mine Limited between 2013 and 2015 andWesizwe Platinum Limited between 2013 and 2015
Qualifications:• Chartered accountant• Holds a B Com (Hons) degree in accounting from the University of Pretoria
External commitments: None
Ben Moolman (55), Chief Operating Officer (COO) (South African)
Independent: No
Appointed to the Board: 25 June 2015
Experience:• Overall 30 years of mining experience• Previously spent 10 years at Lonmin where he headed up mining operations at Karee• 10 years at Impala• 10 years at Glencore Xstrata, quickly rising to managing Director of their platinum division with responsibility for thevalue chain across all mining and processing operations
• Re-joined Lonmin in August 2014 to head the newly established Business Support Office before promotion to the roleof COO
Qualifications:• Holds a BSc in Engineering (Mining) from the University of the Witwatersrand and several management qualificationsobtained at various international institutions
External commitments: None
There is still much to do. The Board and our Executive Managementare concentrating their efforts to ensure that the Company achievesits targeted objectives over the medium-term to ensure sustainabilityand preserve long-term value for our shareholders.

01 /Strategic R
eport02 /
Governance
03 /Financial S
tatements
04 /A Deeper Look
05 /Shareholder Inform
ation
www.lonmin.com
/ 55Lonmin PlcAnnual Report and Accounts 2016
Jim Sutcliffe (60), Non-executive Director (British)
Independent: Yes
Appointed to the Board: 10 August 2007
Committees: Chairman of the Remuneration and Nomination Committees and a member of the Audit & Risk, and theSocial, Ethics & Transformation Committees
Experience:• Held senior executive roles with Prudential UK and Old Mutual, being Group CEO of the latter from 2001-2008• Served as a Non-executive Director of the Financial Reporting Council (FRC), where he chaired the FRC’s Codes& Standards Committee
Qualifications:• Qualified actuary, with extensive UK and South African business experience
External commitments:• Holds various board positions, including at Liberty Group and Liberty Holdings• Chairman of Sun Life Financial (amongst others)
Varda Shine (53), Non-executive Director (British)
Independent: Yes
Appointed to the Board: 16 February 2015
Committees: Member of the Audit & Risk, Nomination and Remuneration Committees
Experience:• Over a period of 30 years held several executive level and managerial positions within De Beers Trading Company andDiamdel Israel (De Beers’ principal trading subsidiary)
• Subsequently served eight years as the CEO of De Beers Trading Company• Has held two non-executive positions chairing joint ventures between De Beers and the Botswanan and Namibiangovernments respectively
Qualifications:• Completed the Business Management Programme at Technion, the Israel Institute of Technology and the AdvancedManagement Programme at Oxford University
External commitments: Director of Mineral Development Company Botswana and MDC Botswana Diamond ExperimentFund as well as a trustee of the Teenage Cancer Trust
Kennedy G Bungane (42), Non-executive Director (South African)
Independent: No
Appointed to the Board: 1 March 2016
Committees: Member of the Safety, Health & Environment Committee and the Social, Ethics & Transformation Committee
Experience:• Appointed CEO of Phembani in August 2014 and led the merger of Pembani and Shanduka effective 11 December 2015• Previously CEO of Barclays Africa responsible for all operational and business activities of 13 Barclays and Absa Banksoutside South Africa
• Previously Group Executive member of the Standard Bank Group and CEO of Standard Bank of South Africa’s Corporateand Investment Bank
Qualifications:• BCOMM graduate in Corporate Finance & Investment Finance from the University of Natal• Holds an MBA from Gordon Institute of Business Science (GIBS) University of Pretoria• In 2006, completed the Advanced Management Program at Harvard Business School
External commitments: None
Dr Len Konar (62), Non-executive Director (South African)
Independent: Yes
Appointed to the Board: 11 March 2010
Committees: Chairman of the Audit & Risk Committee and the Social, Ethics & Transformation Committee and a memberof the Nomination Committee
Experience:• Previous career at the University of Durban-Westville• Has chaired the boards of leading South African companies including Exxaro Resources and Steinhoff International• Previously held positions on a number of boards including Sappi and Alexander Forbes
Qualifications:• Qualified chartered accountant• Degrees in accounting and commerce from South African and US universities
External commitments: Holds various directorships, including at Old Mutual Investment Group (South Africa) Limited andExxaro Resources Limited. A member of the King Committee on Corporate Governance, as well as a member of theCorporate Governance Forum and the Institute of Directors
Jonathan Leslie (65), Non-executive Director (British)
Independent: Yes
Appointed to the Board: 4 June 2009
Committees: Chairman of the Safety, Health & Environment Committee and is a member of the Nomination andRemuneration Committees
Experience:• 26 years with Rio Tinto, including nine years’ service on its board, in roles including Mining Director and Chief Executiveof the Copper and later the Diamonds & Gold Product Groups
• Former CEO of Sappi, executive chairman of Nikanor and CEO of Extract Resources Limited
Qualifications:• Graduate in jurisprudence and a qualified barrister
External commitments: Director of Swakop Uranium and a partner of Sandown Bat Resources

/ 56 Lonmin PlcAnnual Report and Accounts 2016
Executive CommitteeWe have come a long way in 2016. Our return to profitability andthe increase in our cash position and liquidity places us in a goodposition to explore options to maximise value for our shareholders.
Ben Magara (49), Chief Executive Officer (CEO) (Zimbabwean)
Appointed to the Board: 1 July 2013
Experience:• Former Chief Executive Officer of Anglo Coal South Africa and the Executive Head responsible for Engineering andCapital Projects at Anglo Platinum
• Director of Anglo American South Africa (2006-2013)• Chairman of Richards Bay Coal Terminal and the Eskom 2008 Coal Working Group• Extensive experience in both underground and surface mining, comprising both hard and soft rock mining
Qualifications:• Graduate mining engineer from the University of Zimbabwe• Has completed various management programmes including the Accelerated Development Programme at the LondonBusiness School, UK and the AMP at the Gordon Institute of Business Science, at the University of Pretoria
• Additional experience in the energy and logistics industries
Barrie van der Merwe (40), Chief Financial Officer (CFO) (South African)
Appointed to the Board: 17 May 2016
Experience:• Former CFO of Debswana Diamond Company, the world’s leading producer of rough diamonds by value and a jointventure between the Botswana government and De Beers, between 2012 and 2015
• Previously held several senior financial management positions with Anglo American Plc and Anglo Platinum, spanning10 years between 2002 and 2012 (the most recent being head of finance, reporting directly to Anglo Platinum’s thenfinance director)
• Held several non-executive directorships, including at Morupule Coal Mine Limited between 2013 and 2015 andWesizwe Platinum Limited between 2013 and 2015
Qualifications:• Chartered accountant• Holds a B Com (Hons) degree in accounting from the University of Pretoria
Ben Moolman (55), Chief Operating Officer (COO) (South African)
Appointed to the Board: 25 June 2015
Experience:• Overall 30 years of mining experience• Previously spent 10 years at Lonmin where he headed up mining operations at Karee• 10 years at Impala• 10 years at Glencore Xstrata, quickly rising to managing Director of their platinum division with responsibility for thevalue chain across all mining and processing operations
• Re-joined Lonmin in August 2014 to head the newly established Business Support Office before promotion to the roleof COO
Qualifications:• Holds a BSc in Engineering (Mining) from the University of the Witwatersrand and several management qualificationsobtained at various international institutions

01 /Strategic R
eport02 /
Governance
03 /Financial S
tatements
04 /A Deeper Look
05 /Shareholder Inform
ation
www.lonmin.com
/ 57Lonmin PlcAnnual Report and Accounts 2016
Lerato Molebatsi (47), Executive Vice President, Communications and Public Affairs (South African)
Appointed to Exco: 1 September 2013
Left Lonmin: 30 September 2016
Experience:• Previously worked at the Department of Labour (since September 2011) as Deputy Director General: Corporate• Formerly held senior executive positions at Sanlam, Old Mutual and Alexander Forbes• With her considerable experience in labour dynamics, community engagement and government and regulatorypolicy, Lerato was responsible for corporate communications, media and public relations, stakeholder management,regulatory affairs and community development
Qualifications:• Holds a Bachelor of Arts degree in Psychology from the University of Johannesburg and a postgraduate diplomafrom the University of Witwatersrand
Abey Kgotle (45), Executive Vice President, Human Resources (South African)
Appointed to Exco: 1 September 2013
Experience:• Previous roles at Lonmin prior to appointment as EVP of Human Resources in September 2013 have includedExecutive Manager External Affairs and Executive Manager Human Resources
• Previously worked in executive human resources roles at GrafTech South Africa, City of Johannesburg,Samanacor Manganese and Denel
• Extensive overall experience in human resource management, labour relations, community investment andstakeholder relations
Qualifications:• Holds a Bachelor of Social Sciences degree from the University of the North West and a Masters Diploma inHuman Resource Management
Mike da Costa (52), Executive Vice President, Business Support Office (South African)
Appointed to Exco: 1 July 2015
Experience:• Previous roles at Lonmin prior to appointment to his current position have included Senior Manager, Mining(Limpopo operations), Vice President, Mining (Karee operations) and Vice President Group Technical Services,where he was responsible for technical services in the mining and processing divisions
• Now plays a central role in assisting senior and line management teams to implement strategic initiatives
Qualifications:• Holds a BSc in Engineering from the University of Witwatersrand and an MBA from Wits Business School
Thandeka Ncube (48), Head of Sustainability and Development, Phembani (South African)
Appointed to Exco: 13 July 2011
Experience:• Nominated to the Exco by Shanduka (now amalgamated into Phembani)• Previously worked in various governmental institutions, developing strategy and policy for small and medium-sizedenterprises, and also at the retail banking arm of Standard Bank
• Currently works with Phembani’s investee companies to advise on transformation and broad-based empowerment
Qualifications:• Holds a social sciences degree from the City University of New York and an MBA from Henley Business School

Corporate Governance Report
/ 58 Lonmin PlcAnnual Report and Accounts 2016
Dea r Sha reholder,As a Company with a premium listing in London, Lonmin is subject to the UK Corporate Governance Code (the “Code”). The Code encourages chairmen to report personally on how its principles relating to the role andeffectiveness of the Board have been applied.
My role as Chairman is to lead the Board and ensure it is effective in discharging its function of providing leadershipand strategic direction to the business. Governance is one of the means by which we do this. The challenge everycompany faces is to ensure effective governance, but with the minimum amount of bureaucracy. I believe we havefound a good balance with our governance structures which provide systems and procedures, yet remainresponsive and sufficiently dynamic to enable the business to survive in a challenging business environment.
Since I was appointed Chairman in May 2014, I have sought to increase the level of Board focus in three key areas;strategy, both in terms of development and oversight of execution, risk management and succession planning.
Strategy
The Board has established a Strategic Review Committee, which plays a key role in both supporting managementin the successful implementation of the strategy adopted by the Board in 2015 and reviewing opportunities as andwhen they arise.
Risk Management
The effective management of business risks has become increasingly important given the challenging environmentwe have been operating in and which we expect to continue given the lower commodity price environment we face.The Board reviewed the processes, ranking and reporting associated with business risk management and alsoconsidered the principal risks and mitigation strategies in the context of the wider strategic discussion. I believe that this enhanced focus will result in tangible improvements to business performance and ensure the Company’scontinued sustainability. Our risk processes are discussed in more detail on page 82 and our principal risks areset out on pages 20 to 25.
Succession Planning
Board composition is of enormous importance and there are three critical dimensions:
Creating the right balance of skills and experience;•
Maintaining a strong level of independence and objectivity; and•
Ensuring that all Directors have sufficient knowledge of the Company and the context in which we operate.•
There were several changes to the Board composition during the year. A detailed analysis was undertaken to reviewthe skills, experience and knowledge of the Board before and after these changes occurred. I believe the Boardhas the necessary depth in these three areas and is well constituted to deal with the issues facing your Company. These processes emphasise the relevance of effective Board succession planning and this is continuing to receivean enhanced level of attention.
Effectiveness Reviews
During the year under review, an externally facilitated effectiveness review of the Board, its Committees and theindividual Directors was conducted by Advanced Boardroom Excellence, the outcome of which was positive andconfirmed that the Board and its Committees were operating effectively with all Directors contributing to a highstandard. As is always the case in such matters, there were areas of improvement identified and we have put in place plans to address these. Further feedback is provided later in this report.
The remainder of this report and the separate reports of the various Board Committees explain the governancestructures and processes the Board has implemented and what we did during the year. I hope the following pagesprovide a useful and interesting insight into how the Board has performed as stewards of your Company during the year.
Brian BeamishChairman
Brian BeamishChairman
www.lonmin.com
Corporate Governance Report
Compliance statementAs noted in the Chairman’s introduction, Lonmin is subject to the UK Corporate Governance Code, published by the FinancialReporting Council and available on their website, www.frc.org.uk. During the year to 30 September 2016 (FY2016), the Companyhas complied in all respects with the provisions of the September 2014 edition of the Code, save in relation to Jim Sutcliffe, who asat the date of this report, has served more than nine years on the Board. The Nomination Committee has assessed Mr Sutcliffe andconcluded that he remains of independent judgement and continues to make a valuable and challenging contribution to the Board.
Role and effectiveness of the BoardThe Company is led and controlled by a Board of Directors, which is collectively responsible for the long-term success of theCompany. It does so by creating and preserving value, and has focussed on doing this as its foremost principle, acting in theinterests of shareholders.
1. How the Board of Directors operates1.1 The role of the Board
The Board is the custodian of the Company’s strategic aims, vision and values. It provides entrepreneurial leadership tomanagement within a framework of prudent controls which enables risk to be assessed and managed appropriately. Itassesses whether the necessary financial and human resources are, and will continue to be, in place to enable the Companyto meet its objectives and ensure that it takes full account of safety, environmental and social factors. The graphic belowshows the iterative nature of the Board’s role:
The schedule of matters reserved to the Board, which is available on the Company’s website, sets out the Board’s ultimateresponsibility for the Group’s strategy, operations and risks, and reserves to the Board power to approve a range of decisionsof a significant nature. Importantly, the Board determines the Company’s risk appetite (which we define as the risks we activelyseek or accept in pursuit of our long-term objectives), decides the Company’s business strategy and then determines the risktolerance (which we define as the limit of risk we are prepared to face in pursuit of those long-term objectives). Naturally, thesemust be supported by sound risk management and internal control systems, the design and maintenance of which is also theresponsibility of the Board.
In the early part of each financial year the Board sets a number of short-term objectives it intends to pursue in the year,aligned with the Company’s long-term strategic goals. These objectives are used to drive the agenda-setting process for each scheduled meeting of the Board, so that we ensure that time is focussed on these key areas. The objectives also form a useful framework within which the effectiveness of the Board can be assessed.
/ 59Lonmin PlcAnnual Report and Accounts 2016
01 /Strategic R
eport02 /
Governance
03 /Financial S
tatements
04 /A Deeper Look
05 /Shareholder Inform
ation
• Report to shareholders on businessperformance, and ascertain their views
• Oversee reporting to other stakeholders
• Develop the business model andprovide entrepreneurial leadership
• Appoint the CEO
• Consider and approve strategy,business plans and budgets
• Monitor the delivery of strategy
• Challenge or support management as necessary
• Oversee governance environment,including through oversight delegatedto Board Committees
• Oversee the internal control framework
HOW THEBOARD OFDIRECTORSOPERATES
• Monitor and understand therisk environment in which theCompany operates
Corporate Governance Report
1. How the Board of Directors operates (continued)1.1 The role of the Board (continued)
The table below shows the key areas of Board activity during the year under review:
/ 60 Lonmin PlcAnnual Report and Accounts 2016
Strategy
Considered the Group’s strategy, including approval of the short and long-term price deck and annual budget•
Considered and approved the capital and funding arrangements for the Group •
Considered progress in the labour reduction programme and other cost control measures•
Considered and approved various corporate and business development initiatives •
Reviewed the progress made by the Business Support Office•
Considered strategy in relation to the Group’s environmental rehabilitation guarantees•
Operational performance
Reviewed the Group’s operational performance relative to budget and forecasts•
Considered and approved the quarterly production reports•
Reviewed the Group’s safety performance•
Site visit to the processing division•
Financial performance
Considered the financial performance of the business, including going concern and viability•
Reviewed the half year and full year results and approved the annual report•
Stakeholder engagement, community and transformation
Considered and approved various customer contracts •
Considered progress against our housing strategy•
Considered findings and actions in respect of the Farlam Report•
Considered and approved the sustainable development report•
Reviewed the Group’s ongoing relationships with various stakeholders •
Reviewed the Group’s historical and current tax arrangements•
Reviewed feedback from institutional shareholders, analysts and other engagement activities •
Site visits to various housing projects•
Governance, internal controls and risk
Considered and approved the Group’s human rights policy•
Discussed the outcome of the internally facilitated Board and Committee effectiveness review•
Considered progress against the Board’s annual objectives•
Reviewed developments in corporate governance and received legal and regulatory updates, both in the United Kingdom•and South Africa
Reviewed the Group’s risk register, including benchmarking against peers and industry•
Reviewed the effectiveness of the systems of internal control environment and risk management•
Considered the methodology to determine the Group’s risk appetite and tolerance•
Reviewed and adopted a Group Delegation of Authority•
Received regular updates from the chairmen of Audit & Risk Committee, the Remuneration Committee, Nomination•Committee, SHE and SET Committees
Leadership, management and employees
Discussed the composition of the Board and its Committees, including Board succession•
Reviewed the development of people and potential talent in the Group, including succession planning for the senior•management team

www.lonmin.com
Corporate Governance Report
1. How the Board of Directors operates (continued)1.2 Key Board roles
The division of responsibilities between the Chairman and the Chief Executive Officer is set out in writing and is summarisedbelow, together with the primary responsibilities of the Senior Independent Director and Non-executive Directors, providing a system of checks and balances in which no individual has unfettered decision making power. The Company Secretary isresponsible for ensuring accurate, timely and appropriate information flows within the Board, the Board Committees andbetween the directors and senior management.
The Chairman is in regular contact with the CEO to discuss current material matters, and the Chairman also visits theoperations outside the Board meeting schedule to meet a range of senior executives, managers and external stakeholders.
Detailed knowledge of the mining industry, the PGM business, Lonmin’s operations and of doing business in South Africa is crucial to the Board’s ability to lead the Company. On appointment each Director is provided with a tailored inductionprogramme, and they are expected to develop and refresh their knowledge and skills on an on-going basis. The Companysupports this by organising site visits and working sessions with a wide range of operational managers and external expertsthroughout the year and the Chairman agrees with each Director their training and development needs as and when required.The Non-executive Directors have regular opportunities to meet members of the Executive Committee (see section 3 below)and the broader management team, both at the working sessions and at social occasions.
At the end of every Board meeting the Chairman holds a discussion with the Non-executive Directors without the ExecutiveDirectors being present followed by a meeting of the independent Non-executive Directors. The Directors also meet, withoutthe Chairman being present, under the leadership of the Senior Independent Director at least once in each year.
1.3 Appointments to the BoardThe Company’s Articles of Association empower the Board to appoint new Directors. To ensure a formal, rigorous andtransparent procedure for appointing new Directors to the Board, a Nomination Committee comprising the independent Non-executive Directors has been created, whose work is described on pages 83 and 84.
In order for any board to discharge its duties and responsibilities effectively, it must comprise the right blend of individuals,whose skills and experience were gained in a diverse range of backgrounds. Above all, the Directors must exhibitindependence of mind, integrity and the courage to challenge constructively when appropriate. Appointments are thereforemade on personal merit and against objective criteria. In the case of candidates for non-executive directorships, care is takento ascertain that they have sufficient time to fulfil their Board and, where relevant, Committee responsibilities. As part of thisprocess, candidates disclose all other time commitments and, on appointment, undertake to inform the Board of anychanges. The Non-executive Directors’ letters of appointment are available for public inspection.
Phembani, the ultimate parent of our BEE partner Incwala Resources, has a contractual right to nominate one Director formembership of the Company’s Board, subject to the recommendation of that individual by the Nomination Committee.
/ 61Lonmin PlcAnnual Report and Accounts 2016
01 /Strategic R
eport02 /
Governance
03 /Financial S
tatements
04 /A Deeper Look
05 /Shareholder Inform
ation
Chairman – Brian Beamish (based in the United Kingdom) Chief Executive Officer – Ben Magara (based in South Africa)
Lead and manage the Board Provide leadership to the executive team in running the business
Lead the Board’s consideration of strategy Develop proposals for the Board to consider in all areasreserved for its judgement, particularly strategy
Promote the highest standards of corporate governance Ensure effective internal controls and risk managementsystems are in place
Ensure effective communication with shareholders Implement agreed strategy and all Board approved actions
Senior Independent Director – Jim Sutcliffe Non-executive Directors
Act as an intermediary for the other Directors Provide input to, review proposals for and then approve strategywhen necessary
Be available to shareholders if they have concerns whichcontact with the Chairman, Chief Executive Officer or ChiefFinancial Officer has failed to resolve, or where such contactwould be inappropriate
Scrutinise the performance of management in meeting agreedgoals and objectives and monitor the reporting of performance
Provide a sounding board for Chairman Review the integrity of financial information and determinewhether internal controls and systems of risk management are robust
Determine appropriate levels of remuneration of ExecutiveDirectors, be involved in the appointment and, wherenecessary, the removal of Executive Directors and monitorsuccession planning
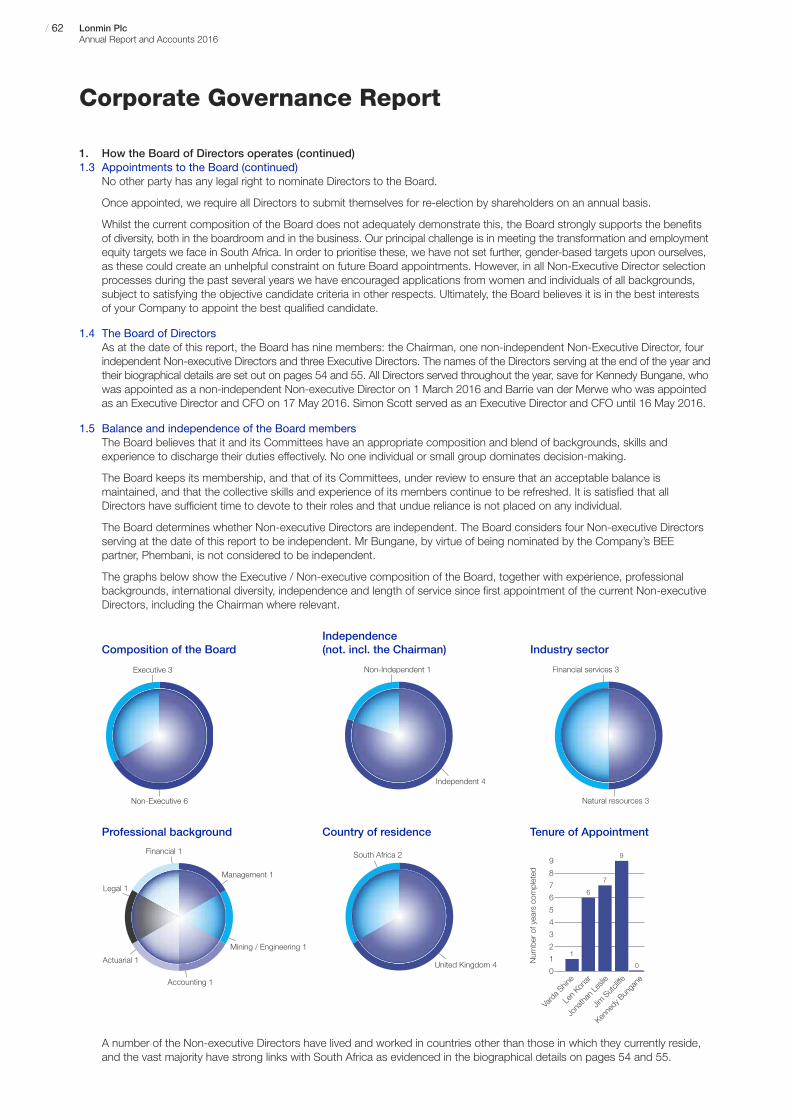
Corporate Governance Report
1. How the Board of Directors operates (continued)1.3 Appointments to the Board (continued)
No other party has any legal right to nominate Directors to the Board.
Once appointed, we require all Directors to submit themselves for re-election by shareholders on an annual basis.
Whilst the current composition of the Board does not adequately demonstrate this, the Board strongly supports the benefitsof diversity, both in the boardroom and in the business. Our principal challenge is in meeting the transformation and employmentequity targets we face in South Africa. In order to prioritise these, we have not set further, gender-based targets upon ourselves,as these could create an unhelpful constraint on future Board appointments. However, in all Non-Executive Director selectionprocesses during the past several years we have encouraged applications from women and individuals of all backgrounds,subject to satisfying the objective candidate criteria in other respects. Ultimately, the Board believes it is in the best interests of your Company to appoint the best qualified candidate.
1.4 The Board of DirectorsAs at the date of this report, the Board has nine members: the Chairman, one non-independent Non-Executive Director, fourindependent Non-executive Directors and three Executive Directors. The names of the Directors serving at the end of the year andtheir biographical details are set out on pages 54 and 55. All Directors served throughout the year, save for Kennedy Bungane, whowas appointed as a non-independent Non-executive Director on 1 March 2016 and Barrie van der Merwe who was appointedas an Executive Director and CFO on 17 May 2016. Simon Scott served as an Executive Director and CFO until 16 May 2016.
1.5 Balance and independence of the Board membersThe Board believes that it and its Committees have an appropriate composition and blend of backgrounds, skills andexperience to discharge their duties effectively. No one individual or small group dominates decision-making.
The Board keeps its membership, and that of its Committees, under review to ensure that an acceptable balance ismaintained, and that the collective skills and experience of its members continue to be refreshed. It is satisfied that allDirectors have sufficient time to devote to their roles and that undue reliance is not placed on any individual.
The Board determines whether Non-executive Directors are independent. The Board considers four Non-executive Directorsserving at the date of this report to be independent. Mr Bungane, by virtue of being nominated by the Company’s BEEpartner, Phembani, is not considered to be independent.
The graphs below show the Executive / Non-executive composition of the Board, together with experience, professionalbackgrounds, international diversity, independence and length of service since first appointment of the current Non-executiveDirectors, including the Chairman where relevant.
/ 62 Lonmin PlcAnnual Report and Accounts 2016
Composition of the BoardIndependence(not. incl. the Chairman) Industry sector
Professional background Tenure of Appointment
Non-Executive 6
Executive 3 Non-Independent 1
Independent 4
Actuarial 1
Accounting 1
Mining / Engineering 1
Legal 1
Financial 1
Management 1
Natural resources 3
Financial services 3
Country of residence
Num
ber
of y
ears
com
plet
ed
Vard
a Shin
e
Len K
onar
Jona
than L
eslie
Jim S
utcliff
e0
1
2
3
4
5
6
7
8
9
1
0
6
7
9
Kenne
dy B
unga
ne
United Kingdom 4
South Africa 2
A number of the Non-executive Directors have lived and worked in countries other than those in which they currently reside,and the vast majority have strong links with South Africa as evidenced in the biographical details on pages 54 and 55.

www.lonmin.com
Corporate Governance Report
1. How the Board of Directors operates (continued)1.6 How we assess and refresh the Board and its Committees
There are three ways in which we make sure that the Directors continue to provide suitable leadership and direction to theCompany: effectiveness reviews, succession planning and annual re-election by shareholders.
Effectiveness reviewsThe Board believes that the effectiveness review process provides a valuable opportunity for improving effectiveness andgives the Board a mechanism for constructive group and peer feedback to help directors individually to improve their ability to contribute to the work of the Board.
A comprehensive effectiveness review of the Board, its Committees and individual Directors was conducted in the year underreview. The review was facilitated by Helen Pitcher of Advanced Boardroom Excellence, who has no other connection with theCompany save for this appointment. The effectiveness review involved one to one interviews with each Director, the CompanySecretary, Assistant Company Secretary and members of the Exco. In addition, Mrs Pitcher and her colleagues observedseveral Board and Committee meetings, both in the United Kingdom and South Africa, reviewed the material provided bymanagement to the Board and its Committees during the course of the year and assessed a range of documents relating tothe operation of the Board and its Committees, such as the schedule of matters reserved to the Board, the Board’s annualworkplan and terms of reference and annual workplans for each Committee.
A report summarising the key observations and recommendations was presented to the Chairman and the CompanySecretary prior to circulation to the Board. The Chairman subsequently held one to one discussions with each of the Directorsto discuss the findings and recommendations, following which the Board agreed the priorities for FY2017. A summary of the key priorities are outlined below:
Succession planningThe Board is ultimately responsible for succession planning for directorships and key management roles.
The composition of the Board with reference to the skills, experience and knowledge of the individual Directors was reviewedregularly by both the Chairman of the Board and the Nomination Committee in order to assess the Board’s current and futureneeds. Further information is provided in the Nomination Committee Report.
The Board also reviewed the status of our succession plans for the Exco and all key management below Exco. The processesfor assessment, development, remuneration and retention of our employees were also reviewed, as these are viewed ascritical if we are to achieve our employment equity objectives.
The Board is continuing to allocate significant time to succession planning and talent development, at Board, executive andmanagement levels.
Re-election of DirectorsAll Directors will retire from the Board at the Company’s Annual General Meeting (AGM) in January 2017 and each wishes toseek re-election and election in the case of Mr Bungane and Mr van der Merwe.
The Nomination Committee has conducted a formal performance evaluation of each Non-executive Director seeking re-election / election and concluded that their performance continues to be effective and that they demonstrate commitmentto their roles. The Committee is also satisfied that the backgrounds, skills, experience and knowledge of the Company of thecontinuing Directors collectively enables the Board and its Committees to discharge their respective duties and responsibilitieseffectively. The conclusion is supported by the externally facilitated effectiveness review.
We believe that sufficient biographical and other information on those Directors seeking re-election / election is provided inthis Annual Report and Accounts and the AGM Circular to enable shareholders to make an informed decision.
/ 63Lonmin PlcAnnual Report and Accounts 2016
01 /Strategic R
eport02 /
Governance
03 /Financial S
tatements
04 /A Deeper Look
05 /Shareholder Inform
ation
Area Action
Performanceoversight
Actively monitor and review the delivery of the budget and business plan, with particular focus on mining•production, efficiencies, costs and cash flows.
Strategic Continue to exploit strategic opportunities as they arise•
Stakeholder Continue to ensure that regular face-to-face Board meetings are held in South Africa with formal and•informal meetings with local management
Continue engagement with wider group of stakeholders•
Management Through the Nomination Committee, continue to focus on Non-executive and Executive Director•succession plans
Through the Nomination Committee, continue to monitor the strengthening of the executive and•management pipeline
Board The Board should continue to use the skills matrix profile to shape its own immediate and future composition.•

Corporate Governance Report
1. How the Board of Directors operates (continued)1.7 Board meetings
There were 20 Board meetings during the year, of which 6 were scheduled meetings. The other 14 Board meetings andnumerous other Board Committee meetings were called in relation to specific matters or to issue approvals, often at shortnotice. Whilst these additional Board meetings did not necessarily require full attendance, the Directors were in attendanceat the vast majority of these meetings.
As in prior years, the Board visited the operations in South Africa twice during the year. Although we no longer hold LonminBoard meetings in South Africa, this provides a useful opportunity to investigate operational and especially transformationissues in depth and to meet members of the Exco and other managers. In addition to their meeting commitments, theNon-executive Directors also make themselves available to management whenever required and there is regular contactoutside the Board meeting schedule.
Attendance at Board meetings during each Director’s period of service in FY2016 is set out in the above table.
When a Director is unable to participate in a meeting either in person or remotely, the Chairman will solicit their views on keyitems of business ahead of time, in order that these can be presented at the meeting and influence the debate.
1.8 Board Committees, and how they support the BoardTo fulfil its role in the time available, the Board must delegate some of its duties and powers to Committees. As well as theCommittees recommended in the Code, the Board has established two other Committees to oversee business-specificissues, the Safety, Health & Environment Committee and the Social, Ethics & Transformation Committee. Each Committeeand its members are provided with accurate, timely and clear information and sufficient resources to enable them toundertake their duties. Membership of the Committees during the year to 30 September 2016 is shown below, together with individual attendance at the Committee meetings held during each Director’s period of service in FY2016.
1 Appointed a member of the Committee on 1 March 2016.
/ 64 Lonmin PlcAnnual Report and Accounts 2016
Director Scheduled meetings
Brian Beamish 6 of 6
Kennedy Bungane (appointed 1 March 2016) 4 of 4
Len Konar 6 of 6
Jonathan Leslie 6 of 6
Ben Magara 6 of 6
Ben Moolman 6 of 6
Varda Shine 6 of 6
Jim Sutcliffe 6 of 6
Barrie van der Merwe (appointed 17 May 2016) 3 of 4
Audit & Risk Nomination Remuneration
Safety, Health &Environmental
(SHE)
Social, Ethics &Transformation
(SET)
Non-Executive Directors
Brian Beamish Member 5 of 6 Member 6 of 6 Member 4 of 4
Kennedy Bungane Member 2 of 31 Member 2 of 31
Len Konar Chairman 8 of 8 Member 4 of 6 Chairman 4 of 4
Jonathan Leslie Member 4 of 6 Member 6 of 6 Chairman 4 of 4
Varda Shine Member 8 of 8 Member 5 of 6 Member 6 of 6
Jim Sutcliffe Member 7 of 8 Chairman 5 of 6 Chairman 6 of 6 Member 2 of 4
Executive Directors
Ben Magara Member 4 of 4 Member 4 of 4
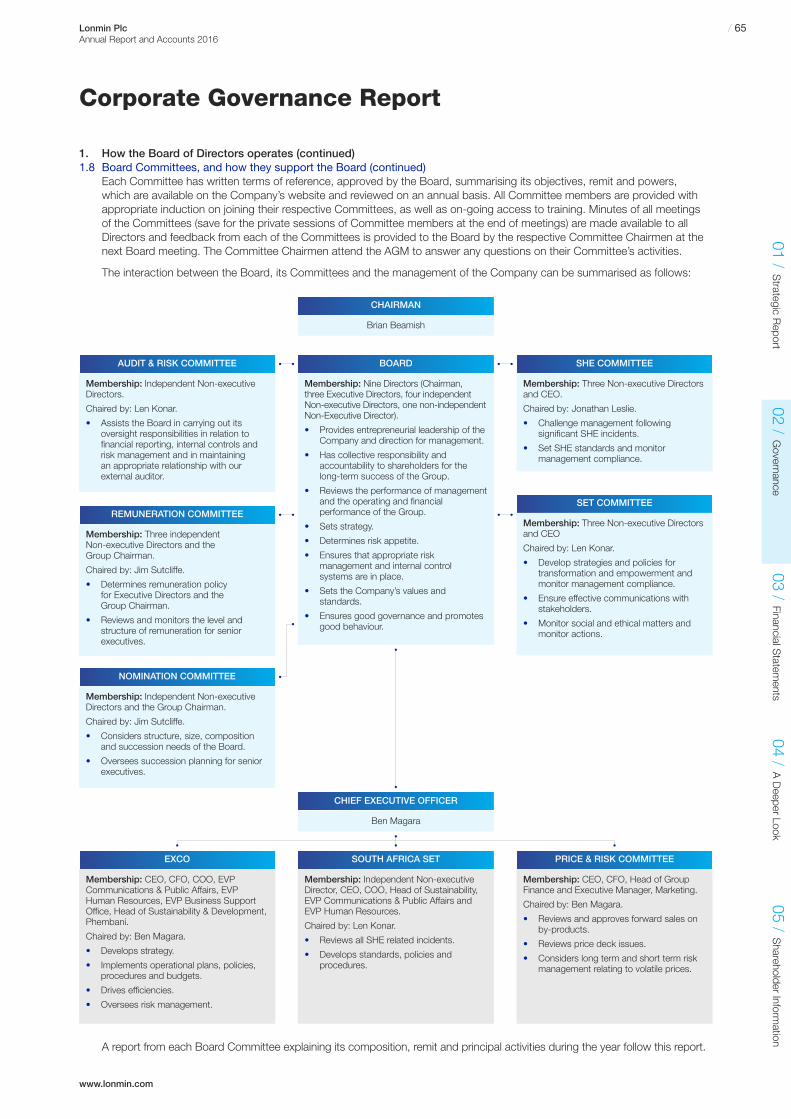
www.lonmin.com
Corporate Governance Report
1. How the Board of Directors operates (continued)1.8 Board Committees, and how they support the Board (continued)
Each Committee has written terms of reference, approved by the Board, summarising its objectives, remit and powers,which are available on the Company’s website and reviewed on an annual basis. All Committee members are provided withappropriate induction on joining their respective Committees, as well as on-going access to training. Minutes of all meetingsof the Committees (save for the private sessions of Committee members at the end of meetings) are made available to allDirectors and feedback from each of the Committees is provided to the Board by the respective Committee Chairmen at thenext Board meeting. The Committee Chairmen attend the AGM to answer any questions on their Committee’s activities.
The interaction between the Board, its Committees and the management of the Company can be summarised as follows:
A report from each Board Committee explaining its composition, remit and principal activities during the year follow this report.
/ 65Lonmin PlcAnnual Report and Accounts 2016
01 /Strategic R
eport02 /
Governance
03 /Financial S
tatements
04 /A Deeper Look
05 /Shareholder Inform
ation
Membership: Three Non-executive Directors and CEO
Chaired by: Len Konar.
• Develop strategies and policies fortransformation and empowerment andmonitor management compliance.
• Ensure effective communications withstakeholders.
• Monitor social and ethical matters andmonitor actions.
SET COMMITTEE
Membership: Independent Non-executive Directors and the Group Chairman.
Chaired by: Jim Sutcliffe.
• Considers structure, size, compositionand succession needs of the Board.
• Oversees succession planning for seniorexecutives.
NOMINATION COMMITTEE
Brian Beamish
CHAIRMAN
Ben Magara
CHIEF EXECUTIVE OFFICER
Membership: Independent Non-executiveDirector, CEO, COO, Head of Sustainability,EVP Communications & Public Affairs andEVP Human Resources.
Chaired by: Len Konar.
• Reviews all SHE related incidents.
• Develops standards, policies andprocedures.
SOUTH AFRICA SET
Membership: Nine Directors (Chairman,three Executive Directors, four independentNon-executive Directors, one non-independentNon-Executive Director).
• Provides entrepreneurial leadership of theCompany and direction for management.
• Has collective responsibility andaccountability to shareholders for thelong-term success of the Group.
• Reviews the performance of managementand the operating and financialperformance of the Group.
• Sets strategy.
• Determines risk appetite.
• Ensures that appropriate riskmanagement and internal controlsystems are in place.
• Sets the Company’s values andstandards.
• Ensures good governance and promotesgood behaviour.
BOARD
Membership: Three independent Non-executive Directors and the Group Chairman.
Chaired by: Jim Sutcliffe.
• Determines remuneration policy for Executive Directors and the Group Chairman.
• Reviews and monitors the level andstructure of remuneration for seniorexecutives.
REMUNERATION COMMITTEE
Membership: Three Non-executive Directors and CEO.
Chaired by: Jonathan Leslie.
• Challenge management followingsignificant SHE incidents.
• Set SHE standards and monitormanagement compliance.
SHE COMMITTEE
Membership: CEO, CFO, Head of GroupFinance and Executive Manager, Marketing.
Chaired by: Ben Magara.
• Reviews and approves forward sales onby-products.
• Reviews price deck issues.
• Considers long term and short term riskmanagement relating to volatile prices.
PRICE & RISK COMMITTEE
Membership: CEO, CFO, COO, EVPCommunications & Public Affairs, EVPHuman Resources, EVP Business SupportOffice, Head of Sustainability & Development,Phembani.
Chaired by: Ben Magara.
• Develops strategy.
• Implements operational plans, policies,procedures and budgets.
• Drives efficiencies.
• Oversees risk management.
EXCO
Membership: Independent Non-executive Directors.
Chaired by: Len Konar.
• Assists the Board in carrying out itsoversight responsibilities in relation tofinancial reporting, internal controls andrisk management and in maintainingan appropriate relationship with ourexternal auditor.
AUDIT & RISK COMMITTEE
Corporate Governance Report
1. How the Board of Directors operates (continued)1.9 How the Board manages conflicts of interest
Directors have a statutory duty to avoid actual or potential conflicts of interest. Where these have occurred, or may occur, the Board can ‘authorise’ conflicts, on such terms as it may decide, under a documented procedure. This requires that whena Director becomes aware that he or she is in a situation which does or could create a conflict of interest, or has an interest in an existing or proposed transaction in which the Company also has an interest then they are required to notify the Board in writing of the situational or transactional conflict as soon as possible and, in any event, prior to any conflicted transactionbeing concluded. Directors have a continuing duty to update the Board on any changes to their other appointments which, by way of further check, are reviewed by the Board on an annual basis. The interests of new Directors are reviewed during the recruitment process and authorised (if appropriate) by the Board at the time of their appointment.
Kennedy Bungane is a director and CEO of Phembani. A subsidiary of Phembani, Incwala Resources, owns a 26% equitystake in the Lonmin Group company which controls the Akanani project and, indirectly, 18% equity stakes in Lonmin’s twoprincipal operating companies, EPL and WPL. Mr Bungane declared his interests to the Board, which were authorised inaccordance with the Board’s procedure.
No Director had a material interest in any contract of significance in relation to the Company’s business at any time during theyear or to the date of this report.
1.10 How we support the BoardThe Board and its Committees are supplied with regular, comprehensive and timely information in a form and of a quality thatenables them to discharge their duties effectively. All Directors are able to make further enquiries of the Executive Directors ormanagement whenever necessary, and have access to the services of the Company Secretary. There is a procedure in placefor Directors to take independent professional advice, if they judge this to be necessary, at the Company’s expense.
1.11 Directors’ remunerationA report on Directors’ remuneration is set out on pages 85 to 113. Interests in the Company’s shares held by the Directorsin office during the year, and to the date of this report, are shown in that report. No Director held any beneficial interest in theshare capital of any other Group company at any time during the year and to the date of this report.
1.12 Protection available to DirectorsIn law, Directors are ultimately responsible for most aspects of the Company’s business dealings. As a consequence, theyface potentially significant personal liability under criminal or civil law, or the UK Listing, Prospectus, Disclosure & TransparencyRules, and face a range of penalties including private or public censure, fines and / or imprisonment. In line with normal marketpractice, the Company believes that it is in the Company’s best interests to protect the individuals prepared to serve on itsBoard from the consequences of innocent error or omission. The Company maintains, at its expense, a Directors’ & Officers’liability insurance policy to afford an indemnity in certain circumstances for the benefit of Group personnel including, asrecommended by the Code, the Directors. This insurance policy does not provide cover where the Director or Officer hasacted fraudulently or dishonestly.
In addition, Deeds of Indemnity have been issued by the Company which, in general terms, protect all past, present andfuture Directors and officers of the Company to the extent permissible by law from all costs and expenses incurred in thedefence of any civil or criminal proceedings in which judgement is given in their favour or the proceedings are otherwisedisposed of without a finding of fault or where there is a successful application to court for relief from liability. Under the termsof these indemnities, the Company may advance money to fund a Director’s defence costs which, should the Director not be exonerated, would be repayable to the Company. Each indemnity operates only to the extent that the applicable Director is not able to recover the relevant amounts under the Directors’ and Officers’ liability insurance policy. All these indemnitieswere in force throughout the financial year and to the date of this report, and are available for inspection at the Company’sRegistered Office.
/ 66 Lonmin PlcAnnual Report and Accounts 2016
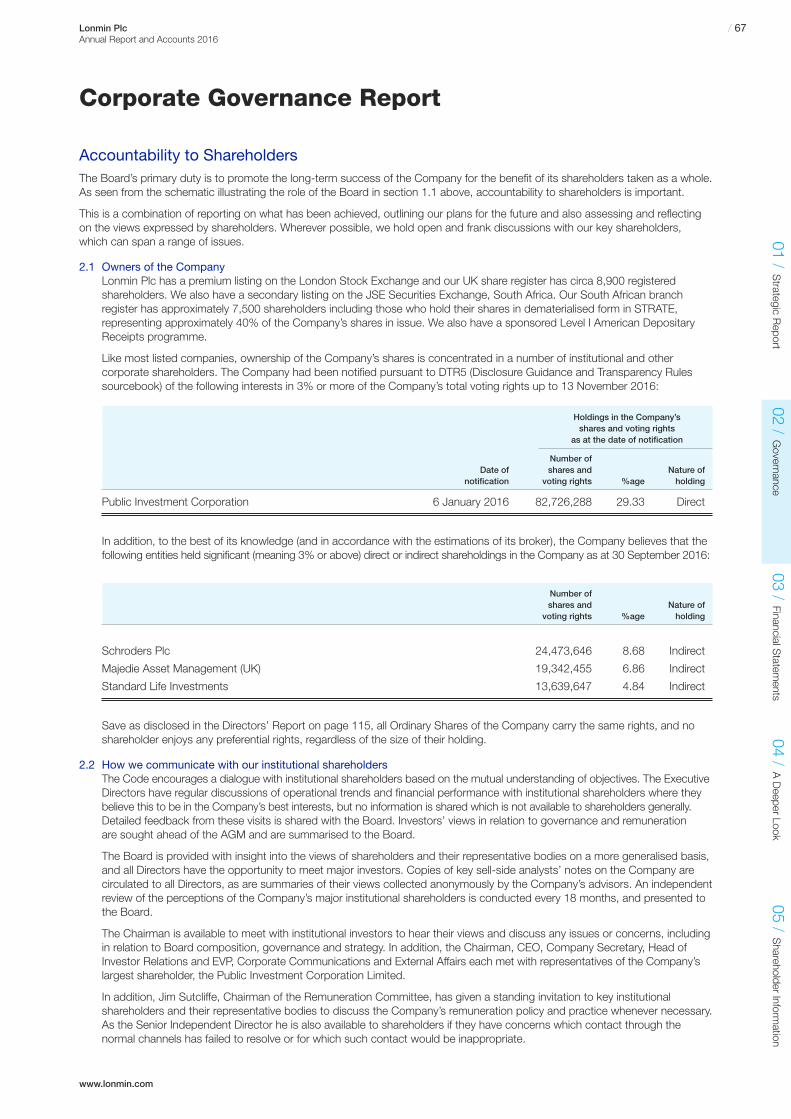
www.lonmin.com
Corporate Governance Report
Accountability to ShareholdersThe Board’s primary duty is to promote the long-term success of the Company for the benefit of its shareholders taken as a whole.As seen from the schematic illustrating the role of the Board in section 1.1 above, accountability to shareholders is important.
This is a combination of reporting on what has been achieved, outlining our plans for the future and also assessing and reflectingon the views expressed by shareholders. Wherever possible, we hold open and frank discussions with our key shareholders,which can span a range of issues.
2.1 Owners of the CompanyLonmin Plc has a premium listing on the London Stock Exchange and our UK share register has circa 8,900 registeredshareholders. We also have a secondary listing on the JSE Securities Exchange, South Africa. Our South African branchregister has approximately 7,500 shareholders including those who hold their shares in dematerialised form in STRATE,representing approximately 40% of the Company’s shares in issue. We also have a sponsored Level I American DepositaryReceipts programme.
Like most listed companies, ownership of the Company’s shares is concentrated in a number of institutional and othercorporate shareholders. The Company had been notified pursuant to DTR5 (Disclosure Guidance and Transparency Rulessourcebook) of the following interests in 3% or more of the Company’s total voting rights up to 13 November 2016:
Holdings in the Company’sshares and voting rights
as at the date of notification
Number ofDate of shares and Nature of
notification voting rights %age holding
Public Investment Corporation 6 January 2016 82,726,288 29.33 Direct
In addition, to the best of its knowledge (and in accordance with the estimations of its broker), the Company believes that thefollowing entities held significant (meaning 3% or above) direct or indirect shareholdings in the Company as at 30 September 2016:
Number ofshares and Nature ofvoting rights %age holding
Schroders Plc 24,473,646 8.68 Indirect
Majedie Asset Management (UK) 19,342,455 6.86 Indirect
Standard Life Investments 13,639,647 4.84 Indirect
Save as disclosed in the Directors’ Report on page 115, all Ordinary Shares of the Company carry the same rights, and noshareholder enjoys any preferential rights, regardless of the size of their holding.
2.2 How we communicate with our institutional shareholdersThe Code encourages a dialogue with institutional shareholders based on the mutual understanding of objectives. The ExecutiveDirectors have regular discussions of operational trends and financial performance with institutional shareholders where theybelieve this to be in the Company’s best interests, but no information is shared which is not available to shareholders generally.Detailed feedback from these visits is shared with the Board. Investors’ views in relation to governance and remuneration are sought ahead of the AGM and are summarised to the Board.
The Board is provided with insight into the views of shareholders and their representative bodies on a more generalised basis,and all Directors have the opportunity to meet major investors. Copies of key sell-side analysts’ notes on the Company arecirculated to all Directors, as are summaries of their views collected anonymously by the Company’s advisors. An independentreview of the perceptions of the Company’s major institutional shareholders is conducted every 18 months, and presented tothe Board.
The Chairman is available to meet with institutional investors to hear their views and discuss any issues or concerns, includingin relation to Board composition, governance and strategy. In addition, the Chairman, CEO, Company Secretary, Head ofInvestor Relations and EVP, Corporate Communications and External Affairs each met with representatives of the Company’slargest shareholder, the Public Investment Corporation Limited.
In addition, Jim Sutcliffe, Chairman of the Remuneration Committee, has given a standing invitation to key institutionalshareholders and their representative bodies to discuss the Company’s remuneration policy and practice whenever necessary.As the Senior Independent Director he is also available to shareholders if they have concerns which contact through thenormal channels has failed to resolve or for which such contact would be inappropriate.
/ 67Lonmin PlcAnnual Report and Accounts 2016
01 /Strategic R
eport02 /
Governance
03 /Financial S
tatements
04 /A Deeper Look
05 /Shareholder Inform
ation

Corporate Governance Report
2.3 How we communicate with our private shareholdersThe Code urges boards to use the AGM to communicate with private investors and to encourage their participation, and theBoard has followed these principles for many years. A presentation is given to shareholders by the CEO, and all Directors areavailable to answer questions both formally at the meeting and informally afterwards.
Shareholders vote on separate resolutions on substantially different issues, and we use electronic poll voting, with the resultsbeing announced to the markets and displayed on our website at the conclusion of the AGM. Voting on a poll recognises thegeographical spread of our investor base and enables the votes of all shareholders to be taken into account whether they areable to attend the meeting or not. The use of electronic voting tools at the AGM provides a means of voting democratically.
2.4 Formal reporting to shareholdersWe report formally in a number of ways:
Regulatory news announcements or press releases are issued in response to events or routine reporting obligations.•
Production reports are published quarterly, generally within one month of the calendar quarter end.•
We publish an unaudited interim statement in May of each year, outlining performance to 31 March. This is announced to•the markets and presented in London later in the day, with a webcast available to all. The presentation slides, a transcriptand the interim statement are all made available on the Company’s website.
We publish our audited financial statements in November of each year, for the year ended 30 September, including a•detailed management commentary. We follow the same publication process as the interims, with the same materials madeavailable on our website.
In December we publish the formal Annual Report and Accounts, which comprises the audited financial statements and •the narrative reporting with many other items of statutory, regulatory or voluntary reporting across a range of issues.
In line with best practice, our default means of communication with shareholders is online. This saves the expense, paper andother resources that would be entailed in printing and distributing large numbers of documents without knowing whether theyare wanted. Shareholders can opt to receive paper documents at any time, should they so wish. A wealth of information isprovided on the Company’s website, www.lonmin.com.
The Code requires that the Board provides a fair, balanced and understandable assessment of the Company’s position andprospects in its external reporting. The Board considers that this Annual Report and Accounts, taken as a whole, meets that test and provides the information necessary for shareholders to assess the Directors’ stewardship of the Company.
2.5 Formal reporting more widelyWhile UK law has a presumption of shareholder primacy, we also have a range of other key stakeholders whom we support witha flow of information and with whom we engage whenever appropriate. This covers a very broad range of constituencies, andincludes lawmakers and regulators (including the UK and South African governments), our employees and their representativetrade unions, the communities who host our operations and a range of NGOs and external commentators including newswiresand other media.
While describing the vast number of interactions that take place is beyond the scope of this report, and numerous bespokereports are issued privately to a number of these counterparties, there is one key document aimed at these important audiences.We publish annually a Sustainable Development Report which is made available through the Company’s website,www.lonmin.com. This can be downloaded in pdf form, using an editing tool to extract the required pages.
These audiences will also utilise the additional materials on our website.
2.6 The General Meeting On 21 October 2015, the Company announced changes to its business plan and funding strategy that the Directors believedwould strengthen the Company’s financial position and significantly reduce its net indebtedness. These measures included theentry by the Company into amended facilities with the Group’s existing lenders, which amongst other things significantly reducedthe Group’s risk in relation to its financial covenants, and a proposal to undertake a fully underwritten Rights Issue. It alsoannounced the adoption of a new business plan to stabilise production at its mining operations and target capital expenditure to grow production over the medium term.
Resolutions were passed in General Meeting on 19 November 2015 to:
Sub-divide the Company’s existing Ordinary Shares of $1 nominal value each to Ordinary Shares of $0.000001 nominal•value each and 2015 Deferred Shares of $0.999999 nominal value each followed by a consolidation in the ratio of 100:1;
Place with the Bapo Ba Mogale Ordinary Shares of $0.000001 each up to an aggregate nominal value of $9,150,129; and•
Allot Ordinary Shares up to a nominal value of $400,000,000.•
/ 68 Lonmin PlcAnnual Report and Accounts 2016
www.lonmin.com
Corporate Governance Report
2.7 The AGMThe 2017 AGM will be held at 10.30 a.m. on Thursday 26 January 2017 at Haberdashers’ Hall. A separate circular containingthe Notice of Meeting, together with an explanation of the items of special business has been sent to all shareholders and isavailable on the Company’s website.
Among the resolutions proposed are those seeking renewal of shareholders’ authority for the Directors to allot equitysecurities and an authority for the Company to make market purchases of its own shares. Further information on theremuneration matters is provided in the Directors’ Remuneration Report on pages 85 to 113. Full details of all of the matters to be considered at the meeting are set out in the AGM Circular.
2.8 DividendAs noted in the Chairman’s Letter at the beginning of the Annual Report and Accounts, the Board is not recommending a finaldividend for the year ended 30 September 2016. Under our dividend policy, the Board no longer declares interim dividends,and so no dividends will have been recommended or declared for the year under review.
Board and Management Committees
3. Safety, Health & Environment (SHE) Committee ReportLonmin is committed to managing its activities throughout the Group so as to minimise harm to the environment and tosafeguard the health and safety of its employees, customers and the community. This Committee was created voluntarily bythe Board to help it oversee the significant risks that the Company faces in the critical areas of safety, health and environmentand ensure they receive due evaluation at all times. The matters it considers are a mixture of legal obligations (most oftenarising from South African legislation or regulation) and other actions we believe are necessary to be a good corporate citizenand retain our informal social ‘licence to operate’.
3.1 Role of the SHE CommitteeThe SHE Committee has delegated authority from the Board set out in its written terms of reference, available on theCompany’s website, which were last reviewed by the Board in September 2016.
The key responsibilities of the Committee are:
to have oversight of and provide advice to the Board on SHE matters (including, where relevant, public safety and•the impact of the Group’s activities) and evaluating the risks in each of these areas;
to assist the Board by ensuring management sets aspirational standards for SHE matters and implements a culture •in which these goals are promoted and enforced;
to have oversight of and provide advice to the Board on the Group’s compliance with applicable SHE related legal •and regulatory requirements;
to consider the major findings of internal and external investigations and management’s response;•
to report to the Board developments, trends and / or forthcoming significant legislation in relation to SHE matters•which may be relevant to the Group’s operations, its assets or employees;
to ensure a robust and independent assurance and / or audit process is implemented by management; and•
to review the Group’s external SHE reporting and regulatory disclosures.•
More detailed information concerning the Group’s performance in SHE areas is set out in the Strategic Report, frompage 44 onwards and will also be available in the Sustainable Development Report, which will be published onCompany’s website in January 2017.
/ 69Lonmin PlcAnnual Report and Accounts 2016
01 /Strategic R
eport02 /
Governance
03 /Financial S
tatements
04 /A Deeper Look
05 /Shareholder Inform
ation

3. Safety, Health & Environment (SHE) Committee Report (continued)3.2 Composition of the SHE Committee
The members of the Committee as at the date of this report are Jonathan Leslie (Chairman), Brian Beamish, KennedyBungane and Ben Magara, giving the Committee a broad and balanced blend of skills, experience and detailed knowledgeof the Company and its operations. At the request of the Committee Chairman, the Chief Operating Officer (who isaccountable for operational SHE matters), the Executive Manager responsible for Sustainability and the Assistant CompanySecretary (who acts as Secretary to the Committee) attend all meetings of the Committee. Other managers attend asnecessary when their specialist expertise is required, or incidents have occurred in operations under their control.
3.3 Activities of the SHE Committee during the yearThe Committee met four times during the year, and attendance at those meetings is shown in section 1.8 of theCorporate Governance Report.
The Committee has an annual work plan, developed from its terms of reference, with standing items that the Committeeconsiders at each meeting in addition to matters of topical relevance or on which the Committee has otherwise chosento focus.
The work of the Committee in FY2015 is summarised below.
/ 70 Lonmin PlcAnnual Report and Accounts 2016
Corporate Governance Report
Safety
Received reports from accountable managers on four fatalities during FY2016 and all serious safety incidents, •including a detailed analysis of factors contributing to the safety incident and the corrective and preventativemeasures taken to prevent recurrence
Reviewed reports on key safety indicators and trends•
Reviewed company security and firearm procedures•
Reviewed progress and implementation of a strategic plan to improve safety and long-term safety initiatives•
Received reports on Du Pont Initiative Safety Leadership and Behavior Survey•
Reviewed material regulatory compliance•
Health
Reviewed reports on health and community indicators and trends•
Participated in a Health Deep Dive, including a report on the health impact following a five month strike•
Environment
Received reports from accountable managers on all serious environmental incidents, including a detailed analysis •of factors contributing to the incident and the corrective and preventative measures taken to prevent recurrence
Reviewed reports on key environmental indicators and trends•
Reviewed progress reports on various environmental initiatives with focus on water security and energy management•
Participated in an Environment deep dive with focus on emission regulations and rehabilitation legislation•
Reviewed reports on complaints by regulator and third parties•
Governance, regulatory and reporting
Reviewed changes to local and international safety, health and environmental regulations•
Reviewed the Committee’s report within the 2015 Annual Report and recommended approval to the Board•
Considered feedback from external auditors following their assurance review of selected data in the FY2015 annual•report and FY2015 Sustainable Development Report
Considered and approved the appointment of KPMG as the assurance provider for the FY2015 Sustainable•Development Report
Reviewed the Committee’s Annual Workplan, Terms of Reference and Committee objectives for FY2016•
www.lonmin.com
4. Social, Ethics & Transformation (SET) Committee ReportThis Committee was created by the Board in January 2011 to assist it oversee the significant risks that the Company faces in the crucial area of transformation. Transformation refers to the over-arching aims of the entire process of Black EconomicEmpowerment within South Africa, and changing how business is done. In our case, we have committed to certain outcomesthrough the Social and Labour Plans and comply with the Mining Charter. In addition, whilst the South African Companies Actrequires that certain locally-incorporated entities, including Lonmin’s principal operating subsidiaries, establish a social andethics committee, the remit of which is mandated in law, the Board considers that successful management of these issues isof utmost importance to the conduct of the Group’s business, contribute to being a good corporate citizen and, ultimately,should help us to retain our informal social ‘licence to operate’. The Board, therefore, decided to extend the remit of theprevious Transformation Committee to also include all social and ethics matters across the Group.
4.1 Role of the SET CommitteeThe SET Committee has delegated authority from the Board set out in its written terms of reference, available on theCompany’s website, which were last reviewed by the Board in September 2016.
The key responsibilities of the Committee are:
to oversee the Company’s strategy and actions in meeting its commitments and obligations in the areas of•transformation and empowerment, and in those social and ethics matters prescribed in South African law, and thatthe interests of all stakeholders (including shareholders) are properly recognised when doing so, with its principalduties being:
to develop strategies, policies and processes and set goals and targets for transformation and empowerment, •and assess the means by which such strategies are proposed to be implemented and goals achieved, with the goal of ensuring that there is a disciplined, co-ordinated and sustainable approach to transformation;
to monitor, review and evaluate progress made by management in meeting the Company’s obligations in respect of•transformation and empowerment, including the Company’s adherence to applicable legal and regulatoryrequirements and external commitments made in relation to the same;
to oversee the Group’s activities in relation to the prescribed social and ethics matters, and in developing an•appropriate corporate culture including ethical matters (including anti-bribery and corruption actions) and the humanrights of those involved in or affected by the Group’s business;
to ensure effective communication on SET issues between management, the Board and various stakeholders; and•
to guide and otherwise provide encouragement and counsel to management in relation to SET matters.•
4.2 Composition of the SET CommitteeThe members of the Committee as at the date of this report are Len Konar (Chairman), Jim Sutcliffe, Kennedy Bungane and Ben Magara. At the request of the Committee Chairman, the Chief Operating Officer, the EVP of Communicationsand Public Affairs, the EVP of Human Resources and the Assistant Company Secretary (who acts as secretary to theCommittee), also attend the meetings, none of whom do so as of right. Other Board members and senior managersattend as needed, the latter when specialist input is required.
/ 71Lonmin PlcAnnual Report and Accounts 2016
01 /Strategic R
eport02 /
Governance
03 /Financial S
tatements
04 /A Deeper Look
05 /Shareholder Inform
ation
Corporate Governance Report
4. Social, Ethics & Transformation (SET) Committee Report (continued)4.3 Activities of the SET Committee during the year
The Committee has an annual work plan, developed from its terms of reference with standing items that the Committeeconsiders at each meeting in addition to matters of topical relevance or on which the Committee has otherwise chosento focus.
The Committee met formally four times during the year, and also led a “deep dive” into transformation strategy andperformance which was attended by a wide range of operational managers. All other Board Directors were given astanding invitation to attend any of these meetings, and many did so. As well as routine monitoring activities, the materialitems considered by the Committee in FY2016 were:
/ 72 Lonmin PlcAnnual Report and Accounts 2016
Corporate Governance Report
Social
Reviewed reports on commitments made in the Social and Labour Plans and requirements of Mining Charter and •provided feedback to management
Reviewed strategic plans for transformation programme and remedial actions •
Reviewed progress against our accommodation strategy, including in-depth reviews of the housing and living •conditions of our employees, and our community infrastructure investment projects. Committee members also went on a number of site visits to assess progress in the construction of our infill apartments
Received an update on progress made against procurement commitments made to the Bapo Ba Mogale•
Ethics
Received an update on the compliance review of the human rights policy•
Transformation
Reviewed the funding and terms of the 1608 Education Trust including appointment of Trustees and Administrator•
Reviewed reports on Social and Labour Plans and Mining Charter and provided feedback to management•
Governance, regulatory and reporting
Reviewed changes to Mining Charter Scorecard•
Reviewed changes to local and international regulations and new legislation, including Mining Charter III and•Amendments to the Mineral and Petroleum Resources Development Act
Monitored status of the One Empowered Always Empowered litigation brought by the Chamber of Mines •
Reviewed the Committee’s report within the 2015 Annual Report and recommended approval to the Board•
Considered feedback from external auditors following their assurance review of selected data in the FY2015 annual•report and FY2015 Sustainable Development Report
Considered and approved the appointment of KPMG as the assurance provider for the FY2016 Sustainable•Development Report
Reviewed the Committee’s Annual Workplan, Terms of Reference and Committee objectives for FY2016•
Reviewed the Amnesty International report on housing conditions at Marikana•
www.lonmin.com
As with any business, power is delegated from the Board to the CEO, and through him to the management team via adocumented Delegation of Authority, setting out the responsibilities, decision-making and approval powers of managers atdifferent levels of the enterprise. To support the CEO in managing the business, two management Committees have been createdas explained below.
5. Executive CommitteeThe names and biographical details of the Exco members are set out on pages 56 and 57, and are the three ExecutiveDirectors, Ben Magara, Barrie van der Merwe and Ben Moolman, a number of senior executives and Thandeka Ncube, a non-executive Exco member nominated by Phembani, the Company’s principal BEE investor. The CEO chairs the Exco,which meets monthly and has a weekly updating call. It has formal terms of reference, which were last reviewed in 2015 andwhich dovetail into the schedule of matters reserved for the Board’s decision. Its responsibilities include the following key areas:
to develop strategy for submission to the Board;•
to develop, implement and monitor operational plans, policies, procedures and budgets;•
to review financial performance, forecasts and targets;•
to prioritise initiatives and allocate resources;•
to identify and drive efficiencies across the Group;•
to approve capital expenditure proposals within the authority levels delegated by the Board and otherwise recommend •to Board;
to develop and monitor the Group’s policies and practices in respect of health, safety and environmental matters taking•into account legal requirements, regulations and best practice;
to review findings for all serious incidents using Incident Cause Analysis Methodology;•
to oversee risk management including identifying risks and developing and implementing risk mitigation plans;•
to develop and monitor the internal control environment; and•
to develop and implement Group-wide evaluation, training, reward and remuneration practices and manage wage•negotiations / benefits with unions.
6. Price & Risk CommitteeThe Price & Risk Committee is chaired by the CEO and the other members are the CFO, the Head of Group Finance and the Executive Manager, Marketing. The primary purpose of this Committee is to review and agree proposals in relation to the forward sale of by-products, principally nickel and copper, but also including gold. The Committee meets as and whenrequired. The Committee’s terms of reference were last reviewed in March 2012.
/ 73Lonmin PlcAnnual Report and Accounts 2016
01 /Strategic R
eport02 /
Governance
03 /Financial S
tatements
04 /A Deeper Look
05 /Shareholder Inform
ation
Corporate Governance Report
Audit & Risk Committee Reportfor the year ended 30 September 2016
/ 74 Lonmin PlcAnnual Report and Accounts 2016
Dea r Sha reholder,The Audit & Risk Committee, comprising only Non-executive Directors, all of whom are considered to beindependent, holds a position between management and the Company’s shareholders. The Committee’s dutiesmirror the recommendations of the UK Corporate Governance Code, while also serving a much greater purpose;that of reassuring shareholders that their interests are properly protected in respect of the Company’s financialmanagement and reporting.
Throughout the year, the Committee continued to focus on the integrity of the Company’s financial reporting andspent some considerable time considering various areas of financial judgement, including:
Impairment of non-financial and financial assets;•
Recoverability of the HDSA receivable; and•
Going concern and the Viability Statement.•
Each of the above matters are discussed in more detail later in the report.
Risk management continues to take on increasing importance for both the Board and the Committee. The Board is responsible for identifying, assessing and managing risk whilst the Committee is tasked with overseeing theCompany’s risk management practices and procedures, including the methodology used to quantify the risks. I believe this division in labour works well for us. A key area of development for management, the Committee and the Board will be the further refinement of our approach to determine our risk appetite and tolerance. This will assistthe Board to ensure that the business’ risk exposure remains appropriate at any time in the business cycle.
This year we have had a number of significant changes, both within the Company and externally. Simon Scottstepped down earlier this year as a Director and CFO and I would like to take this opportunity to thank Simon for his considerable and valuable input over the past several years. In his place, I would like to welcome Barrie van derMerwe, who joined the Board as a Director and CFO in May 2016. We also saw a change in our lead audit partneras a result of KPMG’s partner rotation policy. Adrian Wilcox was appointed lead audit partner in January 2016. I am pleased to report that despite these rather material changes, in addition to others at management level, thehandover and transition occurred seamlessly.
Looking ahead to FY2017, in addition to business as usual, the Committee will focus on ensuring we have robustsystems and procedures for recognising assets and liabilities that are recognised in our books accurately and fairlyand the Committee will scrutinise the risk assessment process and ensure there is adequate alignment between all assurance activities.
Yours faithfully
Len KonarChairman, Audit & Risk Committee
Len KonarChairman, Audit & Risk Committee

www.lonmin.com
Audit & Risk Committee Reportfor the year ended 30 September 2016
As noted in section 1.8 of the Corporate Governance Report, the Board delegates certain of its duties, responsibilities and powersto the Audit & Risk Committee, so that these can receive suitably focussed attention. However, it acts on behalf of the full Board,and the matters reviewed and managed by the Committee remain the responsibility of the Directors taken as a whole.
1. Role of the Audit & Risk CommitteeThe Audit & Risk Committee has delegated authority from the Board set out in its written terms of reference, available on the Company’s website. The primary purposes of the Audit & Risk Committee are:
to monitor the integrity of the Company’s financial statements and regulatory announcements relating to its financial•performance and review significant financial reporting judgements;
to keep under review the effectiveness of the Company’s internal controls, including financial controls and risk•management systems;
to provide the Board with an independent assessment of the Group’s accounting affairs and financial position;•
to monitor the effectiveness of the internal audit function and review its material findings;•
to oversee the relationship with the external auditors, including agreeing their remuneration and terms of engagement,•monitoring their independence, objectivity and effectiveness, ensuring that policy surrounding their engagement toprovide non-audit services is appropriately applied, and making recommendations to the Board on their appointment,reappointment or removal, for it to put to the shareholders in general meeting; and
to report to the Board on how it has discharged its responsibilities.•
2. Composition of the Audit & Risk CommitteeThe members of the Committee are set out in section 1.8 of the Corporate Governance Report. Len Konar, Jim Sutcliffe andVarda Shine held office throughout the year and continue in office at the date of this report. Len Konar, who chairs the Committee,is a Chartered Accountant with extensive financial and accounting experience, and is a member of the King Committee onCorporate Governance. Jim Sutcliffe is an actuary by training and until January 2015 served as a non-executive director ofthe Financial Reporting Council, where he chaired the Codes and Standards Committee. Varda Shine had a long career ininternational business, holding several executive and managerial positions over 30 years, including CEO of a large internationalbusiness. Mr Sutcliffe has served more than nine years as a Non-Executive Director and, as provided for in the Code, he maynot be regarded as independent. The Board has undertaken a robust assessment and concluded that Mr Sutcliffe remains ofindependent judgement. The Board believes it is in the best interests of your Company if we were to retain his valuable skillsand experience. Dr Konar and Ms Shine are regarded by the Board as independent and the Board regards Dr Konar as themember possessing recent and relevant financial experience. The varied backgrounds of the Committee’s members, and theircollective skills, experience and knowledge of the Company, allows them to fulfil the Committee’s remit and to oversee theCompany’s auditors.
Meetings of the Committee are attended by the Chairman of the Board, CEO, CFO, Head of Group Finance, Head of InternalAudit, Manager of Group Risk, Head of Group Financial Reporting and the Company Secretary, none of whom do so as ofright. The external auditors attend Committee meetings and a private meeting is routinely held with the internal and externalauditors to afford them the opportunity of discussions without the presence of management.
3. Number of Audit & Risk Committee meetings and attendanceThe Committee met eight times during the year and attendance at those meetings is shown in section 1.8 of the CorporateGovernance Report.
4. Activities of the Audit & Risk Committee during the yearThe Committee has an annual work plan, developed from its terms of reference, with standing items that the Committeeconsiders at each meeting in addition to any specific matters arising and topical items on which the Committee has chosen to focus.
/ 75Lonmin PlcAnnual Report and Accounts 2016
01 /Strategic R
eport02 /
Governance
03 /Financial S
tatements
04 /A Deeper Look
05 /Shareholder Inform
ation
Audit & Risk Committee Reportfor the year ended 30 September 2016
4. Activities of the Audit & Risk Committee during the year (continued)The work of the Audit & Risk Committee in FY2016 principally fell under three main areas and is summarised below.
/ 76 Lonmin PlcAnnual Report and Accounts 2016
Internal controls and risk
Considered reports from the internal auditors on their audits and assessment of the control environment•
Considered reports from the external auditors on their assessment of the control environment•
Considered feedback from the assurance letters submitted by around 75 senior managers across the Group•
Reviewed output from the risk reviews which required managers and the Exco to identify risks and evaluate them before•and after mitigating controls were agreed and implemented
Reviewed matters reported to the external whistleblowing hotline and a report from the investigations department•
Considered and approved the structure, scope of cover and renewal terms of the Group’s insurance programme•
Assessed the effectiveness of the Group’s internal control environment•
Considered report on IT Strategy including assessment of IT risk management and control environment•
Governance
Reviewed the effectiveness of the Committee•
Approved the Committee’s objectives and reviewed progress against the same•
External auditors and Internal auditors
Considered and approved the audit approach and scope of the audit work to be undertaken by the external auditors and•the fees for the same for the half and full year and approval of the engagement letter
Reviewed reports on external audit findings•
Considered the schedule of non-audit services provided by the external auditors•
Considered the independence of the auditors and the effectiveness of the external audit process, taking into account:•
non-audit work undertaken by the external auditors and compliance with the policy;(a)
feedback from a survey targeted at various stakeholders; and(b)
the Committee’s own assessment(c)
Considered and approved letters of representation issued to the external auditors•
Reviewed the resources of the internal audit function, assessed the level of alignment between the Company’s key risks•and approved the internal audit programme
Considered and approved the scope of the internal audit programme•
Considered the effectiveness of the internal auditors•
Accounting, tax and financial reporting
Reviewed and approved the half year and annual financial statements and the significant financial reporting judgements•
Reviewed the liquidity risk and the basis for preparing the Group half yearly and full year accounts on a going concern•basis and reviewed the related disclosures in the half year financial results and in the Annual Report and Accounts
Reviewed the process for assessment of the Group’s longer term viability•
Reviewed an accounting matters update, including consideration of relevant accounting standards and underlying•assumptions
Reviewed and approved disclosures in the Annual Report and Accounts in relation to internal controls, •risk management, principal risks and uncertainties and the work of the Committee
Reviewed the Q2 and Q4 production report•
Considered an update on tax matters•
Reviewed the status of the accounts and governance arrangements for subsidiary and JV entities•
www.lonmin.com
Audit & Risk Committee Reportfor the year ended 30 September 2016
5. Significant issues considered by the Audit & Risk CommitteeAfter discussion with both management and the external auditor, the Committee determined that the key risks of misstatementof the Group’s financial statements related to:
Impairment of non-financial assets (excluding inventories and deferred tax); •
Recoverability and impairment of the HDSA receivable; •
Physical quantities of inventory (excluding consumables) and net realisable value; and•
Going concern•
These issues were discussed with management during the year and with the auditor at the time the Committee reviewed and agreed the auditors’ Group audit plan, when the auditor reviewed the half year interim financial statements in May 2016 and also at the conclusion of the audit of the financial statements for the year ended 30 September 2016.
Impairment of non-financial assets (excluding inventories and deferred tax)
As more fully explained in note 31 to the financial statements, the Group’s principal non-financial assets are grouped into cash generating units (CGUs) for the purpose of assessing the recoverable amount. The Group’s key CGU is Marikana and the carrying amount of this CGU’s non-financial assets, before tax impact, was $1,625 million before impairment.
Both the Akanani and Limpopo CGUs were fully impaired in 2015. Whilst any changes in assumptions could lead to a reversal of impairment, no indicators of a reversal in impairment were observed in 2016.
In assessing impairment for the Marikana CGU, management determined the recoverable amount of the CGU, and comparedthis to the carrying amount at 30 September 2016. Management reported to the Committee the result of its impairmentassessment, noting to the Committee that future cash flows for the CGU had been estimated based on the most up to datebusiness forecasts and discounted using discount rates that reflected current market assessments of the time value of moneyand risks specific to the assets. Management highlighted to the Committee how they arrived at the key assumptions toestimate future cash flows for the CGU, specifically PGM metal prices, foreign exchange rates and discount rates.
Management also brought to the attention of the Committee the sensitivity analysis to be disclosed in note 31 of the financialstatements with regards to the recoverable amounts of the CGU.
The Committee interrogated management’s key assumptions used for determining the recoverable amounts of non-financialassets to understand their impact on the CGU’s recoverable amount and the Committee was satisfied that key assumptionshad been appropriately scrutinised, challenged and were sufficiently robust. The Committee was further satisfied with theimpairment amount of $335 million charged in the 2016 financial year and disclosed in the financial statements.
The auditor explained their audit procedures to test management’s impairment and considered the Group’s disclosures on thesubject. On the basis of their audit work, the auditor considered that the carrying value of non-financial assets was materiallyappropriate in the context of the financial statements as a whole.
Recoverability of the HDSA receivable
At 30 September 2016, the Group was owed an amount of $376 million by a subsidiary of Phembani. The loan was grantedto Shanduka Resources Group (Proprietary) Limited, our former BEE partner, that has now merged with Phembani, and themerged entity operates as Phembani Group (Proprietary) Limited as detailed in note 13 to the financial statements. The“Impairment – financial assets” section of note 1 to the financial statements notes a financial asset not carried at fair valuethrough profit or loss is assessed at each reporting date to determine whether there is objective evidence that it is impaired.
Management reported to the Committee that the receivable is secured on the shares in the Phembani subsidiary, whoseonly asset of value is its ultimate holding in Incwala Resources (Proprietary) Limited (Incwala). Incwala’s principal assets areinvestments in WPL, EPL and Akanani, all subsidiaries of Lonmin Plc. Management further reported that one of the sourcesof income to fund the settlement of the receivable was the dividend flow from these underlying investments, but that giventhe current state of the PGM industry there had not been any substantial dividend payments to Incwala in recent times.
Management reported concerns that the value of the security was below its carrying amount and reported to the Committee that an assessment had been made to determine the extent of any impairment, or reversal thereof, that may be required. Thekey drivers in arriving at the value of the security are Incwala’s underlying investments in WPL, EPL and Akanani. Managementreported that the same valuation models for the Marikana CGU as described in the Impairment of non-financial assets sectionabove had been used as the basis for determining the value of Incwala’s investments, and ultimately the value of thePhembani subsidiary.
The impairment assessment is done at each reporting date. In prior years, the decrease in value of WPL, EPL and Akanani, mainly as a result of the reduced production profile and revised PGM price outlook which resulted in the downward revision of the estimated future cash flows as well as the increase in discount rates for the Marikana and Akanani CGUs, resulted inthe value of the security falling below the carrying amount of the HDSA receivable. As a result, the asset was previouslyimpaired by $307 million. The same analysis was performed at 30 September 2016 and indicated that there is no need tofurther impair the HDSA asset.
/ 77Lonmin PlcAnnual Report and Accounts 2016
01 /Strategic R
eport02 /
Governance
03 /Financial S
tatements
04 /A Deeper Look
05 /Shareholder Inform
ation
Audit & Risk Committee Reportfor the year ended 30 September 2016
5. Significant issues considered by the Audit & Risk Committee (continued)Management also brought to the attention of the Committee the sensitivity analysis included in note 1 of the financial statements.
The Committee interrogated management’s procedures in arriving at the valuation and also scrutinised management’svaluation of the underlying security. The Committee was satisfied that a sufficiently robust process was followed to confirm the recoverability of the receivable.
The auditor explained their audit procedures to test management’s impairment assessment and considered the Group’sdisclosures on the subject. On the basis of their audit work, the auditor reported no inconsistencies or misstatements thatwere material in the context of the financial statements as a whole.
Physical quantities of inventory (excluding consumables) and net realisable value
As detailed in the “use of estimates and judgments” section in note 1 to the financial statements, inventory is held in a wide variety of forms across the value chain, and prior to production as a final metal, is always contained in a carrier material.As such inventory is typically sampled and assays taken to determine the metal content and how this is split by metal, the accuracy of which can vary quite significantly depending on the nature of the vessels and the state of the material.Furthermore, as detailed in the “Inventories” section in note 1 to the financial statements, inventory is valued at the lower of cost and net realisable value. PGM prices were volatile and subdued during the year and as such there is a risk that thecost of inventory exceeds its net realisable value.
Management reported to the Committee the procedures undertaken to determine the physical quantities of inventory at yearend which included observation of count and sampling procedures by independent metallurgists. Management highlighted to the Committee the estimation uncertainty in sampling and assays, and that a downward adjustment had been made toinventory quantities to allow for estimation uncertainty at various stages of the process. Management reported to the Committeeits calculations of the adjustment, and noted that the adjustment is dependent on the degree to which the nature and state ofmaterial allows for accurate measurement and sampling. Finally, management reported that calculations had been undertakento evaluate the measurement of inventory. A comparison of unit cost of each inventory item per PGM ounce to the net realisablevalue, driven mainly by the PGM price, is done to ensure that inventory is measured at the lower of cost or net realisable valuewhich resulted in an adjustment to inventory values of $25 million as reflected in note 15 to the financial statements.
The Committee scrutinised the inventory estimation adjustment calculations in conjunction with a history of stock countresults and process losses as well as the procedures undertaken by management to confirm the physical existence ofinventory. The Committee was satisfied that a sufficiently robust process was followed to confirm the quantities of inventory,and that the net realisable value of inventory was calculated correctly.
The auditor explained their audit procedures to test the physical quantities of inventory and to check the net realisable valuecalculations performed by management. On the basis of their audit work, the auditor reported no misstatements that werematerial in the context of the financial statements as a whole.
Going concern
As more fully explained in note 1 to the financial statements, in determining the appropriate basis of preparation of thefinancial statements, the Directors are required to consider whether the Group can continue in operational existence for the foreseeable future.
In assessing the Group’s ability to meet its obligations as they fall due, management prepared cash flow forecasts for a periodin excess of 12 months and considered various scenarios to test the Group’s resilience against operational risks including:
Adverse movements in the Rand / US Dollar exchange rate and PGM commodity prices or a combination thereof;•
Failure to meet forecast production targets; and•
Higher than planned cash costs.•
Management reported to the Committee the results of its going concern assessment, noting to the Committee that theGroup’s capital structure provides sufficient head room to cushion against downside operational risks and minimises the riskof breaching debt covenants.
The Committee interrogated management’s key assumptions used for determining the cash flow forecasts used in the goingconcern assessment as well as the scenarios applied in testing the Group’s resilience against downside risks. The Committeewas satisfied that key assumptions had been appropriately scrutinised, stress-tested and were sufficiently robust. TheCommittee was further satisfied with the going concern disclosures in the financial statements and that an appropriate basis of preparation of the financial statements had been arrived at.
The auditor explained their audit procedures to test management’s going concern assessment and considered the Group’sdisclosures on the subject. The Committee considered the conclusions reported by the auditor based on the finding of theirwork as set out in the audit report.
/ 78 Lonmin PlcAnnual Report and Accounts 2016

www.lonmin.com
Audit & Risk Committee Reportfor the year ended 30 September 2016
5. Significant issues considered by the Audit & Risk Committee (continued)
In summary
Management reported to the Committee that they were not aware of any material misstatements or immaterial misstatementsmade intentionally to achieve a particular presentation. The auditors reported to the Committee the misstatements that theyhad found in the course of their work and no material amounts remain unadjusted. The Committee confirmed that it wassatisfied that the auditors had fulfilled their responsibilities with diligence and professional skepticism.
After reviewing the presentations and reports from management and consulting, where necessary, with the auditors, theCommittee was satisfied that the financial statements appropriately addressed the critical judgments and key estimates(both in respect to the amounts reported and the disclosures). The Committee was also satisfied that the significantassumptions used for determining the value of assets and liabilities had been appropriately scrutinised, challenged andwere sufficiently robust.
6. Internal auditThe Company has an internal audit department comprising three in-house auditors, supported by the South African arm ofPwC who provides specialist services in connection with matters such as IT security and treasury, which would be inefficientto resource internally. The Head of Internal Audit reports jointly to the Chairman of the Audit & Risk Committee and to the CFO.
The internal audit plan, approved in September 2015 by the Committee, reflected a risk based approach targeting financialand operational processes. The main objective was to test the robustness of the mitigating controls and identify improvementopportunities. A total of 22 audits were undertaken during the year. The audits that were conducted focused on businesscritical and high risk areas which were prioritised by the internal auditors with input from management and the Committee.
Internal audit reports are reviewed by operational and line management and further reviewed by the Exco. Audit findings andthe related management actions are tracked by Internal Audit, and verified periodically after being reported by managementas complete. The Committee is provided with reports on material findings and recommendations and regular updates onthe progress made by management in addressing the findings are also provided. All action points are recorded on aCompany-wide database to facilitate monitoring and accountability.
The Head of Internal Audit is also responsible for the Company’s whistle-blowing programme.
A review of the effectiveness of Internal Audit was carried out during the year by way of a questionnaire completed by thosein the business who had been audited and the external auditors. Having considered the results of this survey and a number of other factors, including the quality of reporting to the Committee and impartiality of the internal auditors, the Committeeconcluded that Internal Audit was in all respects effective.
7. External auditThe external auditors are appointed by shareholders to provide an opinion on the financial statements and certain otherdisclosures prepared by the Directors. Following the tender in 2015 in accordance with the CMA Order 2014 and the externalauditors’ subsequent re-election at the 2016 AGM, KPMG LLP acted as the external auditors to the Lonmin Group throughoutthe year. The Senior Statutory Auditor is based in London and supported by an audit partner based in Johannesburg. TheCommittee is responsible for oversight of the external auditors, including approving the annual work plan and, on behalf ofthe Board, approving the audit fee.
The Company’s Audit Engagement Policy, adopted in 2010 and which is available on the Company’s website, is expected tobe updated to reflect the new rules under the EU audit regulation and will seek to reduce the threshold limits of any proposednon-audit work to ensure the 70% cap is not breached.
Under the current policy, the external auditors are not permitted to perform any work that they may subsequently need to auditor which might either create a conflict of interest or affect the auditors’ objectivity and independence. Non-audit services arenormally limited to assignments that are closely related to the annual audit or where the work is of such a nature that a detailedunderstanding of the Group is necessary.
The current policy provides for the following annual authorisation limits:
Audit-related services Non-audit related services
Chief Financial Officer $200,000 $100,000Chairman of the Audit & Risk Committee $500,000 $250,000Audit & Risk Committee >$500,000 >$250,000
Fees for audit related and non-audit services incurred during the year amounted to $1 million (2015 – $0.3 million)representing 91% of the audit fees. Audit related and non-audit services provided by the external auditors included theirreview of the half year Interim Review, assurance review of the Group’s sustainability reporting and Mining Charter complianceand tax advisory services. Further information can be found in note 4 to the financial statements.
The Committee is satisfied that the overall levels of audit related and non-audit fees are not material relative to the income of the external audit offices and firm as a whole and therefore the objectivity and independence of the external auditors wasnot compromised.
/ 79Lonmin PlcAnnual Report and Accounts 2016
01 /Strategic R
eport02 /
Governance
03 /Financial S
tatements
04 /A Deeper Look
05 /Shareholder Inform
ation
Audit & Risk Committee Reportfor the year ended 30 September 2016
/ 80 Lonmin PlcAnnual Report and Accounts 2016
7. External audit (continued)The Committee has evaluated the performance, independence and objectivity of KPMG and also reviewed the effectivenessof the external audit process. As part of this process, the Committee considered feedback on the year’s audit gatheredthrough a survey facilitated by the Secretary to the Committee. The survey, assessed not only the external auditor, but alsothe relationship between the external auditor, management and the Committee and the relationship between the external and internal auditors.
There were focused questions on the role of management as we believe that management’s attitude to, and engagement with,the external audit process is fundamental to its effectiveness. Respondents to the survey included the financial managementteam at corporate and business levels, company secretariat, the tax and treasury and risk teams, the internal auditors, humanresources, procurement, the Audit & Risk Committee members and the Chairman of the Board. The following factors werealso considered:
the external auditors’ progress achieved against the agreed audit plan and communication of any changes to the plan,•including changes in perceived audit risks;
the competence with which the external auditors handled the key accounting and audit judgements and communication•of the same with management and the Committee;
the external auditors’ compliance with relevant regulatory, ethical and professional guidance on the rotation of partners;•
the external auditors’ qualifications, expertise and resources and their own assessment of their internal quality procedures; •
the stability and continuity that would be provided by continuing to use KPMG; and •
effective management of the transition between lead audit partners.•
After taking into account all of the above factors, the Committee concluded that the external auditors were effective and the change in lead audit partners had proceeded well, with only minor issues thought to be linked to the transition.The Committee has recommended to the Board that their re-election at the 2017 AGM should be proposed to shareholders.The Committee also recommended the Board seek authority for the Directors to fix the external auditors’ remuneration,having first compared the proposed fees to the prior year’s fees and also relative to other companies of similar size, sectorand complexity.
There are no contractual obligations which restrict the Committee’s choice of statutory auditor. In addition, following athorough review of its policy on non-audit services provided by the external auditors, the Committee was comfortable that the external auditors are free from any perceived conflict of interest.
8. WhistleblowingThe Company provides an independent third-party whistleblowing helpline, which allows employees and other stakeholders toreport concerns about any suspected wrongdoing or unethical behaviour occurring within the business or about the behaviourof individuals. Calls are treated confidentially and anonymously if preferred. Any matters reported are initially reviewed byinternal audit and either investigated by internal audit or passed to the investigations team to take forward. Where necessary,certain matters are escalated to the CFO, CEO or Exco and reported regularly to the Audit & Risk Committee.
During the year under review, 28 cases of unethical behaviour were reported in FY2016. 15 calls were carried forwardfrom FY2015. Of these calls, seven are still under review and 36 calls were closed. The six cases that were successfullyconcluded included:
two fraud related cases;•
two company procedure violations; and•
two corruption related cases.•
A whistleblowing awareness campaign is being rolled out throughout the business and arrangements will form part of theinduction programme for new employees.
Disciplinary action was taken as listed below (in some cases, more than one employee / vendor was found to be involved):
four employees were dismissed;•
three employees received a final written warning;•
four employees resigned whilst disciplinary charges were being formulated; and•
three vendors were removed from the Company’s approved vendor list (losses were recovered from two of these vendors).•
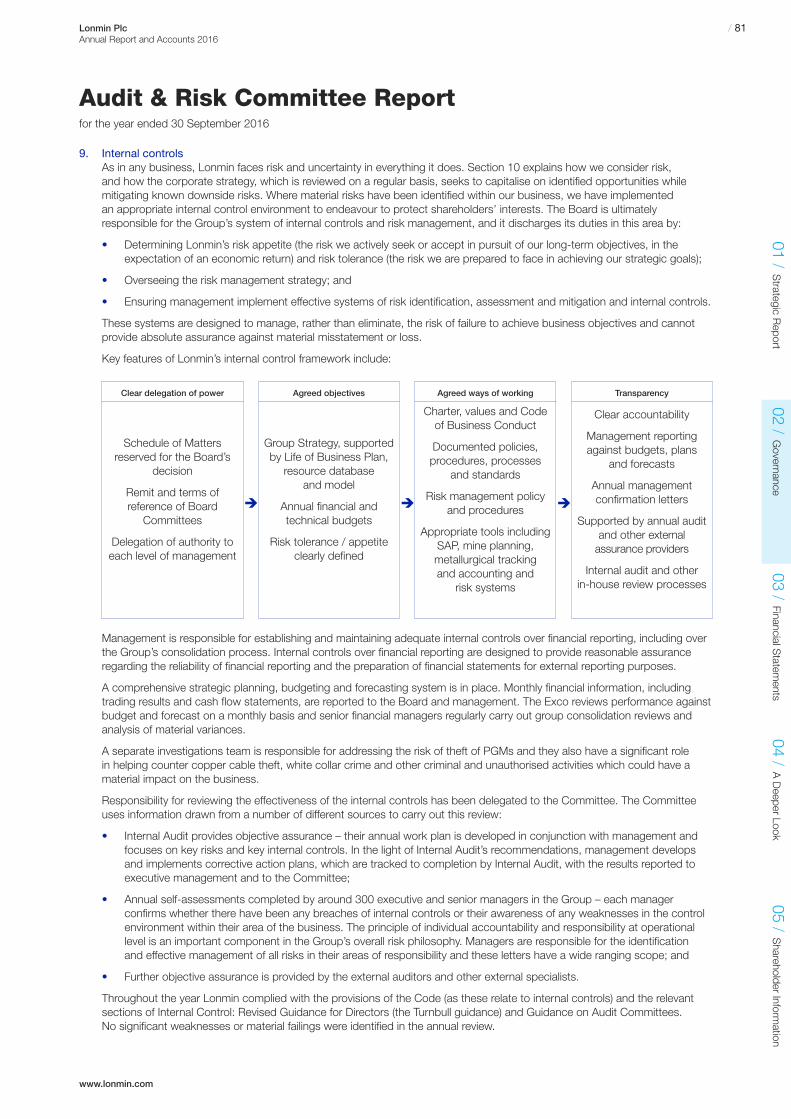
www.lonmin.com
Audit & Risk Committee Reportfor the year ended 30 September 2016
9. Internal controlsAs in any business, Lonmin faces risk and uncertainty in everything it does. Section 10 explains how we consider risk,and how the corporate strategy, which is reviewed on a regular basis, seeks to capitalise on identified opportunities whilemitigating known downside risks. Where material risks have been identified within our business, we have implemented an appropriate internal control environment to endeavour to protect shareholders’ interests. The Board is ultimatelyresponsible for the Group’s system of internal controls and risk management, and it discharges its duties in this area by:
Determining Lonmin’s risk appetite (the risk we actively seek or accept in pursuit of our long-term objectives, in the•expectation of an economic return) and risk tolerance (the risk we are prepared to face in achieving our strategic goals);
Overseeing the risk management strategy; and•
Ensuring management implement effective systems of risk identification, assessment and mitigation and internal controls.•
These systems are designed to manage, rather than eliminate, the risk of failure to achieve business objectives and cannotprovide absolute assurance against material misstatement or loss.
Key features of Lonmin’s internal control framework include:
Management is responsible for establishing and maintaining adequate internal controls over financial reporting, including overthe Group’s consolidation process. Internal controls over financial reporting are designed to provide reasonable assuranceregarding the reliability of financial reporting and the preparation of financial statements for external reporting purposes.
A comprehensive strategic planning, budgeting and forecasting system is in place. Monthly financial information, includingtrading results and cash flow statements, are reported to the Board and management. The Exco reviews performance againstbudget and forecast on a monthly basis and senior financial managers regularly carry out group consolidation reviews andanalysis of material variances.
A separate investigations team is responsible for addressing the risk of theft of PGMs and they also have a significant role in helping counter copper cable theft, white collar crime and other criminal and unauthorised activities which could have amaterial impact on the business.
Responsibility for reviewing the effectiveness of the internal controls has been delegated to the Committee. The Committeeuses information drawn from a number of different sources to carry out this review:
Internal Audit provides objective assurance – their annual work plan is developed in conjunction with management and•focuses on key risks and key internal controls. In the light of Internal Audit’s recommendations, management developsand implements corrective action plans, which are tracked to completion by Internal Audit, with the results reported toexecutive management and to the Committee;
Annual self-assessments completed by around 300 executive and senior managers in the Group – each manager•confirms whether there have been any breaches of internal controls or their awareness of any weaknesses in the controlenvironment within their area of the business. The principle of individual accountability and responsibility at operationallevel is an important component in the Group’s overall risk philosophy. Managers are responsible for the identification and effective management of all risks in their areas of responsibility and these letters have a wide ranging scope; and
Further objective assurance is provided by the external auditors and other external specialists.•
Throughout the year Lonmin complied with the provisions of the Code (as these relate to internal controls) and the relevantsections of Internal Control: Revised Guidance for Directors (the Turnbull guidance) and Guidance on Audit Committees. No significant weaknesses or material failings were identified in the annual review.
/ 81Lonmin PlcAnnual Report and Accounts 2016
01 /Strategic R
eport02 /
Governance
03 /Financial S
tatements
04 /A Deeper Look
05 /Shareholder Inform
ation
Ë Ë Ë
Schedule of Mattersreserved for the Board’s
decision
Remit and terms ofreference of Board
Committees
Delegation of authority toeach level of management
Clear delegation of power
Group Strategy, supportedby Life of Business Plan,resource database
and model
Annual financial andtechnical budgets
Risk tolerance / appetiteclearly defined
Agreed objectives
Charter, values and Codeof Business Conduct
Documented policies,procedures, processes
and standards
Risk management policyand procedures
Appropriate tools includingSAP, mine planning,metallurgical trackingand accounting and
risk systems
Agreed ways of working
Clear accountability
Management reportingagainst budgets, plans
and forecasts
Annual managementconfirmation letters
Supported by annual auditand other externalassurance providers
Internal audit and otherin-house review processes
Transparency

Audit & Risk Committee Reportfor the year ended 30 September 2016
10. Risk ManagementLonmin has an integrated approach to risk management and internal controls to ensure that our reviews of risk are used toinform the internal audit process and the design of internal controls.
The risk management process, which has been in place throughout the year under review and to the date of approval of the accounts, identifies, evaluates, manages and monitors the risks facing the business. Those risks that are identified as significant, in addition to the associated mitigating controls, are reviewed regularly by the Exco and then by the Board. The Committee regularly reviews the effectiveness of the risk identification process and the methodology used to evaluate and quantify the risks, in line with the guidance appended to the Code.
The corporate strategy, which is reviewed on a regular basis, seeks to capitalise on identified opportunities while mitigatingknown downside risks. Where material risks have been identified within our business, we have implemented an appropriateinternal control environment to endeavour to protect shareholders’ interests.
Lonmin’s Risk Management Framework, policy and procedures aim to:
Enable management to implement effective systems of risk identification, assessment and mitigation and internal controls;•
Assist management and the Board to determine Lonmin’s risk appetite and risk tolerance;•
Embed a risk based approach and awareness into the corporate culture so that risks are communicated and understood•at all levels and functions within the Group;
Encourage line management accountability for identifying and managing the risks within their area of the business; and•
Develop and implement risk management strategies which address the full spectrum of risks, including compliance,•industry-specific, competitiveness, environmental, business continuity, strategic, reporting, security, privacy, and operational.
Principal Risks
The top risks and the associated mitigating controls are reviewed at least quarterly by the Exco and the Board and a summarydashboard is reviewed at every Board meeting.
Review of Risks
“Top-down” and “bottom-up” risk reviews are carried out in each area of our business, involving the Exco, operational and middle managers respectively. All senior managers are responsible for managing and monitoring risks in their area of responsibility and recording these in the risk register. It is mandatory for this process to take place at least once a year, but in practice, reviews often take place more frequently. For each risk identified, management assesses the root causes,consequences of the unmitigated risks, probability of occurrence, effectiveness of the existing controls and the level of exposure after mitigation measures had been implemented.
Each of the business areas is supported by either a Risk Officer or an Operational Risk Champion who co-ordinates all riskmanagement activity in that business area and ensures that actions are implemented appropriately. This process ensures allrisks are measured, monitored and reported on a consistent basis. In order to protect our strategic objectives, it is importantthat we manage these risks as effectively as possible. The work of the Risk Management Department is closely aligned to thatof the Internal Audit Department.
Risks related to sustainability
Risks related to safety, labour and community relations, social development, transformation and environmental impacts makeupa significant portion of Lonmin’s risk profile. Each business area is responsible for managing safety and environmental impactmitigation and for monitoring the relevant action plans in place. In this way, the Company ensures that focus on these areas ismaintained and that accountability is embedded at operational management level. Reviews of these risks and their associatedmanagement plans are conducted by the SHE and SET Committees, the results of which are presented to the Board.
Risk Information Management System (RIMS)
To assist with the risk management process, the Company implemented the CURA Risk Management System in 2012. The application allows all users within the Group access to the risk registers through a web based system. RIMS hasimproved management’s oversight of risks through its enhanced tracking and reporting functionality.
/ 82 Lonmin PlcAnnual Report and Accounts 2016
www.lonmin.com
Nomination Committee Reportfor the year ended 30 September 2016
1. Role of the Nomination CommitteeThe Nomination Committee has delegated authority from the Board set out in its written terms of reference, available on theCompany’s website, which were last reviewed by the Board in May 2015. The primary purposes of the NominationCommittee are:
to ensure that a regular, rigorous and objective evaluation is undertaken of the structure, size, composition, balance of•skills, knowledge and experience of the Board;
to recommend any proposed changes to the composition of the Board and to instigate and manage the recruitment•process;
to ensure the Company’s adherence to applicable legal and regulatory requirements in relation to the above; and•
to oversee compliance with the Code and other applicable corporate governance regulations.•
The Committee Chairman reports material findings and recommendations at the next Board meeting and copies of theminutes of its meetings are circulated to all Directors.
2. Composition of the Nomination CommitteeThe Chairman of the Board and the four independent Non-executive Directors are members of the Committee. No individual,participates in discussion or decision-making when the matter under consideration relates to him or her.
The Committee is supported by the services of the Company Secretary who acts as secretary to the Committee and it has fullaccess to the CEO. It is empowered to appoint search consultants, legal, tax and other professional advisors as it sees fit toassist with its work.
3. Activities of the Nomination Committee during the yearThe Committee met six times during the year and attendance at those meetings is shown in section 1.8 of the corporategovernance report.
Matters considered by the Committee in FY2016 included the following material items:
/ 83Lonmin PlcAnnual Report and Accounts 2016
01 /Strategic R
eport02 /
Governance
03 /Financial S
tatements
04 /A Deeper Look
05 /Shareholder Inform
ation
Board composition
Assessed the composition of the Board in the light of the assessment matrix showing key skills, knowledge, experience,•independence and tenure of each Director
Reviewed Board succession plans taking into account the matrix and diversity implications•
Considered the outcome of the Board effectiveness review and individual assessments in respect of the Non-executive•Directors seeking re-election / election at the 2016 AGM
Considered and approved the termination arrangements in respect of Simon Scott •
Considered and approved the appointments of Kennedy Bungane and Barrie van der Merwe •
Good governance
Considered progress against the Committee’s objectives for FY2016•
Considered the scope and process of the Board effectiveness review •
Considered and approved the Committee’s objectives for FY2017•
Reviewed the FRC’s guidance on UK Board Succession Planning •
Considered the succession strategy in relation to Jim Sutcliffe •
Reviewed the policy on shareholding obligations to which the Board and senior management are subject•
Reporting
Reviewed the Committee’s report within the 2015 annual report and accounts and recommended approval to the Board•
Management
Considered the composition of the Exco •
Considered the proposed appointment of an Acting Executive Vice President, Corporate Communications and•External Affairs
Nomination Committee Reportfor the year ended 30 September 2016
4. Policy on appointments to the BoardOur policy is outlined in more detail in section 1.3 in the Corporate Governance Report and is summarised below.
The issue of diversity has frequently been debated by the Committee and the policy, initially adopted in 2011, has beenreviewed on these occasions. The Board’s view has been and continues to be that all appointments to the Board should bemerit based, assessed against objective selection criteria. To avoid precluding any deserving candidate from consideration,executive search consultants are asked to provide candidates from a diverse range of backgrounds and that these lists aregender neutral. The Board maintains its practice of embracing diversity in the broadest sense and has therefore chosen not to set any measurable gender based targets.
The process of identifying candidates for Board appointment commences with an analysis of the current Board compositiontaking in to account various factors such as qualifications, skills, experience, independence and diversity of the existingDirectors in order to identify any weaknesses.
These factors are assessed by reference to 27 different criteria which are tabulated in a matrix, for example:
Knowledge Geology, mining engineering and processing technology•
South African law and regulation, especially BEE and labour law•
Corporate finance•
ExperienceDriving safety, health and environment initiatives and performance•
Oversight of operational performance at c-suite level•
Commodity pricing and forex forecasting•
SkillsStrategic planning and execution•
Management of people (teams) and operations (preferably mines and processing plants)•
A person specification is then prepared which includes, in the case of Non-executive Director appointments, an estimate of thetime commitment required. Generally, the Committee will engage executive search consultants, or consider open advertising, toassist in ensuring a comprehensive list of potential candidates from a range of backgrounds for the Committee’s consideration.
The appointment of Kennedy Bungane earlier this year did not, however, follow the process described above. Phembani, theCompany’s BEE partner, retains the right to nominate a director to the Board. This right was exercised and following normaldue diligence checks and assessment against objective selection criteria, Mr Bungane was appointed to the Board on1 March 2016.
During the year, the Committee supported the decision for Simon Scott to step down as Director and CFO, effective 16 May 2016. Mr Scott remained employed in a transitional role until 30 September 2016. Further information in relation to the termination and remuneration arrangements can be found in the Directors’ Remuneration Report on pages 85 and 113.
Barrie van der Merwe joined the Company as an employee on 19 April 2016 and, effective 17 May 2016, he was appointedto the Board as a Director and CFO.
5. Talent assessment and succession planningThe Committee continues to develop succession plans in respect of the Board to ensure that there is an orderly refreshing of the skills and experience on the Board. The Committee also provides guidance and monitors succession plans, talentassessment and development plans at senior and mid management level.
During the year under review, the Board participated in a “deep dive” session during one of its visits to the operations in South Africa at which time Abey Kgotle, our EVP of Human Capital, presented the Board with an overview of the successionplans in place in all critical roles immediately below Exco. These plans included details of the talent pipeline in terms ofthose considered “emergency”, “ready now”, “ready in 1-3 years”, “ready within 5 years” and the longer term talent pipeline.The Board also had the opportunity to meet with individuals on the Group’s graduate programme. Identifying, developing andretaining talent within the organisation is critical for the continued sustainability of the business and therefore this forms oneof the key priorities for the Board in FY2017.
6. Independence and re-election to the BoardThe composition of the Board is reviewed annually by the Committee to ensure that there is an effective balance of skills,experience and knowledge. In addition to the annual review as part of the annual re-election process, a further review of theindependence of Jim Sutcliffe was undertaken as, at the date of this report, he had served more than nine years on theBoard. Mr Sutcliffe did not participate in this review.
The Committee considered the composition of the Board, Mr Sutcliffe’s considerable and valuable contribution to the Board,his external commitments and whether he was perceived to be any less independent having served nine years, two monthson the Board. The Committee was satisfied that Mr Sutcliffe remains independent in all respects and continues to providesignificant challenge and probity in all board discussions. The Committee will continue to review this regularly.
In accordance with the Code, all directors are retiring and offering themselves for re-election / election by shareholders at theCompany’s 2017 AGM. Biographical information on each of the Directors can be found on pages 54 and 55.
/ 84 Lonmin PlcAnnual Report and Accounts 2016
www.lonmin.com
/ 85Lonmin PlcAnnual Report and Accounts 2016
01 /Strategic R
eport02 /
Governance
03 /Financial S
tatements
04 /A Deeper Look
05 /Shareholder Inform
ation
Directors’ Remuneration Reportfor the year ended 30 September 2016
Dea r Sha reholder,Last year, I had to write to you at a time of extreme difficulty for the Company, and explained that we were giving neither bonuses nor salary increases to your Executive Directors, despite their huge efforts on your behalf.Fortunately, as you will see from the Strategic report and the words of the Chairman and the CEO earlier in thisreport, 2015/16 has been a better period. But it has been better rather than easy, and while we have been able to build our cash position, we have been only marginally profitable, with low platinum prices only being partly offsetby US Dollar strength.
In this environment, your executives have delivered the guided sales figures, reduced expenses substantially(although unit costs were stubbornly high), and signed a three-year wage settlement with our majority union. Thanks to your support for our Rights Issue, they were able to renew our bank facilities, which significantly strengthened ourbalance sheet. We have, however, also had some disappointments. We regrettably suffered four fatalities during theyear and we extend our deepest condolences to the families and friends and our colleagues for their loss. Miningproduction has not been as strong as we had planned for, as discussed in detail earlier in this annual report. Ourshares trade, as I write, at a considerable premium to the rights price at which most shares in issue were purchased.
It is against this backdrop, that the Committee has applied the binding remuneration policy for the year for theExecutive Directors.
The Balanced Scorecard (BSC), is disclosed in full on page 92, and follows the pattern of previous years. Overall, itproduced a less than target (80%) outcome of 65.4% on the corporate element of the scorecard, with the productionmetric providing the major component, and zero arising from the safety metric. This seemed to the Committee to align well with shareholders’ interests and no discretion was applied. The personal element for each ExecutiveDirector, was assessed by the Committee and was scored in a range of 20 – 25%, to reflect their efforts to de-riskthe Company and restructure the business to cope with a low price world.
In line with the Remuneration Policy, each of the Executive Directors will be granted an award under the AnnualShare Award Plan matching the value of their bonus payment. In addition, LTIP Awards will be granted at 125% ofsalary and, in line with the policy, these will be subject to the new performance condition comprising a return metricand TSR and will vest in three equal tranches in years 3, 4 and 5.
CPI in South Africa as at the end of the financial year was 6.1%. The Committee has decided to award an annualsalary increase of 5% to Ben Moolman and Barrie van der Merwe, both of whom receive Rand denominated salaries,in line with the next tier of management and lower than provided to unionised employees. Ben Magara remains on aSterling denominated salary, in line with our commitment when he was first appointed to the Board. The RemunerationCommittee had been prepared to award Ben an annual salary increase of 2% to recognise in part inflation since hissalary was last changed. However, Ben has decided to waive this salary increase.
The Committee feels that these annual increases and awards are appropriate and reasonable in the context set out above and, importantly, recognise the efforts of the individuals in the prior year and ongoing.
I look forward to your feedback on this year’s report. Please feel free to get in touch at any time, either directly or through the Company Secretary.
Jim SutcliffeChairman, Remuneration Committee
Jim SutcliffeChairman, Remuneration Committee

Directors’ Remuneration Reportfor the year ended 30 September 2016
/ 86 Lonmin PlcAnnual Report and Accounts 2016
2016 Directors’ Remuneration Implementation ReportThis section of the Directors’ Remuneration Report sets out the Company’s remuneration of its Executive and Non-executiveDirectors during the financial year ended 30 September 2016 (“FY2016”), and will, together with the annual statement by theCommittee Chairman, be proposed for an advisory vote by shareholders at the AGM on 26 January 2017. It has been prepared onthe basis prescribed in The Large and Medium-sized Companies and Groups (Accounts and Reports) (Amendment) Regulations2013 (the “Regulations”) and also includes the items required to be disclosed under Listing Rule 9.8.8 R. Where required, data hasbeen audited by KPMG LLP and is flagged accordingly.
Context
Consideration of Directors’ remunerationThe Remuneration Committee (the “Committee”) is a Committee of the Board with delegated powers set out in its terms ofreference, available on the Company’s website. These are reviewed periodically and updated where necessary. The Committee’smain responsibilities are to:
determine and agree with the Board the Company’s executive remuneration strategy and policy;•
determine individual remuneration packages and terms of employment within that policy for the Executive Directors, members•of the Executive Committee and nineteen other senior executives (collectively known as the Purview Group);
oversee the operation of the Company’s incentive schemes, including designing and setting performance measures and•targets for annual bonus and long-term incentive schemes;
consider major changes in employee remuneration in the Group;•
select and appoint consultants to advise the Committee;•
report to shareholders through annual reports; and•
make recommendations to the Board on the fees offered to the Non-executive Directors, after taking independent•professional advice;
all of which it carries out on behalf of the Board.
As discussed earlier in the annual report, Jim Sutcliffe has served more than nine years as a Non-executive Director. Havingconsidered his independence, the Nomination Committee is satisfied that he remains independent and has concluded that heshould remain as chairman of the Remuneration Committee and the Nomination Committee. Jonathan Leslie, Brian Beamish andVarda Shine are members of the Committee and each of them and Jim held office throughout the year and continue in office at thedate of this report. The collective business experience of its members enables the Committee to offer a balanced, informed andindependent view on remuneration.
The Committee met six times during FY2016. As well as routine monitoring and approval activities, the material issues discussedare summarised below:
2015 Rights Issue
The dilutive impact of the Rights Issue and share capital consolidation on outstanding awards under the Company’s share•plans was discussed and a basis of adjustment was agreed
RemCo Purview Group
The Committee approved the expansion of membership of the Purview Group (at time of approval to 30 members), including•general managers
Short term remuneration
The outcome of the FY2015 BSC Plan was discussed, and, despite the positive score, the Committee agreed that given the•financial circumstances of the Company, bonus payments would not be paid to managers above level C5, including the Directors.The Committee agreed that no salary increases would be offered to managers above level C5 for FY2016 given the financial•circumstances of the CompanyThe Committee discussed and approved the bonus metrics of the FY2016 BSC Bonus Plan•
Long term remuneration
The Committee agreed that no share awards would be granted to Directors and Executive Committee Members in respect of FY2015. •The Committee considered and agreed the metrics and applicability of various cash based incentive plans for management•below Exco in respect of FY2016The Committee considered Ben Magara’s Recruitment Award and Simon Scott’s Special Award and agreed that both would•vest in full during FY2016, after being deferred during FY2015
Governance and reporting
The Committee considered and approved the Directors’ Remuneration Report section of the FY2015 annual report•
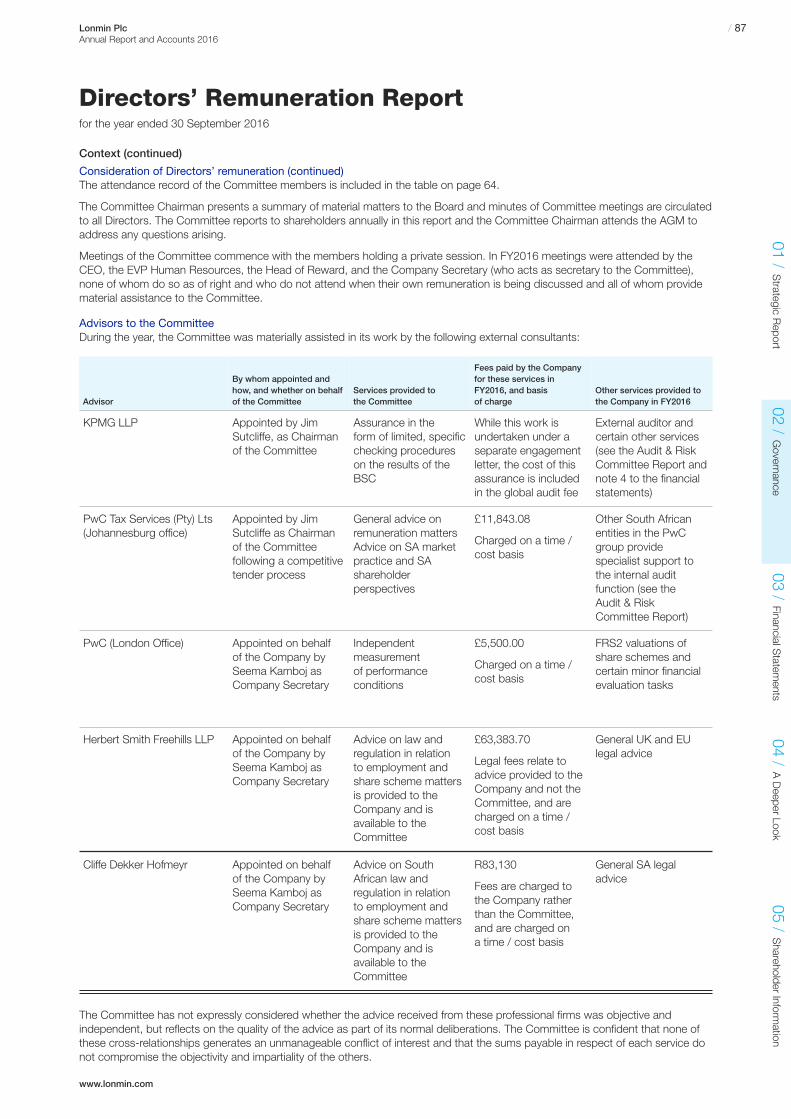
www.lonmin.com
/ 87Lonmin PlcAnnual Report and Accounts 2016
01 /Strategic R
eport02 /
Governance
03 /Financial S
tatements
04 /A Deeper Look
05 /Shareholder Inform
ation
Context (continued)
Consideration of Directors’ remuneration (continued)The attendance record of the Committee members is included in the table on page 64.
The Committee Chairman presents a summary of material matters to the Board and minutes of Committee meetings are circulatedto all Directors. The Committee reports to shareholders annually in this report and the Committee Chairman attends the AGM toaddress any questions arising.
Meetings of the Committee commence with the members holding a private session. In FY2016 meetings were attended by theCEO, the EVP Human Resources, the Head of Reward, and the Company Secretary (who acts as secretary to the Committee),none of whom do so as of right and who do not attend when their own remuneration is being discussed and all of whom providematerial assistance to the Committee.
Advisors to the CommitteeDuring the year, the Committee was materially assisted in its work by the following external consultants:
The Committee has not expressly considered whether the advice received from these professional firms was objective andindependent, but reflects on the quality of the advice as part of its normal deliberations. The Committee is confident that none ofthese cross-relationships generates an unmanageable conf lict of interest and that the sums payable in respect of each service donot compromise the objectivity and impartiality of the others.
Directors’ Remuneration Reportfor the year ended 30 September 2016
Advisor
By whom appointed andhow, and whether on behalfof the Committee
Services provided tothe Committee
Fees paid by the Companyfor these services inFY2016, and basis of charge
Other services provided tothe Company in FY2016
KPMG LLP Appointed by JimSutcliffe, as Chairman of the Committee
Assurance in the form of limited, specificchecking procedureson the results of theBSC
While this work isundertaken under aseparate engagementletter, the cost of thisassurance is includedin the global audit fee
External auditor andcertain other services(see the Audit & RiskCommittee Report andnote 4 to the financialstatements)
PwC Tax Services (Pty) Lts(Johannesburg office)
Appointed by JimSutcliffe as Chairmanof the Committeefollowing a competitivetender process
General advice onremuneration mattersAdvice on SA marketpractice and SAshareholderperspectives
£11,843.08
Charged on a time /cost basis
Other South Africanentities in the PwCgroup providespecialist support tothe internal auditfunction (see the Audit & RiskCommittee Report)
PwC (London Office) Appointed on behalf of the Company bySeema Kamboj asCompany Secretary
Independentmeasurement of performanceconditions
£5,500.00
Charged on a time /cost basis
FRS2 valuations ofshare schemes andcertain minor financialevaluation tasks
Herbert Smith Freehills LLP Appointed on behalf of the Company bySeema Kamboj asCompany Secretary
Advice on law andregulation in relation to employment andshare scheme mattersis provided to theCompany and isavailable to theCommittee
£63,383.70
Legal fees relate toadvice provided to theCompany and not theCommittee, and arecharged on a time /cost basis
General UK and EUlegal advice
Cliffe Dekker Hofmeyr Appointed on behalf of the Company bySeema Kamboj asCompany Secretary
Advice on SouthAfrican law andregulation in relation to employment andshare scheme mattersis provided to theCompany and isavailable to theCommittee
R83,130
Fees are charged tothe Company ratherthan the Committee,and are charged on a time / cost basis
General SA legaladvice
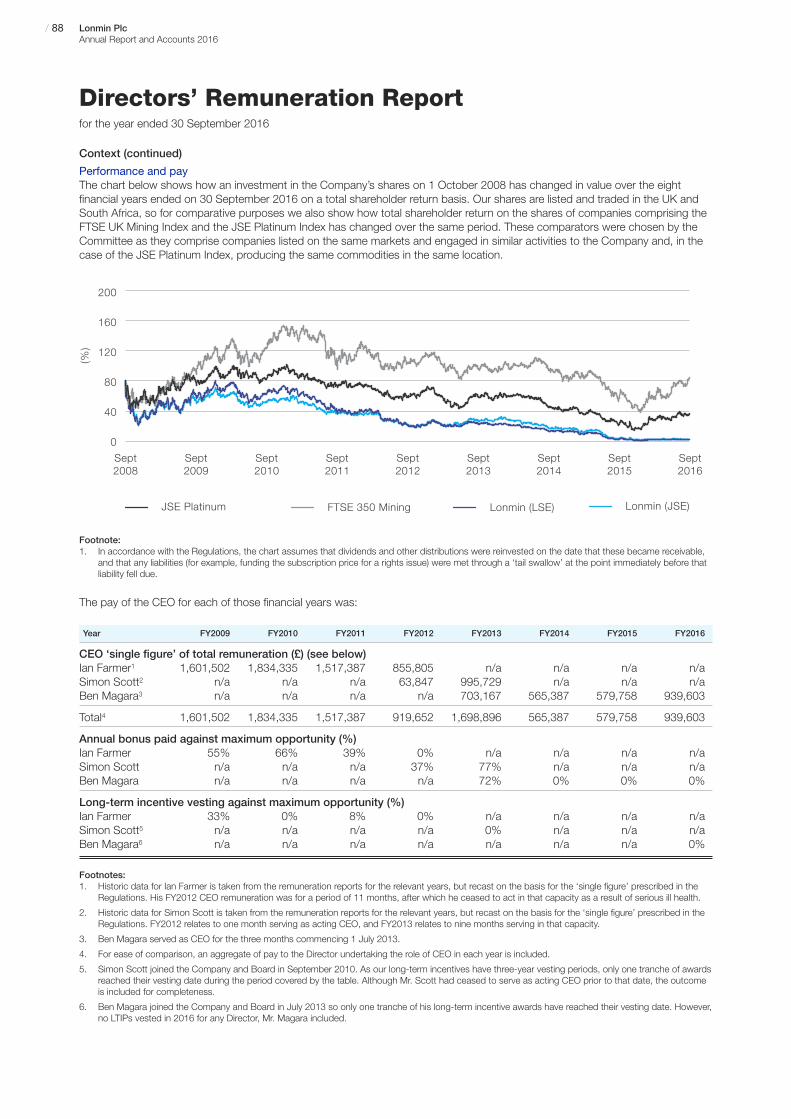
Directors’ Remuneration Reportfor the year ended 30 September 2016
/ 88 Lonmin PlcAnnual Report and Accounts 2016
Context (continued)
Performance and payThe chart below shows how an investment in the Company’s shares on 1 October 2008 has changed in value over the eightfinancial years ended on 30 September 2016 on a total shareholder return basis. Our shares are listed and traded in the UK andSouth Africa, so for comparative purposes we also show how total shareholder return on the shares of companies comprising theFTSE UK Mining Index and the JSE Platinum Index has changed over the same period. These comparators were chosen by theCommittee as they comprise companies listed on the same markets and engaged in similar activities to the Company and, in thecase of the JSE Platinum Index, producing the same commodities in the same location.
Footnote:1. In accordance with the Regulations, the chart assumes that dividends and other distributions were reinvested on the date that these became receivable,
and that any liabilities (for example, funding the subscription price for a rights issue) were met through a ‘tail swallow’ at the point immediately before thatliability fell due.
The pay of the CEO for each of those financial years was:
Year FY2009 FY2010 FY2011 FY2012 FY2013 FY2014 FY2015 FY2016
CEO ‘single figure’ of total remuneration (£) (see below)Ian Farmer1 1,601,502 1,834,335 1,517,387 855,805 n/a n/a n/a n/aSimon Scott2 n/a n/a n/a 63,847 995,729 n/a n/a n/aBen Magara3 n/a n/a n/a n/a 703,167 565,387 579,758 939,603
Total4 1,601,502 1,834,335 1,517,387 919,652 1,698,896 565,387 579,758 939,603
Annual bonus paid against maximum opportunity (%)Ian Farmer 55% 66% 39% 0% n/a n/a n/a n/aSimon Scott n/a n/a n/a 37% 77% n/a n/a n/aBen Magara n/a n/a n/a n/a 72% 0% 0% 0%
Long-term incentive vesting against maximum opportunity (%)Ian Farmer 33% 0% 8% 0% n/a n/a n/a n/aSimon Scott5 n/a n/a n/a n/a 0% n/a n/a n/aBen Magara6 n/a n/a n/a n/a n/a n/a n/a 0%
Footnotes: 1. Historic data for Ian Farmer is taken from the remuneration reports for the relevant years, but recast on the basis for the ‘single figure’ prescribed in the
Regulations. His FY2012 CEO remuneration was for a period of 11 months, after which he ceased to act in that capacity as a result of serious ill health.
2. Historic data for Simon Scott is taken from the remuneration reports for the relevant years, but recast on the basis for the ‘single figure’ prescribed in theRegulations. FY2012 relates to one month serving as acting CEO, and FY2013 relates to nine months serving in that capacity.
3. Ben Magara served as CEO for the three months commencing 1 July 2013.
4. For ease of comparison, an aggregate of pay to the Director undertaking the role of CEO in each year is included.
5. Simon Scott joined the Company and Board in September 2010. As our long-term incentives have three-year vesting periods, only one tranche of awardsreached their vesting date during the period covered by the table. Although Mr. Scott had ceased to serve as acting CEO prior to that date, the outcomeis included for completeness.
6. Ben Magara joined the Company and Board in July 2013 so only one tranche of his long-term incentive awards have reached their vesting date. However,no LTIPs vested in 2016 for any Director, Mr. Magara included.
(%)
Sept2008
Sept2009
Sept2010
Sept2011
Sept2012
Sept2014
Sept2013
JSE Platinum FTSE 350 Mining Lonmin (LSE) Lonmin (JSE)
Sept2016
Sept2015
0
40
80
120
160
200

www.lonmin.com
/ 89Lonmin PlcAnnual Report and Accounts 2016
01 /Strategic R
eport02 /
Governance
03 /Financial S
tatements
04 /A Deeper Look
05 /Shareholder Inform
ation
Context (continued)
Performance and pay (continued)The table above does not reflect the general decline in value of awards since the Company’s share price reached an all-time highin early 2008. As a consequence, both vested and outstanding awards have generally had (and have) vastly lower values than theface value at granting.
The Committee’s goal is to design and implement remuneration arrangements which ensure that performance and pay are linked.Any formulaic approach has the potential to deliver inappropriate outcomes and the Committee therefore generally has discretionto adjust those mathematical results where it sees fit. While pay must be justified by performance, it is equally fair that whereperformance falls short, there is no payment. We believe that our track record illustrates this. We operate short and long-termincentive arrangements:
BSC bonus plan – this short-term incentive plan is used to incentivise operational actions and outcomes, because these are•under management’s control or influence. As a single commodity, single site business, Lonmin’s financial outcomes are highlyinfluenced by PGM prices and foreign exchange. However, we design the bonus plan to limit the impact of these external andnon-controllable effects.
LTIP – this long-term incentive plan is used to drive performance over the longer term (measured over three-year periods with•vesting in three equal tranches on the third, fourth and fifth anniversaries of the date of grant) and to create a clear alignmentbetween executives’ and shareholders’ interests. The measures we have chosen to use generally reflect shareholders’experience, including the impact of PGM prices and foreign exchange, as well as the payment of dividends.
The Company has not delivered value for shareholders for a number of years. While this is unsatisfactory, there is a clearcorrelation between performance and pay:
Directors’ Remuneration Reportfor the year ended 30 September 2016
BSC Bonus PlanCorporate metrics (% of face value)
Calculated ActualYear At ‘target’ At ‘stretch’ outcome paid
FY2005 70 105 24.2 24.2FY2006 60 90 49.7 49.7FY2007 60 90 8 8FY2008 60 90 37.1 37.1FY2009 80 120 65.2 65.2FY2010 80 120 74 74FY2011 80 120 43 43FY2012 80 120 46.3 46.3FY2013 80 120 85.8 85.8FY2014 80 120 27.8 0FY2015 80 120 54.5 0FY2016 80 120 65.4 65.4
Long-Term Incentives Plan LTIP(% of award face value)
Year ofgrant / vesting Performance condition % vesting
– – –– – –2004/2007 RTSR only 66%2005/2008 RTSR only 38%2006/2009 RTSR + EBIT 31%2007/2010 RTSR + EBIT 0%2008/2011 RTSR + EBIT 0%2009/2012 RTSR + Share Price 0%2010/2013 RTSR x 3y BSC 0%2011/2014 RTSR x 3y BSC 0%2012/2015 RTSR x 3y BSC 0%2013/2016 RTSR x 3y BSC 0%
Relative importance of spend on payTo place the Directors’ remuneration in the context with the Group’s finances more generally, the Committee uses thefollowing comparisons:
Year ended Year ended30 September 30 September
2016 2015 DifferenceItem ($m) ($m) ($m)
Remuneration of Group employees of which: 528 561 (33)Remuneration of Executive Directors 2.0 0.7 1.3Remuneration of Non-executive Directors 0.5 0.4 0.1Distributions to shareholders – – –
Other significant distributions of profit or cash flow:Capital expenditure 89 136 (47)
Payments over this period were overwhelmingly made in Rands and then converted to US Dollars. The year average exchangerate was calculated using the daily exchange rates from the SAP currency table.

Directors’ Remuneration Reportfor the year ended 30 September 2016
/ 90 Lonmin PlcAnnual Report and Accounts 2016
Context (continued)
Relative importance of spend on pay (continued)There were no dividends declared or paid in the year, and no share buy-backs were undertaken.
Capital expenditure has been included in the table as the Board must choose whether to distribute profits and cash flows by wayof dividend, or reinvest these in developing our assets to maintain or improve the operational health of the Company. In any miningbusiness a minimum level of ‘sustaining’ capex is essential and may on occasion preclude the payment of dividends. All of theseamounts are presented as shown in the Company’s audited financial statements.
Directors’ remuneration in FY2017
As much as 70% of the total reward offered to Executive Directors is subject to meeting performance conditions:
BSC Bonus and ASAP – at its November 2016 meeting the Committee approved the Balanced Scorecard design for FY2017.•English law makes any definitive statements in this policy report binding on the Company for the duration of the policy, anddoes not permit any variation without shareholder approval. The Committee therefore does not believe that it is in shareholders’interests to state the design of the FY2017 BSC Bonus within this report. However, a summary of the measures and weightingsto be used has been made available on the Company’s website, but does not form part of this Remuneration Report. In theopinion of the Directors, the targets set for the performance measures are commercially sensitive or could, if made public,cause regulatory complications for the Company. As permitted by the Regulations, those targets are not being disclosedin advance but in line with our practice over many years there will be retrospective disclosure in the 2017 Annual Reportand Accounts.
LTIP – the performance measures and their weightings are set out in the policy table for Executive Directors on page 93.•LTIPs will vest in three equal tranches on the third, fourth and fifth anniversaries of the date of grant.
Directors’ remuneration in FY2016
Single total figures for Directors’ remuneration
Executive Directors
Ben Magara Simon Scott2 Ben Moolman3 Barrie van der Merwe1 Total–––––––––––––––––––––––––––––––––––––––––––––––––––––––––––––––––––––––––––––––– –––––––––––––––––––––––––––––––––––––––––––––––––––––––––––––––––––––––––––––––– –––––––––––––––––––––––––––––––––––––––––––––––––––––––––––––––––––––––––––––––– –––––––––––––––––––––––––––––––––––––––––––––––––––––––––––––––––––––––––––––––– ––––––––––––––––––––––––––––––––––––––––––––––––––––––––––––––––––––––––––––––––
Calculationnote(s) FY2015 FY2016 FY2015 FY2016 FY2015 FY2016 FY2015 FY2016 FY2015 FY2016
Fixed pay (£)
Salary & fees 462,150 462,150 334,650 209,156 49,937 175,234 – 72,132 846,737 918,672
Taxable benefits 4,8 25,178 27,543 25,304 17,585 4,211 20,643 – 9,050 54,693 74,821
Pension-related benefits 5 92,430 92,430 66,930 41,831 8,274 28,018 – 12,112 167,634 174,391
Sub-total 579,758 582,123 426,884 268,572 62,422 223,895 – 93,294 1,069,064 1,167,884
Performance-related pay (£) ****
Money / assets received or receivable for the year
Short-term incentives 6,11,12 – 348,849 – 238,636 – 125,325 – 63,582 – 776,392
Other incentives 7,8 – 8,631 43,015 11,551 – – – – – 20,182
Long-term incentives 9,10 – – – – – – – – – –
Sub-total – 357,480 43,015 250,187 125,325 63,582 – 796,574
Total 579,758 939,603 469,899 518,759 62,422 349,220 – 156,876 1,112,079 1,946,458
This table and the associated footnotes have been subject to audit by KPMG LLP.
www.lonmin.com
/ 91Lonmin PlcAnnual Report and Accounts 2016
01 /Strategic R
eport02 /
Governance
03 /Financial S
tatements
04 /A Deeper Look
05 /Shareholder Inform
ation
Directors’ remuneration in FY2016 (continued)
Executive Directors (continued)
Footnotes:1. FY2016 data for Mr van der Merwe is from 17 May 2016, on which date he was appointed an Executive Director, following the commencement of his
employment with the Company on 19 April 2016 Mr van der Merwe is paid in Rand (annual basic salary for FY2016 was R3,840,000, pro rata from17 May 2016 R1,439,999.92). His pro rata salary has been converted to £s using the monthly exchange rate (calculated using the daily exchange ratefrom the SAP currency table).
2. Simon Scott stepped down as an Executive Director and CFO on 16 May 2016, and continued in a transitional role until 30 September 2016, at whichpoint he ceased to be an employee of the Company. The data as to Simon Scott’s fixed pay given in the table above has been pro-rated and reflects onlythat part of FY2016 during which he served as a Director. However, during the transitional period he continued to receive his contractual salary and otherbenefits as normal, in accordance with the payment in lieu of notice provisions in his service contract. The total amounts he received during the financialyear were therefore £666,591.71, comprising salary and fees (£334,650), taxable benefits (£26,376.14), pension-related benefits (£66,930) and a shortterm incentive payment of £238,635.57. For further details, please refer to the Section 430(2B) Companies Act 2006 statement on the Company website.
3. FY2015 data for Mr. Moolman relates to the period from 25 June 2015, the date he was appointed as an Executive Director. Mr. Moolman is paid in Rand(annual basic salary for FY2015 was R3,696,000, pro rata from 25 June 2015 R985,600). The pro rata salary has been converted to £s using the monthlyexchange rate (calculated using the daily exchange rate from the SAP currency table).
4. ‘Taxable benefits’ is the gross value of all benefits, whether provided in cash or kind, that are (or would if provided in the UK, have been) chargeable to UKincome tax. These comprise the cash-settled car allowance, private medical insurance, (where the costs are borne by the employer) advice and supportin relation to cross-border tax and exchange control obligations and access to independent professional advice. No individual component of taxablebenefits paid in FY2016 is felt to create a significant cost.
As noted on page 97, the Company provides a contractual life assurance benefit of four times salary to each Executive Director. The Company no longerprovides this benefit to Simon Scott following his departure from the Company at the end of FY2016.
While contractual life assurance is a benefit, there is no liability to income tax in accordance with the exemption under s.307 Income Tax (Earnings andPensions) Act 2003 and has therefore not been included in the ‘taxable benefit’ calculation.
5. ‘Pension’ is shown as the amounts paid by the employer to defined contribution plans or salary supplement provided in lieu of such contributions.
6. Bonus is stated for the financial year in respect of which it is earned. Please see the section titled ‘BSC Bonus Plan’ below for details of the assessmentof the FY2016 bonus plan.
7. Mr Scott’s Special Award vested on 29 January 2016. It had been due to vest on 7 November 2015, but was deferred, as explained in the FY2015Directors’ Remuneration Report.
8. The second tranche of Mr. Magara’s Retention Award granted on 10 July 2013 vested on 29 January 2016 after having been deferred during FY2015.The third tranche vested as planned on 1 May 2016.
9. Please see the section titled ‘Directors’ shareholdings and share interests’ on page 97 for further details.
10. LTIPs granted in 2013 did not vest for Executive Directors as the performance conditions were not satisfied.
11. Mr Scott received a bonus in respect of FY2016 in accordance with the terms of his settlement agreement.
12. Annual bonuses for Ben Moolman and Barrie van der Merwe were paid in Rand but the amounts have been converted into Sterling for this table using theaverage exchange rate for the year in the case of Ben Moolman. Barrie van der Merwe’s annual bonus was calculated from the commencement of hisemployment and the average exchange rate for this period was used to convert his Rand denominated bonus.
Looking at each element of pay in more detail:
Base salary – base salaries for the Executive Directors in FY2016 were £462,150 for Ben Magara, £176,729.25 for Ben Moolman,£73,685.72 for Barrie van der Merwe and £209,156.25 for Simon Scott. As explained above, the figure for Simon Scott has beenpro-rated to reflect only the portion of the financial year during which he served as a Director, however he continued to be paid asnormal thereafter, resulting in a total amount of base salary during the year of £334,650.
Barrie van der Merwe’s salary was calculated from 17 May 2016, the date he was appointed an Executive Director, and has beenconverted from Rands into Sterling using the average monthly exchange rate from the SAP currency table, which is in turn populatedwith the various exchange rates carried in SAP from Reuters every evening. He had been an employee of the Company from 19 April2016. As explained above, Simon Scott stepped down as CFO on 16 May 2016 but thereafter remained employed in a transitionalrole until 30 September 2016. He was paid his salary and contractual entitlements during this period as normal. Given the Company’scircumstances at the time, the Committee chose not to offer any salary increases to any of the Executive Directors for FY2016.
As discussed in the letter from the Committee Chairman, the Committee awarded an annual salary increase of 5% to Ben Moolmanand Barrie van der Merwe for FY2017 (R3,880,800 and R4,032,000 respectively). This is in line with the next tier of managementand lower than that provided to unionised employees. It is also lower than CPI in South Africa at the end of the financial year (6.1%).Ben Magara was offered an increase of 2%, in part to recognise inflation since his salary was last changed. However, Ben Magaraopted to waive this increase.
Short-term incentives settled in cash: the BSC Bonus Plan – the Committee’s aim in FY2016 was to incentivise management byproviding targets that were meaningful and achievable, but challenging, in the new organisational context following the ongoingright-sizing of the Company, and also to achieve meaningful progress with the Group’s transformation programme.
Directors’ Remuneration Reportfor the year ended 30 September 2016
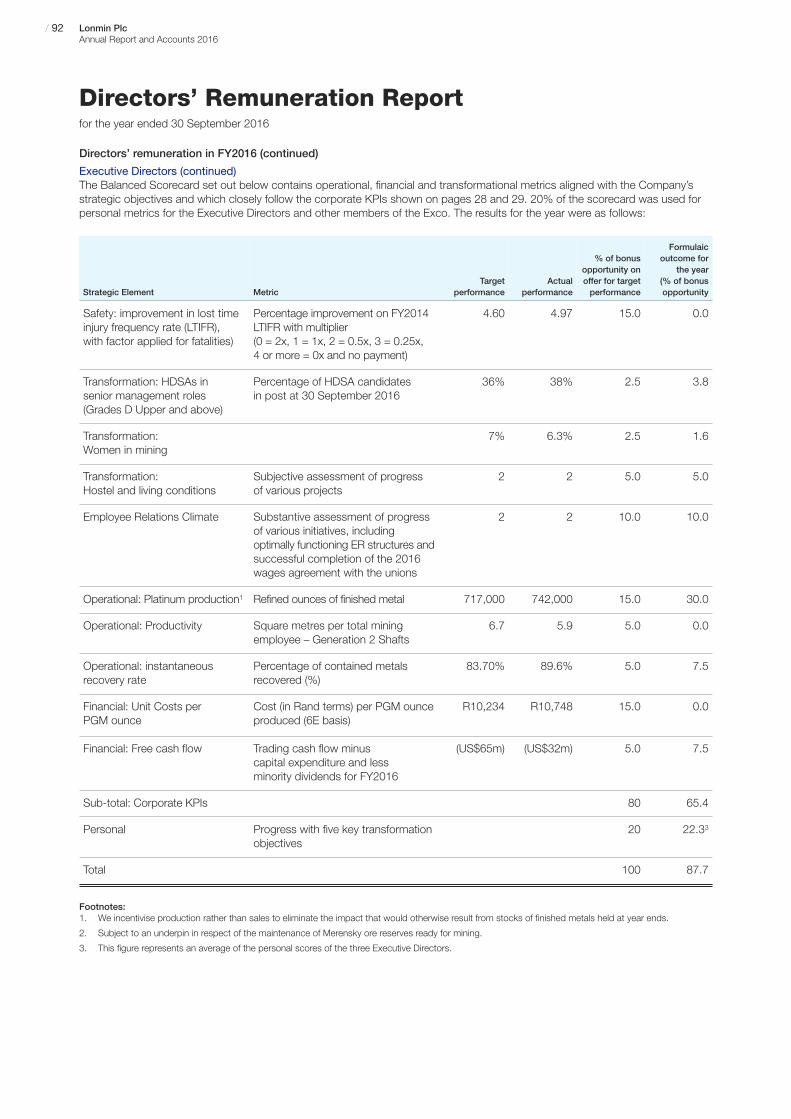
Directors’ Remuneration Reportfor the year ended 30 September 2016
/ 92 Lonmin PlcAnnual Report and Accounts 2016
Strategic Element MetricTarget
performanceActual
performance
% of bonusopportunity onoffer for targetperformance
Formulaicoutcome for
the year(% of bonusopportunity
Safety: improvement in lost timeinjury frequency rate (LTIFR),with factor applied for fatalities)
Percentage improvement on FY2014LTIFR with multiplier (0 = 2x, 1 = 1x, 2 = 0.5x, 3 = 0.25x, 4 or more = 0x and no payment)
4.60 4.97 15.0 0.0
Transformation: HDSAs in senior management roles (Grades D Upper and above)
Percentage of HDSA candidates in post at 30 September 2016
36% 38% 2.5 3.8
Transformation: Women in mining
7% 6.3% 2.5 1.6
Transformation: Hostel and living conditions
Subjective assessment of progressof various projects
2 2 5.0 5.0
Employee Relations Climate Substantive assessment of progressof various initiatives, includingoptimally functioning ER structures andsuccessful completion of the 2016wages agreement with the unions
2 2 10.0 10.0
Operational: Platinum production1 Refined ounces of finished metal 717,000 742,000 15.0 30.0
Operational: Productivity Square metres per total miningemployee – Generation 2 Shafts
6.7 5.9 5.0 0.0
Operational: instantaneousrecovery rate
Percentage of contained metalsrecovered (%)
83.70% 89.6% 5.0 7.5
Financial: Unit Costs perPGM ounce
Cost (in Rand terms) per PGM ounceproduced (6E basis)
R10,234 R10,748 15.0 0.0
Financial: Free cash flow Trading cash flow minus capital expenditure and less minority dividends for FY2016
(US$65m) (US$32m) 5.0 7.5
Sub-total: Corporate KPIs 80 65.4
Personal Progress with five key transformationobjectives
20 22.33
Total 100 87.7
Directors’ remuneration in FY2016 (continued)
Executive Directors (continued)The Balanced Scorecard set out below contains operational, financial and transformational metrics aligned with the Company’sstrategic objectives and which closely follow the corporate KPIs shown on pages 28 and 29. 20% of the scorecard was used forpersonal metrics for the Executive Directors and other members of the Exco. The results for the year were as follows:
Footnotes:1. We incentivise production rather than sales to eliminate the impact that would otherwise result from stocks of finished metals held at year ends.
2. Subject to an underpin in respect of the maintenance of Merensky ore reserves ready for mining.
3. This figure represents an average of the personal scores of the three Executive Directors.
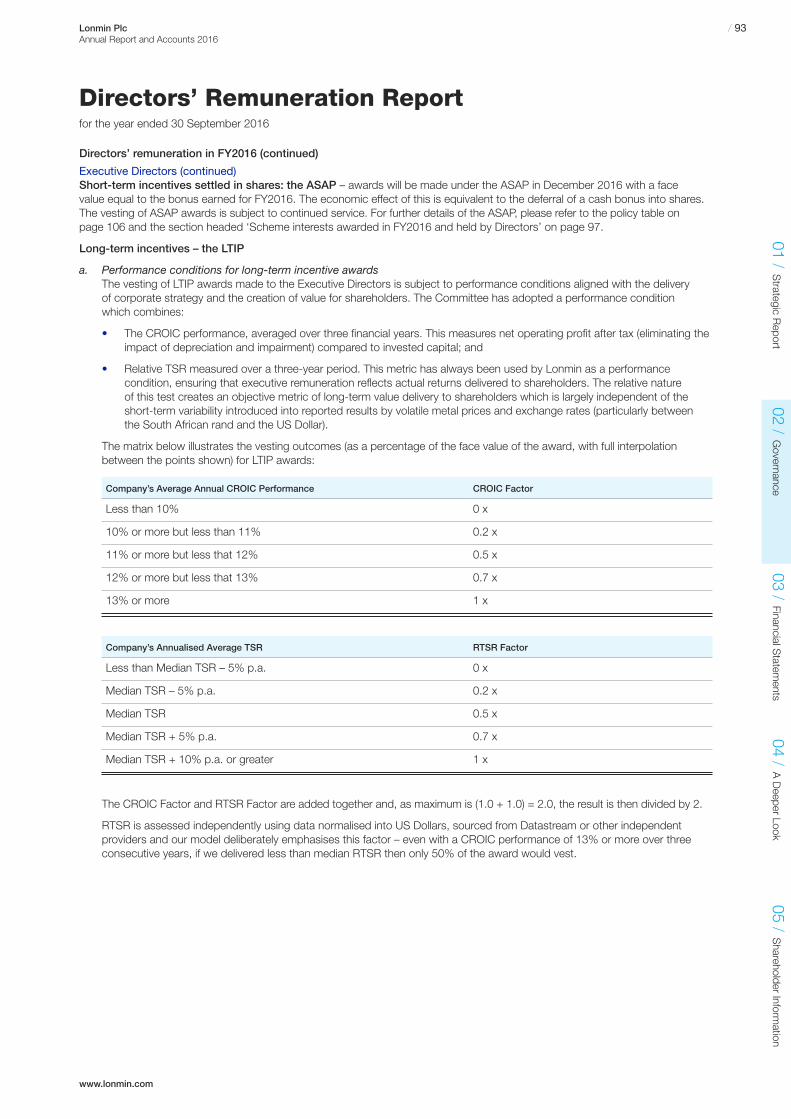
www.lonmin.com
/ 93Lonmin PlcAnnual Report and Accounts 2016
01 /Strategic R
eport02 /
Governance
03 /Financial S
tatements
04 /A Deeper Look
05 /Shareholder Inform
ation
Directors’ remuneration in FY2016 (continued)
Executive Directors (continued)Short-term incentives settled in shares: the ASAP – awards will be made under the ASAP in December 2016 with a facevalue equal to the bonus earned for FY2016. The economic effect of this is equivalent to the deferral of a cash bonus into shares.The vesting of ASAP awards is subject to continued service. For further details of the ASAP, please refer to the policy table onpage 106 and the section headed ‘Scheme interests awarded in FY2016 and held by Directors’ on page 97.
Long-term incentives – the LTIP
Performance conditions for long-term incentive awardsa.The vesting of LTIP awards made to the Executive Directors is subject to performance conditions aligned with the deliveryof corporate strategy and the creation of value for shareholders. The Committee has adopted a performance conditionwhich combines:
The CROIC performance, averaged over three financial years. This measures net operating profit after tax (eliminating the•impact of depreciation and impairment) compared to invested capital; and
Relative TSR measured over a three-year period. This metric has always been used by Lonmin as a performance•condition, ensuring that executive remuneration reflects actual returns delivered to shareholders. The relative natureof this test creates an objective metric of long-term value delivery to shareholders which is largely independent of theshort-term variability introduced into reported results by volatile metal prices and exchange rates (particularly betweenthe South African rand and the US Dollar).
The matrix below illustrates the vesting outcomes (as a percentage of the face value of the award, with full interpolationbetween the points shown) for LTIP awards:
The CROIC Factor and RTSR Factor are added together and, as maximum is (1.0 + 1.0) = 2.0, the result is then divided by 2.
RTSR is assessed independently using data normalised into US Dollars, sourced from Datastream or other independentproviders and our model deliberately emphasises this factor – even with a CROIC performance of 13% or more over threeconsecutive years, if we delivered less than median RTSR then only 50% of the award would vest.
Directors’ Remuneration Reportfor the year ended 30 September 2016
Company’s Average Annual CROIC Performance CROIC Factor
Less than 10% 0 x
10% or more but less than 11% 0.2 x
11% or more but less that 12% 0.5 x
12% or more but less that 13% 0.7 x
13% or more 1 x
Company’s Annualised Average TSR RTSR Factor
Less than Median TSR – 5% p.a. 0 x
Median TSR – 5% p.a. 0.2 x
Median TSR 0.5 x
Median TSR + 5% p.a. 0.7 x
Median TSR + 10% p.a. or greater 1 x

Directors’ Remuneration Reportfor the year ended 30 September 2016
/ 94 Lonmin PlcAnnual Report and Accounts 2016
Directors’ remuneration in FY2016 (continued)
Executive Directors (continued)It is important that the comparator group comprises relevant peer companies. From 2010 onwards, we have used a comparatorgroup of listed primary PGM producers. In 2013 the Committee decided that Stillwater Mining Company was no longer a directlycomparable business as its operations are in the USA (and so it operates in a different socio-economic environment), it is apalladium-dominated business and had recently acquired base metal assets. As a result Royal Bafokeng Platinum, a JSE-listedSouth African platinum producer, replaced Stillwater in the comparator group used from 2013 onwards. As a result, we nowcompare ourselves to a group of ‘pure-play’ PGM mining peers, all whom operate principally in South Africa:
Awards made in 2010, 2011 and 2012 Awards made in 2013 and 2014
• Aquarius Platinum • Aquarius Platinum
• Anglo American Platinum • Anglo American Platinum
• Impala Platinum • Impala Platinum
• Northam Platinum • Northam Platinum
• Stillwater Mining Company • Royal Bafokeng Platinum
Small peer groups of similar businesses can lead to perverse outcomes where results are tightly clustered. If a ranking approachis used, small differences in RTSR can lead to large differences in rank. To avoid this risk, we compare Lonmin’s TSR performanceto the median of the group and calculate our relative performance, expressed as a percentage per annum differential.
Other earnings of Executive Directorsb.There are no paid external appointments held by any of the Executive Directors.
Awards in FY2016c.The second tranche of Ben Magara’s Recruitment Award was due to vest on 31 May 2015, but was deferred. This vested on29 January 2016, and the third tranche vested as planned on 31 May 2016.
In addition, Simon Scott’s Special Award, which was due to vest on 7 November 2015 but had been deferred as theCompany was in a close period, vested on 29 January 2016.
Non-executive DirectorsOur Non-executive Directors are currently paid at levels we believe to be market median for a comparable London-listed company,while reflecting the international travel commitment expected. The basis of the fees is stated below and is essentially a base feeplus additional fees for Committee service or Chairmanship. The fees of Non-executive Directors were reduced with the adoptionof the new policy at the Company’s AGM in January 2015.
Basis of the fees for each Non-executive Director under the existing remuneration policyThe basis of the fees is essentially a base fee plus additional fees for Committee service and chairmanship of a Committee.
Fee payable to DirectorsAny additional fees payable for any other dutiesto the Company
Other items in the nature of remuneration
Non-executive Directors (other than theChairman) are offered a base fee of £55,000per annum for acting as a Director and servingas a member of up to two Board Committees,save where they were nominated to theBoard by their employing companies.
The Chairman is offered a fee of £210,000 per annum for acting as a Director, serving as a member of up to two Board Committeesand chairing the Board.
Fees to independent directors are payable incash upfront for the first year of appointment,reflecting the commitment necessary toundertake a full induction programmeincluding site and other visits and in depthresearch. Thereafter fees are paid in cashmonthly in arrears.
Where the individuals serving as Non-executiveDirectors are employed by a third party,then the Company may instead be invoicedquarterly for a sum equal to the fees thatwould otherwise have been payable, to besettled in cash.
The Senior Independent Director receives a fee of £10,000 per annum, in addition to hisbase fee.
Where individuals chair a Board Committee, they receive a fee of £10,000 per annum, inaddition to their base fee for each committeethat they chair.
Where individuals serve on more than two Board Committees, a fee of £5,000 per annum is offered for each additional Committee.
Where the Company holds Board and / orCommittee meetings in addition to thosescheduled, a fee of £2,000 per day is payable to every Non-executive Director for additionalmeeting attendance.
Where the individual provides additionalservices to the Company or Group companiesoutside the scope of their directorship,then the Company and / or the relevantgroup company may pay additional feescommensurate with the value of the servicesprovided by the individual.
No other items in the nature of remuneration are providedby the Company to its Non-executive Directors.
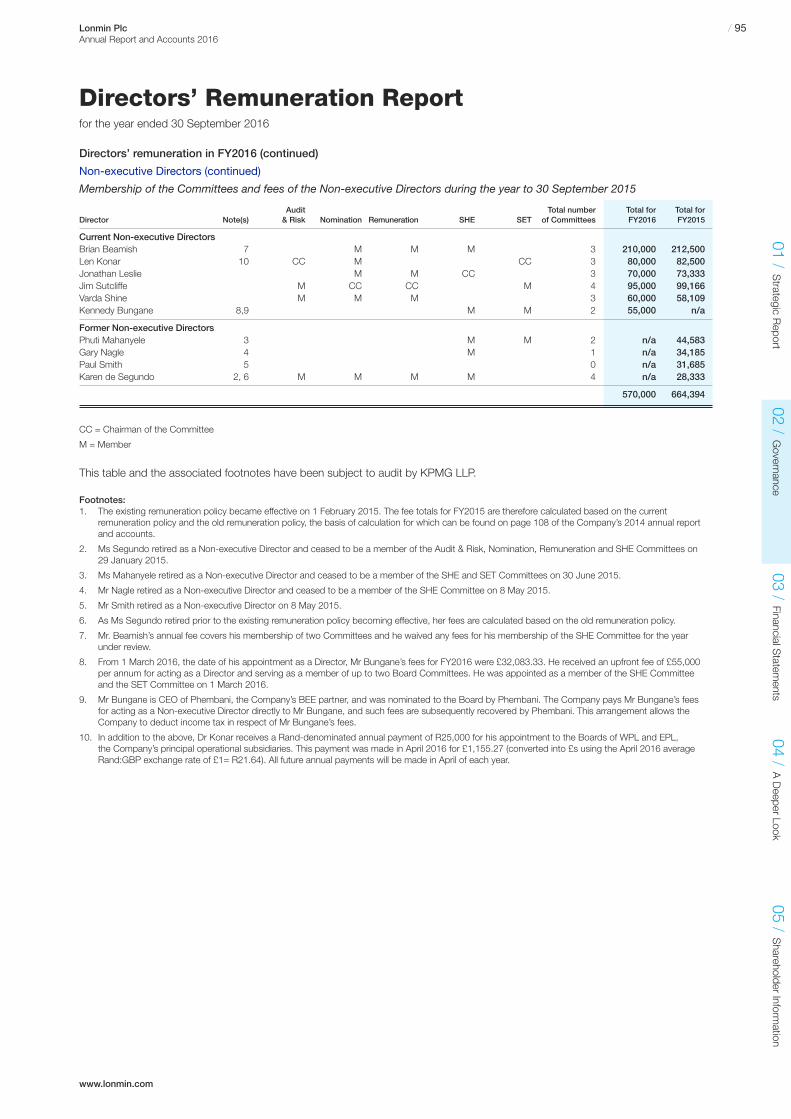
www.lonmin.com
/ 95Lonmin PlcAnnual Report and Accounts 2016
01 /Strategic R
eport02 /
Governance
03 /Financial S
tatements
04 /A Deeper Look
05 /Shareholder Inform
ation
Directors’ remuneration in FY2016 (continued)
Non-executive Directors (continued)
Membership of the Committees and fees of the Non-executive Directors during the year to 30 September 2015
Audit Total number Total for Total forDirector Note(s) & Risk Nomination Remuneration SHE SET of Committees FY2016 FY2015
Current Non-executive DirectorsBrian Beamish 7 M M M 3 210,000 212,500Len Konar 10 CC M CC 3 80,000 82,500Jonathan Leslie M M CC 3 70,000 73,333Jim Sutcliffe M CC CC M 4 95,000 99,166Varda Shine M M M 3 60,000 58,109Kennedy Bungane 8,9 M M 2 55,000 n/a
Former Non-executive DirectorsPhuti Mahanyele 3 M M 2 n/a 44,583Gary Nagle 4 M 1 n/a 34,185Paul Smith 5 0 n/a 31,685Karen de Segundo 2, 6 M M M M 4 n/a 28,333
570,000 664,394
CC = Chairman of the Committee
M = Member
This table and the associated footnotes have been subject to audit by KPMG LLP.
Footnotes:1. The existing remuneration policy became effective on 1 February 2015. The fee totals for FY2015 are therefore calculated based on the current
remuneration policy and the old remuneration policy, the basis of calculation for which can be found on page 108 of the Company’s 2014 annual reportand accounts.
2. Ms Segundo retired as a Non-executive Director and ceased to be a member of the Audit & Risk, Nomination, Remuneration and SHE Committees on29 January 2015.
3. Ms Mahanyele retired as a Non-executive Director and ceased to be a member of the SHE and SET Committees on 30 June 2015.
4. Mr Nagle retired as a Non-executive Director and ceased to be a member of the SHE Committee on 8 May 2015.
5. Mr Smith retired as a Non-executive Director on 8 May 2015.
6. As Ms Segundo retired prior to the existing remuneration policy becoming effective, her fees are calculated based on the old remuneration policy.
7. Mr. Beamish’s annual fee covers his membership of two Committees and he waived any fees for his membership of the SHE Committee for the yearunder review.
8. From 1 March 2016, the date of his appointment as a Director, Mr Bungane’s fees for FY2016 were £32,083.33. He received an upfront fee of £55,000per annum for acting as a Director and serving as a member of up to two Board Committees. He was appointed as a member of the SHE Committeeand the SET Committee on 1 March 2016.
9. Mr Bungane is CEO of Phembani, the Company’s BEE partner, and was nominated to the Board by Phembani. The Company pays Mr Bungane’s feesfor acting as a Non-executive Director directly to Mr Bungane, and such fees are subsequently recovered by Phembani. This arrangement allows theCompany to deduct income tax in respect of Mr Bungane’s fees.
10. In addition to the above, Dr Konar receives a Rand-denominated annual payment of R25,000 for his appointment to the Boards of WPL and EPL, the Company’s principal operational subsidiaries. This payment was made in April 2016 for £1,155.27 (converted into £s using the April 2016 averageRand:GBP exchange rate of £1= R21.64). All future annual payments will be made in April of each year.
Directors’ Remuneration Reportfor the year ended 30 September 2016
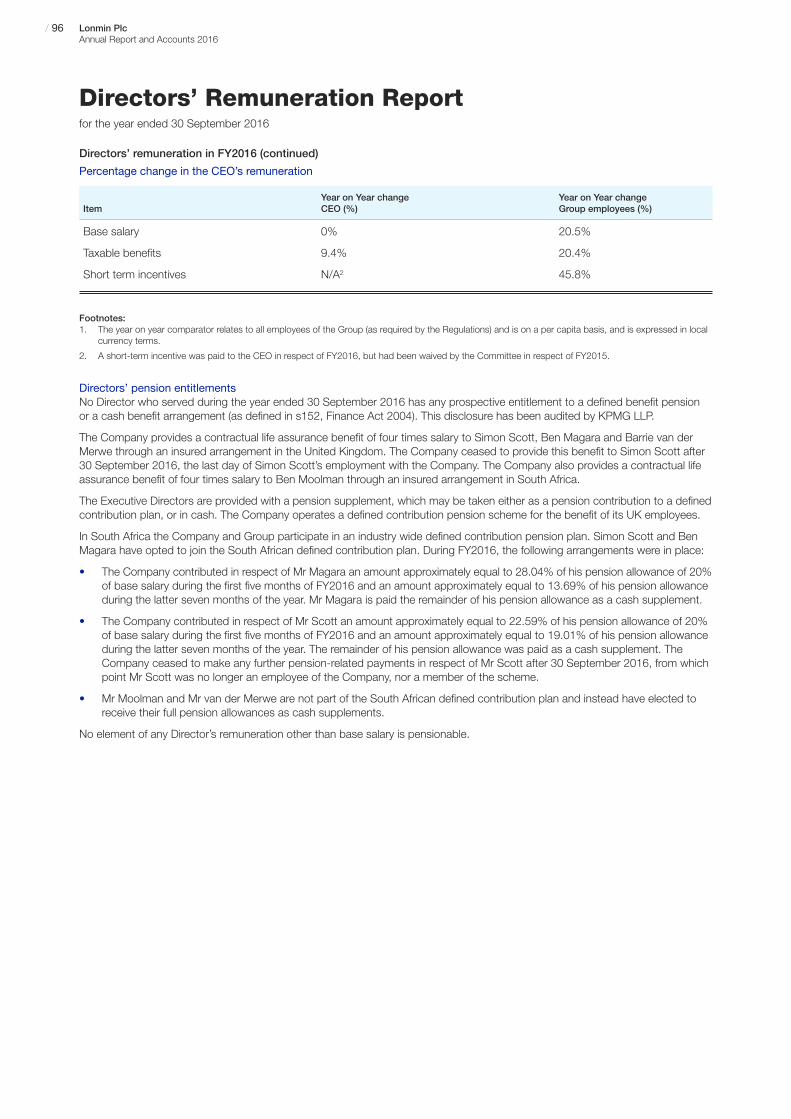
Directors’ Remuneration Reportfor the year ended 30 September 2016
/ 96 Lonmin PlcAnnual Report and Accounts 2016
ItemYear on Year changeCEO (%)
Year on Year change Group employees (%)
Base salary
Taxable benefits
Short term incentives
0%
9.4%
N/A2
20.5%
20.4%
45.8%
Directors’ remuneration in FY2016 (continued)
Percentage change in the CEO’s remuneration
Footnotes:1. The year on year comparator relates to all employees of the Group (as required by the Regulations) and is on a per capita basis, and is expressed in local
currency terms.
2. A short-term incentive was paid to the CEO in respect of FY2016, but had been waived by the Committee in respect of FY2015.
Directors’ pension entitlementsNo Director who served during the year ended 30 September 2016 has any prospective entitlement to a defined benefit pensionor a cash benefit arrangement (as defined in s152, Finance Act 2004). This disclosure has been audited by KPMG LLP.
The Company provides a contractual life assurance benefit of four times salary to Simon Scott, Ben Magara and Barrie van derMerwe through an insured arrangement in the United Kingdom. The Company ceased to provide this benefit to Simon Scott after30 September 2016, the last day of Simon Scott’s employment with the Company. The Company also provides a contractual lifeassurance benefit of four times salary to Ben Moolman through an insured arrangement in South Africa.
The Executive Directors are provided with a pension supplement, which may be taken either as a pension contribution to a definedcontribution plan, or in cash. The Company operates a defined contribution pension scheme for the benefit of its UK employees.
In South Africa the Company and Group participate in an industry wide defined contribution pension plan. Simon Scott and BenMagara have opted to join the South African defined contribution plan. During FY2016, the following arrangements were in place:
The Company contributed in respect of Mr Magara an amount approximately equal to 28.04% of his pension allowance of 20%•of base salary during the first five months of FY2016 and an amount approximately equal to 13.69% of his pension allowanceduring the latter seven months of the year. Mr Magara is paid the remainder of his pension allowance as a cash supplement.
The Company contributed in respect of Mr Scott an amount approximately equal to 22.59% of his pension allowance of 20%•of base salary during the first five months of FY2016 and an amount approximately equal to 19.01% of his pension allowanceduring the latter seven months of the year. The remainder of his pension allowance was paid as a cash supplement. TheCompany ceased to make any further pension-related payments in respect of Mr Scott after 30 September 2016, from whichpoint Mr Scott was no longer an employee of the Company, nor a member of the scheme.
Mr Moolman and Mr van der Merwe are not part of the South African defined contribution plan and instead have elected to•receive their full pension allowances as cash supplements.
No element of any Director’s remuneration other than base salary is pensionable.
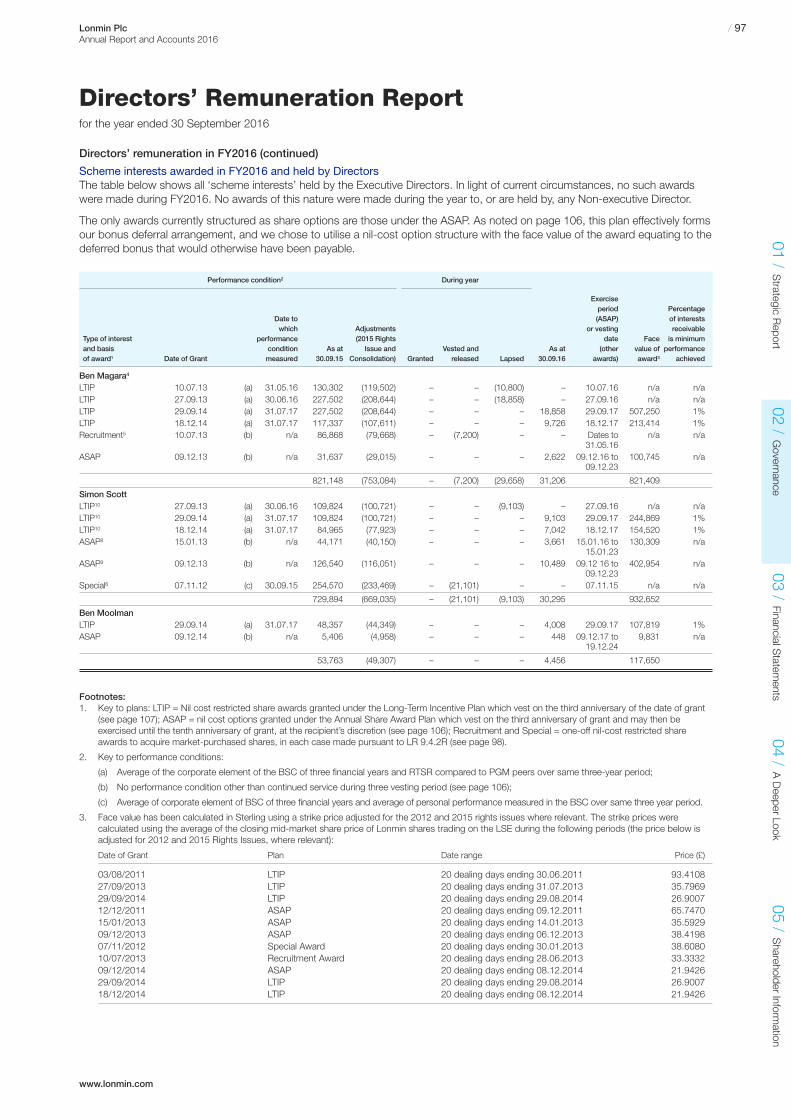
www.lonmin.com
/ 97Lonmin PlcAnnual Report and Accounts 2016
01 /Strategic R
eport02 /
Governance
03 /Financial S
tatements
04 /A Deeper Look
05 /Shareholder Inform
ation
Directors’ remuneration in FY2016 (continued)
Scheme interests awarded in FY2016 and held by Directors The table below shows all ‘scheme interests’ held by the Executive Directors. In light of current circumstances, no such awardswere made during FY2016. No awards of this nature were made during the year to, or are held by, any Non-executive Director.
The only awards currently structured as share options are those under the ASAP. As noted on page 106, this plan effectively formsour bonus deferral arrangement, and we chose to utilise a nil-cost option structure with the face value of the award equating to thedeferred bonus that would otherwise have been payable.
Performance condition2 During year
Exerciseperiod Percentage
Date to (ASAP) of interestswhich Adjustments or vesting receivable
Type of interest performance (2015 Rights date Face is minimumand basis condition As at Issue and Vested and As at (other value of performanceof award1 Date of Grant measured 30.09.15 Consolidation) Granted released Lapsed 30.09.16 awards) award3 achieved
Ben Magara4
LTIP 10.07.13 (a) 31.05.16 130,302 (119,502) – – (10,800) – 10.07.16 n/a n/aLTIP 27.09.13 (a) 30.06.16 227,502 (208,644) – – (18,858) – 27.09.16 n/a n/aLTIP 29.09.14 (a) 31.07.17 227,502 (208,644) – – – 18,858 29.09.17 507,250 1%LTIP 18.12.14 (a) 31.07.17 117,337 (107,611) – – – 9,726 18.12.17 213,414 1%Recruitment5 10.07.13 (b) n/a 86,868 (79,668) – (7,200) – – Dates to n/a n/a
31.05.16ASAP 09.12.13 (b) n/a 31,637 (29,015) – – – 2,622 09.12.16 to 100,745 n/a
09.12.23
821,148 (753,084) – (7,200) (29,658) 31,206 821,409
Simon ScottLTIP10 27.09.13 (a) 30.06.16 109,824 (100,721) – – (9,103) – 27.09.16 n/a n/aLTIP10 29.09.14 (a) 31.07.17 109,824 (100,721) – – – 9,103 29.09.17 244,869 1%LTIP10 18.12.14 (a) 31.07.17 84,965 (77,923) – – – 7,042 18.12.17 154,520 1%ASAP8 15.01.13 (b) n/a 44,171 (40,150) – – – 3,661 15.01.16 to 130,309 n/a
15.01.23ASAP9 09.12.13 (b) n/a 126,540 (116,051) – – – 10,489 09.12 16 to 402,954 n/a
09.12.23Special6 07.11.12 (c) 30.09.15 254,570 (233,469) – (21,101) – – 07.11.15 n/a n/a
729,894 (669,035) – (21,101) (9,103) 30,295 932,652
Ben MoolmanLTIP 29.09.14 (a) 31.07.17 48,357 (44,349) – – – 4,008 29.09.17 107,819 1%ASAP 09.12.14 (b) n/a 5,406 (4,958) – – – 448 09.12.17 to 9,831 n/a
19.12.24
53,763 (49,307) – – – 4,456 117,650
Footnotes:1. Key to plans: LTIP = Nil cost restricted share awards granted under the Long-Term Incentive Plan which vest on the third anniversary of the date of grant
(see page 107); ASAP = nil cost options granted under the Annual Share Award Plan which vest on the third anniversary of grant and may then beexercised until the tenth anniversary of grant, at the recipient’s discretion (see page 106); Recruitment and Special = one-off nil-cost restricted shareawards to acquire market-purchased shares, in each case made pursuant to LR 9.4.2R (see page 98).
2. Key to performance conditions:
(a) Average of the corporate element of the BSC of three financial years and RTSR compared to PGM peers over same three-year period;
(b) No performance condition other than continued service during three vesting period (see page 106);
(c) Average of corporate element of BSC of three financial years and average of personal performance measured in the BSC over same three year period.
3. Face value has been calculated in Sterling using a strike price adjusted for the 2012 and 2015 rights issues where relevant. The strike prices werecalculated using the average of the closing mid-market share price of Lonmin shares trading on the LSE during the following periods (the price below isadjusted for 2012 and 2015 Rights Issues, where relevant):
Date of Grant Plan Date range Price (£)
03/08/2011 LTIP 20 dealing days ending 30.06.2011 93.410827/09/2013 LTIP 20 dealing days ending 31.07.2013 35.796929/09/2014 LTIP 20 dealing days ending 29.08.2014 26.900712/12/2011 ASAP 20 dealing days ending 09.12.2011 65.747015/01/2013 ASAP 20 dealing days ending 14.01.2013 35.592909/12/2013 ASAP 20 dealing days ending 06.12.2013 38.419807/11/2012 Special Award 20 dealing days ending 30.01.2013 38.608010/07/2013 Recruitment Award 20 dealing days ending 28.06.2013 33.333209/12/2014 ASAP 20 dealing days ending 08.12.2014 21.942629/09/2014 LTIP 20 dealing days ending 29.08.2014 26.900718/12/2014 LTIP 20 dealing days ending 08.12.2014 21.9426
Directors’ Remuneration Reportfor the year ended 30 September 2016

Directors’ Remuneration Reportfor the year ended 30 September 2016
/ 98 Lonmin PlcAnnual Report and Accounts 2016
Directors’ remuneration in FY2016 (continued)
Scheme interests awarded in FY2016 and held by Directors (continued)4. Mr Magara was appointed as a Director from 1 July 2013.
5. Mr Magara’s Recruitment Award is subject to vesting in three equal tranches on 31.05.14, 31.05.15 and 31.05.16. The total face value of the award wasoriginally £359,998 and the first tranche (being £43,434) vested on 31.05.14. The award was adjusted to 7,200 shares to reflect the 2015 Rights Issueand subsequent consolidation. The second tranche of 3,600 shares was due to vest on 31 May 2015 but was deferred. This second tranche vested on29 January 2016, and the third tranche vested as intended on 31 May 2016.
6. Mr Scott’s Special Award was made partly in lieu of an LTIP award, and in recognition of the exceptional circumstances of 2012. Whilst the Special Awardwas due to vest on 07.11.15, this was deferred as the Company was in a close period during this time. This award vested on 29 January 2016.
7. Subject to the Remuneration Committee’s discretion, dividend equivalents may be payable when LTIP awards vest. Neither dividends nor dividendequivalents are payable in respect of ASAP options.
8. The Committee has exercised its discretion under the ASAP rules to determine that Simon Scott’s vested ASAP option over 3,661 shares shall continueto be exercisable.
9. The Committee has exercised its discretion under the ASAP rules to determine that Simon Scott’s unvested ASAP option over 10,489 shares may beexercised in full from the normal vesting date of such ASAP option, provided that each option much be exercised within the later six months from the laterof 30 September 2016 or the normal vesting date.
10. The Committee has exercised its discretion under the LTIP rules to determine that Simon Scott’s outstanding LTIP awards will continue until their normalvesting dates and shall remain subject to the performance conditions attached to such LTIP awards. Further, the number of shares subject to each LTIPaward which may vest shall be reduced by reference to the proportion of the vesting period during which Simon Scott was no longer employed by the group.
All Directors are required to build and maintain a personal investment in Lonmin shares, linked to their base salary or fee – for theCEO 300% of base salary, for other Executive Directors 200% of base salary and for Non-executive Directors 100% of their basefee. This should be achieved within five years of the later of (a) the policy coming into effect (on 1 February 2015) or (b) takingoffice. Once this has been achieved, should the market value fall below the required level the compliance must be re-achievedwithin three years.
As show in the table below, the decline in the Company’s share price has impacted the value of the Directors’ shareholdings. Whilstthe Directors remain committed to meet this obligation, demonstrated by the fact that all Directors who had shares prior to the 2015rights issue took up their rights in full, the Committee has agreed to refresh the timeframe for compliance, giving each director untilthe later of five years from the completion of the Rights Issue (ie by 10 December 2020) or from their date of appointment.
Using the Company’s closing share price of 200.5p on 30 September 2016 (save as noted below), the serving Directors’compliance with these obligations was as follows:
Achievement at30 September
Obligation Last date at Obligation to be (or earlier dateDirector (multiple of salary / NED base fee) which obligation met met on or before of retirement
Current DirectorsBrian Beamish 100% – 10 December 2020 13.5%Len Konar 100% 31 January 2013 10 December 2020 24.3%Jonathan Leslie 100% 18 February 2013 10 December 2020 24.9%Jim Sutcliffe 100% 06 March 2014 10 December 2020 28.6%Varda Shine 100% – 10 December 2020 0%Ben Magara 300% – 10 December 2020 4.7%Ben Moolman 200% – 10 December 2020 4.9%
Barrie van der Merwe 200% – 17 May 2021 0%
Former DirectorsSimon Scott1 200% – 27 September 2015 1.5
This table and associated footnotes have been subject to audit by KPMG LLP.
Footnote:1. Position stated as at 16 May 2016, date of retirement from the Board when the shares closed at 195p.
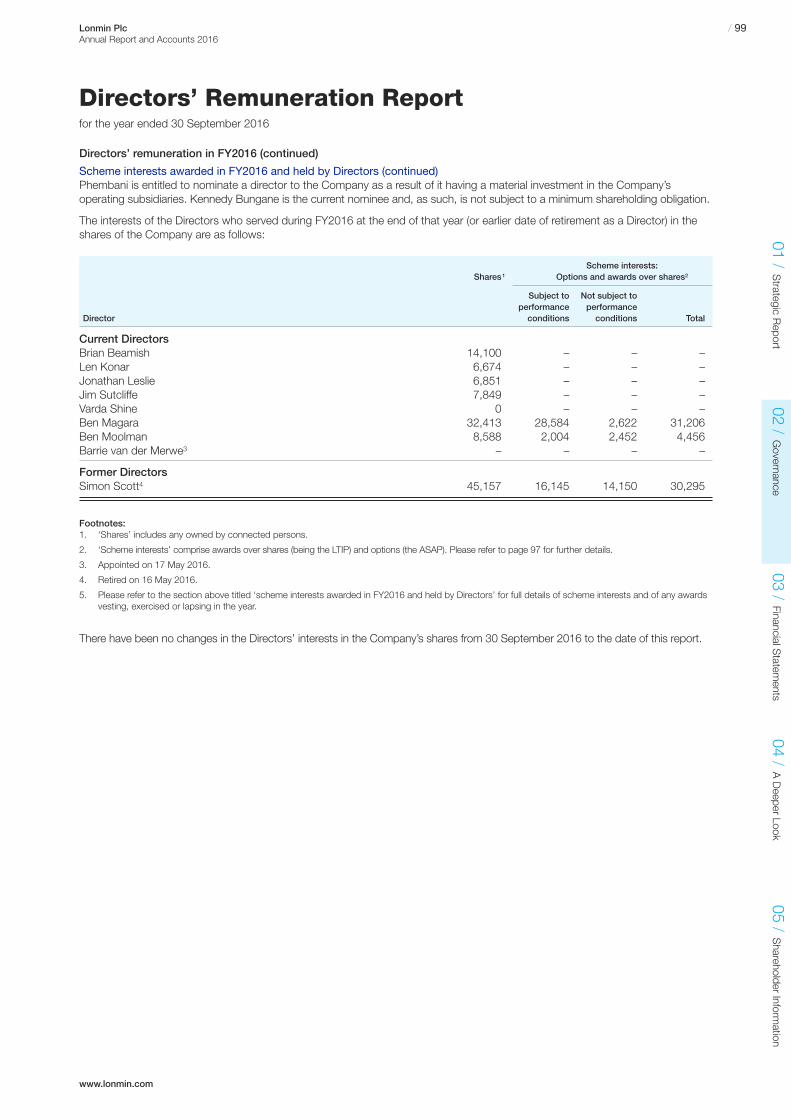
www.lonmin.com
/ 99Lonmin PlcAnnual Report and Accounts 2016
01 /Strategic R
eport02 /
Governance
03 /Financial S
tatements
04 /A Deeper Look
05 /Shareholder Inform
ation
Directors’ remuneration in FY2016 (continued)
Scheme interests awarded in FY2016 and held by Directors (continued)Phembani is entitled to nominate a director to the Company as a result of it having a material investment in the Company’soperating subsidiaries. Kennedy Bungane is the current nominee and, as such, is not subject to a minimum shareholding obligation.
The interests of the Directors who served during FY2016 at the end of that year (or earlier date of retirement as a Director) in theshares of the Company are as follows:
Scheme interests:Shares1 Options and awards over shares2
Subject to Not subject toperformance performance
Director conditions conditions Total
Current DirectorsBrian Beamish 14,100 – – –Len Konar 6,674 – – –Jonathan Leslie 6,851 – – –Jim Sutcliffe 7,849 – – –Varda Shine 0 – – –Ben Magara 32,413 28,584 2,622 31,206Ben Moolman 8,588 2,004 2,452 4,456Barrie van der Merwe3 – – – –
Former DirectorsSimon Scott4 45,157 16,145 14,150 30,295
Footnotes:1. ‘Shares’ includes any owned by connected persons.
2. ‘Scheme interests’ comprise awards over shares (being the LTIP) and options (the ASAP). Please refer to page 97 for further details.
3. Appointed on 17 May 2016.
4. Retired on 16 May 2016.
5. Please refer to the section above titled ‘scheme interests awarded in FY2016 and held by Directors’ for full details of scheme interests and of any awardsvesting, exercised or lapsing in the year.
There have been no changes in the Directors’ interests in the Company’s shares from 30 September 2016 to the date of this report.
Directors’ Remuneration Reportfor the year ended 30 September 2016

Directors’ Remuneration Reportfor the year ended 30 September 2016
/ 100 Lonmin PlcAnnual Report and Accounts 2016
Other required disclosures
Service contractsAs noted on page 110, no Executive Director has a service contact with a notice period in excess of one year, or which requirescompensation on termination exceeding the value of one year’s salary and contractual benefits. All service contracts are draftedon an evergreen, rather than fixed term, basis, so the unexpired term would always equal the notice period.
Payments to former DirectorsIn FY2016, the Company incurred costs in relation to two former Directors, Ian Farmer and Simon Scott. Mr Farmer resigned as aDirector and CEO of the Company in December 2012 but remains an employee of the Company on disability leave with no duties.As such, he continues to participate in the Company’s life assurance and private medical insurance arrangements in the same wayas any other employee.
Mr. Scott stepped down as an Executive Director and CFO on 16 May 2016 but remained in a transitional role until 30 September2016, following which he ceased to be an employee of the Company. During the transitional period he received his salary andcontractual benefits from the Company as normal. Mr Barrie van der Merwe was appointed as an Executive Director and CFO on 17 May 2016.
No other payments of money or other assets were made during FY2016 to any former Director of the Company. This disclosurehas been audited by KPMG LLP.
Payments for loss of officeThere were no payments in relation to loss of office during FY2016. This disclosure has been audited by KPMG LLP.
Voting on remuneration mattersAt the AGM on 28 January 2016 shareholders passed the annual advisory vote on the Directors’ Remuneration Report. The votingresults were:
Votes for (and Votes against (and Proportion of Shares on whichResolution percentage of votes cast) percentage of votes cast) share capital voting votes were withheld
Remuneration report 156,893,468 83.74 30,457,804 16.26% 66.43% 3,024,359
The Committee has reviewed the voting results and, while it did not believe that a significant percentage of votes were cast againstthe resolution, it noted that the new performance condition for the LTIP had previously been discussed in principle with investorsand a small number of investors had expressed concern that a portion of the LTIP could vest in circumstances where the TSR wasbelow median performance relative the Company’s peers.
The Committee acknowledges these concerns and notes that the potential reward for performance below median TSR did not in fact represent a change in policy. As detailed on page 107 of the 2014 Annual Report and Accounts, performance of medianless 5% resulted in a factor of 0.5x. Under the new performance condition, as detailed in the policy section of this report, this factoris 0.2x and the formula now adds the two factors (RTSR + CROIC) rather than multiplying them as before (RTSR x 3-year BSC).Although there may be a positive effect on the potential reward, the Committee’s view is that the CROIC measure which replacesthe BSC measure is more challenging, measurable and transparent relative to the BSC.
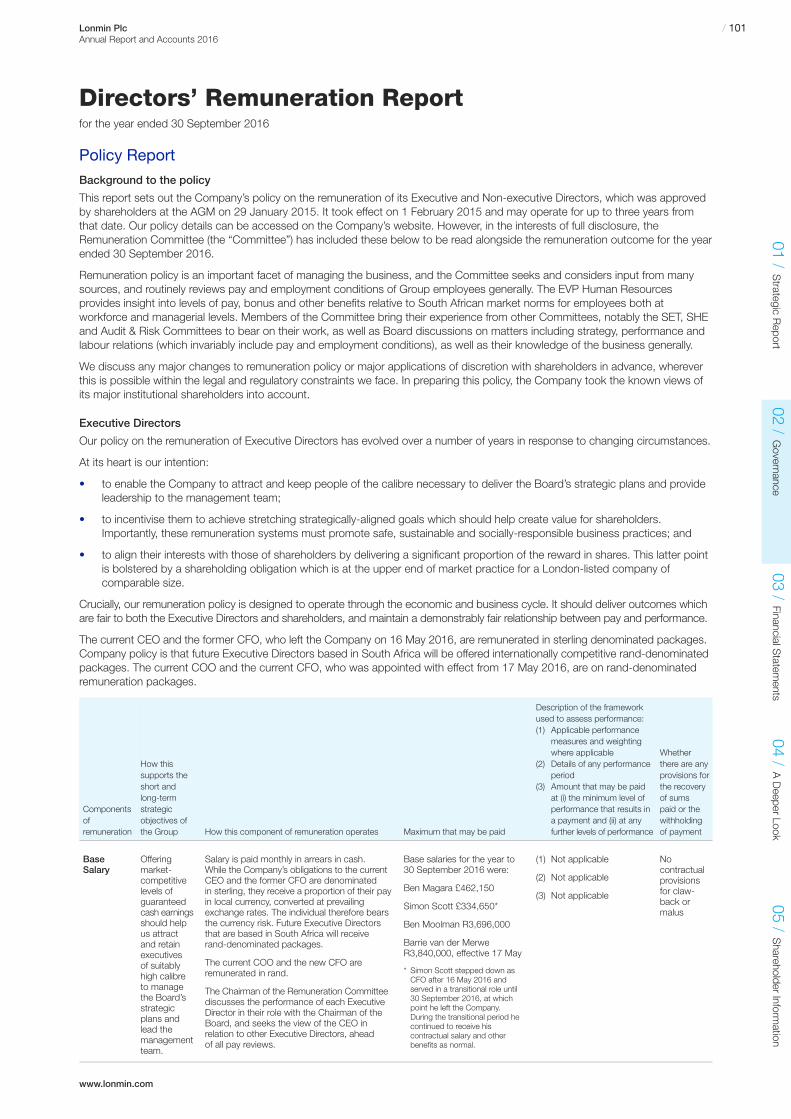
www.lonmin.com
/ 101Lonmin PlcAnnual Report and Accounts 2016
01 /Strategic R
eport02 /
Governance
03 /Financial S
tatements
04 /A Deeper Look
05 /Shareholder Inform
ation
Directors’ Remuneration Reportfor the year ended 30 September 2016
Policy Report
Background to the policy
This report sets out the Company’s policy on the remuneration of its Executive and Non-executive Directors, which was approvedby shareholders at the AGM on 29 January 2015. It took effect on 1 February 2015 and may operate for up to three years fromthat date. Our policy details can be accessed on the Company’s website. However, in the interests of full disclosure, theRemuneration Committee (the “Committee”) has included these below to be read alongside the remuneration outcome for the yearended 30 September 2016.
Remuneration policy is an important facet of managing the business, and the Committee seeks and considers input from manysources, and routinely reviews pay and employment conditions of Group employees generally. The EVP Human Resourcesprovides insight into levels of pay, bonus and other benefits relative to South African market norms for employees both atworkforce and managerial levels. Members of the Committee bring their experience from other Committees, notably the SET, SHEand Audit & Risk Committees to bear on their work, as well as Board discussions on matters including strategy, performance andlabour relations (which invariably include pay and employment conditions), as well as their knowledge of the business generally.
We discuss any major changes to remuneration policy or major applications of discretion with shareholders in advance, whereverthis is possible within the legal and regulatory constraints we face. In preparing this policy, the Company took the known views ofits major institutional shareholders into account.
Executive Directors
Our policy on the remuneration of Executive Directors has evolved over a number of years in response to changing circumstances.
At its heart is our intention:
to enable the Company to attract and keep people of the calibre necessary to deliver the Board’s strategic plans and provide•leadership to the management team;
to incentivise them to achieve stretching strategically-aligned goals which should help create value for shareholders.•Importantly, these remuneration systems must promote safe, sustainable and socially-responsible business practices; and
to align their interests with those of shareholders by delivering a significant proportion of the reward in shares. This latter point•is bolstered by a shareholding obligation which is at the upper end of market practice for a London-listed company ofcomparable size.
Crucially, our remuneration policy is designed to operate through the economic and business cycle. It should deliver outcomes whichare fair to both the Executive Directors and shareholders, and maintain a demonstrably fair relationship between pay and performance.
The current CEO and the former CFO, who left the Company on 16 May 2016, are remunerated in sterling denominated packages.Company policy is that future Executive Directors based in South Africa will be offered internationally competitive rand-denominatedpackages. The current COO and the current CFO, who was appointed with effect from 17 May 2016, are on rand-denominatedremuneration packages.
Componentsofremuneration
How thissupports theshort andlong-termstrategicobjectives ofthe Group How this component of remuneration operates Maximum that may be paid
Description of the frameworkused to assess performance:(1) Applicable performance
measures and weightingwhere applicable
(2) Details of any performanceperiod
(3) Amount that may be paidat (i) the minimum level ofperformance that results ina payment and (ii) at anyfurther levels of performance
Whetherthere are anyprovisions forthe recoveryof sumspaid or thewithholdingof payment
BaseSalary
Offeringmarket-competitivelevels ofguaranteedcash earningsshould helpus attractand retainexecutivesof suitablyhigh calibreto managethe Board’sstrategicplans andlead themanagementteam.
Salary is paid monthly in arrears in cash.While the Company’s obligations to the currentCEO and the former CFO are denominatedin sterling, they receive a proportion of their payin local currency, converted at prevailingexchange rates. The individual therefore bearsthe currency risk. Future Executive Directorsthat are based in South Africa will receiverand-denominated packages.
The current COO and the new CFO areremunerated in rand.
The Chairman of the Remuneration Committeediscusses the performance of each ExecutiveDirector in their role with the Chairman of theBoard, and seeks the view of the CEO inrelation to other Executive Directors, aheadof all pay reviews.
Base salaries for the year to30 September 2016 were:
Ben Magara £462,150
Simon Scott £334,650*
Ben Moolman R3,696,000
Barrie van der MerweR3,840,000, effective 17 May
* Simon Scott stepped down asCFO after 16 May 2016 andserved in a transitional role until30 September 2016, at whichpoint he left the Company.During the transitional period hecontinued to receive hiscontractual salary and otherbenefits as normal.
(1) Not applicable
(2) Not applicable
(3) Not applicable
Nocontractualprovisionsfor claw-back ormalus

/ 102 Lonmin PlcAnnual Report and Accounts 2016
Directors’ Remuneration Reportfor the year ended 30 September 2016
Executive Directors (continued)
Componentsofremuneration
How thissupports theshort andlong-termstrategicobjectives ofthe Group How this component of remuneration operates Maximum that may be paid
Description of the frameworkused to assess performance:(1) Applicable performance
measures and weightingwhere applicable
(2) Details of any performanceperiod
(3) Amount that may be paidat (i) the minimum level ofperformance that results ina payment and (ii) at anyfurther levels of performance
Whetherthere are anyprovisions forthe recoveryof sumspaid or thewithholdingof payment
BaseSalary(continued)
Reflects theindividual’sskills,experienceand rolewithin theGroup
For confirmatory purposes, independent dataon prevailing market rates of salary for eachrole (a) in UK listed companies of equivalentsize, complexity and risk profile and (b)comparable South African mining companies,will be reviewed by the Committee.
Benchmarking will consider the absolute levelsof base salary in both sterling and rand terms.
Any salary increases willalso reflect any changesin responsibility, marketconditions, and performancein role.
Any year on year increase willnot exceed 10% per annum.
Benefits inkind
Offeringmarket-competitivelevelsof benefits-in-kindshould helpus attractand retainexecutivesof suitablyhigh calibreto managetheCompany’sstrategicvision andplans.
As theCompanyis obligedto operatecross-borderincome taxand socialsecuritydeductions,we provideappropriatesupport tohelp theindividualswith thesecomplexobligations,to avoid thedistractionor timeconsumedin basiccomplianceactivities
The Company offers Executive Directors arange of benefits including some or all of:
• car allowance paid in cash
• private medical insurance for the ExecutiveDirector and their family
• income protection insurance
• life assurance
• annual medicals
• advice and support in managing their taxand exchange control obligations
• access to independent actuarial, financialand legal advice when necessary
Where benefits are provided in kind, these aregenerally sourced in the open market and theCompany and Committee keep the costsunder review.
Policy limits are set at a levelthat reflects market practicefor individuals of this level ofseniority and at a cost whichis afford to the business.
The maximum benefit thatcan be offered or paid to theExecutive Directors for eachelement is:
• car allowance per annum(increasing annually in linewith base salary). For yearended 30 September2016, this was:
Ben Magara £15,000
Simon Scott £15,790
Ben Moolman £15,790
Barrie van der Merwe£15,790, effective17 May
• private medical insuranceis provided on a familybasis
• income protectioninsurance ofapproximately 75%of salary in certaincircumstances
• life assurance of4 x base salary
• annual full medicals
• up to £10,000 per annum+ VAT of tax andexchange control support
The Committee may chooseto make suitable independentprofessional advice availableto the Executive Directors, forexample, in the event that abenefit is being removed or amaterial change to their termsand conditions of employmentis being contemplated of upto £10,000 per annum + VAT.
(1) Not applicable
(2) Not applicable
(3) Not applicable
Nocontractualprovisionsfor claw-back ormalus

www.lonmin.com
/ 103Lonmin PlcAnnual Report and Accounts 2016
01 /Strategic R
eport02 /
Governance
03 /Financial S
tatements
04 /A Deeper Look
05 /Shareholder Inform
ation
Executive Directors (continued)
Directors’ Remuneration Reportfor the year ended 30 September 2016
Components ofremuneration
How this supports theshort and long-termstrategic objectivesof the Group
How this component ofremuneration operates Maximum that may be paid
Description of the framework used toassess performance:(1) Applicable performance measures
and weighting where applicable(2) Details of any performance period(3) Amount that may be paid at (i) the
minimum level of performance thatresults in a payment and (ii) at anyfurther levels of performance
Whetherthere are anyprovisions forthe recoveryof sumspaid or thewithholdingof payment
Relocation /expatriateassistance
Offering assistanceto ExecutiveDirectors who areasked to work awayfrom their homelocation shouldenable the Company(a) to employ thebest person foreach role and (b)where the appointeeis already employedby the Company,provide careerand / or personaldevelopmentoptions andpotentially helpretain their services.
Assistance will include(but is not limited to)facilitating and / or meetingthe costs of obtaining visasand work permits for theExecutive Directors andtheir immediate familymembers, removal andother relocation costs,house purchase or rentalcosts, children’s education,a limited amount of familytravel and tax equalisationarrangements; and mayextend to facilitating and / ormeeting the costs ofre-establishing them totheir previous location atthe end of the employmentor assignment.
There are number ofvariables affecting theamount that may bepayable, but theCommittee would payno more than it judgedreasonably necessary, inthe light of all applicablecircumstances. For thepurposes of compliancewith the Regulations, themaximum would notexceed £250,000 in anyyear for one individual.
(1) Not applicable
(2) Not applicable
(3) Not applicable
No contractualprovisions forclaw-back ormalus
Pension Offering market-competitive levelsof guaranteed cashearnings should helpus attract and retainexecutives ofsuitably high calibreto manage theBoard’s strategicplans and lead themanagement team.
The Company currentlyoffers an allowance(expressed as a percentageof base salary) which theExecutive Director canchoose to take (a) as anemployer contribution toa defined contributionpension scheme (subjectto applicable tax law).(b) as a non-bonusablesalary supplement, or(c) as a blend of the two.
The maximum amountpayable is 20.52% ofbase salary.
(1) Not applicable
(2) Not applicable
(3) Not applicable
No contractualprovisions forclaw-back ormalus
AnnualBonus – theBalancedScorecardPlan (the‘BSC’)
The short-termincentivearrangements use aBalanced Scorecardformat to provide anincentive for deliverywithin the financialyear across a rangeof strategicallyimportant areas.These rewarddelivery of keystrategic andpersonal objectiveswithin agreed riskparameters over aone-year period,and help create astrong performanceculture.
PerformancemeasuresThe Committeeuses the BSC asa tactical tool tocreate a focus andfinancial incentive forthe delivery of shortterm imperativesin support ofstrategic outcomes.
Annual bonus is linked tobase salary only.
Three levels of attainmentare defined in advance –threshold, target andstretch.
All bonus metrics aresubject to audit or otherexternal assurance and theformulaic outcome of theBalanced Scorecard isreviewed for fairness by theCommittee.
Bonus at ‘target’ would be83.5% of base salary and at‘stretch’ would be 125% ofbase salary, being 1.5 xtarget.
The Committee uses theBSC as a tactical tool tocreate a focus and financialincentive for the delivery ofshort term imperatives insupport of strategicoutcomes.
125% of base salary, ifevery metric was achievedat ‘stretch’.
(1) Executive Directors’ bonusmeasures are currentlyweighted at target so that:
(a) 80% of value is linked tocorporate KPIs; and
(b) 20% of value is linked topersonal objectives
For both corporate andpersonal elements, ‘stretch’performance would be 1.5 xthese levels.
The Committee has discretionto alter the formulaic outcomein the light of unforeseenevents, and to reflect theactual delivery of value toshareholders.
The personal metrics areagreed between the Chairman,the Committee and theDirector concerned each yearin advance, with a wide degreeof discretion given to theCommittee. They generallyrelate to projects or initiativeslinked to the design or deliveryof strategic outcomes.
Claw-back canbe applied atthe Committee’sdiscretion in theevent that (1) atany time duringthe three yearsfollowing thedetermination ofthe BSC amountif there has beena materialmisrepresentationin relation to theperformance ofthe Companyand / or theExecutiveDirector whichwould haveaffected the levelat which thebonus wouldhave beendetermined or(2) at any timein the case ofan ExecutiveDirector’smisconduct priorto the payment.
Directors’ Remuneration Reportfor the year ended 30 September 2016
/ 104 Lonmin PlcAnnual Report and Accounts 2016
Components ofremuneration
How this supports the short andlong-term strategic objectivesof the Group
How this component of remunerationoperates
Maximumthat maybe paid
Description of the framework used toassess performance:(1) Applicable performance measures
and weighting where applicable(2) Details of any performance period(3) Amount that may be paid at (i) the
minimum level of performance thatresults in a payment and (ii) at anyfurther levels of performance
Whetherthereare anyprovisionsfor therecoveryof sumspaid or thewithholdingof payment
AnnualBonus – theBalancedScorecardPlan (the‘BSC’)(continued)
In relation to the key strategicobjectives, in normal circumstanceswe expect the majority of themeasures to be relatively unchangedyear-on-year, with the core measureslikely to include the following:
Safety – incentives managementto ensure that risk controls, safetyprocedures and the culture of theorganisation are constantly improvedto reduce LTIFRs and avoid fatalaccidents. In addition, it reinforces theCompany’s commitment to ZeroHarm to employees and contractorswhich is essential for the long-termsustainable operation of the mines.The target is set to improve the LTIFR,subject a modifier which adjusts thevalue of the bonus for any fatalities.
Social responsibility – encouragesmanagement to operate in a waythat is thoughtful about the impactthe Company has on its hostcommunities and recognise that thevast majority of its employees havehomes away from the mine.
Platinum production – theCompany’s sole source of revenue isthe metals it sells, and this measureincentives management to producefinished metal ready for sale.
We choose to incentivise productionrather than sales to avoid distortionsthat could be caused by movementsin stock levels between year ends.The timing of sales can therefore beplanned to maximise profits free fromany influence caused by the bonus plan.
Operating Unit Costs – encouragesmanagement to contain costs anddrive cost efficiencies (collectivelymeasured as cash operating costsper PGM ounce produced) to protectthe profitability of the business andboost its resilience in down cycles.
Net cash – encourages managementto devise operational plans focussedon cash generation, to create optionsfor the Board in relation (among otheruses) to reinvestment in futureproduction capacity, distribution toshareholders or social spending insupport of the Company’s licenceto operate.
PGM recoveries – efficiency andeffectiveness in recovering PGMsfrom rock mined and hoisted tosurface is crucial in creating value.This metric encourages managementto explore technical and otheropportunities that could improverecovery rates and reduce the valueof materials left in process residuesand tailings.
It is crucial that these can be variedfrom year to year in response tocircumstances. It is impossible toforesee all of the events that couldoccur during the three year life ofthis remuneration policy. TheCommittee therefore believes itinadvisable for this policy to createa specific BSC design with a set ofmeasures and weightings whichcannot be varied – this would greatlyreduce the value and usefulness ofthe tool.
Recognising the importance of theseissues to shareholders, we intend topublish a summary of the measuresand weightings to be used in thecurrent year’s BSC on theCompany’s website as early aspossible in each year.
The corporate measures support ourstrategy. The targets arecommercially sensitive and so arenot disclosed in advance, but therewill be full disclosure in arrears.
Bonuses are settled in cash but canbe settled in shares or a mixture ofcash and shares at the discretion ofthe Committee.
There is an underpinning discretionavailable to the Committee to deferpayment and / or provide sharesrather than cash where theunderlying operational and / orfinancial performance is felt to beinsufficient to warrant immediatepayment of a cash bonus.
Any discretion applied to theBSC, its corporate or personalmeasures, weightings and targets,will be discussed with shareholderswhenever appropriate, and in anyevent fully reported to shareholders.
The Committee has discretion tomake changes in future years toreflect the evolving nature of thestrategic imperatives that may befacing the Company.
(2) Performance is measured overone financial year.
(3) The nature of the BSC is thatany amount between zero andthe maximum can be earned.
If all the corporate metricswere achieved at the samelevel, the resulting payment(as a percentage of salary)would be:
• at ‘threshold’: 43% (assumingthat half of the 20% personalelement was achieved)
• at ‘target’: 83.5% (assumingthat the 20% personal elementwas achieved in full)
• at ‘stretch’: 125% (assumingthe personal element wasoutperformed and assessedat 30%)
Executive Directors (continued)
www.lonmin.com
/ 105Lonmin PlcAnnual Report and Accounts 2016
01 /Strategic R
eport02 /
Governance
03 /Financial S
tatements
04 /A Deeper Look
05 /Shareholder Inform
ation
Directors’ Remuneration Reportfor the year ended 30 September 2016
Executive Directors (continued)
Components ofremuneration
How this supports the short andlong-term strategic objectivesof the Group
How this component of remunerationoperates
Maximumthat maybe paid
Description of the framework used toassess performance:(1) Applicable performance measures
and weighting where applicable(2) Details of any performance period(3) Amount that may be paid at (i) the
minimum level of performance thatresults in a payment and (ii) at anyfurther levels of performance
Whetherthereare anyprovisionsfor therecoveryof sumspaid or thewithholdingof payment
AnnualBonus – theBalancedScorecardPlan (the‘BSC’)(continued)
WeightingsThe Committee also uses the weightattached to each performancemeasure within the BSC in furthersupport of the short-term delivery ofcorporate strategy, and can also useone or more of these measures as ahurdle or multiplier for part or all of theBSC, subject to maximum amountcontained in the plan rules. There willbe times when it is appropriate, andin shareholders’ best interests, toattach more significant weight to (forexample) one or more of production,financial or transformation outcomes,reflecting immediate priorities. Again,the Committee believes it is notadvisable to commit to a particulardesign in advance, as this wouldgreatly reduce the value andusefulness of the tool.
TargetsOnce the measures and weightingshave been set the Committee devisesthree levels of attainment for eachmeasure, at threshold, target andstretch. In general terms, thethreshold level of performance is setat the minimum level of performancefor which it would be reasonable tooffer additional remuneration, and hasa lower level of payment; target isgenerally set at or about budget ormarket consensus; and stretch (whichresults in a higher level of payment) isset at a challenging, yet potentiallyachievable, level which should resultin the creation of direct or indirectvalue for shareholders. Whereverpossible, quantifiable hard targets areset to enable accurate measurementand assurance before payment.
Directors’ Remuneration Reportfor the year ended 30 September 2016
/ 106 Lonmin PlcAnnual Report and Accounts 2016
Components ofremuneration
How this supports theshort and long-termstrategic objectivesof the Group
How this component ofremuneration operates Maximum that may be paid
Description of the framework used toassess performance:(1) Applicable performance measures
and weighting where applicable(2) Details of any performance period(3) Amount that may be paid at (i) the
minimum level of performance thatresults in a payment and (ii) at anyfurther levels of performance
Whether thereare any provisionsfor the recoveryof sums paid orthe withholdingof payment
Annual ShareAward Plan
Ensures theinterests of theExecutive Directorsand shareholdersare aligned byproviding a materialfinancial exposureto the Company’sshares. We expectthis to incentivisethe delivery oflong-term strategicobjectives as itclearly aligns thevalue of reward withperformance.
As the award isforfeitable if theexecutive resigns oris dismissed withinthree years ofgranting, this mayhelp the Companyretain ExecutiveDirectors.
The ASAP supportsthe BSC Bonus Planin driving theshort-term deliveryof strategicobjectives, but valueis delivered in theform of Lonminshares, after adeferral period of atleast three years.Please refer to therow above for afuller descriptionof how the BSCBonus Plan worksin practice. Thedelivery of value inthe form of shareshelps create alonger-term focuson value creation.
The face value of theaward is of equal valueto the bonus paid for thepreceding financial year.The average prevailingshare price up to the awarddate value is used tocalculate the number ofshares in the award.
Awards are structured asnil-cost options, and veston the third anniversary ofgrant, subject to continuedservice. Once vested, theaward may be exercised atany time between the thirdand tenth anniversaries ofgrant at executive’sdiscretion. The award issettled by either the issue ofnew shares or the transferof market-purchased sharesto the Executive Director.
Dividend equivalents maybe paid on any sharesvesting.
Vesting may be postponedif the Committee sodetermines and may bemade subject to additionalconditions as determinedby the Committee.
The maximum face valueof the award is capped at125% of salary.
The final value of the awardwill depend on share priceperformance to the dateon which the award isexercised.
In addition, in line with UKbest practice dividendequivalents can, at theCommittee’s discretion,be paid on the vesting ofawards. These equal thevalue of dividends thatwould have been declaredor paid on the number ofshares vesting during thetenor of that award.
(1) The bonus earned and paidin respect of the precedingfinancial year is used todetermine the size of the award.
Once granted, the onlyongoing condition is generallycontinued employment.
(2) The award is made on adiscretionary basis toExecutive Directors whoworked for part of at all of thepreceding financial year andare still in employment at thedate of granting.
The award vests on the thirdanniversary of the date ofgrant, and can be exercisedat any point up to the tenthanniversary provided theindividual is still in employment.
(3) The face value of the awardwill be of equal value to thegross bonus paid in respectof the preceding financial year,capped at 125% of salary.
The final value of the awardwill depend on share priceperformance to the date onwhich the award is exercised.
Malus can beapplied at theCommittee’sdiscretion atany time duringthe three yearvesting periodin the eventthat wediscover
(1) amisstatementof the financialresults and / orhealth of theCompanyduring the yearfor which theunderlyingbonus wasassessed(the ‘RelevantYear’), (2) anerroneouscalculation inrelation to theCompany’sresults or otherperformancebenchmark(3) errors in theCompany’sfinancialstatements;or (4)discrepanciesin the financialaccounts forthe RelevantYear, whetheror not arisingfrom fraud orrecklessbehaviour orthe part of anyDirector oremployeeof a Groupcompany.
The Committeemay applyclaw-back inthe event thatit discovers,at any timeprior to thevesting of theaward, an actor omissionwhich justifies,summarydismissal ortermination ofemploymenton the groundsof misconducton the part ofthe ExecutiveDirector.
Executive Directors (continued)
www.lonmin.com
/ 107Lonmin PlcAnnual Report and Accounts 2016
01 /Strategic R
eport02 /
Governance
03 /Financial S
tatements
04 /A Deeper Look
05 /Shareholder Inform
ation
Directors’ Remuneration Reportfor the year ended 30 September 2016
Components ofremuneration
How this supports theshort and long-termstrategic objectivesof the Group
How this component ofremuneration operates Maximum that may be paid
Description of the framework used toassess performance:(1) Applicable performance measures
and weighting where applicable(2) Details of any performance period(3) Amount that may be paid at (i) the
minimum level of performance thatresults in a payment and (ii) at anyfurther levels of performance
Whether thereare any provisionsfor the recoveryof sums paid orthe withholdingof payment
Long-TermIncentivePlan
This plan aims tocreate alignmentof executive andshareholderinterests by:
• facilitating amaterial exposureto the value of theCompany’s sharesby the ExecutiveDirectors
• making the vestingof the awardsubject to theachievement ofseparateperformanceconditionsassessing (i) areturn on capitalor investmentmeasure to bedetermined by theCommittee and(ii) the changein value ofshareholders’investment relativeto our peers
We believe that thepotential valueavailable to theExecutive Directorsthrough the LTIPleads to fairness –reasonableperformance shouldlead to reasonablereward while thehighest levels of payshould result fromsignificant levels ofperformance. In turnthis should help usattract, retain andmotivate ExecutiveDirectors of theright calibre.
An award over a fixednumber of shares is grantedon and vests on the thirdanniversary of grant, subjectto (i) continued service and(ii) achievement of one orboth of the performanceconditions.
The award is settled byeither the issue of newshares or the transfer ofmarket-purchased sharesto the Executive Directorin three equal tranches oneach of the third, fourthand fifth anniversaries ofthe date of granting.
Dividend equivalentsmay be paid on anyshares vesting.
The rules of the new LTIPprovide that the maximumface value of an award willnot normally exceed 125%of salary except inexceptional circumstances,which for ExecutiveDirectors would be limitedto the use of the plan tofacilitate the buy-out ofincentives on recruitment.
In line with UK bestpractice dividendequivalents can, at theCommittee’s discretion,be paid on the vesting ofawards. These equal thevalue of dividends thatwould have been declaredor paid during the tenor ofthe award on the numberof shares vesting.
(1) The performance conditionwill be in two parts, eachassessed independently.The vesting of half of an awardwill be subject to RTSR, asdescribed more fully onpage 93. The vesting of theother half of the award willbe subject to the CROICreturn metric.
(2) RTSR assessed over aperiod of 36 months broadlyconterminous with the vestingperiod, but ending on acalendar month end. Thisallows time to communicatethe vesting outcome toparticipants in advance of thevesting date, so that taxwithholding obligations can becalculated. Return: assessedby reference to the three setsof audited financial statementsissued by the Companyduring the three year termof the award.
(3) Vesting can be at any levelfrom 0% to full vesting.
The final value of the awardwill depend on share priceperformance to the date onwhich the ward is released.
The rulesprovide thatclaw-backmay be appliedwithin twoyears of vestingwhere the levelof grant orvesting of anaward hasbeen affectedby any of theeventsdescribed in(1) to (4) abovein relation tothe ASAPclaw-back mayalso be appliedwhere wediscover at anytime followingvesting a prioract ofmisconducton the part ofthe ExecutiveDirector.
Executive Directors (continued)
The Committee requires the Executive Directors to build and retain a personally significant investment in the Company’s shares.We see this as an important and integral part of our remuneration policy as this means that they experience the same changes invalue as shareholders and have a direct personal incentive to create and preserve value. Executive Directors are required to buildup a shareholding within five years of taking office with a value of at least 3x base salary (CEO) and 2x base salary (CFO and anyother Executive Directors). Our expectation is that Executive Directors will acquire shares steadily through the five year period,rather than simply by the end date. Should this be achieved but the market value of that investment then fall below the requiredlevel, the individual has a period of three years in which to restore compliance. No forfeiture, claw-back or malus provisions areapplicable as these are personal shareholdings created from after-tax income, save where such provisions apply under theCompany’s employee share schemes and other share-settled arrangements.

Directors’ Remuneration Reportfor the year ended 30 September 2016
/ 108 Lonmin PlcAnnual Report and Accounts 2016
Executive Directors (continued)
Footnotes to the policy tablePerformance measures – as noted in the policy table, performance measures apply to the Balanced Scorecard Bonus Plan (BSC), the Annual Share(1)Award Plan (ASAP) and the Long-Term Incentive Plan (LTIP). These were chosen and targets are set as follows:
• BSC – the specific metrics and their weightings are set by the Committee in the light of the Board’s assessment of the strategic imperatives facingthe Company and the budgets and other operational plans adopted by the Board to best address both short and longer term imperatives.Management proposes suitable metrics (which are quantitative wherever possible) and levels of performance to form the threshold, target and stretchlevels of attainment. The Committee then assesses whether achievement of these is appropriately aligned with shareholders’ interests, and whetherthe reward that would accrue to the Executive Directors would be justifiable. They also examine whether the metric is consistent with therequirements of prudent risk management (and does not itself create perverse incentives) and good governance.
• ASAP – shareholders will recall that this plan replaced the previous practice of mandatory deferral of after-tax bonus, following changes in SouthAfrican tax law. When the amounts available under this plan are combined with the value of the BSC bonus, the total value as a multiple of basesalary has not changed for several years. The maximum award requires significant performance achievement, which has resulted in actual awardsunder the BSC and ASAP having been considerably below the maximum in recent years. As the prior year bonus determines the award size, theCommittee believes that no subsequent performance condition is required, other than continued employment, noting that the ultimate value of theaward will move with the share price. The vesting period of three years is felt appropriate given practices in competitor companies and therequirement for the Executive Directors to build and retain material long-term holdings of Lonmin shares.
• LTIP – our current performance condition was devised in 2015 in accordance with the LTIP plan which was approved by shareholders at the 2015AGM. It combines the CROIC factor, averaged over three years to create a longer-term assessment of operational performance. We add the averageCROIC outcome to the Total Shareholder Return generated by Lonmin relative to the median of a peer group of other listed PGM producers (whoface the same socio-economic and operational challenges), assessed over three years, being a direct measure of value creation for shareholders. We believe that this creates an incentive to manage the business for value over the longer term. The levels of relative performance were establishedafter actuarial modelling of long-term historic data, such that material levels of vesting would only occur for strong levels of performance. Combiningthe two components of the condition helps avoid a situation where reward flows from operational performance but no value has accrued toshareholders. This performance metric has been devised to demonstrate the effectiveness of management at generating cash for shareholders while eliminating the influence of accounting decision in relation to, for example, depreciation policies and impairment of assets.
Details of outstanding awards under the previous rules of the ASAP and previous LTIP are set out on page 97. Other than as described in the policy table,there are no components of the Executive Directors’ remuneration that are not subject to performance measures.
Continuation of awards under previous policy – prior to the current Directors’ remuneration policy coming into effect on 1 February 2015, the previous(2)policy included the share-settled awards made to Ben Magara (referred to in that policy as the Recruitment Award) and Simon Scott (referred to as theSpecial Award). Both awards continued in operation until the date on which the last tranche of shares vested or lapsed. In the previous financial year, the second of three tranches of Ben Magara’s Recruitment Award, which was due to vest on 31 May 2015, was deferred. This second tranche vested on 29 January 2016, and the third and final tranche vested as planned on 31 May 2016. Simon Scott’s Special Award vested on 29 January 2016. Both the Recruitment Award and the Special Award have therefore now vested in full and the Company will have no further obligations in respect of theseawards.In addition, awards made under the ASAP prior to the revised remuneration policy coming into effect will continue to operate on the terms onwhich they were granted until the date on which the last tranche of shares has vested or lapsed, as the case may be. Awards made under the LTIP will be treated on the same basis, save that awards made in calendar year 2015 and thereafter will have the new performance condition substitutedfor that required by the old policy.
Remuneration of employees generally – the policy in relation to the remuneration of the Executive Directors applies in virtually unchanged form to the(3)members of the Exco and their more senior first reports (we call this group the RemCo Purview Group), though the levels of awards tend to be lower than those offered to the Executive Directors and BSC targets may include elements relating to parts of the business for which the individual executive is responsible. Below the RemCo Purview Group remuneration is a combination of fixed pay (salary, benefits and pension) and short-term incentive pay(BSC and other one year bonus arrangements). Share-settled long-term incentives are no longer offered to these employees as we judge that their rolesdo not have the longer term dimensions that would make this appropriate, but we do encourage employees to consider investing in the Company’sshares. For employees of the Group generally, pay comprises base salary, various allowances provided in cash or kind and short-term bonuses linked to safety, production and cost which are generally paid quarterly. We have implemented an Employee Share Ownership Plan for employees as part of our commitment to meet the transformational requirements of the South African government’s Mining Charter.
The number of Company shares which have been issued or may be issued pursuant to options or awards granted within the previous 10 years under all(4)employees’ share schemes adopted by the Company shall not exceed 10 percent of the Company’s ordinary share capital in issue immediately prior tothe proposed date of grant.

www.lonmin.com
/ 109Lonmin PlcAnnual Report and Accounts 2016
01 /Strategic R
eport02 /
Governance
03 /Financial S
tatements
04 /A Deeper Look
05 /Shareholder Inform
ation
Other policy provisions in relation to Directors’ pay
(a) Approach to remuneration of Directors on recruitmentWhen determining the remuneration of a newly-appointed Executive Director, the Remuneration Committee applies thefollowing principles:
offer a level and mix of fixed and performance-related remuneration which is sufficiently competitive to attract, retain and•motivate candidates of suitable calibre and experience, but designed with shareholder value at its heart to help reducethe risk of over-paying. We expect that future Executive Directors will be employed in South Africa, and will be offeredRand-denominated packages. In setting these, the Committee will consider pay in London-listed companies and / orSouth African or international mining companies (with whom we compete for senior talent) of equivalent size, complexityand risk;
design the package so that the short and long-term performance-related remuneration incentivises the individual to•deliver value-creating outcomes, but such that the quantum of pay possible does not create a perverse incentive for the individual to pursue excessively risky strategies;
in determining what is an appropriate level of remuneration, the Committee will take a number of relevant factors •into account, including (but not limited to) the impact on other existing remuneration arrangements and internal payrelativities; the candidate’s current location and role, and their skills, knowledge and experience; the nature of the rolethey are being recruited for and the outcomes the individual is expected to deliver; and external market influencesgenerally, including any competing offers the individual may be considering;
design the package so that high levels of reward must be earned through outperformance, and deliver value to•shareholders that justifies the amount of pay earned: fundamentally, the relationship between pay and performance must create fairness between the new Director and shareholders; and
ensure that there is fairness between the terms and conditions of employment of the new and existing Directors.•
Where promotion to an Executive Director role is from within the Company, any performance-related pay element arising fromtheir previous role will generally continue on its original terms.
All of the components of pay set out in the policy table would be considered for inclusion in the remuneration package, atlevels up to the maximum values set out in that table.
Where the appointee has variable remuneration arrangements with a previous employer that will be lost on leavingemployment, the Company will consider offering a sign-on award in compensation for the value foregone, either as an awardunder an existing share plan or a bespoke award under the Listing Rules exemption available for this purpose. The face and /or expected values of the award(s) offered will not materially exceed the value ascribed to the award(s) foregone, and wouldnormally follow the same vesting timing and form (cash or shares), save that the Committee may award the whole of the valuein Lonmin shares at its discretion. The application of performance conditions would be considered and, where appropriate,the awards could be made subject to claw-back and / or malus in appropriate circumstances. The Committee would, wherepracticable, consult with key institutional shareholders ahead of committing to make any such sign-on awards and a fullexplanation of any amounts awarded, an explanation of why this is necessary and a breakdown of the awards to be madewould be announced to the markets at the time of granting.
In accordance with the table on page 94, Non-executive Directors are paid a base fee for their appointment as a Director andserving on up to two Board Committees, with additional fees being payable in specific circumstances as explained in thetable. In certain cases, equivalent amounts are invoiced by the Directors’ employing companies. No sign-on payments areoffered to Non-executive Directors.
(b) Flexibility, discretion and judgementWe believe that the total remuneration of the Executive Directors should reflect their performance in delivering the Company’sstrategy. No remuneration policy and structure, however carefully designed and implemented, can ever pre-empt everypossible scenario. As a result, the application by the Committee of flexibility, discretion and judgement is crucial in achievingfair outcomes. Flexibility is necessary in designing each year’s remuneration within the approved three-year policy, for examplein devising appropriate metrics for the annual bonus plan to support short-term business imperatives. Discretion is needed,amongst other things, in determining whether mechanistic or formulaic outcomes are fair, in context, and can be applied inan upward or downward manner. For example, the assessment of the Balanced Scorecard may generate pay outcomesthat need to be adjusted to reflect broader socio-economic realities or the Company’s financial position and prospects.Judgement is vital in setting individual targets and goals, for example in the Balanced Scorecard, which will be seen asreasonable by shareholders (at threshold) and realistically achievable by executives (at stretch) or in the detailed design orinterpretation of performance conditions.
Directors’ Remuneration Reportfor the year ended 30 September 2016
Directors’ Remuneration Reportfor the year ended 30 September 2016
/ 110 Lonmin PlcAnnual Report and Accounts 2016
Other policy provisions in relation to Directors’ pay (continued)
(b) Flexibility, discretion and judgement (continued)English company law requires us to state the extent of discretion available to the Committee on any aspect of the Directors’remuneration policy. In addition to the above, while noting that there are three distinct concepts, the Committee has discretionas follows:
Annual Bonus – The Committee has discretion (1) to invite participants into the bonus programme, and determine the•percentage of their salary which can be earned as a bonus at ‘target’ and ‘stretch’ (subject to the plan rules), (2) todesign performance measures and set targets for each financial year to incentivise business outcomes which are alignedwith the strategic imperatives facing, or likely to be facing, the Company and to allocate weightings between these as itjudges appropriate, (3) during each financial year, to amend the design of the Balanced Scorecard where material externalfactors render the original design inappropriate or inadvisable, (4) in assessing the formulaic outcomes of the BalancedScorecard for the year, to apply its discretion (upwards or downwards) to ensure that the resulting bonus payment is fair(a) between shareholders and the Executive Directors and (b) between the Executive Directors, (5) in relation to leavers asprovided for in the table set out on page 103, (6) on a change of control of the Company, to determine the amount, or aminimum amount, of bonus for that year taking into account such factors it considers appropriate, including performanceand time-apportionment, the timing of payment and any additional terms which may apply to such payment, and (7)whether to settle bonus awards in cash or in shares and / or defer payment. The Committee has a further discretion todetermine whether to apply claw-back to all or part of any award in the circumstances set out in the table on page 103.
ASAP – The Committee has similar discretions as under the Annual Bonus in relation to participation, award level,•performance measures, targets and weightings, and amendments to the plan. In addition, the Committee has discretion(1) to determine the form of awards (whether a conditional allocation, restricted shares or nil-cost option) and, in relationto options, the exercise period and whether any amount need be paid in order to exercise, (2) in relation to leavers asprovided for in the table set out on page 106, (3) to determine whether awards vest on a restructuring of the Company,(4) to pay dividend equivalents on vested shares either in cash or in additional shares, and (5) to apply malus adjustments(or, where relevant, claw-back) to all or part of any award in the circumstances set out in the table on page 106.
LTIP – The Committee has discretion (1) to determine who is to participate in the plan and the levels of award to be•made, (2) to set the performance measures and targets, and the weightings between them, to determine the vesting ofawards, (3) in relation to leavers as provided for in the table set out on page 107, (4) on a change of control of theCompany, to determine the level of vesting of awards based on performance and, unless the Committee considers it notto be appropriate, time apportionment, (5) to pay dividend equivalents on vested shares in cash or shares, (6) in relationto awards made after the 2014 AGM, to apply malus and / or claw-back to all or part of any award in the circumstancesset out in the table on page 107, and (7) to determine the form of awards (whether a conditional allocation, restrictedshares or options) and, in relation to options, the exercise period and any amount needed to be paid in order to exercise.
Shareholding obligation – The Committee may opt to vary the length of the periods within which shareholdings are•acquired, in appropriate circumstances and determine whether bonuses should be paid in shares to assist in meetingshareholding obligations.
(c) Service contractsAll of the Executive Directors are employed on service contracts governed by English law. These contracts place the followingobligations on the Company which could give rise to, or impact on, remuneration payments or payments for loss of office:
to provide pay (inclusive of Directors’ fees), contributions to a defined contribution pension arrangement (or a cash•supplement in lieu) and benefits (whether in cash or kind) as specified in the contract, and to reimburse expensesincurred by the Director in performing their duties;
to give the Director eligibility to participate in discretionary short and long-term incentive plans; •
to provide 25 working days’ (plus bank / public holidays) paid holiday per annum, or pay in lieu of any accrued but•untaken holiday on termination of employment;
to provide sick pay as specified in the contract;•
subject to the termination, garden / special leave and suspension provisions of the contract, to provide continued•employment in the role to which the individual has been appointed; and
to terminate the contact only on the expiry of twelve months’ written notice (save in the event of a repudiatory breach of•contract or in certain other very limited circumstances), or to make a payment in lieu of notice equal to the value of thebase salary, pension contributions and benefits in kind that would have been payable for the period of contractual notice(subject to exercising the Company’s discretion to make phased payments). The treatment of short and long-termincentives on termination is dealt with in the next section of this policy report.
www.lonmin.com
/ 111Lonmin PlcAnnual Report and Accounts 2016
01 /Strategic R
eport02 /
Governance
03 /Financial S
tatements
04 /A Deeper Look
05 /Shareholder Inform
ation
Other policy provisions in relation to Directors’ pay (continued)
(d) Policy on payment for loss of office
Notice periods for Executive DirectorsThe Company’s policy in this area seeks to protect shareholders’ interests. The service contracts of the current ExecutiveDirectors are terminable on the expiry of:
six months’ notice from the Director – this means that, where no in-house successor has been identified, the Company•would have time to replace the Executive Director through an orderly external recruitment process, and ideally have aperiod of handover; or
twelve months’ notice from the Company – this makes the individual a less attractive candidate for a prospective•employer, given the time that will elapse before they could be sure of taking up their new employment, and also providesthe Company with the ability to place a Director joining a competing employer on a lengthy period of garden / specialleave so that the information they possess becomes out of date.
The principles on which termination payments will be approached are as follows:
Calculation of each component of payment – severance paymentsUnless the Company is entitled to terminate employment summarily, the Executive Directors’ service contracts oblige theCompany (i) to pay salary and pension allowance and maintain all contractual benefits for any unworked period of notice or(ii) at the option of the Company, to make a payment in lieu of such notice comprising the base salary that would otherwisehave been paid.
The service contracts do not oblige us to pay short-term incentives for that part of the bonus year worked by the Director, butit is our custom and practice to do so, based on an assessment of personal and corporate performance to the date of exit,and subject to time apportionment. As policy, the Committee will not pay bonus for any unworked period of notice, eventhough this is permitted in the plan rules.
In circumstances where the role is declared redundant or retrenched, the individual may have a legal right to statutory or othercontractual redundancy pay.
The service contracts permit the Company, at its discretion, to decide that payments in lieu of notice may be phased ininstalments over a period of no longer than 12 months and, further, that any payment can be reduced in accordance with theduty on the part of the executive to mitigate his or her loss.
In cases of poor performance, contractual termination payments may generate undue and potentially excessive reward.Where appropriate, the Committee will consider terminating employment other than on the terms of the contract (in otherwords, unilaterally terminating employment). While the departing executive would be entitled to sue for damages for breachof contract, such damages would take into account any poor performance, the executive’s legal duty to mitigate their lossby finding alternative employment and the early payment of any amounts offered in settlement. As such, this could be tothe Company’s benefit. However, by breaching the contract the Company would lose the benefit of the typical restrictivecovenants preventing poaching / solicitation of staff, customers and suppliers, and protecting the Company’s know-how andconfidential information. When felt necessary to protect the Company’s interests the Committee may approve new contractualarrangements with departing executives, including (but not limited to) settlement, confidentiality and / or restrictive covenantagreements. These will be used sparingly and only entered into where the Committee believes that it is necessary, and in thebest interests of the Company and its shareholders to do so.
Directors’ Remuneration Reportfor the year ended 30 September 2016
Directors’ Remuneration Reportfor the year ended 30 September 2016
/ 112 Lonmin PlcAnnual Report and Accounts 2016
Plan
“Good” leaver (being broadlyredundancy or retrenchment,retirement, injury, ill health ordisability, death, the sale of theCompany or that part of thebusiness in which the Directorwas employed)
“Other” leaver scenarios(other than summary dismissal) Summary dismissal
The Balanced ScorecardBonus Plan
The Committee’s policy isthat, as provided for in therules of the BSC, theCommittee may permit abonus payment in an amountno greater than thatcalculated after the usual yearend audit and assuranceprocesses and timeapportioned for the proportionof the financial year worked,although the Committee hasthe discretion to determinethe bonus amount as of thedate of leaving, taking intoaccount such additionalfactors to the above as itconsiders appropriate.
No right to a bonus underthe BSC but the Committeehas discretion to treat otherleavers in the same manneras “good leavers”.
No discretion will be exercisedin the participants favour andso no bonus will be payable.
Annual Share Award Plan An award is not forfeited.Our current policy is to allowthe award to be exercisedwithin six months of thevesting date (being thethird anniversary of the dateof grant).
The Committee maydetermine that an award willnot be forfeited in which caseour current policy is to allowthe award to be exercisedwithin six months of the newvesting date (being the thirdanniversary of the date ofgrant.
Awards will lapse.
Long Term Incentive Plan Awards ordinarily vest inaccordance with their normalvesting schedule1.
Awards lapse unless theCommittee exercises itsdiscretion to treat otherleavers in the same manneras “good leavers”1,2.
Awards will lapse.
Other policy provisions in relation to Directors’ pay (continued)
(d) Policy on payment for loss of office (continued)The Company’s short and long-term incentive plans are all governed by formal rules which have been approved by shareholders.Directors have no contractual rights to the value inherent in any awards held. The table below explains how the plan rulesaddress termination in different leaver scenarios:
Footnotes:1. Except in cases of death-in-service, the Committee’s policy is not to vest any long-term incentive awards for leavers earlier than their normal vesting
date (unless exceptional circumstances exist).
2. Where leavers are permitted to retain awards which are subject to performance conditions, those conditions would normally be assessed at the endof the relevant period(s), and any resulting reward then subject to time-apportionment.
www.lonmin.com
/ 113Lonmin PlcAnnual Report and Accounts 2016
01 /Strategic R
eport02 /
Governance
03 /Financial S
tatements
04 /A Deeper Look
05 /Shareholder Inform
ation
Directors’ Remuneration Reportfor the year ended 30 September 2016
Other policy provisions in relation to Directors’ pay (continued)
(d) Policy on payment for loss of office (continued)In our experience, Directors can leave employment for a wide range of reasons which do not fall within the prescribedcategory of ‘good leaver’, encompassing a vast range of individual situations. The Committee must retain discretion toapprove payments to individuals falling into this ‘middle ground’ to create sufficient differentiation, taking the Director’sperformance in office and their circumstances of their exit into account. In doing so, the Committee will recognise andbalance the interests of shareholders and the departing Executive Director, as well as the interests of the remaining anddeparting Directors.
If employment is terminated by the Company the departing Executive Director may have a legal entitlement (under statuteor otherwise) to additional amounts, which would need to be met. In addition, the Committee retains discretion to settle anyother amounts reasonably due to the executive, for example to meet the legal fees incurred by the executive in connectionwith the termination of employment, where the Company wishes to enter into a settlement agreement and the individual mustseek independent legal advice. If the Executive Director has relocated to perform their duties, the Committee has discretionto meet the reasonable costs associated with returning that individual (and where relevant their family) back to their countryof origin and winding up their affairs in the country in which they worked for Lonmin, including meeting the incidental costsincurred in so doing.
Non-executive Directors
The Company seeks to appoint Non-executive Directors with extensive experience at strategic level, most often gained throughoperating at board level in relevant businesses, and ideally in a South African operating context. They are required to attend Boardand Committee meetings and other formal sessions both in South Africa and the UK, and to be available to the Chairman of theBoard and other Directors as needed. In addition, they are expected to familiarise themselves with the Company’s business andthe context in which it operates, and to maintain their technical skills and knowledge.
The Company’s general approach is to offer fees at levels applicable in the UK market for companies of similar size, complexityand risk, and which reflect the travel commitment we require of the appointee. No Non-executive Director receives any benefits inkind, relocation support, pension or performance-related payments.
These fees are generally reviewed biennially. The last such review took place in 2015 at which time the fee structure was changedas described on page 94.
The Company believes that the proposed levels of remuneration should be sufficient to secure the services of individuals with theskills, knowledge and experience necessary to support and oversee the Executive Directors, and who are likely to be credible toshareholders in their execution of the Board’s approved strategies and operational plans.
Any future increase to any of the above fees will not exceed 10% per annum. No Non-executive Director receives anyperformance-related pay. No amounts due to a Non-executive Director are subject to any recovery or withholding arrangements.
Non-executive Directors in receipt of fees from the Company are required to build a shareholding with a market value of 1x theirannual base fee within five years of taking office. Should this be achieved but the value then fall below this level, the individual hasa period of three years in which to return to compliance.
The decline in the Company’s share price has impacted the value of the Directors’ shareholdings. Whilst the Directors remaincommitted to meet this obligation, demonstrated by the fact that all Directors who had shares prior to the 2015 rights issue tookup their rights in full, the Committee has agreed to refresh the timeframe for compliance, giving each director until the later of fiveyears from the completion of the Rights Issue (i.e. by 10 December 2020) or from their date of appointment.
For and on behalf of the Remuneration Committee.
Jim SutcliffeChairman

/ 114 Lonmin PlcAnnual Report and Accounts 2016
Directors’ Report
The Company1.1 Legal form of the Company
Lonmin Plc is a company incorporated in England & Wales, with company number 103002.
It conducts very limited business activities on its own account, and trades principallythrough its subsidiary undertakings in various jurisdictions. The material subsidiaryundertakings are listed in note 33 to the financial statements on page 170. A branch ofLonmin Plc operates in South Africa, trading as Lonmin Management Services or ‘LMS’and which is registered in that country as an external company with company number1969/00015/10. The branch and the English company are legally indivisible.
1.2 Amendment of the Articles of AssociationThe Company’s constitution, known as the Articles of Association, is essentially acontract between the Company and its shareholders, governing many aspects of themanagement of the corporation. It may only be amended by a special resolution at ageneral meeting of the shareholders.
1.3 Rules on Appointment and Removal of DirectorsSubject to applicable law, a Director may be appointed by an ordinary resolution of shareholders in general meeting followingnomination by the Board or a member (or members) entitled to vote at such a meeting, or following retirement by rotationif the Director chooses to seek re-election at a general meeting. In addition, the Directors may appoint a Director to fill avacancy or as an additional Director, provided that the individual retires at the next AGM. A Director may be removed bythe Company as provided for by applicable law, in certain circumstances set out in the Company’s Articles of Association(for example bankruptcy, or resignation), or by a special resolution of the Company. All Directors stand for re-election on anannual basis, in line with the recommendations of the Code. For a full description of the Company’s policies in relation to theappointment and replacement of Directors see section 1.3 of the Corporate Governance Report, on page 61.
Statutory Disclosures2.1 Employees
At 30 September 2015, the Company employed 35,669 employees, of which 26,968 were own employees and 8,701 werecontractors. At 30 September 2016, the Company employed 32,793 employees, of which 25,296 were employees and7,497 were contractors.
The reduction in the workforce of 2,876 referred to above occurred in the year under review. The s189 process commencedin June 2015 and, since that time, we have seen a reduction of 5,433 employees.
Information on the Group’s policies on employee recruitment and engagement can be found on page 44 and in theSustainable Development Report, expected to be published in January 2017.
As the Group employs less than 250 employees in the UK, the Company is not subject to the statutory obligation to discussits policies in relation to employee involvement or the employment of disabled persons. However, full and fair considerationwould always be given to applications for employment from disabled persons, having regard to their particular aptitudes andabilities, or continuing the employment of people who become disabled during their career.
2.2 Research and developmentGroup companies continue to focus on research and development in the areas of mineral extraction, processing and refiningto unlock new technology opportunities and to extract optimal value from our assets.
2.3 Greenhouse gas emissionsThe disclosures concerning greenhouse gas emissions required by law are included in the Strategic Report, on page 51.
2.4 Political donationsNo political donations were made during the year. Lonmin has an established policy of not making donations to any politicalparty, representative or candidate in any part of the world.
2.5 Financial instrumentsFull details can be found in note 19 to the financial statements on page 153.
Share Capital and Related Matters3.1 Share capital and reserves
The total share capital and reserves attributable to the Group amounted to $1,669 million at 30 September 2016. The structureof the issued share capital of the Company at 30 September 2016 is set out in note 23 to the financial statements.
In addition to the Ordinary Shares of $0.0001 each, the Company’s share capital also comprises 50,000 Sterling DeferredShares of £1 each, 586,906,900 and 2015 Deferred Shares of $0.999999 each.
Seema KambojCompany Secretary

www.lonmin.com
/ 115Lonmin PlcAnnual Report and Accounts 2016
01 /Strategic R
eport02 /
Governance
03 /Financial S
tatements
04 /A Deeper Look
05 /Shareholder Inform
ation
Directors’ Report
3.1 Share capital and reserves (continued)Deferred Shares issued in 2002 were allotted to a nominee company to comply with the English statutory requirement that a public limited company must have a minimum share capital of £50,000. These shares do not rank equally with the OrdinaryShares of the Company, and have minimal rights. The holders’ consent is not required for changes to the Company’s sharecapital, and they are not entitled to receive notice of, or attend, speak or vote at, any general meeting. The holders are notentitled to participate in any distribution of income or capital save that, following the distribution of £100,000,000,000 plus the paid-up nominal value of every other share in the capital of the Company, they are entitled to receive an amount equal to the nominal value of their Sterling Deferred Shares.
Following the issue of 26,997,717,400 shares as a result of the 2015 Rights Issue and 617,581,491 shares to the Bapocommunity as a result of the simultaneous Bapo BEE Placing, the Company’s share capital was consolidated in December2016 at a ratio of 100 existing shares to 1 consolidated share (resulting in the current Ordinary Shares of $0.0001 each).Further information on the Rights Issue, the Bapo BEE Placing and the consolidation can be found in the notice of meetingand circular to shareholders dated 2 November 2016 (available on the Company’s website) and the prospectus dated9 November 2016.
The 2015 Deferred Shares were created in 2015 following the sub-division of the Company’s ordinary share capital inpreparation for the 2015 Rights Issue, at which time each existing ordinary share was sub-divided into one IntermediateOrdinary Share of $0.000001 each and one 2015 Deferred Share of $0.999999 each. The 2015 Deferred Shares do not rankequally with the Ordinary Shares, and have minimal rights. The holders of such shares are not entitled to receive notice of, orattend, speak or vote at, any general meeting. The holders are not entitled to participate in any distribution of income and areonly entitled to a payment on a return of capital or winding up of the company after payment of the capital paid up on any orall Ordinary Shares and Deferred Shares and the further distribution of $500,000,000,000.
The shareholder resolutions passed on 19 November 2015 (which amended the Articles of Association of the Company),authorised any one Director or the Company Secretary (inter alia) to instruct the Company to transfer all of the 2015 DeferredShares to the Company Secretary for aggregate nil consideration, and / or transfer all of the 2015 Deferred Shares to theCompany for an aggregate payment of $0.01, in each case without obtaining consent of the holders.
In accordance with this authority, the Company transferred all of the 2015 Deferred Shares to the Company Secretary on24 June 2016.
3.2 Shareholders’ rightsHolders of Ordinary Shares are entitled to:
receive all shareholder documents, including notice of any general meeting;•
attend, speak and exercise voting rights at general meetings, either in person or by proxy; and•
participate in any distribution of income or capital,•
subject to applicable law and the Company’s Articles of Association.
In general there are no restrictions on the holder’s ability to transfer their shares or exercise their voting rights, save insituations where the Company is legally entitled to impose such restrictions (usually where amounts remain unpaid on theshares after request, or the holder is otherwise in default of an obligation to the Company).
The Company is not aware of any agreements between its shareholders that may restrict the transfer of their shares or theexercise of the voting rights attaching to them, save in relation to:
the employee benefit trust established by the Company, the Lonmin Employee Share Trust, to facilitate various employee•share plans. The trustee, which is independent of the Company, does not seek to exercise voting rights on the OrdinaryShares held in trust, and a dividend waiver is in place in respect of shares which are the beneficial property of the trust.For details of the Company’s employee share plans, see the Directors’ Remuneration Report on pages 85 to 113.
the shares held by the Bapo are subject to a 10 year lock-in period as a result of which these shares may not be sold,•transferred, assigned or encumbered.
No shareholder, or trust relating to an employee share plan, holds securities carrying special rights relating to the control ofthe Company.
3.3 Powers conferred on the Directors in relation to share capitalSubject to applicable law and the Company’s Articles of Association the Directors may exercise all powers of the Company,including the power to authorise the issue and / or market purchase of the Company’s shares (subject to an appropriateauthority being given to the Directors by shareholders in general meeting and any conditions attaching to such authority).
There were two occasions in the year under review when shareholders delegated powers to the Directors in relation to sharecapital, this being:
(i) at the general meeting held on 19 November 2015, at which the Directors were authorised to issue shares in connectionwith the 2015 Rights Issue and the Bapo BEE Placing; and
(ii) at the AGM held on 28 January 2016, at which directors were generally authorised to issue and buy back share capitalin the Company (in accordance with the terms of the relevant resolutions).

Directors’ Report
3.3 Powers conferred on the Directors in relation to share capital (continued)The nature and extent of these authorities are summarised below:
No shares were acquired by forfeiture or surrender or made subject to a lien or charge.
As described above on page 114, following the successful completion of the 2015 Rights Issue and the Bapo BEE Placing,the Company’s share capital was consolidated at a ratio of 100 shares to 1 consolidated share. This consolidation wasundertaken in accordance with an ordinary resolution passed by shareholders at the general meeting of the Company heldon 19 November 2015.
In addition to the shares issued in connection with the Rights Issue and the Bapo BEE Placing, during the year, 378,978Ordinary Shares of $0.0001 each were issued for cash to satisfy the exercise of options or the vesting of awards grantedunder the Company’s employee share plans (see note 24 to the financial statements). However, these do not count againstthe allotment authority summarised in the table as each of the share plans had previously been approved by the shareholdersin general meeting.
Transactions, Contractual Arrangements and Post-Balance Sheet Events4.1 Transactions with Related Parties
There have been no transactions with related parties of the Company during the financial year, other than those in the ordinarycourse of business.
4.2 Significant Agreements – change of controlA number of agreements take effect, alter or terminate upon a change of control of the Company following a takeover bid,such as debt facilities and employee share plans. None of these are deemed to be significant except for the Company’s bankdebt facilities in the amount of approximately $365 million spread across a syndicated ZAR facility which includes three banksand a syndicated USD facility, which includes seven banks. These facilities contain provisions under which, in the event thatnew terms to continue the facilities are not agreed within ten days of a change of control, the lenders are entitled to givenotice cancelling the facilities and declaring all outstanding loans together with accrued interest to become payable within15 days of such notice.
Authority Utilisation during the yearAmount of authority outstanding atthe end of the year
19 November 2015 – Power grantedat general meeting to issue sharesup to an aggregate nominal amountof $400,000,000, to be offered byway of a rights issue to members ofsuch record date as the directorsmay determine
A total of 26,997,717,400 were issuedduring the Rights Issue
Authority stated to expire at the endof the next AGM of the Company(being 26 January 2016) or, if earlier,on 19 February 2017
19 November 2015 – Power grantedat general meeting to issue sharesup to an aggregate nominal value of$9,150,129 in connection with theBapo BEE Placing (as more fullydescribed in the circular and notice ofmeeting dated 2 November 2016 andavailable on the Company’s website)
A total of 617,581,491 shares wereissued to the Bapo Community
Authority stated to expire at the endof the next AGM of the Company(being 26 January 2016) or, if earlier,on 19 February 2017
28 January 2016 – Power granted atAGM to allot equity securities up to anaggregate nominal value of $9,390
No shares were issued during the yearpursuant to this authority
Authority remains outstanding in full untilthe next AGM (being 26 January 2017)or, if earlier, 28 April 2017
28 January 2016 – Power granted atAGM to make market purchases ofits own shares, up to a maximum of28,200,000 shares (being approximately10% of the issued share capital) atprices not less than the nominal valueof each share (being $0.0001) andnot exceeding 105% of the averagemid-market price for the precedingfive business days)
The Company made no purchasesof its own shares during the year
Authority remains outstanding in full untilthe next AGM (being 26 January 2017)or, if earlier, 28 April 2017
/ 116 Lonmin PlcAnnual Report and Accounts 2016
www.lonmin.com
/ 117Lonmin PlcAnnual Report and Accounts 2016
01 /Strategic R
eport02 /
Governance
03 /Financial S
tatements
04 /A Deeper Look
05 /Shareholder Inform
ation
Directors’ Report
4.2 Significant Agreements – change of control (continued)The Company does not have agreements with any Director or employee that would provide compensation for loss of office oremployment resulting from a change of control, except that certain provisions in some of the Company’s long-term incentiveschemes may be triggered. Awards made under the Stay & Prosper Plan crystallise immediately following a change of control,although they only vest and become payable on their normal maturity date (three years from the date of grant) and are subjectgenerally to the continued employment of the participant. Directors of the Company are not permitted to hold awards underthis Plan. Awards under the Company’s other share plans will vest on a change of control, save to the extent specified by theRemuneration Committee, who will generally take into account the extent to which the performance targets have been metand such other factors as they believe to be appropriate in line with the rules of the relevant plans. Further information onthese plans and other long-term incentives is provided in the Directors’ Remuneration Report on pages 85 to 113.
4.3 Events after the reporting periodSave for note 32 to the financial statements, there have been no material events from 30 September 2016 to the date ofthis report.
Reporting, Accountability and Audit5.1 Directors’ Responsibilities in respect of the Annual Report and Accounts
The Directors are responsible for preparing the Annual Report and the Group and parent company Accounts in accordancewith applicable law and regulations.
Company law requires the Directors to prepare Group and parent company financial statements for each financial year. Underthat law they are required to prepare the Group financial statements in accordance with IFRSs as adopted by the EU andapplicable law and have elected to prepare the parent company financial statements in accordance with UK Accounting Standards.
Under company law the Directors must not approve the financial statements unless they are satisfied that they give a trueand fair view of the state of affairs of the Group and parent company and of their profit or loss for that period. In preparingeach of the Group and parent company financial statements, the Directors are required to:
select suitable accounting policies and then apply them consistently;•
make judgements and estimates that are reasonable and prudent;•
for the Group financial statements, state whether they have been prepared in accordance with IFRSs as adopted by the EU;•
for the parent company financial statements, state whether applicable UK Accounting Standards have been followed,•subject to any material departures disclosed and explained in the parent company financial statements; and
prepare the financial statements on the going concern basis unless it is inappropriate to presume that the Group and the•parent company will continue in business.
The Directors are responsible for keeping adequate accounting records that are sufficient to show and explain the parent company’stransactions and disclose with reasonable accuracy at any time the financial position of the parent company and enable them toensure that its financial statements comply with the Companies Act 2006. They have general responsibility for taking such stepsas are reasonably open to them to safeguard the assets of the Group and to prevent and detect fraud and other irregularities.
Under applicable law and regulations, the Directors are also responsible for preparing a Strategic Report, Directors’ Report,Directors’ Remuneration Report and Corporate Governance Statement that comply with that law and those regulations.
The Directors are responsible for the maintenance and integrity of the corporate and financial information included on theCompany’s website. Legislation in the UK governing the preparation and dissemination of financial statements may differfrom legislation in other jurisdictions.
The Directors’ Responsibility Statement can be found on page 124.
5.2 How the Directors discharged their responsibilities in this areaThe Lonmin Group financial statements are presented in accordance with the IFRSs as adopted by the EU, using the US Dollaras its reporting currency.
Details of the Group’s financial risk management are described in note 19 to the financial statements on page 153 and in thediscussion of Internal Controls and Risk Management in the Audit & Risk Committee Report on page 81.
5.3 Going Concern and viabilityIn determining the appropriate basis of preparation of the financial statements, the Directors are required to consider if it isappropriate to adopt the going concern basis of accounting.
Full disclosure of the Directors’ deliberations to determine whether it is appropriate to adopt the going concern basis ofaccounting in addition to consideration of the material uncertainties which may affect the Group’s ability to continue to adoptthis basis is provided in note 1 to the financial statements on page 129. In summary, the Directors have concluded that it isappropriate to prepare the financial statements on a going concern basis.
Directors are also required to provide a broader assessment of viability over a longer period, which can be found on page 26of the annual report and accounts.

/ 118 Lonmin PlcAnnual Report and Accounts 2016
Directors’ Report
5.4 Scope of the reporting in this Annual Report and AccountsThe Corporate Governance Report (including the Board and Exco biographies), which can be found on pages 54 to 57,the Audit & Risk Committee Report on pages 74 to 82, the Nomination Committee Report on pages 83 and 84 and thesupplementary information contained in the section titled ‘A Deeper Look’ on pages 187 to 196 are incorporated by referenceand form part of this Directors’ Report.
The Board has prepared a Strategic Report (including the Chairman’s Letter and the CEO’s Letter) which provides an overviewof the development and performance of the Company’s business in the year ended 30 September 2016 (“FY2016”) and itsposition at the end of that year, and which covers likely future developments in the business of the Company and Group.
For the purposes of compliance with DTR 4.1.5 R(2) and DTR 4.1.8 R, the required content of the ‘Management Report’ canbe found in the Strategic Report and this Directors’ Report, including the sections of the Annual Report and Accountsincorporated by reference.
For the purposes of LR 9.8.4C R, the information required to be disclosed by LR 9.8.4 R can be found in the following locations:
Section Topic Location
(1) Interest capitalised Financial Statements, page 143 note 6
(2) Publication of unaudited financial information Not applicable
(4) Details of long-term incentive schemes Not applicable
(5) Waiver of emoluments by a director Directors’ Remuneration Report, page 85
(6) Waiver of future emoluments by a director As (5) above
(7) Non pre-emptive issues of equity for cash Not applicable
(8) Item (7) in relation to major subsidiary undertakings Not applicable
(9) Parent participation in a placing by a listed subsidiary Not applicable
(10) Contracts of significance Directors’ Report
(11) Provision of services by a controlling shareholder Not applicable
(12) Shareholder waivers of dividends Directors’ Report, page 115, section 3.2
(13) Shareholder waivers of future dividends Directors’ Report, page 115, section 3.2
(14) Agreements with controlling shareholders Not applicable
All the information cross-referenced above is hereby incorporated by reference into this Directors’ Report.
We have been mindful of the best practice guidance published by DEFRA and other bodies in relation to environmental,community and social KPIs when drafting the Strategic Report. The Board has also considered social, environmental andethical risks, in line with the best practice recommendations of the Association of British Insurers. Management, led by theCEO, has responsibility for identifying and managing such risks, which are discussed extensively in this Annual Report andAccounts and the online Sustainable Development Report, expected to be published in January 2017.
References in this document to other documents on the Company’s website, such as the Sustainable Development Report, areincluded as an aid to their location and are not incorporated by reference into any section of the Annual Report and Accounts.
5.5 External auditorsSo far as each current Director is aware, there is no information relevant to the audit of which the Company’s auditors areunaware, and each Director has taken all the steps that he or she ought to have taken as a Director to make himself or herselfaware of any such information and to ensure that the Company’s auditors are aware of that information.
The Strategic Report, the Directors’ Report (including all sections incorporated by reference) and the Directors’ RemunerationReport were approved by the Board on 13 November 2016.
For and on behalf of the Board.
Seema KambojCompany Secretary
www.lonmin.com
FinancialStatements
01 /Strategic R
eport02 /
Governance
03 /Financial S
tatements
04 /A Deeper Look
05 /Shareholder Inform
ation/ 119Lonmin Plc
Annual Report and Accounts 2016
120 Independent Auditor’s Report124 Responsibility Statement of the Directors in Respect of the Annual Report and Accounts125 Consolidated Income Statement125 Consolidated Statement of Comprehensive Income126 Consolidated Statement of Financial Position127 Consolidated Statement of Changes in Equity128 Consolidated Statement of Cash Flows129 Notes to the Accounts172 Lonmin Plc Company Balance Sheet173 Lonmin Plc Company Statement of Changes in Equity174 Lonmin Plc Company Statement of Cash Flows175 Notes to the Company Accounts
03/
The statutory financial statements of both the Group andthe Company and associated independent audit reports.

Independent Auditor’s Reportto the Members of Lonmin Plc Only
Opinions and conclusions arising from our auditOur opinion on the financial statements is unmodifiedWe have audited the financial statements of Lonmin Plc for the year ended 30 September 2016 which comprise the ConsolidatedIncome Statement, the Consolidated Statement of Comprehensive Income, the Consolidated Statement of Financial Position, the Company Balance Sheet, the Consolidated Statement of Changes in Equity, Company Statement of Changes in Equity, the Consolidated Statement of Cash Flows, The Company Statement of Cashflow and the related notes. In our opinion:
the financial statements give a true and fair view of the state of the Group’s and of the parent Company’s affairs as at •30 September 2016 and of the Group’s loss for the year then ended;
the Group financial statements have been properly prepared in accordance with International Financial Reporting Standards•as adopted by the European Union (IFRSs as adopted by the EU);
the parent Company financial statements have been properly prepared in accordance with IFRSs as adopted by the EU •and as applied in accordance with the provisions of the Companies Act 2006; and
the Financial Statements have been prepared in accordance with the requirements of the Companies Act 2006 and, •as regards the Group Financial Statements, Article 4 of the IAS Regulation.
Overview
Our assessment of risks of material misstatementWe summarise below the risks of material misstatement that had the greatest effect on our audit (in decreasing order of auditsignificance), our key audit procedures to address those risks and our findings from those procedures in order that the Company’smembers as a body may better understand the process by which we arrived at our audit opinion. Our findings are the result ofprocedures undertaken in the context of and solely for the purpose of our statutory audit opinion on the financial statements as a whole and consequently are incidental to that opinion and we do not express discrete opinions on separate elements of thefinancial statements.
Impairment of non-financial assets (excluding inventories and deferred tax) $335 million (2015: $1,811 million) Risk vs 2015: >Refer to page 77 (Report from the Audit & Risk Committee), page 130 (accounting policy) and pages 168 to 169 (financial disclosures).
The risk: The PGM industry has experienced rising costs, and subdued demand resulting in a depressed pricing environment.•Overall, the average basket price for PGMs fell from $902 per ounce in the prior period to $796 per ounce whilst wageinflation is in excess of 8%. The Company’s market capitalisation remains below the share of net assets attributable toshareholders of the Company. The Group’s main Cash Generating Unit (CGU) is Marikana, which was partly impaired in 2015.
The discounted cash flow model to determine recoverable amount of the CGU is detailed and complex and certain key inputsspecifically mineral reserves, foreign exchange rates, inflation, PGM prices, capital and operating costs including productionefficiencies, and the discount rate are subject to volatility and require significant estimation and judgement. As such, there is asignificant risk that the carrying value of the Group’s non-financial assets related to the Marikana CGU may need to be furtherimpaired since the prior period.
In 2015, the Group’s Akanani and Limpopo CGUs were fully impaired and as such we do not consider impairment of these assetsto be a significant risk in the current period.
/ 120 Lonmin PlcAnnual Report and Accounts 2016
Materiality: Group financialstatements as a whole
$11.5 million (2015: $13.0 million)0.5% (2015: 0.3%) of Group total assets
Coverage 100% (2015: 100%) of Group revenue99% (2015: 96%) of Group loss before tax100% (2015: 100%) of Group total assets
Risks of Material Misstatement vs 2015
Recurring risks Impairment of non-financial assets (excluding inventories and deferred tax) >
Recoverability of Historically Disadvantaged South Africans (HDSA) receivable >
Physical quantities and net realisable value of inventory (excluding consumables) >
Going concern
>

www.lonmin.com
Independent Auditor’s Reportto the Members of Lonmin Plc Only
Opinions and conclusions arising from our audit (continued)Our response: Our audit procedures included detailed testing of the Directors’ impairment assessment for the Marikana CGU.•We utilised KPMG IT Modelling specialists to assess the integrity of the Group’s impairment model. For the key inputs to themodel we critically assessed their reasonableness by reference to external data including third party PGM metal price forecasts,reports from the Group’s external consultants and mineral reserve reports as well as the Group’s historical forecasting accuracyof these key inputs. The mineral reserves reports are prepared on an annual basis by Lonmin’s competent persons as definedby the South African Mineral Resources Committee. We assessed the Lonmin competent persons’ competence and capabilities.
We utilised our own KPMG Valuation Specialists to challenge the discount rate applied by the Group. We benchmarked valuationsagainst the market capitalisation, recent corporate PGM transactions and broker reports. We considered the adequacy of theGroup’s disclosures in respect of impairment testing, impairments recognised, and whether disclosures about the sensitivity of theoutcome of the impairment assessment to changes in key assumptions properly reflected the risks inherent in the valuations andwere consistent with our review of the sensitivity analyses.
Our findings:We found the Group’s assumptions for Marikana in the discounted cash flow model, when all factors are considered,•to be mildly optimistic (2015: mildly optimistic) largely due to mildly optimistic assumptions for PGM prices. We found the Group’scompetent persons to be competent and capable. We found the Group’s disclosures to be proportionate in their description of theassumptions and estimates made by the Group and the sensitivity to changes thereon.
Recoverability of the HDSA receivable $69 million (2015: $102 million) Risk vs 2015: >Refer to page 77 (Report from the Audit & Risk Committee), page 130 (accounting policy) and page 150 (financial disclosures).
The risk: The Group has an amount due to it from a subsidiary of Phembani Group (Pty) Limited (previously called Shanduka•Resources (Proprietary) Limited after a merger between the Phembani and Shanduka groups in the year) amounting to $376 million at 30 September 2016. A cumulative provision has been recognised against this amount of $307 million leaving a carrying value of $69 million. The amount due is secured by shares in a Phembani subsidiary, whose only asset of value isits ultimate shareholding in Incwala Resources (Pty) Limited (“Incwala”). There is no recourse to the wider Phembani Group inthe event that this loan is not repaid. The majority of the amount due was provided to the Phembani subsidiary in 2010 sothat it could acquire 50.03% of Incwala, which has interests in the Group’s subsidiaries, and provides the Group with its BlackEconomic Empowerment (“BEE”) credits. Due to a decline in the performance and outlook of the PGM industry, subsidiariesof the Group have not been paying the quantum of dividends that were expected when the financing was first put in place,which was to be one of the main sources of income from which the Phembani subsidiary could make repayments of theamounts due. The value of the collateral has also fallen significantly in 2015. Given the above factors, there is a risk that, withno obligation on the wider Phembani Group to support it, the Phembani subsidiary may not repay the amount. The Directors’have held initial discussions with the directors of the newly merged group regarding the repayment of the loan but to datethere have been no amendments to the terms of the loan.
Our response: Our audit procedures included KPMG Corporate Intelligence and Forensics Specialists carrying out confidential•enquiries using various sources to provide insights into, and identify risks relating to, the Phembani Group’s past and currentactions regarding its BEE investments and its ability and likely actions to fund repayment or not. We considered the value ofthe collateral by reference to the underlying values of the assets, and the consolidated net liabilities of Incwala. Given thoseassets held by Incwala include Marikana, we have made use of the audit work we performed on impairment of this CGUabove. We also considered the adequacy of the Group’s disclosures with regards to impairment testing for financial assets,and whether disclosures about the sensitivity of the value of the collateral to changes in key assumptions properly reflectedthe risks inherent in the valuations.
Our findings: We found the resulting estimate of the recoverable amount to be mildly optimistic (2015: mildly optimistic) •and that the Group’s disclosures with regards to the impairment testing for the HDSA receivable to be proportionate in theirdescription of the assumptions and estimates made concerning the value of its underlying collateral.
Physical quantities and net realisable value of inventory (excluding consumables) $201 million (2015: $235 million) Risk vs 2015: >Refer to page 78 (Report from the Audit & Risk Committee), page 130 (accounting policy) and page 151 (financial disclosures).
The risk: Prior to production as a final metal, metal inventory is always contained in a carrier material and it is not possible to•determine the exact metal content contained in a carrier material. As such, physical quantities of in-process metal inventoryare determined by sampling, and assays are taken to determine the metal content and how this is split by type of metal. The accuracy of these samples and assays can vary quite significantly, and as such, the quantum of metal inventory requiresa significant amount of estimation and judgement. In relation to the net realisable value (“NRV”) of the inventory quantity, thePGM industry has experienced rising costs, and subdued demand resulting in a depressed pricing environment, and there is a risk that inventory is not carried at the lower of cost and NRV.
01 /Strategic R
eport02 /
Governance
03 /Financial S
tatements
04 /A Deeper Look
05 /Shareholder Inform
ation/ 121Lonmin Plc
Annual Report and Accounts 2016
Independent Auditor’s Reportto the Members of Lonmin Plc Only
Opinions and conclusions arising from our audit (continued)Our response: Our audit procedures included attendance at year-end physical stock counts for all significant locations, •where the Group engaged independent metallurgists to assist with the assessment of sampling methodologies used and the adherence to appropriate stock count processes. We considered the competence of the metallurgists, the results of theirreport, and sought to understand and corroborate the reasons for significant or unusual movements in inventory quantitiesbetween the accounting records and the results of the sampling and assays performed as part of the year-end physical stockcounts. We also considered the reasonableness of the downward adjustment to stock quantities to recognise the estimationuncertainty inherent in the sampling and assays and the fact that not all of the material will eventually be recovered as refinedmetal. We assessed this by reference to historical experience of the Group and obtained from the independent metallurgistsan assessment of the average percentage sampling or calculation error at each stage of the production process. We alsoobtained the net realisable value calculations and tested prices by reference to externally available data. We also consideredthe adequacy of the Group’s disclosures about the metal inventory, including the description of the estimates and judgementsaround metal inventory.
Our Findings: We found that the estimates of physical quantities of metal inventory were balanced (2015: balanced) and in line•with the independent metallurgists calculations and the assumptions around the estimated the loss of metal at each stage ofthe production process were balanced. We found no concerns over the independent metallurgists’ competence. We found no errors (2015: no errors) in the prices applied in the net realisable value calculation. We found the Group’s disclosuresconcerning inventory estimates and valuation to be proportionate in their description.
Going concern Risk vs 2015:
Refer to page 78 (Report from the Audit & Risk Committee), page 129 (accounting policy)
The risk: The financial statements are prepared on a going concern basis. The 2015 independent auditor’s report included •an emphasis of matter related to the material uncertainty about the Group and the Company’s ability to continue as a goingconcern, in particular the need for the planned Rights Issue and renegotiation of the Group’s banking facilities. The RightsIssue was subsequently approved at a General Meeting on 19 November 2015 and $372 million of net cash proceeds werereceived and banking facilities of $365 million were refinanced. As such, the significance of the going concern risk hasdecreased in the current year. However, as a result of the continued challenging PGM environment the business continues to be cash flow negative from operating and investing activities and although the Group has $215 million of facilities undrawn,there remains a risk around the appropriateness of the adoption of the going concern basis in the financial statements.
The financial statements explain how the Directors have formed a judgement that there is a reasonable expectation the goingconcern basis is appropriate in preparing the financial statements of the Company and the Group. The Directors have concludedthat the range of possible outcomes they have considered in arriving at this judgement, including of adverse PGM commodityprice and Rand / US Dollar exchange rate movements and failure to reach production targets, is not sufficient to give rise to amaterial uncertainty regarding the Group’s ability to continue as a going concern. As this assessment involves the estimation of the aforementioned future conditions, which are highly volatile, there is a risk that the judgement is inappropriate and theuncertainty should have been assessed as material, in which case additional disclosures would have been required.
Our response: Our audit procedures included performing detailed testing of the Group’s cash flow models covering the •18 month period from 30 September 2016. The key inputs in the model are consistent with the inputs used in the impairmentassessment of the Marikana CGU, with the exception of the foreign exchange assumptions where forward looking rates areused for going concern assessment purposes, and we have made use of the audit work we performed on impairment of thisCGU above. We have critically assessed the reasonableness of the exchange rates used in the Group’s forecasts by referenceto the prevailing exchange rate at year-end and the sensitivity of the forecasts to changes in the exchange rates assumed.
We confirmed the existence of the Group’s banking facilities to third party confirmations and re-performed the Group’s calculationswhich indicated that the forecasts involved no breaches of the covenants and that the existing facilities are adequate for theGroup’s requirements. We reviewed sensitivity analysis of the forecasts, and resulting covenant tests, to a number of variablefactors including PGM commodity prices, Rand / US Dollar exchange rate and production. We considered the adequacy of theGroup’s disclosures in respect of going concern.
Our findings: We found the Directors’ judgement that there was no materiality uncertainty about its ability to continue as a•going concern to be disclosed to be balanced (2015: balanced) based on the assumptions used in the forecasts. We foundthe Group’s disclosures to be adequate in their description of the possible factors which may have a significant impact on the business and the sensitivity analysis performed by management in assessing the going concern basis to be consistentwith these factors.
Special items – costs relating to restructuring
We continue to perform procedures over special items. However, following the completion of the Group’s restructuring•program in 2016, no additional restructuring provisions have been recognised in the current financial year. Consequently, we have not assessed this as one of the risks that had the greatest effect on our audit and therefore, it is not separatelyidentified in our report this year.
In reaching our audit opinion on the financial statements, we took into account the findings that we describe above and those for other, lower risk areas. Overall, the findings from across the whole audit are that the financial statements use some mildlyoptimistic estimates in relation to the impairment testing of the Marikana CGU and the HDSA receivable. However, compared with materiality and considering the qualitative aspects of the financial statements as a whole, we have not modified our opinion on the financial statements.
/ 122 Lonmin PlcAnnual Report and Accounts 2016
>
www.lonmin.com
Independent Auditor’s Reportto the Members of Lonmin Plc Only
Opinions and conclusions arising from our audit (continued)Our application of materiality and an overview of the scope of our auditMateriality for the Group financial statements as a whole was set at $11.5 million (2015: $13.0 million) determined with reference to a benchmark of Group total assets pre-impairment, which we consider to be a more stable benchmark than profit. Materialityrepresents 0.5% (2015: 0.3%) of Group total assets pre-impairment. We reassessed materiality after the impairment of theMarikana CGU and determined that the materiality level remained appropriate.
We reported to the audit committee any corrected and uncorrected identified misstatements exceeding $1,000,000 (2015: $650,000), in addition to other identified misstatements that warranted reporting on qualitative grounds.
Whilst Lonmin Plc is a UK company, all of the Group’s significant operations are located in South Africa. Audits for Group reportingpurposes were performed by component auditors in South Africa over three (2015: five) of the Group’s 16 (2015: 16) reportingcomponents. The Group audit team performed audits over four (2015: four) components, including Lonmin Plc as a standalone entity,along with the audit of the Group, including consolidation-type adjustments and the impairment amounts excluded from the materialitybenchmark. These audits accounted for 100% of Group turnover (2015: 100%), 97% of Group loss before taxation (2015: 96%) and99% of the Group’s total assets (2015: 99%). Component auditors in South Africa conducted reviews of financial information (includingenquiry) at a further six (2015: four) non-significant components in order to provide further coverage of the Group results.
The components within scope of our work accounted for the following percentages of the Group’s results:
Number of Group Group loss Group totalcomponents revenue before tax assets
Audits for Group reporting purposes 7 100% 97% 99%
Reviews of financial information (including enquiry) 6 – 2% 1%
Total 13 100% 99% 100%
Total (2015) 13 100% 100% 96%
The remaining 1% (2015: nil) of Group loss before tax is represented by three reporting components, none of which individuallyrepresented more than 0.9% of Group loss before tax. For the remaining components, we performed analysis at an aggregatedGroup level to re-examine our assessment that there were no significant risks of material misstatement within these.
The Group audit team instructed component auditors as to the significant areas to be covered, including the relevant risks detailedabove and the information to be reported back. The Group audit team approved the component materialities, which ranged from$0.3 million to $11.1 million (2015: $0.3 million to $12.35 million), having regard to the mix of size and risk profile of the Groupacross the components.
The Group audit team conducted planning meetings with the component auditors around the audit approach to significant riskareas such as inventory. The Group audit team was physically present in South Africa for a significant portion of the substantivetesting phase of the South African audit and review engagements. In doing so, the Group audit team was actively involved in thedirection of the audits and review engagements performed by the component auditors for Group reporting purposes, along withthe consideration of findings and determination of conclusions drawn.
Our opinion on other matters prescribed by the Companies Act 2006 is unmodifiedIn our opinion:
the part of the Directors’ Remuneration Report to be audited has been properly prepared in accordance with the Companies•Act 2006; and
the information given in the Strategic Report and Directors’ Report for the financial year for which the financial statements•are prepared is consistent with the financial statements.
We have nothing further to report on the disclosures of principal risksBased on the knowledge we acquired during our audit, we have nothing material to add or draw attention to in relation to:
the Directors’ Statement of Viability on pages 26 to 27, concerning the principal risks, their management, and, based on that, •the Directors’ assessment and expectations of the Group’s continuing in operation over the 3 years to September 2018; or
the disclosures in note 1 of the Financial Statements concerning the use of the going concern basis of accounting.•
We have nothing to report in respect of the matters on which we are required to report by exceptionUnder ISAs (UK and Ireland) we are required to report to you if, based on the knowledge we acquired during our audit, we haveidentified other information in the Annual Report that contains a material inconsistency with either that knowledge or the financialstatements, a material misstatement of fact, or that is otherwise misleading. In particular, we are required to report to you if:
we have identified material inconsistencies between the knowledge we acquired during our audit and the Directors’ statement•that they consider that the Annual Report and financial statements taken as a whole is fair, balanced and understandableand provides the information necessary for shareholders to assess the Group’s position and performance, business modeland strategy; or
the Report from the Audit & Risk Committee does not appropriately address matters communicated by us to the audit committee.•
01 /Strategic R
eport02 /
Governance
03 /Financial S
tatements
04 /A Deeper Look
05 /Shareholder Inform
ation/ 123Lonmin Plc
Annual Report and Accounts 2016
Independent Auditor’s Reportto the Members of Lonmin Plc Only
Opinions and conclusions arising from our audit (continued)Under the Companies Act 2006 we are required to report to you if, in our opinion:
adequate accounting records have not been kept by the parent company, or returns adequate for our audit have not been•received from branches not visited by us; or
the parent company financial statements and the part of the Directors’ Remuneration Report to be audited are not in agreement•with the accounting records and returns; or
certain disclosures of Directors’ remuneration specified by law are not made; or•
we have not received all the information and explanations we require for our audit.•
Under the Listing Rules we are required to review:
the Directors’ statements, set out on pages 117 and 27 in relation to going concern and longer-term viability; and •
the part of the Corporate Governance Statement in the Directors’ Report – Governance relating to the Company’s compliance•with the eleven provisions of the 2014 UK Corporate Governance Code specified for our review.
We have nothing to report in respect of the above responsibilities.
Scope and responsibilitiesAs explained more fully in the Directors’ Responsibilities Statement, the Directors are responsible for the preparation of the financialstatements and for being satisfied that they give a true and fair view. A description of the scope of an audit of financial statementsis provided on the Financial Reporting Council’s website at https://www.frc.org.uk/auditscopeukprivate. This report is made solelyto the Company’s members as a body and is subject to important explanations and disclaimers regarding our responsibilities,published on our website at www.kpmg.com/uk/auditscopeukco2014b, which are incorporated into this report as if set out infull and should be read to provide an understanding of the purpose of this report, the work we have undertaken and the basisof our opinions.
Adrian Wilcox (Senior Statutory Auditor)for and on behalf of KPMG LLP, Statutory AuditorChartered Accountants15 Canada SquareLondon, E14 5GL
13 November 2016
/ 124 Lonmin PlcAnnual Report and Accounts 2016
Responsibility Statement of the Directors in Respectof the Annual Report and AccountsWe confirm that to the best of our knowledge:
the financial statements, prepared in accordance with the applicable set of accounting standards, give a true and fair view •of the assets, liabilities, financial position and profit or loss of the Company and the undertakings included in the consolidationtaken as a whole;
the management report required by DTR 4.1.8R (contained in the Strategic Report and the Directors’ Report) includes a fair•review of the development and performance of the business and the position of the Company and the undertakings includedin the consolidation taken as a whole, together with a description of the principal risk and uncertainties that they face.
Brian Beamish Barrie van der MerweChairman Chief Financial Officer13 November 2016

www.lonmin.com
Consolidated Income Statementfor the year ended 30 September
01 /Strategic R
eport02 /
Governance
03 /Financial S
tatements
04 /A Deeper Look
05 /Shareholder Inform
ation/ 125Lonmin Plc
Annual Report and Accounts 2016
Special Special2016 items 2016 2015 items 2015
Underlying i (note 3) Total Underlying i (note 3) TotalNotes $m $m $m $m $m $m
Revenue 2 1,118 – 1,118 1,293 – 1,293
EBITDA / (LBITDA) ii 109 6 115 21 (73) (52)Depreciation, amortisation and impairment (102) (335) (437) (155) (1,811) (1,966)
Operating loss iii 4 7 (329) (322) (134) (1,884) (2,018)Profit on disposal of joint venture 3 – 5 5 – – –Finance income 6 23 32 55 16 20 36Finance expenses 6 (28) (60) (88) (20) (255) (275)Share of loss of equity accounted investment 12 (5) – (5) (5) – (5)
Loss before taxation (3) (352) (355) (143) (2,119) (2,262)Income tax (charge) / credit iv 7 (109) 64 (45) 35 328 363
Loss for the year (112) (288) (400) (108) (1,791) (1,899)
Attributable to:– Equity shareholders of Lonmin Plc (89) (253) (342) (94) (1,567) (1,661)– Non-controlling interests (23) (35) (58) (14) (224) (238)
Loss per share 8 (137.0)c (3,437.6)c
Diluted loss per share v 8 (137.0)c (3,437.6)c
Consolidated Statement of Comprehensive Incomefor the year ended 30 September
2016 2015Total Total
Notes $m $m
Loss for the year (400) (1,899)
Items that may be reclassified subsequently to the income statement:– Change in fair value of available for sale financial assets 13 – (4)– Foreign exchange loss on retranslation of equity accounted investment 12 – (8)– Deferred tax on items taken directly to the statement of comprehensive income (1) –
Total other comprehensive expenses for the year (1) (12)
Total comprehensive loss for the year (401) (1,911)
Attributable to:– Equity shareholders of Lonmin Plc (343) (1,672)– Non-controlling interests (58) (239)
(401) (1,911)
Footnotes:i Underlying results are based on reported results excluding the effect of special items as defined in note 3.
ii EBITDA / (LBITDA) is operating profit / (loss) before depreciation, amortisation and impairment of goodwill, intangibles and property, plant and equipment.
iii Operating profit / (loss) is defined as revenue less operating expenses before profit on disposal of joint venture, finance income and expenses and share of loss of equity accounted investment.
iv The income tax (charge) / credit substantially relates to overseas taxation and includes exchange gains of $5 million (2015 – $48 million) as disclosed in note 7.
v Diluted (loss) / earnings per share is based on the weighted average number of ordinary shares in issue adjusted by dilutive outstanding share options.
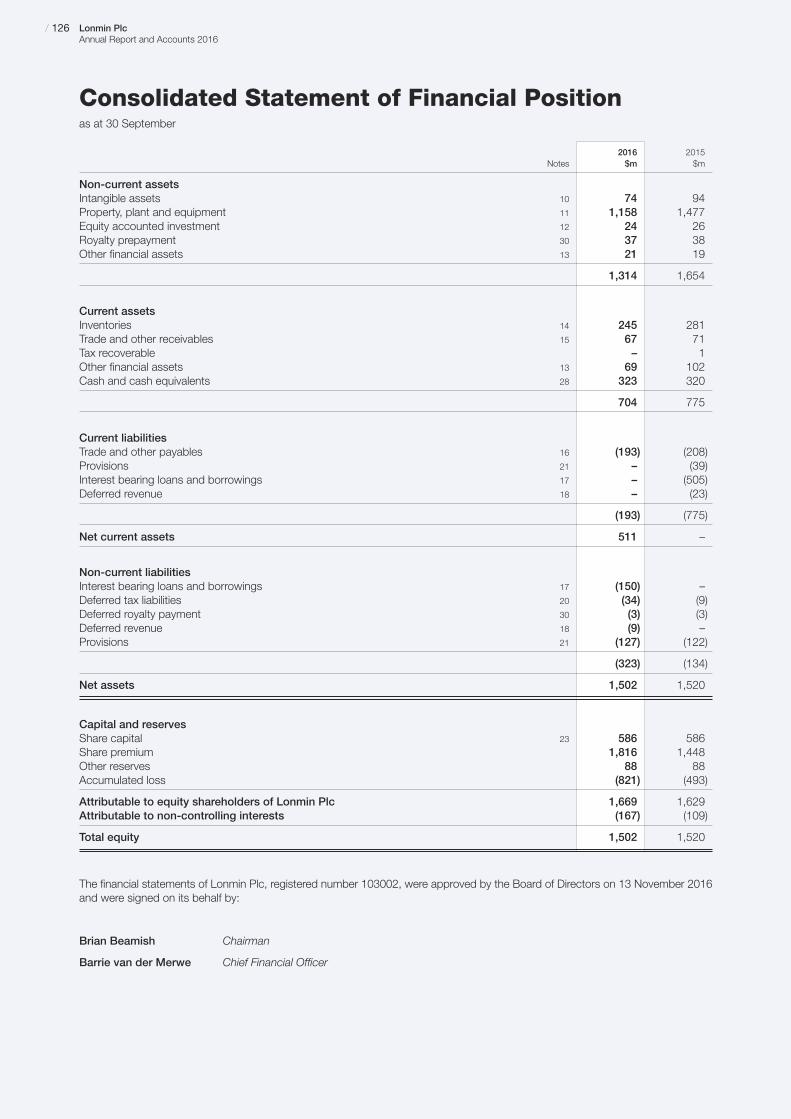
Consolidated Statement of Financial Positionas at 30 September
/ 126 Lonmin PlcAnnual Report and Accounts 2016
2016 2015Notes $m $m
Non-current assetsIntangible assets 10 74 94Property, plant and equipment 11 1,158 1,477Equity accounted investment 12 24 26Royalty prepayment 30 37 38Other financial assets 13 21 19
1,314 1,654
Current assetsInventories 14 245 281Trade and other receivables 15 67 71Tax recoverable – 1Other financial assets 13 69 102Cash and cash equivalents 28 323 320
704 775
Current liabilitiesTrade and other payables 16 (193) (208)Provisions 21 – (39)Interest bearing loans and borrowings 17 – (505)Deferred revenue 18 – (23)
(193) (775)
Net current assets 511 –
Non-current liabilitiesInterest bearing loans and borrowings 17 (150) –Deferred tax liabilities 20 (34) (9)Deferred royalty payment 30 (3) (3)Deferred revenue 18 (9) –Provisions 21 (127) (122)
(323) (134)
Net assets 1,502 1,520
Capital and reservesShare capital 23 586 586Share premium 1,816 1,448Other reserves 88 88Accumulated loss (821) (493)
Attributable to equity shareholders of Lonmin Plc 1,669 1,629Attributable to non-controlling interests (167) (109)
Total equity 1,502 1,520
The financial statements of Lonmin Plc, registered number 103002, were approved by the Board of Directors on 13 November 2016and were signed on its behalf by:
Brian Beamish Chairman
Barrie van der Merwe Chief Financial Officer

www.lonmin.com
Consolidated Statement of Changes in Equityfor the year ended 30 September
01 /Strategic R
eport02 /
Governance
03 /Financial S
tatements
04 /A Deeper Look
05 /Shareholder Inform
ation/ 127Lonmin Plc
Annual Report and Accounts 2016
Equity interest
Called Share Non-up share premium Other Accumulated controlling Totalcapital account reserves i lossii Total interests iii equity
$m $m $m $m $m $m $m
At 1 October 2015 586 1,448 88 (493) 1,629 (109) 1,520Loss for the year – – – (342) (342) (58) (400)Total other comprehensive expenses: – – – (1) (1) – (1)– Deferred tax on items taken directly to the statement of comprehensive income – – – (1) (1) – (1)
Transactions with owners, recognised directly in equity: – 368 – 15 383 – 383– Share-based payments – – – 15 15 – 15– Share capital and share premium recognised on equity issuance v – 395 – – 395 – 395
– Equity issue costs charged to share premium v – (27) – – (27) – (27)
At 30 September 2016 586 1,816 88 (821) 1,669 (167) 1,502
Equity interest
RetainedCalled Share earnings / Non-
up share premium Other (Accumulated controlling Totalcapital account reserves i loss) ii Total interests iii equity
$m $m $m $m $m $m $m
At 1 October 2014 570 1,411 88 1,164 3,233 149 3,382Loss for the year – – – (1,661) (1,661) (238) (1,899)Total other comprehensive expenses: – – – (11) (11) (1) (12)– Change in fair value of available for sale financial assets – – – (4) (4) – (4)
– Foreign exchange loss on retranslation of equity accounted investment – – – (7) (7) (1) (8)
Transactions with owners,recognised directly in equity: 16 37 – 15 68 (19) 49– Share-based payments – – – 15 15 – 15– Shares issued on exercise of share options iv 3 – – – 3 – 3
– Share capital and share premium recognised on the BEE transaction 13 37 – – 50 – 50
– Dividends (note 9) – – – – – (19) (19)
At 30 September 2015 586 1,448 88 (493) 1,629 (109) 1,520
Footnotes:i Other reserves at 30 September 2016 represent the capital redemption reserve of $88 million (2015 – $88 million).
ii (Accumulated loss) / retained earnings include a $17 million debit of accumulated exchange on retranslation of equity accounted investments (2015 – $17 million debit).
iii Non-controlling interests represent a 13.76% effective shareholding in each of EPL, WPL and Messina Limited and a 19.87% effective shareholding in Akanani.
iv During the year 378,978 share options were exercised (2015 – 3,120,687) on which $38 of cash was received (2015 – $3 million).
v See note 29 for more detail regarding the Rights Issue.
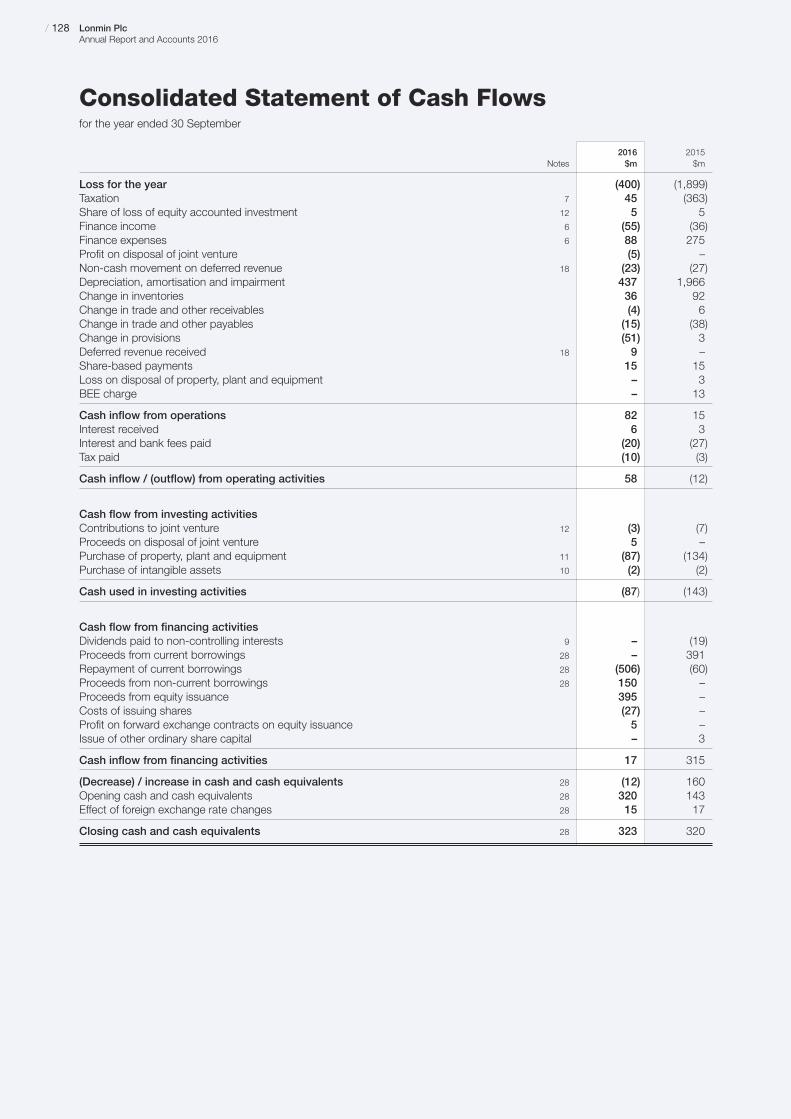
Consolidated Statement of Cash Flowsfor the year ended 30 September
/ 128 Lonmin PlcAnnual Report and Accounts 2016
2016 2015Notes $m $m
Loss for the year (400) (1,899)Taxation 7 45 (363)Share of loss of equity accounted investment 12 5 5Finance income 6 (55) (36)Finance expenses 6 88 275Profit on disposal of joint venture (5) –Non-cash movement on deferred revenue 18 (23) (27)Depreciation, amortisation and impairment 437 1,966Change in inventories 36 92Change in trade and other receivables (4) 6Change in trade and other payables (15) (38)Change in provisions (51) 3Deferred revenue received 18 9 –Share-based payments 15 15Loss on disposal of property, plant and equipment – 3BEE charge – 13
Cash inflow from operations 82 15Interest received 6 3Interest and bank fees paid (20) (27)Tax paid (10) (3)
Cash inflow / (outflow) from operating activities 58 (12)
Cash flow from investing activitiesContributions to joint venture 12 (3) (7)Proceeds on disposal of joint venture 5 –Purchase of property, plant and equipment 11 (87) (134)Purchase of intangible assets 10 (2) (2)
Cash used in investing activities (87) (143)
Cash flow from financing activitiesDividends paid to non-controlling interests 9 – (19)Proceeds from current borrowings 28 – 391Repayment of current borrowings 28 (506) (60)Proceeds from non-current borrowings 28 150 –Proceeds from equity issuance 395 –Costs of issuing shares (27) –Profit on forward exchange contracts on equity issuance 5 –Issue of other ordinary share capital – 3
Cash inflow from financing activities 17 315
(Decrease) / increase in cash and cash equivalents 28 (12) 160Opening cash and cash equivalents 28 320 143Effect of foreign exchange rate changes 28 15 17
Closing cash and cash equivalents 28 323 320

www.lonmin.com
Notes to the Accounts
1 Statement on accounting policiesReporting entityLonmin Plc (the “Company”) is a company incorporated in the UK. The address of the Company’s registered office is 4 Grosvenor Place, London, SW1X 7YL. The consolidated financial statements of the Company as at and for the yearended 30 September 2016 comprise the Company and its subsidiaries (together referred to as the “Group”) and the Group’sinterest in equity accounted investments.
Basis of preparation
Statement of complianceThe Group and Company financial statements have been prepared in accordance with International Financial ReportingStandards as adopted by the EU (adopted IFRSs) and approved by the Directors on this basis. The parent company financialstatements present information about the Company as a separate entity and not about its Group.
The financial statements were approved by the Board of Directors on 13 November 2016.
Basis of measurementThe financial statements are prepared on the historical cost basis except for the following:
Derivative financial instruments are measured at fair value.•
Available for sale assets are measured at fair value.•
Liabilities for cash settled share-based payment arrangements are measured at fair value.•
Non-current assets held for sale are stated at the lower of their carrying amount and fair value less cost to sell.•
Going concernIn determining the appropriate basis of preparation of the financial statements, the Directors are required to consider whetherthe Group can continue in operational existence for the foreseeable future.
The debt facilities available to the Group are summarised as follows:
Revolving credit facilities totalling $71 million and a $150 million term loan, at a Lonmin Plc level.•
Revolving credit facility totalling R1,980 million, at Western Platinum Limited (WPL) level.•
This capital structure places the Group in a strong financial position to ride the normal working capital cycles while providing a buffer to withstand the effects of operational shocks that the business may face. The financial performance of the Group is also dependent upon the wider economic environment in which the Group operates. Factors exist which are outside thecontrol of management which can have a significant impact on the business, specifically, volatility in PGM commodity pricesand the Rand / US Dollar exchange rate.
In assessing the Group’s ability to continue as a going concern, the Directors have prepared cash flow forecasts for a period inexcess of 12 months. Various scenarios have been considered to test the Group’s resilience against operational risks including:
Adverse movements in PGM commodity prices and Rand / US Dollar exchange rate or a combination thereof;•
Failure to meet forecast production targets.•
The Directors have concluded that the Group’s capital structure provides sufficient headroom to cushion against downsideoperational risks and minimises the risk of breaching debt covenants.
As a result, the Directors believe that the Group will continue to meet its obligations as they fall due and comply with itsfinancial covenants and accordingly have formed a judgement that it is appropriate to prepare the financial statements on a going concern basis. Therefore, these financial statements do not include any adjustments that would result if the going concern basis of preparation is inappropriate.
Functional and presentation currencyThe consolidated financial statements are presented in US Dollars (rounded to the nearest million), which is the functionalcurrency of the Company and its principal operations.
Use of estimates and judgementsThe preparation of financial statements in conformity with adopted IFRSs requires the Directors to make judgements,estimates and assumptions that affect the application of accounting policies and the reported amounts of assets, liabilities,income and expenses. Actual results may differ from these estimates.
Estimates and underlying assumptions are reviewed on an ongoing basis. Revisions to accounting estimates are recognisedin the period in which the estimates are revised and in any future periods affected.
Judgements that have been made in the process of applying accounting policies and that have the most significant effect on the amounts recognised in the financial statements, and estimates made that have a significant risk of resulting in amaterial adjustment to the carrying amounts of assets and liabilities within the next financial year, are as follows:
01 /Strategic R
eport02 /
Governance
03 /Financial S
tatements
04 /A Deeper Look
05 /Shareholder Inform
ation/ 129Lonmin Plc
Annual Report and Accounts 2016

Notes to the Accounts
1 Statement on accounting policies (continued)Basis of preparation (continued)
Impairment of non-financial assetsIn determining the recoverable amount of goodwill, intangible assets and property, plant and equipment, judgement isrequired in determining key inputs into valuation models. The key assumptions, and the Directors approach for determiningthese, are described in the policy on Impairment – Non–financial assets.
Recoverability of the HDSA receivableAs described in the policy on Impairment – financial assets, an assessment is made at each reporting period to determinewhether there is objective evidence that the HDSA receivable is impaired. This assessment for indicators of a loss event,involves a high degree of judgement.
The assessment is based on the value of the security which is primarily driven by the value of Incwala’s underlyinginvestments in WPL, EPL and Akanani. The same valuation models for the Marikana and Akanani CGU’s that are prepared to assess “Impairment of non-financial assets” above are used as the basis for determining the value of Incwala’s investments.Thus similar judgements apply around the determination of key assumptions in those valuation models.
The results of this assessment as well as sensitivities are described in note 19a.
Physical quantities of inventory (excluding consumables)Inventory is held in a wide variety of forms across the value chain reflecting the stage of refinement. Prior to production as finalmetal the inventory is always contained within a carrier material. As such inventory is typically sampled and assays taken todetermine the metal content and how this is split by metal. Measurement and sampling accuracy can vary quite significantlydepending on the nature of the vessels and the state of the material. An allowance for estimation uncertainty is applied to thevarious categories of inventory and is dependent on the degree to which the nature and state of material allows for accuratemeasurement and sampling. The range used for the estimation allowance is between 2% and 5%. The percentage used isbased on the level of confidence obtained from the outcome of the stock take. Those results are applied in arriving at theappropriate quantities of inventory.
Net realisable value of inventory (excluding consumables)Inventory is measured at the lower of cost and estimated net realisable value. Metal stock that has a cost that is more thanthe net realisable value is written down to its net realisable value. Market listed PGM prices adjusted for downstream recoverylosses and processing costs (based on the latest cumulative unit cost per ounce) are used as the basis of determining the netrealisable value. The range used for the net realisable value calculation varies between 87% and 99% depending on the typeof material and the stage of refinement of the material.
Restructuring cost provisionThe provision for restructuring costs were calculated using the separation costs already paid per person to those who exitedbefore year end as a base for the cost estimation.
New standards and amendments in the yearThe following revised IFRSs have been adopted in these financial statements. The application of these IFRSs did not have any material impact on the amounts reported for the current and prior years:
Annual Improvements to IFRSs 2010-2012 cycle and 2011-2013 cycle – amendments to IFRS 1, 2, 3, 8 and 13 and •IAS 16, 24, 38 and 40.
EU endorsed IFRS not yet applied by the GroupThe Group has not early adopted any standard, interpretation or amendment that was issued, but not yet effective. The Groupwill consider the impact on the financial statements of relevant forthcoming standards during the coming year, including IFRS 15 – Revenue from Contracts with Customers, IFRS 16 – Leases and IFRS 9 – Financial Instruments.
Significant accounting policiesThe accounting policies set out below have, unless otherwise stated, been applied consistently to all periods presented in these Group financial statements, and have been applied consistently by Group entities.
Basis of consolidation
SubsidiariesSubsidiaries are entities controlled by the Group. The Group controls an entity when it is exposed to, or has rights to, variable returns from its involvement with the entity and has the ability to affect those returns through its power over the entity.In assessing control, the Group takes into consideration potential voting rights that are currently exercisable. The acquisitiondate is the date on which control is transferred to the acquirer. The financial statements of subsidiaries are included in theconsolidated financial statements from the date that control commences until the date that control ceases. Losses applicableto the non-controlling interests in a subsidiary are allocated to the non-controlling interests even if doing so causes thenon-controlling interests to have a deficit balance.
Where necessary, adjustments are made to the financial statements of subsidiaries, associates and joint ventures to bring the accounting policies used in line with those used by the Group.
/ 130 Lonmin PlcAnnual Report and Accounts 2016
www.lonmin.com
Notes to the Accounts
1 Statement on accounting policies (continued)Basis of consolidation (continued)
Change in subsidiary ownership and loss of controlChanges in the Group’s interest in a subsidiary that do not result in a loss of control are accounted for as equity transactions.
Where the Group loses control of a subsidiary, the assets and liabilities are derecognised along with any related NCI and othercomponents of equity. Any resulting gain or loss is recognised in profit or loss. Any interest retained in the former subsidiary is measured at fair value when control is lost.
AssociatesAssociates are those entities in which the Group has significant influence, but not control, over the financial and operatingpolicies. Significant influence is presumed to exist when the Group holds between 20 and 50 percent of the voting power ofanother entity.
Application of the equity method to associates and joint venturesAssociates and joint ventures are accounted for using the equity method (equity accounted investees) and are initiallyrecognised at cost. The Group’s investment includes goodwill identified on acquisition, net of any accumulated impairmentlosses. The consolidated financial statements include the Group’s share of the total comprehensive income and equitymovements of equity accounted investees, from the date that significant influence or joint control commences until the datethat significant influence or joint control ceases. When the Group’s share of losses exceeds its interest in an equity accountedinvestee, the Group’s carrying amount is reduced to nil and recognition of further losses is discontinued except to the extentthat the Group has incurred legal or constructive obligations or made payments on behalf of an investee.
Where an associate owns an equity interest in a Group entity an adjustment is made to the equity accounting and the non-controlling interest to avoid double counting. Any difference between the adjustment to the investment in the associateand non-controlling interest is taken direct to equity.
Transactions eliminated on consolidationIntra-Group balances and transactions, and any unrealised income and expenses arising from intra-Group transactions, areeliminated in preparing the consolidated financial statements. Unrealised gains arising from transactions with associates andjoint ventures are eliminated against the investment to the extent of the Group’s interest in the investee. Unrealised losses areeliminated in the same way as unrealised gains, but only to the extent that there is no evidence of impairment.
Foreign currencyTransactions denominated in foreign currencies are translated into the respective functional currencies of the Group entities using the exchange rates prevailing at the dates of transactions. Monetary assets and liabilities denominated in foreigncurrencies at the financial reporting date are retranslated into the functional currency at the rates of exchange ruling at thefinancial reporting date. Non-monetary assets and liabilities are translated at the historic rate.
Foreign currency differences arising on retranslation are recognised in the income statement, except for differences arising onthe retranslation of available for sale financial assets and equity accounted investments which are recognised directly in equity.
Foreign currency gains and losses are reported on a net basis.
RevenueRevenue is derived from the sale of metal inventories and is measured at the fair value of consideration received or receivable,after deducting discounts, volume rebates, value added tax and other sales taxes. A sale is recognised when: the significantrisks and rewards of ownership have passed to the buyer (this is generally when title and insurance risk have passed to thecustomer, and the goods have been delivered to a contractually agreed location); recovery of the consideration is probable;the associated costs and possible return of goods can be estimated reliably; there is no continuing management involvementwith the goods, and the amount of revenue can be measured reliably. In certain circumstances, for example sometimes in thesale of part-processed material, metal prices at the point of sale may be provisional. The impact of changes in metal prices to the point of settlement are reflected through revenue and receivables.
All third party metal sales are recognised as revenue. The Group does not credit capitalised development costs with incomearising from production in development phases but rather recognises such metal as inventory (see Inventories policy).
Finance income and expensesFinance income comprises interest on funds invested (including available for sale financial assets), dividend income, gains on the disposal of available for sale financial assets net of costs of disposal and gains on hedging instruments that arerecognised in the income statement.
Interest income is accrued on a time basis by reference to the principal outstanding and the effective interest rate applicable.
Dividend income from investments is recognised when the Group’s rights to receive payment have been established.
Finance expenses comprise interest expense on borrowings, bank fees (including bank fees which are capitalised andamortised over the life of the facility), unwinding of discount on provisions and losses on hedging instruments that arerecognised in the income statement.
01 /Strategic R
eport02 /
Governance
03 /Financial S
tatements
04 /A Deeper Look
05 /Shareholder Inform
ation/ 131Lonmin Plc
Annual Report and Accounts 2016

Notes to the Accounts
1 Statement on accounting policies (continued)Finance income and expenses (continued)All borrowing costs are recognised in the income statement using the effective interest method except for borrowing costswhich are directly attributable to the acquisition, or construction of an asset. Such costs are capitalised to property, plant and equipment or intangible assets during the period of construction or development provided that future economic benefit is considered probable. Capitalised interest is shown as interest paid in the consolidated statement of cash flows.
The Company’s accounting policies in respect of the hybrid financial instrument issued to it by Phembani, its BEE partner, are detailed in the financial instruments section.
ExpenditureExpenditure is recognised in respect of goods and services received.
Research and developmentResearch expenditure is charged to the income statement in the period in which it is incurred.
Development expenditure which meets the recognition criteria for an intangible asset under IAS 38 – Intangible Assets, is capitalised and then amortised over the useful economic life of the developed asset, otherwise it is charged to the incomestatement as incurred. Borrowing costs related to the development of qualifying assets are capitalised.
Capitalised development expenditure is recognised at cost, and subsequently carried at cost less any accumulated impairmentlosses, where it can be demonstrated that the expenditure will result in completion of an asset which, when available for useor sale, will result in future economic benefit arising for the Group.
Exploration and evaluation expenditureExploration and evaluation expenditure relates to costs incurred on the exploration for and evaluation of potential mineralreserves and includes costs relating to the following: acquisition of exploration rights; conducting geological studies; exploratorydrilling and sampling and evaluating the technical feasibility and commercial viability of extracting a mineral resource as well as capitalised interest.
Expenditure incurred on activities that precede exploration for and evaluation of mineral resources, being all expenditureincurred prior to securing the legal rights to explore an area, is expensed immediately.
Expenditure towards in-house exploration for and evaluation of potential mineral reserves for each area of interest is expenseduntil it is considered probable that future economic benefit will arise through further exploration and subsequent developmentof the area of interest or, alternatively, by its sale.
Pre-feasibility studies involve the review of one or more potential development options with the aim of moving forward to themore detailed feasibility study stage. Expenditure related to such studies is expensed in full as there is insufficient certaintythat future economic benefit will be generated at this stage of a project.
Expenditure relating to feasibility studies which support the technical feasibility and commercial viability of an area is capitalisedunder exploration and evaluation assets.
Where a feasibility study reaches a favourable conclusion, accumulated exploration and evaluation costs are transferred tomineral rights within intangibles or capital work in progress within property, plant and equipment as appropriate oncommencement of the development phase of the related project. Where the feasibility study reaches an adverse conclusion,any previously capitalised exploration and evaluation expenditure is written off immediately.
Expenditure on purchased exploration and evaluation assets is capitalised at cost at the time of purchase. Subsequent expendituremay be capitalised at cost. Carrying values are subject to impairment reviews as per the Group’s policy. Exploration andevaluation expenditure is classified as property, plant and equipment or intangible depending on the nature of the expenditure.
Capitalised exploration and evaluation expenditure is a class of assets which are not available for use. Therefore amortisationis not provided on such assets.
Mineral mining rights, which are obtained following the completion of a feasibility study, are not included within exploration and evaluation expenditure. They are capitalised at cost under IAS 38 – Intangible Assets and are amortised on a units ofproduction basis over the life of the mine.
Share-based paymentsFrom the grant date, the fair value of options granted to employees is recognised as an employee expense, with acorresponding increase in equity, over the period that the employees become unconditionally entitled to the shares.
The fair value of the amount payable to employees in respect of share appreciation rights, which are settled in cash, is recognised as an expense, with a corresponding increase in liabilities, over the period that the employees becomeunconditionally entitled to payment. The liability is remeasured at each reporting date and at settlement date. Any changes in the fair value of the liability are recognised as a personnel expense in the income statement.
The fair value of each option or share appreciation right is determined using either a Black-Scholes option pricing model or a MonteCarlo projection model, depending on the type of the award. Market related performance conditions are reflected in the fair valueof the share. Non-market related performance conditions are allowed for using a separate assumption about the number of awardsexpected to vest; the final charge made reflects the numbers actually vested on the basis that non-market conditions are met.
/ 132 Lonmin PlcAnnual Report and Accounts 2016
www.lonmin.com
Notes to the Accounts
1 Statement on accounting policies (continued)Pensions and other post-retirement benefitsThe Group operates a number of defined contribution schemes in accordance with local regulations. A defined contributionplan is a post-employment benefit plan under which the Group pays fixed contributions into a separate legal entity and has no legal or constructive obligation to pay further amounts. Obligations for contributions to defined contribution pension plansare recognised as an employee benefit expense in the income statement when they are due.
TaxationIncome tax expense comprises current and deferred tax. Income tax is recognised in the income statement except to theextent that it relates to items recognised directly in equity, in which case it is recognised in equity.
Current tax is the expected tax to be paid or recovered on the taxable income for the year, using the tax rates enacted orsubstantively enacted at the reporting date during the periods being reported upon, and any adjustments to tax payable in respect of previous years.
Deferred tax as directed by IAS 12 – Income Taxes is recognised in respect of certain temporary differences identified at the financial reporting date. Temporary differences are differences between the carrying amount of the Group’s assets andliabilities and their tax base.
A deferred tax liability is recognised in a business combination in respect of any identified fair value adjustments representingthe difference between the fair value of the acquired asset and its tax base. Recognition of a deferred tax liability in respect of such a difference gives rise to a corresponding increase in goodwill recognised in the consolidated statement of financialposition.
Deferred tax liabilities are offset against deferred tax assets within the same taxable entity or qualifying local tax group wherethe entities have the right to settle current tax liabilities net. Any remaining deferred tax asset is recognised only when, on the basis of all available evidence, it can be regarded as probable that there will be suitable taxable profits, within the samejurisdiction, in the foreseeable future against which the deductible temporary difference can be utilised.
Deferred tax is provided on temporary differences arising in relation to investments in subsidiaries, jointly controlled entitiesand associates, except where the timing of the reversal of the temporary difference can be controlled and it is probable that the temporary difference will not reverse in the foreseeable future.
Business combinations and goodwillSubject to the transitional relief in IFRS 1, all business combinations are accounted for by applying the acquisition method.Business combinations are accounted for using the acquisition method as at the acquisition date, which is the date on whichcontrol is transferred to the Group.
Acquisitions on or after 1 January 2010For acquisitions on or after 1 January 2010, the Group measures goodwill at the acquisition date as:
the fair value of the consideration transferred; plus•
the recognised amount of any non-controlling interests in the acquiree; plus•
the fair value of the existing equity interest in the acquiree; less•
the net recognised amount (generally fair value) of the identifiable assets acquired and liabilities assumed.•
When the excess is negative, a bargain purchase gain is recognised immediately in profit or loss.
Costs related to the acquisition, other than those associated with the issue of debt or equity securities, are expensed as incurred.
Any contingent consideration payable is recognised at fair value at the acquisition date. If the contingent consideration is classified as equity, it is not remeasured and settlement is accounted for within equity. Otherwise, subsequent changes to the fair value of the contingent consideration are recognised in profit or loss.
On a transaction-by-transaction basis, the Group elects to measure non-controlling interests either at its fair value or at its proportionate interest in the recognised amount of the identifiable net assets of the acquiree at the acquisition date.
Acquisitions and disposals of non-controlling interestsAcquisitions and disposals of non-controlling interests that do not result in a change of control are accounted for astransactions with owners in their capacity as owners and therefore no goodwill is recognised as a result of such transactions.The adjustments to non-controlling interests are based on a proportionate amount of the net assets of the subsidiary. Any difference between the price paid or received and the amount by which non-controlling interests are adjusted isrecognised directly in equity and attributed to the owners of the parent.
Prior to the adoption of IAS 27 (2008), goodwill was recognised on the acquisition of non-controlling interests in a subsidiary,which represented the excess of the cost of the additional investment over the carrying amount of the interest in the netassets acquired at the date of the transaction.
01 /Strategic R
eport02 /
Governance
03 /Financial S
tatements
04 /A Deeper Look
05 /Shareholder Inform
ation/ 133Lonmin Plc
Annual Report and Accounts 2016

Notes to the Accounts
1 Statement on accounting policies (continued)Intangible assetsIntangible assets, other than goodwill, acquired by the Group have finite useful lives and are measured at cost lessaccumulated amortisation and accumulated impairment losses. Where amortisation is charged on these assets, the expenseis taken to the income statement through operating costs.
Amortisation of mineral rights is provided on a ‘units of production’ basis over the remaining life of mine to residual value (20 to 40 years).
All other intangible assets are amortised over their useful economic lives subject to a maximum of 20 years and are tested for impairment at each reporting date when there is an indication of a possible impairment.
Property, plant and equipment
RecognitionProperty, plant and equipment is included in the statement of financial position at cost and subsequently less accumulateddepreciation and any accumulated impairment losses.
Costs include expenditure that is directly attributable to the acquisition of the asset. The cost of self-constructed assetsincludes the cost of materials and direct labour, any other costs directly attributable to bringing the asset to a workingcondition for its intended use, and any other costs of dismantling and removing the items and restoring the site on which theyare located. Cost may also include transfers from equity of any gain or loss on qualifying cash flow hedges of foreign currencypurchases of property, plant and equipment. Borrowing costs incurred on the acquisition or construction of qualifying assetsare capitalised to the cost of the asset.
Gains and losses on disposals of an item of property, plant and equipment are determined by comparing the proceeds on disposal with the carrying value of property, plant and equipment and are recognised net in the income statement.
ComponentisationWhen significant parts of an item of property, plant and equipment have different useful lives, they are accounted for asseparate items (major components) of property, plant and equipment.
The cost of replacing part of an item of property, plant and equipment is recognised in the carrying amount of the item if it is probable that the future economic benefits embodied within the part will flow to the Group and its cost can be measuredreliably. The carrying amount of the replaced part is derecognised upon replacement. The costs of the day-to-day servicing of property, plant and equipment are recognised in the income statement as incurred.
Capital work in progressDevelopment costs are capitalised and transferred to the appropriate category of property, plant and equipment whenavailable for use.
Capitalised development costs include expenditure incurred to develop new operations and to expand existing capacity.Costs include interest capitalised during the period up to the level that the qualifying assets permit.
DepreciationDepreciation is provided on a straight-line or units of production basis as appropriate over their expected useful lives or theremaining life of mine, if shorter, to residual value. The life of mine is based on proven and probable reserves. The expecteduseful lives of the major categories of property, plant and equipment are as follows:
Method Rate
Shafts and underground Units of production 2.5% – 5.0% per annum 20 – 40 yearsMetallurgical Straight line 2.5% – 7.1% per annum 14 – 40 yearsInfrastructure Straight line 2.5% – 2.9% per annum 35 – 40 yearsOther plant and equipment Straight line 2.5% – 50.0% per annum 2 – 40 years
No depreciation is provided on surface mining land which has a continuing value and capital work in progress.
Residual values and useful lives are re-assessed annually and if necessary changes are accounted for prospectively.
Impairment – Non-financial assets (excluding inventories and deferred tax)The Group’s principal non-financial assets (excluding inventories and deferred tax assets) are property, plant and equipment,intangibles and goodwill associated with mining and processing activities. For the purpose of assessing recoverable amounts,these assets are grouped into cash generating units (CGUs). The Group’s two key CGU’s are:
Marikana, which includes Western Platinum Limited (WPL) and Eastern Platinum Limited (EPL). The Marikana CGU minesi)and processes substantially all of the ore produced by the Group; and
Akanani Mining (Proprietary) Limited (Akanani), an exploration and evaluation asset located on the Northern Limb of theii)Bushveld Complex in South Africa.
/ 134 Lonmin PlcAnnual Report and Accounts 2016
www.lonmin.com
Notes to the Accounts
1 Statement on accounting policies (continued)Impairment – Non-financial assets (excluding inventories and deferred tax) (continued)The Group also includes the Limpopo CGU which is currently on care and maintenance.
Recoverable amount is the higher of fair value less costs to sell and value in use. At each financial reporting date, the Groupassesses whether there is any indication that those assets are impaired. If any such indication exists, the recoverable amountof the assets is estimated in order to determine the extent of the impairment (if any).
Goodwill and intangible assets with an indefinite useful life are tested for impairment annually, regardless of whether anindication of impairment exists.
Items of property, plant and equipment that are not in use are reviewed annually for impairment on a fair value less costs to sell basis.
If the recoverable amount of an asset (or CGU) is estimated to be less than its carrying amount, the carrying amount of theasset (or CGU) is reduced to its recoverable amount. Any impairment is recognised immediately as an expense.
Value in useIn assessing value in use, the estimated future cash flows, based on the most up to date business forecasts or studies forexploration and evaluation assets, are discounted to their present value using a pre-tax discount rate that reflects currentmarket assessments of the time value of money and the risks specific to the assets for which estimates of future cash flowshave not been adjusted.
Management uses past experience and assessment of future conditions, together with external sources of information in order to assign values to the key assumptions.
Management projects cash flows over the life of the relevant mining operation which is significantly greater than 5 years.Projecting cash flows over a period longer than 5 years is in line with industry practice and is supported by the Group’s historyof the resources expected to be found being proven to exist. Management does not apply a growth rate because a detailedlife of mine plan is used to forecast future production volumes.
For each CGU, a risk-adjusted pre-tax discount rate is used for impairment testing. The key factors affecting the risk premium applied are the relevant stage of the development of the asset in the CGU (extensions to existing operations havingsignificantly lower risk than evaluation projects for example), the level of knowledge and consistency of the orebody andsovereign risk.
Fair value less costs to sellFair value less costs to sell is determined by reference to the best information available to reflect the amount that the Groupcould receive for the CGU in an arm’s length transaction.
When comparable market transactions or public valuations of similar assets exist these are used as a source of evidence.However, the Group believes that mining CGUs tend to be unique and have their value determined largely by the nature of theunderlying orebody. The fair value therefore is typically determined by calculating the value of the CGU using an appropriatevaluation methodology such as calculating the post-tax net present value using a discounted cash flow forecast (as describedin value in use).
The fair value less costs to sell for Limpopo has been calculated using resource multiples from comparable market transactions.
Exploration and evaluation assetsUnder IFRS 6 exploration and evaluation assets are assessed for impairment when facts and circumstances suggest that thecarrying amount of the assets may exceed their recoverable amount. When this occurs, any impairment loss is immediatelycharged to the income statement.
Impairment – Financial assets (including receivables)A financial asset not carried at fair value through profit or loss is assessed at each reporting date to determine whether there is objective evidence that it is impaired. A financial asset is impaired if objective evidence indicates that a loss event hasoccurred after the initial recognition of the asset, and that the loss event had a negative effect on the estimated future cashflows of that asset that can be estimated reliably.
An impairment loss in respect of a financial asset measured at amortised cost is calculated as the difference between itscarrying amount and the present value of the estimated future cash flows discounted at the asset’s original effective interestrate. Interest on the impaired asset continues to be recognised through the unwinding of the discount. When a subsequentevent causes the amount of impairment loss to decrease, the decrease in impairment loss is reversed through profit or loss.
Reversal of impairmentAt each financial reporting date, the Group assesses whether there is any indication that a previously recognised impairmentloss has reversed. An impairment loss is reversed if there has been a change in the estimates used to determine therecoverable amount. An impairment loss is only reversed to the extent that the asset’s carrying amount does not exceed thecarrying amount that would have been determined, net of depreciation and amortisation, had the impairment not been made.A reversal of impairment is recognised as income immediately except for previously impaired goodwill which is never reversed.
01 /Strategic R
eport02 /
Governance
03 /Financial S
tatements
04 /A Deeper Look
05 /Shareholder Inform
ation/ 135Lonmin Plc
Annual Report and Accounts 2016
Notes to the Accounts
1 Statement on accounting policies (continued)LeasesRentals under operating leases are charged to the income statement on a straight-line basis.
Assets held for saleWhen an asset’s carrying value will be recovered principally through a sale transaction, to take place within twelve months of the financial reporting date, rather than through continuing use it is classified as held for sale and stated at the lower ofcarrying value and fair value less costs to sell. No depreciation is charged in respect of non-current assets classified as heldfor sale. Immediately prior to sale the assets are remeasured in accordance with the Group’s accounting policies.
InventoriesInventories are valued at the lower of cost (which includes the applicable proportion of production overheads) and netrealisable value.
PGMs inventory is valued by allocating costs, based on the joint cost of production, apportioned according to the relativesales value of each of the PGMs produced.
By-product metals are valued at the incremental cost of production from the point of split-off from the PGM processing stream.
In the process of initially developing the ore reserve it is common that metal is produced, although not at normal operatinglevels. Development is split into different phases according to the mining method used with differing levels of productionexpected in each phase. The Group recognises the metal produced in each development phase in inventory with anappropriate proportion of cost as operating costs. This allocation is calculated by reference to the produced volumes in relation to the total volumes expected from the development.
Cash and cash equivalentsCash and cash equivalents comprise cash in hand and current balances with banks and similar institutions, which are readilyconvertible into known amounts of cash and which are subject to insignificant risk of changes in value and have an originalmaturity of three months or less.
For the purpose of the consolidated statement of cash flows, cash and cash equivalents consist of cash and cash equivalentsas defined above, net of outstanding bank overdrafts as the bank overdraft is repayable on demand and forms an integral partof the Group’s cash management.
Rehabilitation costsRehabilitation costs are provided in full based on estimates of the future costs to be incurred, calculated on a discountedbasis. As the provision is recognised, it is either capitalised as part of the cost of the related mine or written off to the incomestatement if utilised within one year. Where costs are capitalised the impact of such costs on the income statement is spreadover the life of mine through the accretion of the discount of the provision and the depreciation over a units of productionbasis of the increased costs of the mining assets.
ProvisionsProvision is made when a present or legal obligation exists for a future liability in respect of a past event and where theamount of the obligation can be estimated reliably, and it is probable that an outflow of economic benefits will be required to settle the obligation. Provisions are determined by discounting the expected future cash flows at a pre-tax rate that reflectscurrent market assessments of the time value of money and the risks specific to the liability.
Financial instrumentsThe Group’s principal financial instruments (other than derivatives) comprise bank loans, available for sale financial assets,trade and other receivables, cash and cash equivalents, trade and other payables and short-term deposits.
Non-derivative financial instruments are recognised initially at fair value plus, for instruments not at fair value through theincome statement, any directly attributable transaction costs. Subsequent to initial recognition, non-derivative financialinstruments are measured as described below.
Cash and cash equivalents comprise cash balances and call deposits. These also comprise bank overdrafts that arerepayable on demand, for the purpose of the statement of cash flows only.
Investments are classified into loans and receivables, held-to-maturity and available for sale. The classification depends on the purpose for which the investments were acquired, the nature of the investments and whether the investment is quoted or not. The classification of investments is determined at initial recognition.
Loans and receivablesLoans and receivables and investments classified as held-to-maturity are carried at amortised cost and gains or losses are recognised in the income statement when the investments are derecognised or impaired, as well as through theamortisation process.
/ 136 Lonmin PlcAnnual Report and Accounts 2016
www.lonmin.com
Notes to the Accounts
1 Statement on accounting policies (continued)Financial instruments (continued)The Company is the holder of a financial instrument issued by its BEE partner, Phembani. The loan component of the hybridinstrument was recognised initially at fair value and thereafter will be held at amortised cost. The loan is denominated in Sterling.The financial instrument was translated to preference shares on 31 March 2011. The related dividends accumulate on a monthto month basis based on the same rates as the interest rates of the original financial instrument.
An assessment will be performed on the day of repayment of the preference share debt to assess the value of the investmentthat Phembani has acquired through this transaction. This value is then compared to the consideration paid and the differenceis considered to be an ‘equity upside’ which is recognised as a derivative financial instrument in the financial statements. Due to the fall in value of the investment the derivative financial instrument is valued at $nil at 30 September 2016 (2015 – $nil).
Available for sale financial assetsThe Group’s investments in equity securities and certain debt securities are classified as available for sale financial assets.Subsequent to initial recognition they are measured at fair value and any changes are recognised directly in equity except for impairment losses and, in the case of monetary items, foreign exchange gains and losses. When an investment is writtenoff or sold, any cumulative gains or losses in equity are recycled into the income statement. Fair value is determined by usingthe market price at the financial reporting date where this is available. Where market price is not available the Directors’ bestestimates of market value are used.
Bank loansBank loans are recorded at amortised cost, net of transaction costs incurred, and are adjusted to amortise transaction costsover the term of the loan.
Derivative financial instrumentsDerivative financial instruments are principally used by the Group to manage exposure to market risks from treasuryoperations and commodity price risks on by-products. The principal derivative instruments used are foreign currency swaps,interest rate swaps, forward foreign exchange contracts and forward price agreements on by-products. The Group does nothold or issue derivative financial instruments for trading or speculative purposes.
Derivative financial instruments are initially recognised in the statement of financial position at fair value and then remeasured to fair value at subsequent reporting dates. Attributable costs are recognised in profit or loss when incurred. The method of recognising the resulting gain or loss depends on whether the derivative is designated as a hedging instrument and, if so,the nature of the item being hedged. Hedging derivatives are classified on inception as fair value hedges or cash flow hedges.
On initial designation of the derivative as the hedging instrument, the Group formally documents the relationship between the hedging instrument and hedged item, including the risk management objectives and strategy in undertaking the hedgetransaction and the hedged risk, together with the methods that will be used to assess the effectiveness of the hedgingrelationship. The Group makes an assessment, both at the inception of the hedge relationship as well as on an ongoing basis,of whether the hedging instruments are expected to be “highly effective” in offsetting the changes in fair value or cash flows of the respective hedged items attributable to the hedged risk, and whether the actual results of each hedge are within a range of 80 – 125%. For a cash flow hedge of a forecast transaction, the transaction should be highly probable to occur and should present an exposure to variations in cash flows that could ultimately affect reported profit or loss.
When a derivative is designated as the hedging instrument in a hedge of the variability in cash flows attributable to a particularrisk associated with a recognised asset or liability or a highly probable forecast transaction that could affect profit or loss, the effective portion of changes in the fair value of the derivative is recognised in other comprehensive income and presentedin the hedging reserve in equity. Any gain or loss relating to the ineffective portion is recognised immediately in profit or loss.
The fair value gains and losses accumulated in equity are reclassified to profit or loss in the same period that the hedged itemaffects profit or loss. If the hedging instrument no longer meets the criteria for hedge accounting, expires or is sold, terminatedor exercised, or the designation is revoked, then hedge accounting is revoked prospectively.
Changes in the fair value of any derivative instruments that do not qualify for hedge accounting are recognised immediately in profit or loss.
The best evidence of the fair value of a financial instrument at initial recognition is the transaction price, for example, the fairvalue of the consideration given or received, unless the fair value of that instrument is evidenced by comparison with otherobservable current market transactions in the same instrument (for example without modification or repackaging) or based on a valuation technique whose variables include only data from observable markets. When transaction price provides thebest evidence of fair value at initial recognition, the financial instrument is initially measured at the transaction price and anydifference between this price and the value initially obtained from a valuation model is subsequently recognised in profit or losson a straight line basis over the life of the instrument but not later than when the valuation is supported wholly by observablemarket data or the transaction is closed out.
01 /Strategic R
eport02 /
Governance
03 /Financial S
tatements
04 /A Deeper Look
05 /Shareholder Inform
ation/ 137Lonmin Plc
Annual Report and Accounts 2016
Notes to the Accounts
1 Statement on accounting policies (continued)Segmental reportingThe core principle of IFRS 8 – Operating Segments is that an entity shall disclose information to enable users to evaluate thenature and financial effects of the business activities in which it engages and the economic environments in which it operates.On this basis, Lonmin has three reportable operating segments being:
PGM Operations – which comprise operational mines and processing facilities which are located in South Africa.•
Evaluation – which relates to the Akanani asset which is located in South Africa and is in the evaluation stage.•
Exploration – this essentially relates to the costs of exploration projects which have the objective of identifying PGM•deposits which can be commercially realised and which can occur anywhere in the world.
Segment results, assets and liabilities include items directly attributable to a segment as well as those that can be allocatedon a reasonable basis.
Segment capital expenditure is the total cost incurred during the period to acquire property, plant and equipment, andintangible assets other than goodwill, and any capitalised interest.
2 Segmental analysis
The Group distinguishes between three reportable operating segments being the Platinum Group Metals (PGM) Operationssegment, the Evaluation segment and the Exploration segment.
The PGM Operations segment comprises the activities involved in the mining and processing of PGMs, together withassociated base metals, which are carried out entirely in South Africa. These operations are integrated and designed tosupport the process for extracting and refining PGMs from underground. PGMs move through each stage of the process and undergo successive levels of refinement which result in fully refined metals. The Chief Executive Officer, who performs the role of Chief Operating Decision Maker (CODM), views the PGM Operations segment as a single whole for the purposesof financial performance monitoring and assessment and does not make resource allocations based on margin, costs or cashflows incurred at each separate stage of the process. In addition, the CODM makes his decisions for running the business on a day to day basis using the physical operating statistics generated by the business as these summarise the operatingperformance of the entire segment.
The Evaluation segment covers the evaluation through pre-feasibility of the economic viability of newly discovered PGMdeposits. Currently all of the evaluation projects are based in South Africa. The Exploration segment covers the activitiesinvolved in the discovery or identification of new PGM deposits. This activity occurs on a worldwide basis. Other covers mainlythe results and investment activities of the corporate Head Office. The only intersegment transactions involve the provision of funding between segments and any associated interest.
No operating segments have been aggregated. Operating segments have consistently adopted the consolidated basis of accounting and there are no differences in measurement applied.
/ 138 Lonmin PlcAnnual Report and Accounts 2016

www.lonmin.com
Notes to the Accounts
01 /Strategic R
eport02 /
Governance
03 /Financial S
tatements
04 /A Deeper Look
05 /Shareholder Inform
ation/ 139Lonmin Plc
Annual Report and Accounts 2016
2 Segmental analysis (continued)
2016
PGMOperations Evaluation Exploration IntersegmentSegment Segment Segment Other Adjustments Total
$m $m $m $m $m $m
Revenue (external sales by product):Platinum 720 – – – – 720Palladium 197 – – – – 197Gold 30 – – – – 30Rhodium 82 – – – – 82Ruthenium 5 – – – – 5Iridium 25 – – – – 25
PGMs 1,059 – – – – 1,059Nickel 28 – – – – 28Copper 10 – – – – 10Chrome 21 – – – – 21
1,118 – – – – 1,118
Underlying i:EBITDA / (LBITDA) ii 119 – (5) (5) – 109Depreciation, amortisation and impairment (102) – – – – (102)
Operating profit / (loss) ii 17 – (5) (5) – 7Finance income 25 – – 49 (51) 23Finance expenses (66) – – (13) 51 (28)Share of loss of equity accounted investment (5) – – – – (5)
(Loss) / profit before taxation (29) – (5) 31 – (3)Income tax charge (109) – – – – (109)
Underlying (loss) / profit after taxation (138) – (5) 31 – (112)Special items after taxation (note 3) iii (254) – 4 (38) – (288)
Loss after taxation (392) – (1) (7) – (400)
Total assets iv 1,936 9 7 1,796 (1,730) 2,018Total liabilities (1,866) (136) (60) (184) 1,730 (516)
Net assets / (liabilities) 70 (127) (53) 1,612 – 1,502
Share of net assets of equity accounted investment 24 – – – – 24Additions to property, plant, equipment and intangibles 96 2 – – – 98Material non-cash items – share-based payments 15 – – – – 15
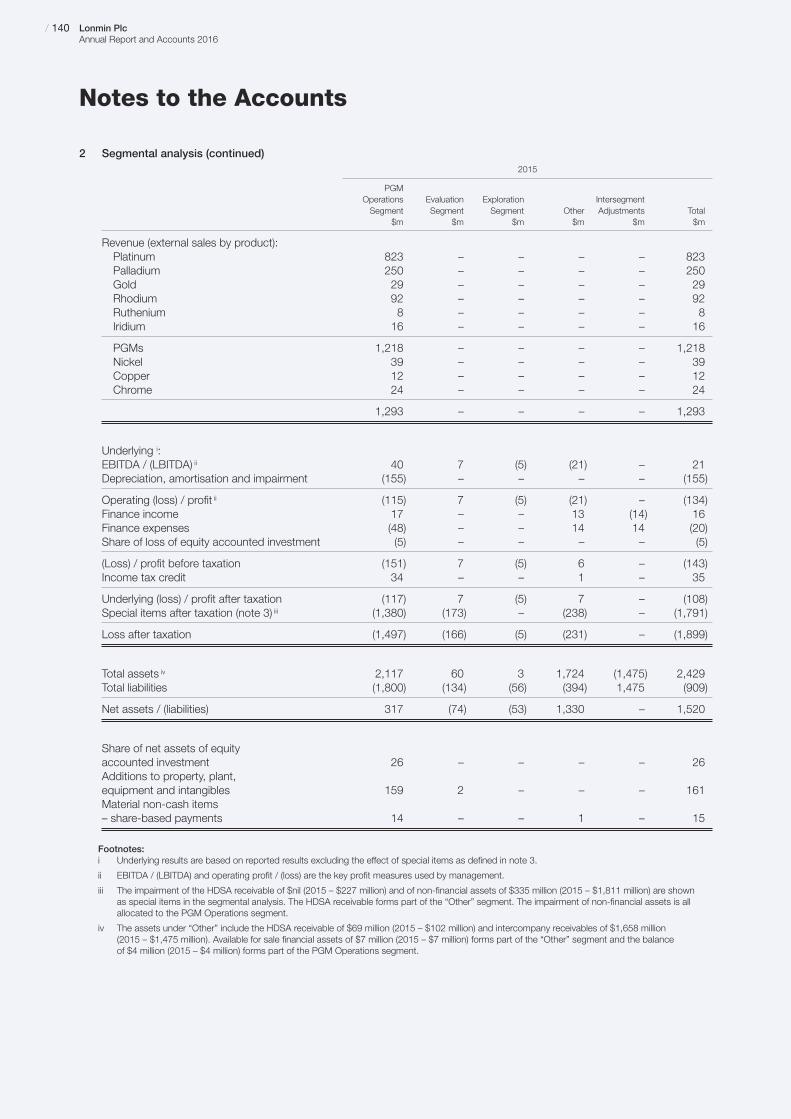
Notes to the Accounts
/ 140 Lonmin PlcAnnual Report and Accounts 2016
2 Segmental analysis (continued)2015
PGMOperations Evaluation Exploration IntersegmentSegment Segment Segment Other Adjustments Total
$m $m $m $m $m $m
Revenue (external sales by product):Platinum 823 – – – – 823Palladium 250 – – – – 250Gold 29 – – – – 29Rhodium 92 – – – – 92Ruthenium 8 – – – – 8Iridium 16 – – – – 16
PGMs 1,218 – – – – 1,218Nickel 39 – – – – 39Copper 12 – – – – 12Chrome 24 – – – – 24
1,293 – – – – 1,293
Underlying i:EBITDA / (LBITDA) ii 40 7 (5) (21) – 21Depreciation, amortisation and impairment (155) – – – – (155)
Operating (loss) / profit ii (115) 7 (5) (21) – (134)Finance income 17 – – 13 (14) 16Finance expenses (48) – – 14 14 (20)Share of loss of equity accounted investment (5) – – – – (5)
(Loss) / profit before taxation (151) 7 (5) 6 – (143)Income tax credit 34 – – 1 – 35
Underlying (loss) / profit after taxation (117) 7 (5) 7 – (108)Special items after taxation (note 3) iii (1,380) (173) – (238) – (1,791)
Loss after taxation (1,497) (166) (5) (231) – (1,899)
Total assets iv 2,117 60 3 1,724 (1,475) 2,429Total liabilities (1,800) (134) (56) (394) 1,475 (909)
Net assets / (liabilities) 317 (74) (53) 1,330 – 1,520
Share of net assets of equity accounted investment 26 – – – – 26Additions to property, plant, equipment and intangibles 159 2 – – – 161Material non-cash items – share-based payments 14 – – 1 – 15
Footnotes:i Underlying results are based on reported results excluding the effect of special items as defined in note 3.
ii EBITDA / (LBITDA) and operating profit / (loss) are the key profit measures used by management.
iii The impairment of the HDSA receivable of $nil (2015 – $227 million) and of non-financial assets of $335 million (2015 – $1,811 million) are shown as special items in the segmental analysis. The HDSA receivable forms part of the “Other” segment. The impairment of non-financial assets is allallocated to the PGM Operations segment.
iv The assets under “Other” include the HDSA receivable of $69 million (2015 – $102 million) and intercompany receivables of $1,658 million (2015 – $1,475 million). Available for sale financial assets of $7 million (2015 – $7 million) forms part of the “Other” segment and the balance of $4 million (2015 – $4 million) forms part of the PGM Operations segment.
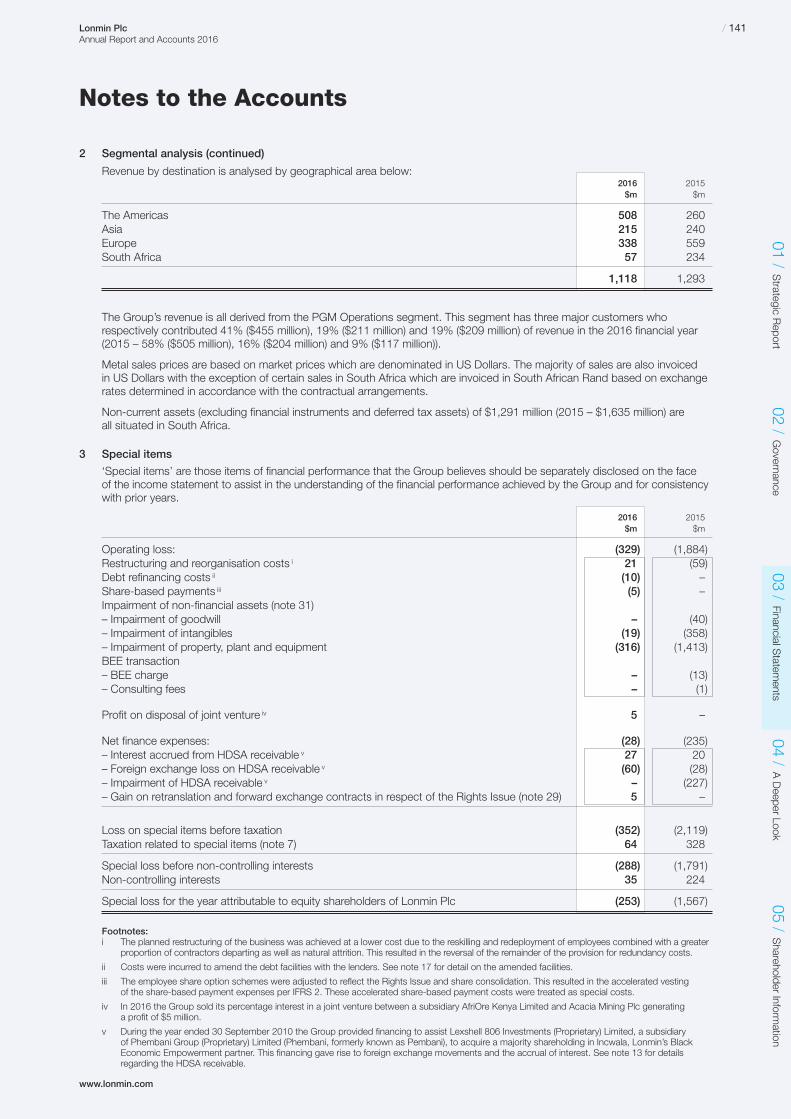
www.lonmin.com
Notes to the Accounts
2 Segmental analysis (continued)
Revenue by destination is analysed by geographical area below:2016 2015$m $m
The Americas 508 260Asia 215 240Europe 338 559South Africa 57 234
1,118 1,293
The Group’s revenue is all derived from the PGM Operations segment. This segment has three major customers whorespectively contributed 41% ($455 million), 19% ($211 million) and 19% ($209 million) of revenue in the 2016 financial year(2015 – 58% ($505 million), 16% ($204 million) and 9% ($117 million)).
Metal sales prices are based on market prices which are denominated in US Dollars. The majority of sales are also invoiced in US Dollars with the exception of certain sales in South Africa which are invoiced in South African Rand based on exchangerates determined in accordance with the contractual arrangements.
Non-current assets (excluding financial instruments and deferred tax assets) of $1,291 million (2015 – $1,635 million) are all situated in South Africa.
3 Special items
‘Special items’ are those items of financial performance that the Group believes should be separately disclosed on the face of the income statement to assist in the understanding of the financial performance achieved by the Group and for consistencywith prior years.
2016 2015$m $m
Operating loss: (329) (1,884)Restructuring and reorganisation costs i 21 (59)Debt refinancing costs ii (10) –Share-based payments iii (5) –Impairment of non-financial assets (note 31)– Impairment of goodwill – (40)– Impairment of intangibles (19) (358)– Impairment of property, plant and equipment (316) (1,413)BEE transaction– BEE charge – (13)– Consulting fees – (1)
Profit on disposal of joint venture iv 5 –
Net finance expenses: (28) (235)– Interest accrued from HDSA receivable v 27 20– Foreign exchange loss on HDSA receivable v (60) (28)– Impairment of HDSA receivable v – (227)– Gain on retranslation and forward exchange contracts in respect of the Rights Issue (note 29) 5 –
Loss on special items before taxation (352) (2,119)Taxation related to special items (note 7) 64 328
Special loss before non-controlling interests (288) (1,791)Non-controlling interests 35 224
Special loss for the year attributable to equity shareholders of Lonmin Plc (253) (1,567)
Footnotes:i The planned restructuring of the business was achieved at a lower cost due to the reskilling and redeployment of employees combined with a greater
proportion of contractors departing as well as natural attrition. This resulted in the reversal of the remainder of the provision for redundancy costs.
ii Costs were incurred to amend the debt facilities with the lenders. See note 17 for detail on the amended facilities.
iii The employee share option schemes were adjusted to reflect the Rights Issue and share consolidation. This resulted in the accelerated vesting of the share-based payment expenses per IFRS 2. These accelerated share-based payment costs were treated as special costs.
iv In 2016 the Group sold its percentage interest in a joint venture between a subsidiary AfriOre Kenya Limited and Acacia Mining Plc generating a profit of $5 million.
v During the year ended 30 September 2010 the Group provided financing to assist Lexshell 806 Investments (Proprietary) Limited, a subsidiary of Phembani Group (Proprietary) Limited (Phembani, formerly known as Pembani), to acquire a majority shareholding in Incwala, Lonmin’s BlackEconomic Empowerment partner. This financing gave rise to foreign exchange movements and the accrual of interest. See note 13 for detailsregarding the HDSA receivable.
01 /Strategic R
eport02 /
Governance
03 /Financial S
tatements
04 /A Deeper Look
05 /Shareholder Inform
ation/ 141Lonmin Plc
Annual Report and Accounts 2016

Notes to the Accounts
/ 142 Lonmin PlcAnnual Report and Accounts 2016
4 Group operating loss
Group operating loss is stated after charging / (crediting):
2016 2015$m $m
Cost of sales 942 1,226Other costs 57 77Depreciation charge – property, plant and equipment 99 148Amortisation charge – intangible assets 3 7Employee benefits of key management excluding share-based payments and attraction bonuses i 2 1Share-based payments 10 15Foreign exchange gains (2) (50)Loss on disposal of property, plant and equipment – 3Special items (note 3) 329 1,884
Footnote:i Employee benefits of key management excluding share-based payments and attraction bonuses includes $1 million (2015 – $1 million) in respect
of Directors.
Fees payable to the Group’s auditor and its associates included in operating costs:
2016 2015$m $m
Audit feeFees payable to the Group’s auditor for the audit of the Group’s annual accounts 0.5 0.8Fees payable to the Group’s auditor for the audit of the Group’s interim accounts 0.2 0.2Fees payable to the Group’s auditor for the audit of the Group’s subsidiary companies 0.4 0.5
Other assurance servicesAssurance services in respect of the Mining Charter 0.2 0.1
Non-audit servicesAdvisory services 0.7 0.1Tax compliance services 0.1 0.1
2.1 1.8
Advisory services predominantly relates to the issue of comfort letters in connection with the Rights Issue.
Fees paid to KPMG LLP and its associates for non-audit services to the Company are not disclosed in the individual accountsof Lonmin Plc because the Company’s consolidated accounts are required to disclose such fees on a consolidated basis.
5 Employees
The average number of employees and Directors during the year was as follows:
2016 2015No. No.
South Africa 24,540 26,864Europe 8 7Rest of World 4 3
24,552 26,874
The aggregate payroll costs of employees, key management and Directors were as follows:
2016 2015Employee costs $m $m
Wages and salaries 476 582Social security costs 17 21Pension costs 35 47Share-based payments 10 15Restructuring and reorganisation costs (note 3) (21) 56
517 721
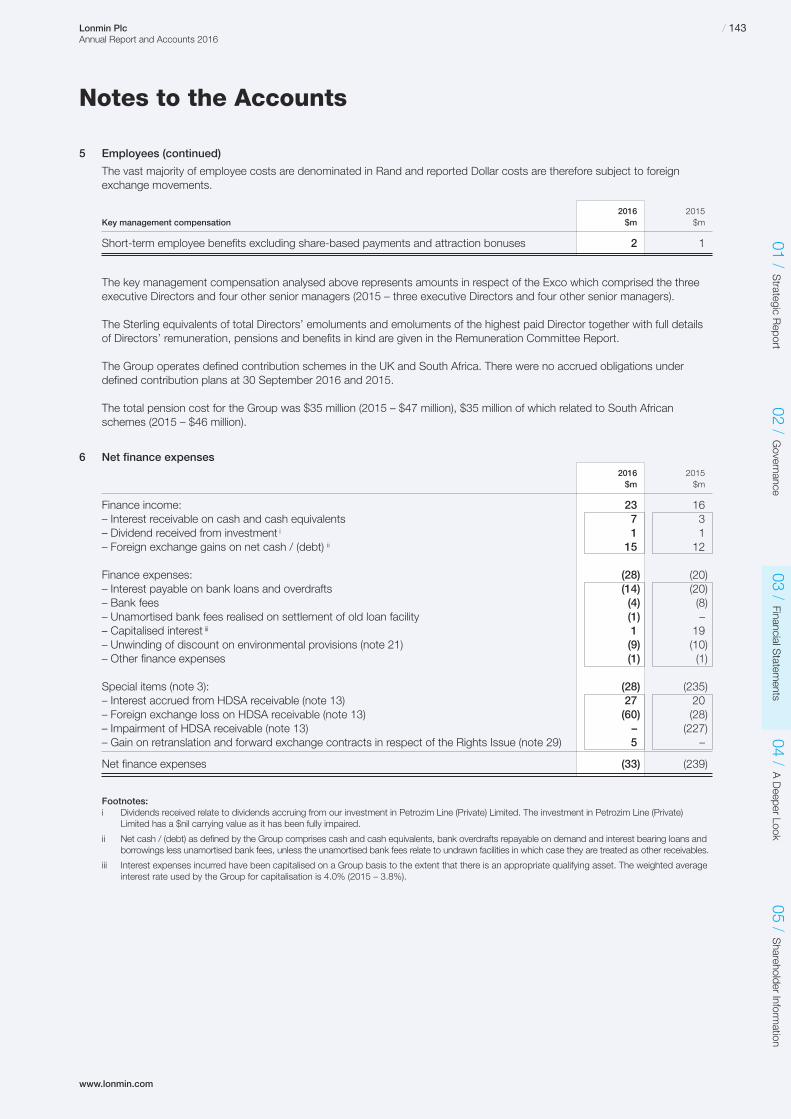
www.lonmin.com
Notes to the Accounts
5 Employees (continued)
The vast majority of employee costs are denominated in Rand and reported Dollar costs are therefore subject to foreignexchange movements.
2016 2015Key management compensation $m $m
Short-term employee benefits excluding share-based payments and attraction bonuses 2 1
The key management compensation analysed above represents amounts in respect of the Exco which comprised the threeexecutive Directors and four other senior managers (2015 – three executive Directors and four other senior managers).
The Sterling equivalents of total Directors’ emoluments and emoluments of the highest paid Director together with full detailsof Directors’ remuneration, pensions and benefits in kind are given in the Remuneration Committee Report.
The Group operates defined contribution schemes in the UK and South Africa. There were no accrued obligations underdefined contribution plans at 30 September 2016 and 2015.
The total pension cost for the Group was $35 million (2015 – $47 million), $35 million of which related to South Africanschemes (2015 – $46 million).
6 Net finance expenses2016 2015$m $m
Finance income: 23 16– Interest receivable on cash and cash equivalents 7 3– Dividend received from investment i 1 1– Foreign exchange gains on net cash / (debt) ii 15 12
Finance expenses: (28) (20)– Interest payable on bank loans and overdrafts (14) (20)– Bank fees (4) (8)– Unamortised bank fees realised on settlement of old loan facility (1) –– Capitalised interest iii 1 19– Unwinding of discount on environmental provisions (note 21) (9) (10)– Other finance expenses (1) (1)
Special items (note 3): (28) (235)– Interest accrued from HDSA receivable (note 13) 27 20– Foreign exchange loss on HDSA receivable (note 13) (60) (28)– Impairment of HDSA receivable (note 13) – (227)– Gain on retranslation and forward exchange contracts in respect of the Rights Issue (note 29) 5 –
Net finance expenses (33) (239)
Footnotes:i Dividends received relate to dividends accruing from our investment in Petrozim Line (Private) Limited. The investment in Petrozim Line (Private)
Limited has a $nil carrying value as it has been fully impaired.
ii Net cash / (debt) as defined by the Group comprises cash and cash equivalents, bank overdrafts repayable on demand and interest bearing loans andborrowings less unamortised bank fees, unless the unamortised bank fees relate to undrawn facilities in which case they are treated as other receivables.
iii Interest expenses incurred have been capitalised on a Group basis to the extent that there is an appropriate qualifying asset. The weighted averageinterest rate used by the Group for capitalisation is 4.0% (2015 – 3.8%).
01 /Strategic R
eport02 /
Governance
03 /Financial S
tatements
04 /A Deeper Look
05 /Shareholder Inform
ation/ 143Lonmin Plc
Annual Report and Accounts 2016
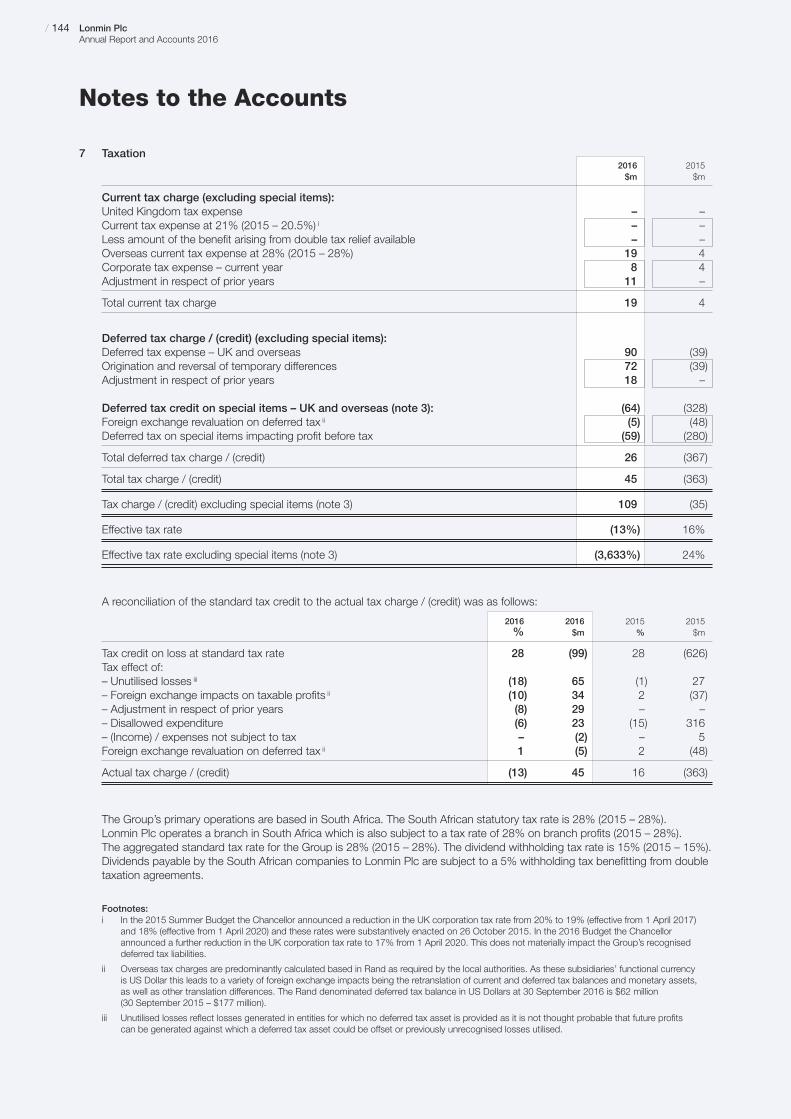
Notes to the Accounts
7 Taxation2016 2015$m $m
Current tax charge (excluding special items):United Kingdom tax expense – –Current tax expense at 21% (2015 – 20.5%) i – –Less amount of the benefit arising from double tax relief available – –Overseas current tax expense at 28% (2015 – 28%) 19 4Corporate tax expense – current year 8 4Adjustment in respect of prior years 11 –
Total current tax charge 19 4
Deferred tax charge / (credit) (excluding special items):Deferred tax expense – UK and overseas 90 (39)Origination and reversal of temporary differences 72 (39)Adjustment in respect of prior years 18 –
Deferred tax credit on special items – UK and overseas (note 3): (64) (328)Foreign exchange revaluation on deferred tax ii (5) (48)Deferred tax on special items impacting profit before tax (59) (280)
Total deferred tax charge / (credit) 26 (367)
Total tax charge / (credit) 45 (363)
Tax charge / (credit) excluding special items (note 3) 109 (35)
Effective tax rate (13%) 16%
Effective tax rate excluding special items (note 3) (3,633%) 24%
A reconciliation of the standard tax credit to the actual tax charge / (credit) was as follows:
2016 2016 2015 2015% $m % $m
Tax credit on loss at standard tax rate 28 (99) 28 (626)Tax effect of:– Unutilised losses iii (18) 65 (1) 27– Foreign exchange impacts on taxable profits ii (10) 34 2 (37)– Adjustment in respect of prior years (8) 29 – –– Disallowed expenditure (6) 23 (15) 316– (Income) / expenses not subject to tax – (2) – 5Foreign exchange revaluation on deferred tax ii 1 (5) 2 (48)
Actual tax charge / (credit) (13) 45 16 (363)
The Group’s primary operations are based in South Africa. The South African statutory tax rate is 28% (2015 – 28%). Lonmin Plc operates a branch in South Africa which is also subject to a tax rate of 28% on branch profits (2015 – 28%). The aggregated standard tax rate for the Group is 28% (2015 – 28%). The dividend withholding tax rate is 15% (2015 – 15%).Dividends payable by the South African companies to Lonmin Plc are subject to a 5% withholding tax benefitting from doubletaxation agreements.
Footnotes:i In the 2015 Summer Budget the Chancellor announced a reduction in the UK corporation tax rate from 20% to 19% (effective from 1 April 2017)
and 18% (effective from 1 April 2020) and these rates were substantively enacted on 26 October 2015. In the 2016 Budget the Chancellorannounced a further reduction in the UK corporation tax rate to 17% from 1 April 2020. This does not materially impact the Group’s recogniseddeferred tax liabilities.
ii Overseas tax charges are predominantly calculated based in Rand as required by the local authorities. As these subsidiaries’ functional currency is US Dollar this leads to a variety of foreign exchange impacts being the retranslation of current and deferred tax balances and monetary assets, as well as other translation differences. The Rand denominated deferred tax balance in US Dollars at 30 September 2016 is $62 million (30 September 2015 – $177 million).
iii Unutilised losses reflect losses generated in entities for which no deferred tax asset is provided as it is not thought probable that future profits can be generated against which a deferred tax asset could be offset or previously unrecognised losses utilised.
/ 144 Lonmin PlcAnnual Report and Accounts 2016
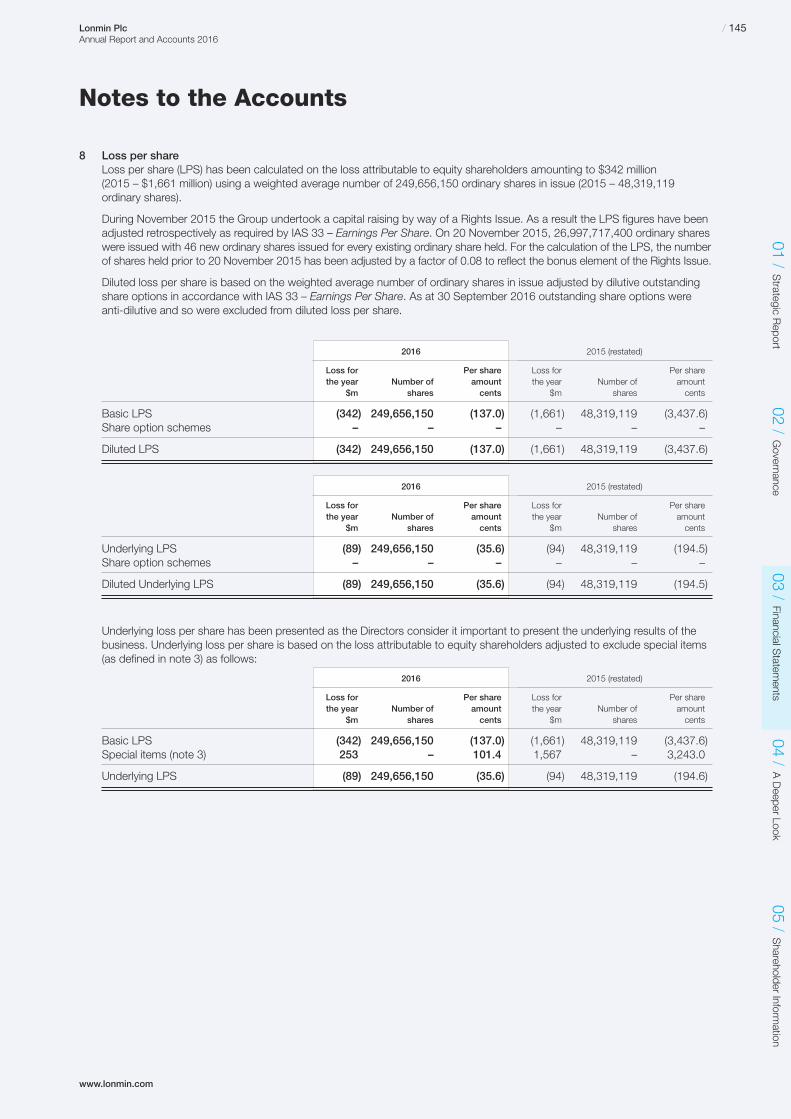
8 Loss per shareLoss per share (LPS) has been calculated on the loss attributable to equity shareholders amounting to $342 million (2015 – $1,661 million) using a weighted average number of 249,656,150 ordinary shares in issue (2015 – 48,319,119ordinary shares).
During November 2015 the Group undertook a capital raising by way of a Rights Issue. As a result the LPS figures have beenadjusted retrospectively as required by IAS 33 – Earnings Per Share. On 20 November 2015, 26,997,717,400 ordinary shareswere issued with 46 new ordinary shares issued for every existing ordinary share held. For the calculation of the LPS, the numberof shares held prior to 20 November 2015 has been adjusted by a factor of 0.08 to reflect the bonus element of the Rights Issue.
Diluted loss per share is based on the weighted average number of ordinary shares in issue adjusted by dilutive outstandingshare options in accordance with IAS 33 – Earnings Per Share. As at 30 September 2016 outstanding share options wereanti-dilutive and so were excluded from diluted loss per share.
2016 2015 (restated)
Loss for Per share Loss for Per sharethe year Number of amount the year Number of amount
$m shares cents $m shares cents
Basic LPS (342) 249,656,150 (137.0) (1,661) 48,319,119 (3,437.6)Share option schemes – – – – – –
Diluted LPS (342) 249,656,150 (137.0) (1,661) 48,319,119 (3,437.6)
2016 2015 (restated)
Loss for Per share Loss for Per sharethe year Number of amount the year Number of amount
$m shares cents $m shares cents
Underlying LPS (89) 249,656,150 (35.6) (94) 48,319,119 (194.5)Share option schemes – – – – – –
Diluted Underlying LPS (89) 249,656,150 (35.6) (94) 48,319,119 (194.5)
Underlying loss per share has been presented as the Directors consider it important to present the underlying results of thebusiness. Underlying loss per share is based on the loss attributable to equity shareholders adjusted to exclude special items(as defined in note 3) as follows:
2016 2015 (restated)
Loss for Per share Loss for Per sharethe year Number of amount the year Number of amount
$m shares cents $m shares cents
Basic LPS (342) 249,656,150 (137.0) (1,661) 48,319,119 (3,437.6)Special items (note 3) 253 – 101.4 1,567 – 3,243.0
Underlying LPS (89) 249,656,150 (35.6) (94) 48,319,119 (194.6)
www.lonmin.com
Notes to the Accounts
01 /Strategic R
eport02 /
Governance
03 /Financial S
tatements
04 /A Deeper Look
05 /Shareholder Inform
ation/ 145Lonmin Plc
Annual Report and Accounts 2016

Notes to the Accounts
/ 146 Lonmin PlcAnnual Report and Accounts 2016
8 Loss per share (continued)Headline loss and the resultant headline loss per share are specific disclosures defined and required by the JohannesburgStock Exchange. These are calculated as follows:
2016 2015$m $m
Loss attributable to ordinary shareholders (IAS 33 earnings) (342) (1,661)Add back loss on disposal of property, plant and equipment (note 4) – 3Add back profit on disposal of joint venture (note 3) (5) –Add back impairment of assets (note 3) 335 1,811Tax related to the above items (64) (261)Non-controlling interests (37) (224)
Headline loss (113) (332)
2016 2015 (restated)
Loss for Per share Loss for Per sharethe year Number of amount the year Number of amount
$m shares cents $m shares cents
Headline LPS (113) 249,656,150 (45.3) (332) 48,319,119 (687.1)Share option schemes – – – – – –
Diluted Headline LPS (113) 249,656,150 (45.3) (332) 48,319,119 (687.1)
9 DividendsNo dividends were declared by Lonmin Plc for the financial years ended 30 September 2016 and 2015.
No advance dividends were made by WPL, a subsidiary of Lonmin Plc, to Incwala Platinum (Proprietary) Limited (IP) duringthe year (2015 – $19 million (R228 million)). IP is a substantial shareholder in the Company’s principal operating subsidiaries.Total advance dividends made between 2009 and 2016 amount to $135 million (R1,309 million). IP has authorised WPL to recover these amounts by reducing future dividends that would otherwise be payable to all shareholders.
These advance dividends are adjusted for in the non-controlling interest of the Group.
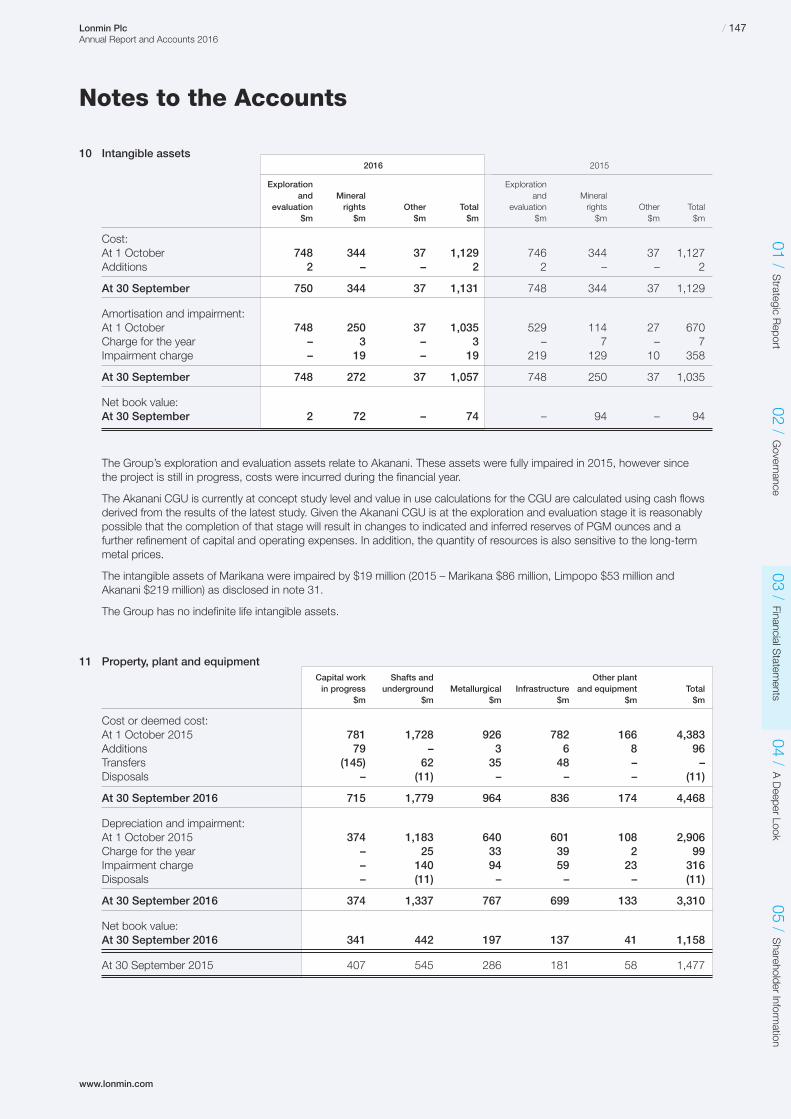
www.lonmin.com
Notes to the Accounts
10 Intangible assets2016 2015
Exploration Explorationand Mineral and Mineral
evaluation rights Other Total evaluation rights Other Total$m $m $m $m $m $m $m $m
Cost:At 1 October 748 344 37 1,129 746 344 37 1,127Additions 2 – – 2 2 – – 2
At 30 September 750 344 37 1,131 748 344 37 1,129
Amortisation and impairment:At 1 October 748 250 37 1,035 529 114 27 670Charge for the year – 3 – 3 – 7 – 7Impairment charge – 19 – 19 219 129 10 358
At 30 September 748 272 37 1,057 748 250 37 1,035
Net book value:At 30 September 2 72 – 74 – 94 – 94
The Group’s exploration and evaluation assets relate to Akanani. These assets were fully impaired in 2015, however since the project is still in progress, costs were incurred during the financial year.
The Akanani CGU is currently at concept study level and value in use calculations for the CGU are calculated using cash flowsderived from the results of the latest study. Given the Akanani CGU is at the exploration and evaluation stage it is reasonablypossible that the completion of that stage will result in changes to indicated and inferred reserves of PGM ounces and afurther refinement of capital and operating expenses. In addition, the quantity of resources is also sensitive to the long-termmetal prices.
The intangible assets of Marikana were impaired by $19 million (2015 – Marikana $86 million, Limpopo $53 million andAkanani $219 million) as disclosed in note 31.
The Group has no indefinite life intangible assets.
11 Property, plant and equipmentCapital work Shafts and Other plantin progress underground Metallurgical Infrastructure and equipment Total
$m $m $m $m $m $m
Cost or deemed cost:At 1 October 2015 781 1,728 926 782 166 4,383Additions 79 – 3 6 8 96Transfers (145) 62 35 48 – –Disposals – (11) – – – (11)
At 30 September 2016 715 1,779 964 836 174 4,468
Depreciation and impairment:At 1 October 2015 374 1,183 640 601 108 2,906Charge for the year – 25 33 39 2 99Impairment charge – 140 94 59 23 316Disposals – (11) – – – (11)
At 30 September 2016 374 1,337 767 699 133 3,310
Net book value:At 30 September 2016 341 442 197 137 41 1,158
At 30 September 2015 407 545 286 181 58 1,477
01 /Strategic R
eport02 /
Governance
03 /Financial S
tatements
04 /A Deeper Look
05 /Shareholder Inform
ation/ 147Lonmin Plc
Annual Report and Accounts 2016
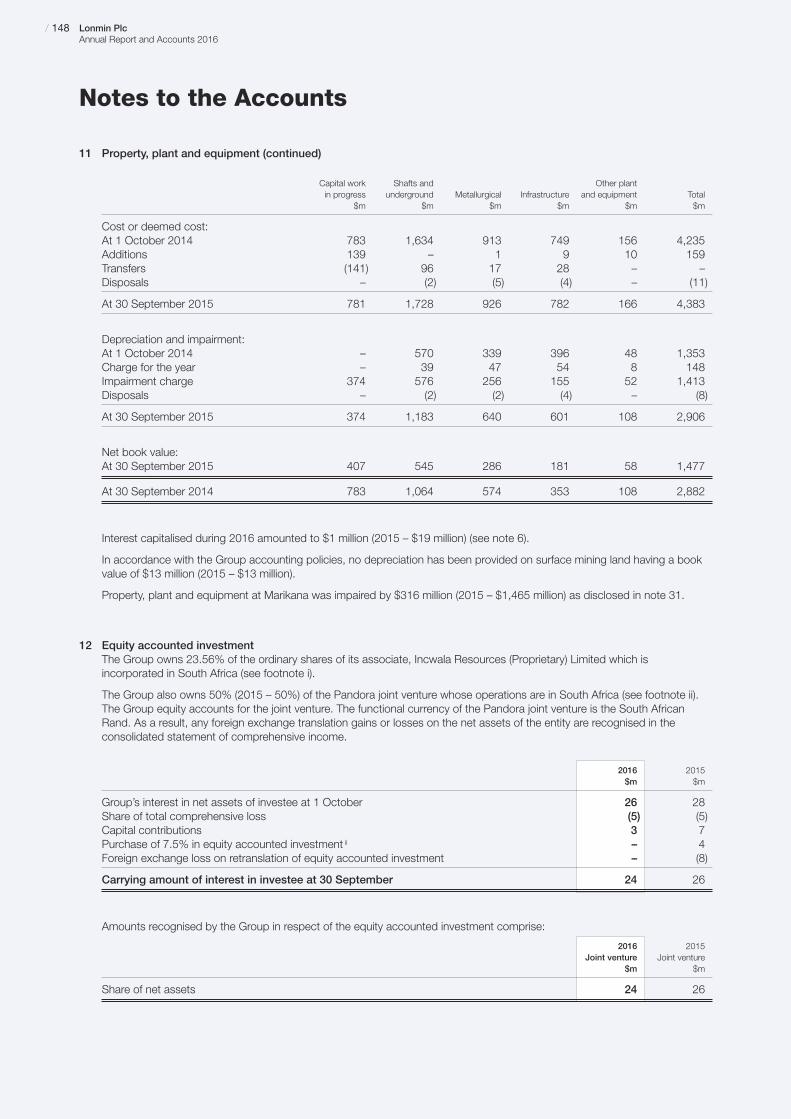
Notes to the Accounts
11 Property, plant and equipment (continued)
Capital work Shafts and Other plantin progress underground Metallurgical Infrastructure and equipment Total
$m $m $m $m $m $m
Cost or deemed cost:At 1 October 2014 783 1,634 913 749 156 4,235Additions 139 – 1 9 10 159Transfers (141) 96 17 28 – –Disposals – (2) (5) (4) – (11)
At 30 September 2015 781 1,728 926 782 166 4,383
Depreciation and impairment:At 1 October 2014 – 570 339 396 48 1,353Charge for the year – 39 47 54 8 148Impairment charge 374 576 256 155 52 1,413Disposals – (2) (2) (4) – (8)
At 30 September 2015 374 1,183 640 601 108 2,906
Net book value:At 30 September 2015 407 545 286 181 58 1,477
At 30 September 2014 783 1,064 574 353 108 2,882
Interest capitalised during 2016 amounted to $1 million (2015 – $19 million) (see note 6).
In accordance with the Group accounting policies, no depreciation has been provided on surface mining land having a bookvalue of $13 million (2015 – $13 million).
Property, plant and equipment at Marikana was impaired by $316 million (2015 – $1,465 million) as disclosed in note 31.
12 Equity accounted investmentThe Group owns 23.56% of the ordinary shares of its associate, Incwala Resources (Proprietary) Limited which isincorporated in South Africa (see footnote i).
The Group also owns 50% (2015 – 50%) of the Pandora joint venture whose operations are in South Africa (see footnote ii).The Group equity accounts for the joint venture. The functional currency of the Pandora joint venture is the South AfricanRand. As a result, any foreign exchange translation gains or losses on the net assets of the entity are recognised in theconsolidated statement of comprehensive income.
2016 2015$m $m
Group’s interest in net assets of investee at 1 October 26 28Share of total comprehensive loss (5) (5)Capital contributions 3 7Purchase of 7.5% in equity accounted investment ii – 4Foreign exchange loss on retranslation of equity accounted investment – (8)
Carrying amount of interest in investee at 30 September 24 26
Amounts recognised by the Group in respect of the equity accounted investment comprise:
2016 2015Joint venture Joint venture
$m $m
Share of net assets 24 26
/ 148 Lonmin PlcAnnual Report and Accounts 2016
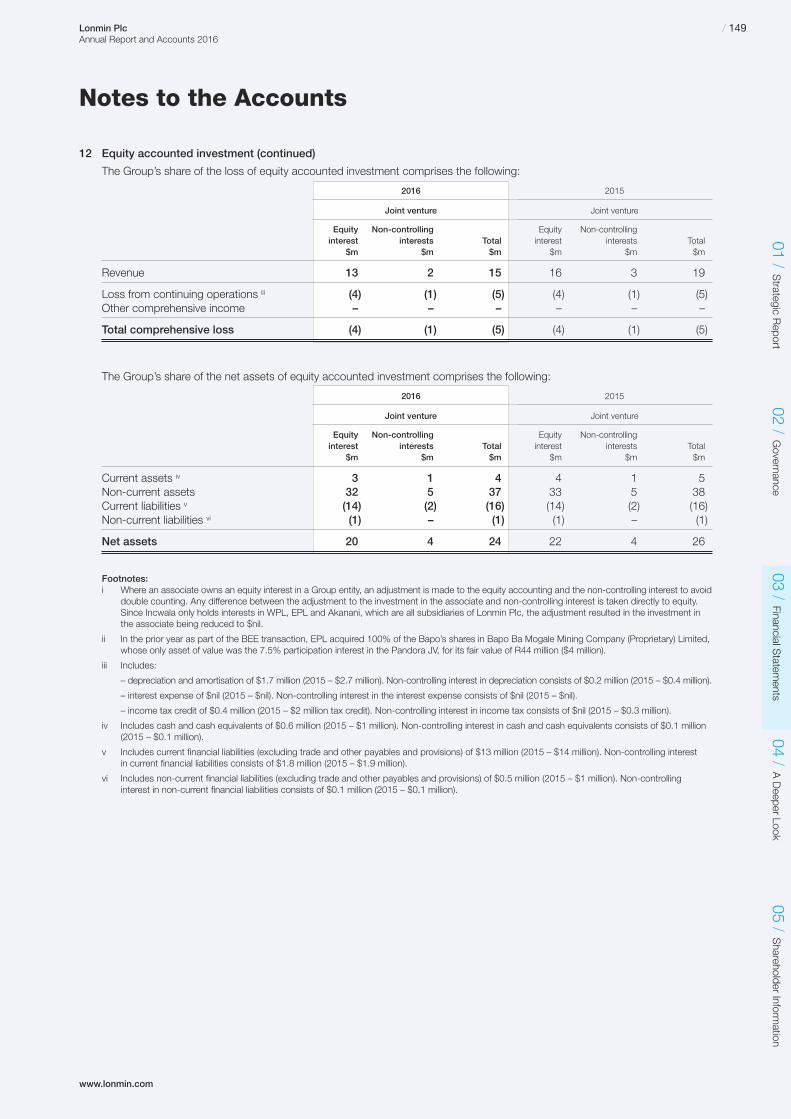
www.lonmin.com
Notes to the Accounts
12 Equity accounted investment (continued)
The Group’s share of the loss of equity accounted investment comprises the following:
2016 2015
Joint venture Joint venture
Equity Non-controlling Equity Non-controllinginterest interests Total interest interests Total
$m $m $m $m $m $m
Revenue 13 2 15 16 3 19
Loss from continuing operations iii (4) (1) (5) (4) (1) (5)Other comprehensive income – – – – – –
Total comprehensive loss (4) (1) (5) (4) (1) (5)
The Group’s share of the net assets of equity accounted investment comprises the following:
2016 2015
Joint venture Joint venture
Equity Non-controlling Equity Non-controllinginterest interests Total interest interests Total
$m $m $m $m $m $m
Current assets iv 3 1 4 4 1 5Non-current assets 32 5 37 33 5 38Current liabilities v (14) (2) (16) (14) (2) (16)Non-current liabilities vi (1) – (1) (1) – (1)
Net assets 20 4 24 22 4 26
Footnotes:i Where an associate owns an equity interest in a Group entity, an adjustment is made to the equity accounting and the non-controlling interest to avoid
double counting. Any difference between the adjustment to the investment in the associate and non-controlling interest is taken directly to equity.Since Incwala only holds interests in WPL, EPL and Akanani, which are all subsidiaries of Lonmin Plc, the adjustment resulted in the investment inthe associate being reduced to $nil.
ii In the prior year as part of the BEE transaction, EPL acquired 100% of the Bapo’s shares in Bapo Ba Mogale Mining Company (Proprietary) Limited,whose only asset of value was the 7.5% participation interest in the Pandora JV, for its fair value of R44 million ($4 million).
iii Includes:
– depreciation and amortisation of $1.7 million (2015 – $2.7 million). Non-controlling interest in depreciation consists of $0.2 million (2015 – $0.4 million).
– interest expense of $nil (2015 – $nil). Non-controlling interest in the interest expense consists of $nil (2015 – $nil).
– income tax credit of $0.4 million (2015 – $2 million tax credit). Non-controlling interest in income tax consists of $nil (2015 – $0.3 million).
iv Includes cash and cash equivalents of $0.6 million (2015 – $1 million). Non-controlling interest in cash and cash equivalents consists of $0.1 million(2015 – $0.1 million).
v Includes current financial liabilities (excluding trade and other payables and provisions) of $13 million (2015 – $14 million). Non-controlling interest in current financial liabilities consists of $1.8 million (2015 – $1.9 million).
vi Includes non-current financial liabilities (excluding trade and other payables and provisions) of $0.5 million (2015 – $1 million). Non-controllinginterest in non-current financial liabilities consists of $0.1 million (2015 – $0.1 million).
01 /Strategic R
eport02 /
Governance
03 /Financial S
tatements
04 /A Deeper Look
05 /Shareholder Inform
ation/ 149Lonmin Plc
Annual Report and Accounts 2016
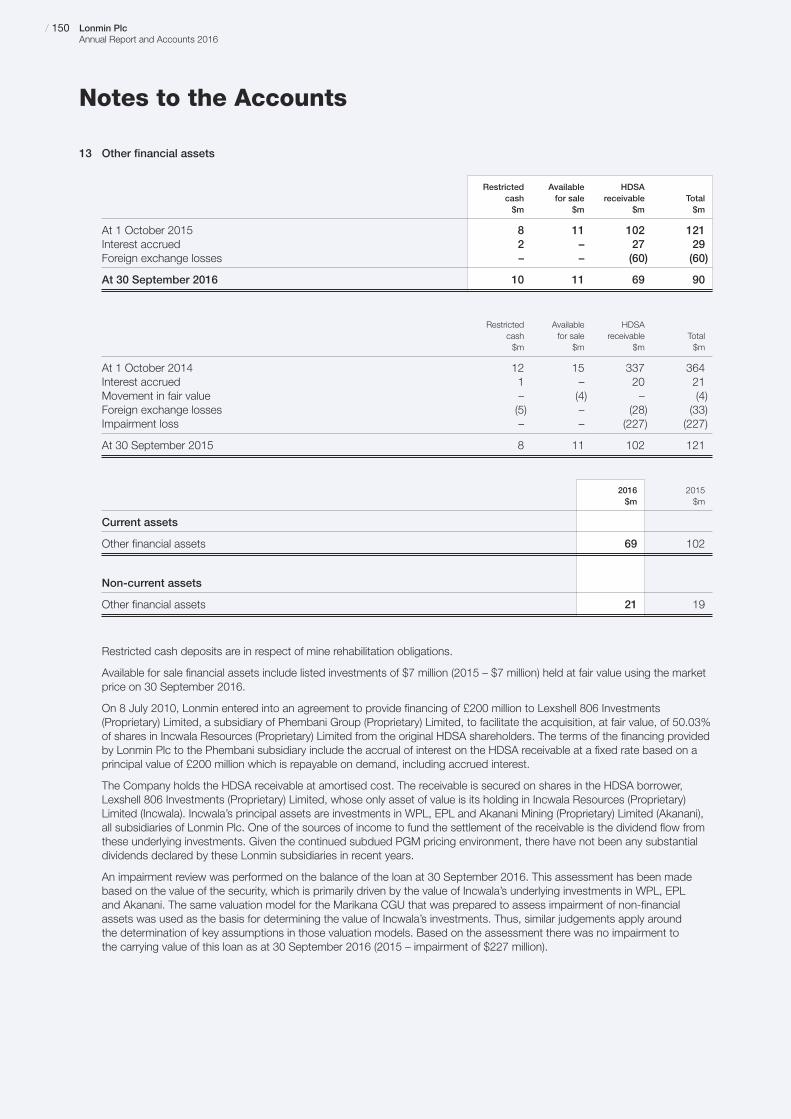
Notes to the Accounts
13 Other financial assets
Restricted Available HDSAcash for sale receivable Total$m $m $m $m
At 1 October 2015 8 11 102 121Interest accrued 2 – 27 29Foreign exchange losses – – (60) (60)
At 30 September 2016 10 11 69 90
Restricted Available HDSAcash for sale receivable Total$m $m $m $m
At 1 October 2014 12 15 337 364 Interest accrued 1 – 20 21 Movement in fair value – (4) – (4)Foreign exchange losses (5) – (28) (33)Impairment loss – – (227) (227)
At 30 September 2015 8 11 102 121
2016 2015$m $m
Current assets
Other financial assets 69 102
Non-current assets
Other financial assets 21 19
Restricted cash deposits are in respect of mine rehabilitation obligations.
Available for sale financial assets include listed investments of $7 million (2015 – $7 million) held at fair value using the marketprice on 30 September 2016.
On 8 July 2010, Lonmin entered into an agreement to provide financing of £200 million to Lexshell 806 Investments(Proprietary) Limited, a subsidiary of Phembani Group (Proprietary) Limited, to facilitate the acquisition, at fair value, of 50.03%of shares in Incwala Resources (Proprietary) Limited from the original HDSA shareholders. The terms of the financing providedby Lonmin Plc to the Phembani subsidiary include the accrual of interest on the HDSA receivable at a fixed rate based on aprincipal value of £200 million which is repayable on demand, including accrued interest.
The Company holds the HDSA receivable at amortised cost. The receivable is secured on shares in the HDSA borrower,Lexshell 806 Investments (Proprietary) Limited, whose only asset of value is its holding in Incwala Resources (Proprietary)Limited (Incwala). Incwala’s principal assets are investments in WPL, EPL and Akanani Mining (Proprietary) Limited (Akanani),all subsidiaries of Lonmin Plc. One of the sources of income to fund the settlement of the receivable is the dividend flow fromthese underlying investments. Given the continued subdued PGM pricing environment, there have not been any substantialdividends declared by these Lonmin subsidiaries in recent years.
An impairment review was performed on the balance of the loan at 30 September 2016. This assessment has been madebased on the value of the security, which is primarily driven by the value of Incwala’s underlying investments in WPL, EPL and Akanani. The same valuation model for the Marikana CGU that was prepared to assess impairment of non-financialassets was used as the basis for determining the value of Incwala’s investments. Thus, similar judgements apply around the determination of key assumptions in those valuation models. Based on the assessment there was no impairment to the carrying value of this loan as at 30 September 2016 (2015 – impairment of $227 million).
/ 150 Lonmin PlcAnnual Report and Accounts 2016

www.lonmin.com
Notes to the Accounts
13 Other financial assets (continued)Any movements in the key assumptions would affect the value of the security which would lead to further impairment orreversal of a previous impairment of the receivable as follows:
Reversal of impairment /Assumption Movement in assumption (further impairment) of receivable
Metal prices +/− 5% $36m / ($26m)ZAR:USD exchange rate −/+ 5% $29m / ($21m)Discount rate −/+ 100 basis points $18m / ($6m)Production +/− 5% $33m / ($23m)
14 Inventories2016 2015$m $m
Consumables 44 46Work in progress 159 197Finished goods 42 38
245 281
The cost of inventories recognised as an expense and included in cost of sales amounted to $942 million (2015 – $1,226 million).
A downward adjustment was made of $25 million (2015 – $69 million) to bring the value of inventory to its net realisable value.
15 Trade and other receivables2016 2015$m $m
Amounts falling due within one year:Trade receivables 24 20Other receivables 26 43Prepayments and accrued income 13 8Unamortised bank fees 4 –
67 71
16 Trade and other payables2016 2015$m $m
Trade payables 61 96Accruals and other payables 127 101Indirect taxation and social security 5 11
193 208
01 /Strategic R
eport02 /
Governance
03 /Financial S
tatements
04 /A Deeper Look
05 /Shareholder Inform
ation/ 151Lonmin Plc
Annual Report and Accounts 2016

Notes to the Accounts
17 Interest bearing loans and borrowings2016 2015$m $m
Short-term loans and borrowings:Bank loans – unsecured – 505Long-term loans and borrowings:Bank loans – secured 150 –
150 505
The maturity profile of interest bearing loans and borrowings is disclosed in note 19b.
As at 30 September 2016 unamortised bank fees of $4 million relating to undrawn facilities were treated as other receivables(30 September 2015 – $1 million of unamortised bank fees relating to drawn facilities were offset against loans).
Bank debt facilities were amended effective 15 December 2015. Following the amendment, the Group’s debt facilities aresummarised as follows:
Revolving credit facilities totalling $70.8 million and a $150 million term loan, at the Lonmin Plc level, which are committed•until May 2019 (Lonmin can exercise its option to extend the term up until May 2020).
Revolving credit facility totalling R1,980 million, at the Western Platinum Limited level, which are committed until May 2019•(and likewise Lonmin can exercise its option to extend the term up until May 2020).
The following financial covenants apply to these facilities:
The consolidated tangible net worth of the Group will not be at any time less than US$1,100 million;•
The consolidated debt of the Group will not at any time exceed an amount equal to 35% of consolidated tangible net•worth of the Group;
The liquidity for the Group will not, for any week from 1 January 2016, be less than $20 million;•
The capital expenditure of the Group (excluding the Bulk Tailings Agreement) shall not exceed the limits set out in the table•below. The Company shall also have the option to carry forward or back up to 10% of the limits set out in the table below.
Financial Year Capex Limit
1 October 2015 – 30 September 2016 (inclusive) ZAR 1,338 million1 October 2016 – 30 September 2017 (inclusive) ZAR 1,242 million1 October 2017 – 30 September 2018 (inclusive) ZAR 2,511 million1 October 2018 – 30 September 2019 (inclusive) ZAR 3,194 million1 October 2019 – 31 May 2020 (inclusive) ZAR 4,049 million
There is also an additional limit on capital expenditure in relation to the Bulk Tailings Agreement as set out below. These wererevised in 2016 due to the delay in the financing of the Bulk Tailings project.
Bulk Tailings Financial Year Capex Limit
1 October 2015 – 30 September 2016 (inclusive) ZAR 103 million1 October 2016 – 30 September 2017 (inclusive) ZAR 414 million1 October 2017 – 30 September 2018 (inclusive) ZAR 31 million
The limit on capital expenditure in relation to the Bulk Tailings Agreement after 30 September 2018 will be zero.
As at 30 September 2016, Lonmin had net cash of $173 million, comprising of cash and cash equivalents of $323 million less borrowings of $150 million (30 September 2015 – net debt of $185 million). Undrawn facilities amounted to $215 million(2015 – $40 million undrawn facilities).
18 Deferred revenueIn March 2012 Lonmin entered into a pre-paid sale of 75% of its current gold production for the next 54 months. Under thiscontract Lonmin delivered 70,700 ounces of gold over the period with delivery of fixed quantities on a quarterly basis and inreturn received an upfront payment of $107 million. Proceeds of the pre-paid sale were treated as deferred revenue and amortisedto profit as deliveries occur. All gold deliveries were completed by 30 September 2016.
/ 152 Lonmin PlcAnnual Report and Accounts 2016
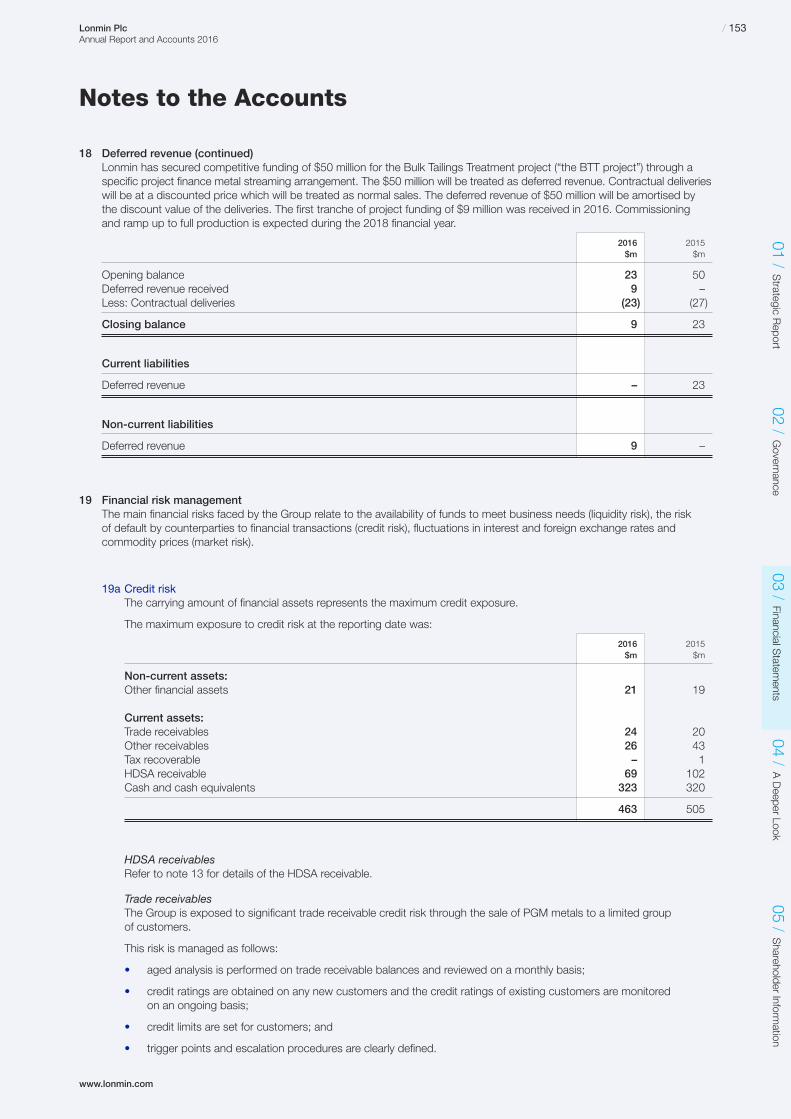
www.lonmin.com
Notes to the Accounts
18 Deferred revenue (continued)Lonmin has secured competitive funding of $50 million for the Bulk Tailings Treatment project (“the BTT project”) through aspecific project finance metal streaming arrangement. The $50 million will be treated as deferred revenue. Contractual deliverieswill be at a discounted price which will be treated as normal sales. The deferred revenue of $50 million will be amortised bythe discount value of the deliveries. The first tranche of project funding of $9 million was received in 2016. Commissioning and ramp up to full production is expected during the 2018 financial year.
2016 2015$m $m
Opening balance 23 50Deferred revenue received 9 –Less: Contractual deliveries (23) (27)
Closing balance 9 23
Current liabilities
Deferred revenue – 23
Non-current liabilities
Deferred revenue 9 –
19 Financial risk managementThe main financial risks faced by the Group relate to the availability of funds to meet business needs (liquidity risk), the risk of default by counterparties to financial transactions (credit risk), fluctuations in interest and foreign exchange rates andcommodity prices (market risk).
19a Credit riskThe carrying amount of financial assets represents the maximum credit exposure.
The maximum exposure to credit risk at the reporting date was:
2016 2015$m $m
Non-current assets:Other financial assets 21 19
Current assets:Trade receivables 24 20Other receivables 26 43Tax recoverable – 1HDSA receivable 69 102Cash and cash equivalents 323 320
463 505
HDSA receivablesRefer to note 13 for details of the HDSA receivable.
Trade receivablesThe Group is exposed to significant trade receivable credit risk through the sale of PGM metals to a limited group of customers.
This risk is managed as follows:
aged analysis is performed on trade receivable balances and reviewed on a monthly basis;•
credit ratings are obtained on any new customers and the credit ratings of existing customers are monitored •on an ongoing basis;
credit limits are set for customers; and•
trigger points and escalation procedures are clearly defined.•
01 /Strategic R
eport02 /
Governance
03 /Financial S
tatements
04 /A Deeper Look
05 /Shareholder Inform
ation/ 153Lonmin Plc
Annual Report and Accounts 2016

Notes to the Accounts
19 Financial risk management (continued)19a Credit risk (continued)
It should be noted that a significant portion of Lonmin’s revenue is from three key customers. These customers have stronginvestment grade ratings and their payment terms are very short, thereby reducing trade receivable credit risk significantly.
The maximum exposure to credit risk for trade receivables at the reporting date by geographic location was:
2016 2015$m $m
The Americas 4 0Asia 5 1Europe 7 8South Africa 8 11
24 20
The ageing of trade receivables at the reporting date was as follows:
2016 2015
Gross Provision Net Gross Provision Net$m $m $m $m $m $m
Not past due 24 – 24 20 – 20
Banking counterpartiesBanking counterparty credit risk is managed by spreading financial transactions across an approved list of counterparties of high credit quality. Banking counterparties are approved by the Board and consist of the ten banks that have participatedin Lonmin’s existing bank debt facilities as described in note 17.
19b Liquidity risk and capital management
Liquidity riskThe policy on overall liquidity is to ensure that the Group has sufficient funds to facilitate all ongoing operations.
The following are the contractual maturities of financial liabilities, including interest payments and excluding the impact of netting agreements:
Carrying Contractual < 1 1 to 2 2 to 5 > 5amount cash flows year years years years
30 September 2016 $m $m $m $m $m $m
Financial liabilities:Secured bank loans 150 (185) (11) (11) (163) –Trade and other payables 193 (193) (193) – – –
Carrying Contractual < 1 1 to 2 2 to 5 > 5amount cash flows year years years years
30 September 2015 $m $m $m $m $m $m
Financial liabilities:Unsecured bank loans 505 (515) (515) – – –Trade and other payables 208 (208) (208) – – –
As at 30 September 2016 unamortised bank fees of $4 million relating to undrawn facilities were included in otherreceivables (30 September 2015 – $1 million of unamortised bank fees related to drawn down facilities were offsetagainst unsecured bank loans).
Capital managementThe Group’s philosophy on capital management is to maintain a low level of financial gearing given the exposure of the business to fluctuations in PGM commodity prices and the Rand / US Dollar exchange rate. The Group funds itsoperations through a mixture of equity funding and bank borrowings.
/ 154 Lonmin PlcAnnual Report and Accounts 2016
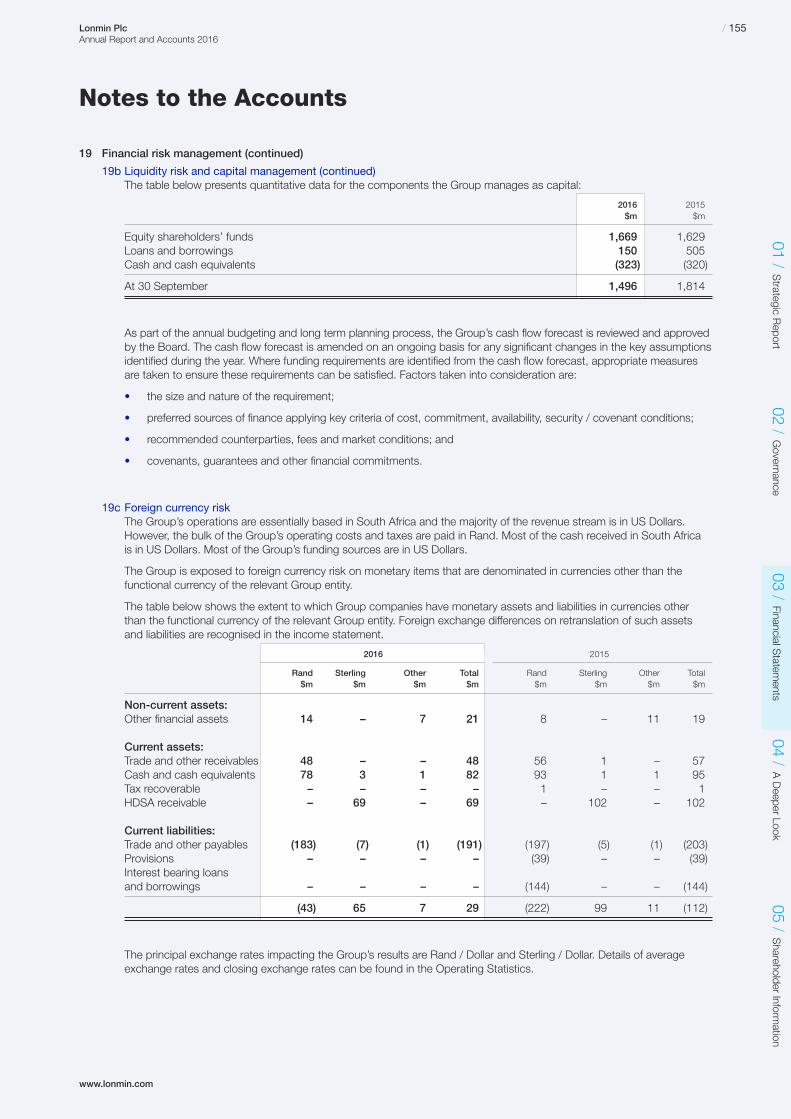
www.lonmin.com
Notes to the Accounts
19 Financial risk management (continued)
19b Liquidity risk and capital management (continued)The table below presents quantitative data for the components the Group manages as capital:
2016 2015$m $m
Equity shareholders’ funds 1,669 1,629Loans and borrowings 150 505Cash and cash equivalents (323) (320)
At 30 September 1,496 1,814
As part of the annual budgeting and long term planning process, the Group’s cash flow forecast is reviewed and approvedby the Board. The cash flow forecast is amended on an ongoing basis for any significant changes in the key assumptionsidentified during the year. Where funding requirements are identified from the cash flow forecast, appropriate measuresare taken to ensure these requirements can be satisfied. Factors taken into consideration are:
the size and nature of the requirement;•
preferred sources of finance applying key criteria of cost, commitment, availability, security / covenant conditions;•
recommended counterparties, fees and market conditions; and•
covenants, guarantees and other financial commitments.•
19c Foreign currency riskThe Group’s operations are essentially based in South Africa and the majority of the revenue stream is in US Dollars.However, the bulk of the Group’s operating costs and taxes are paid in Rand. Most of the cash received in South Africa is in US Dollars. Most of the Group’s funding sources are in US Dollars.
The Group is exposed to foreign currency risk on monetary items that are denominated in currencies other than thefunctional currency of the relevant Group entity.
The table below shows the extent to which Group companies have monetary assets and liabilities in currencies otherthan the functional currency of the relevant Group entity. Foreign exchange differences on retranslation of such assetsand liabilities are recognised in the income statement.
2016 2015
Rand Sterling Other Total Rand Sterling Other Total$m $m $m $m $m $m $m $m
Non-current assets:Other financial assets 14 – 7 21 8 – 11 19
Current assets:Trade and other receivables 48 – – 48 56 1 – 57Cash and cash equivalents 78 3 1 82 93 1 1 95Tax recoverable – – – – 1 – – 1HDSA receivable – 69 – 69 – 102 – 102
Current liabilities:Trade and other payables (183) (7) (1) (191) (197) (5) (1) (203)Provisions – – – – (39) – – (39)Interest bearing loans and borrowings – – – – (144) – – (144)
(43) 65 7 29 (222) 99 11 (112)
The principal exchange rates impacting the Group’s results are Rand / Dollar and Sterling / Dollar. Details of averageexchange rates and closing exchange rates can be found in the Operating Statistics.
01 /Strategic R
eport02 /
Governance
03 /Financial S
tatements
04 /A Deeper Look
05 /Shareholder Inform
ation/ 155Lonmin Plc
Annual Report and Accounts 2016
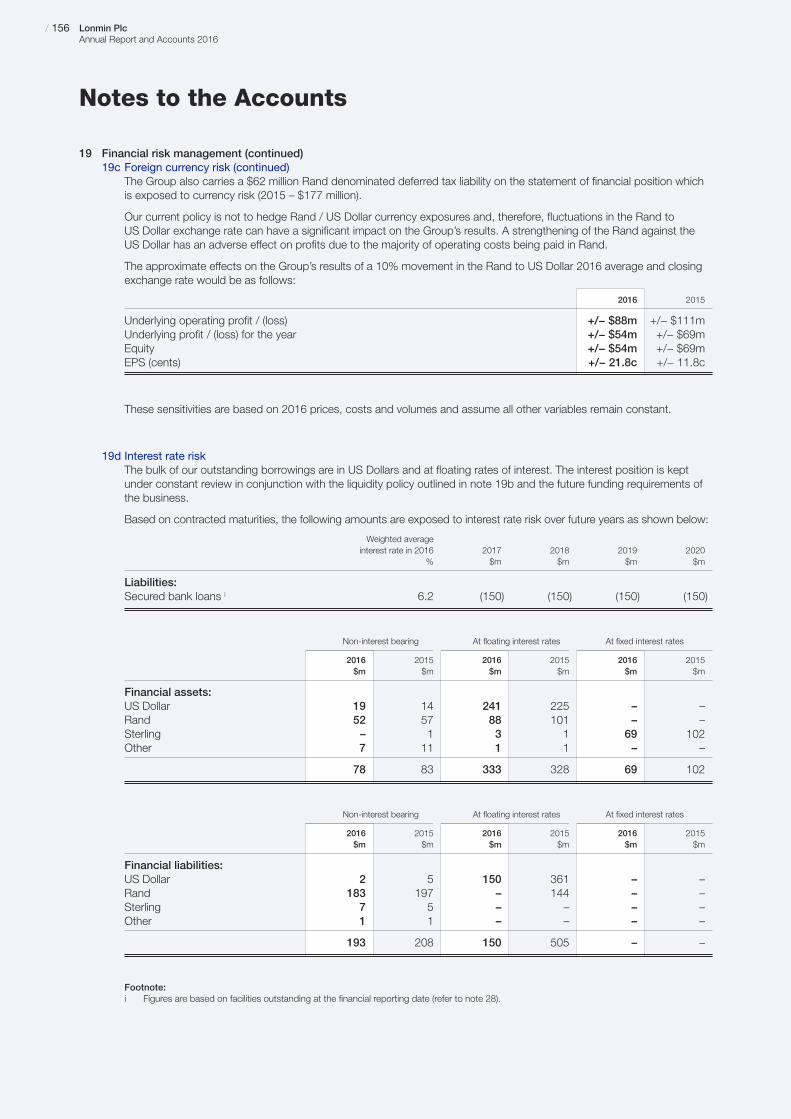
Notes to the Accounts
19 Financial risk management (continued)19c Foreign currency risk (continued)
The Group also carries a $62 million Rand denominated deferred tax liability on the statement of financial position whichis exposed to currency risk (2015 – $177 million).
Our current policy is not to hedge Rand / US Dollar currency exposures and, therefore, fluctuations in the Rand to US Dollar exchange rate can have a significant impact on the Group’s results. A strengthening of the Rand against theUS Dollar has an adverse effect on profits due to the majority of operating costs being paid in Rand.
The approximate effects on the Group’s results of a 10% movement in the Rand to US Dollar 2016 average and closingexchange rate would be as follows:
2016 2015
Underlying operating profit / (loss) +/− $88m +/− $111mUnderlying profit / (loss) for the year +/− $54m +/− $69mEquity +/− $54m +/− $69mEPS (cents) +/− 21.8c +/− 11.8c
These sensitivities are based on 2016 prices, costs and volumes and assume all other variables remain constant.
19d Interest rate riskThe bulk of our outstanding borrowings are in US Dollars and at floating rates of interest. The interest position is keptunder constant review in conjunction with the liquidity policy outlined in note 19b and the future funding requirements ofthe business.
Based on contracted maturities, the following amounts are exposed to interest rate risk over future years as shown below:
Weighted averageinterest rate in 2016 2017 2018 2019 2020
% $m $m $m $m
Liabilities:Secured bank loans i 6.2 (150) (150) (150) (150)
Non-interest bearing At floating interest rates At fixed interest rates
2016 2015 2016 2015 2016 2015$m $m $m $m $m $m
Financial assets:US Dollar 19 14 241 225 – –Rand 52 57 88 101 – –Sterling – 1 3 1 69 102Other 7 11 1 1 – –
78 83 333 328 69 102
Non-interest bearing At floating interest rates At fixed interest rates
2016 2015 2016 2015 2016 2015$m $m $m $m $m $m
Financial liabilities:US Dollar 2 5 150 361 – –Rand 183 197 – 144 – –Sterling 7 5 – – – –Other 1 1 – – – –
193 208 150 505 – –
Footnote:i Figures are based on facilities outstanding at the financial reporting date (refer to note 28).
/ 156 Lonmin PlcAnnual Report and Accounts 2016
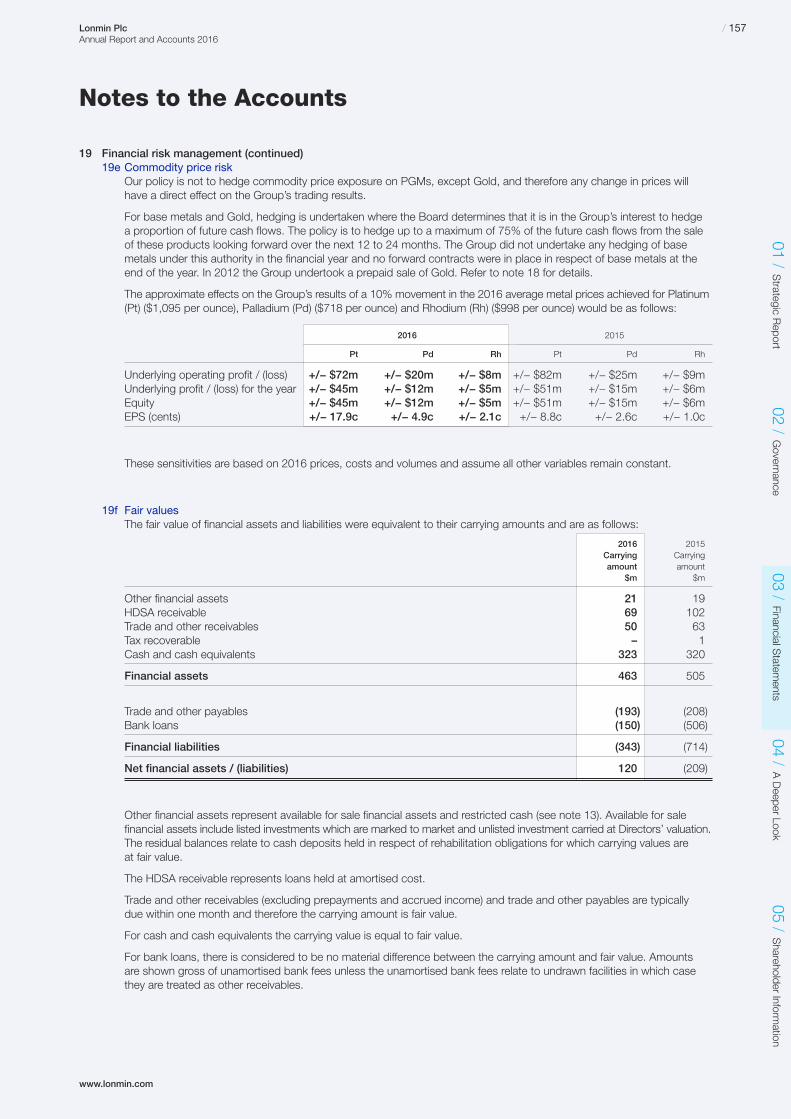
www.lonmin.com
Notes to the Accounts
19 Financial risk management (continued)19e Commodity price risk
Our policy is not to hedge commodity price exposure on PGMs, except Gold, and therefore any change in prices willhave a direct effect on the Group’s trading results.
For base metals and Gold, hedging is undertaken where the Board determines that it is in the Group’s interest to hedge a proportion of future cash flows. The policy is to hedge up to a maximum of 75% of the future cash flows from the sale of these products looking forward over the next 12 to 24 months. The Group did not undertake any hedging of basemetals under this authority in the financial year and no forward contracts were in place in respect of base metals at theend of the year. In 2012 the Group undertook a prepaid sale of Gold. Refer to note 18 for details.
The approximate effects on the Group’s results of a 10% movement in the 2016 average metal prices achieved for Platinum(Pt) ($1,095 per ounce), Palladium (Pd) ($718 per ounce) and Rhodium (Rh) ($998 per ounce) would be as follows:
2016 2015
Pt Pd Rh Pt Pd Rh
Underlying operating profit / (loss) +/− $72m +/− $20m +/− $8m +/− $82m +/− $25m +/− $9mUnderlying profit / (loss) for the year +/− $45m +/− $12m +/− $5m +/− $51m +/− $15m +/− $6mEquity +/− $45m +/− $12m +/− $5m +/− $51m +/− $15m +/− $6mEPS (cents) +/− 17.9c +/− 4.9c +/− 2.1c +/− 8.8c +/− 2.6c +/− 1.0c
These sensitivities are based on 2016 prices, costs and volumes and assume all other variables remain constant.
19f Fair valuesThe fair value of financial assets and liabilities were equivalent to their carrying amounts and are as follows:
2016 2015Carrying Carryingamount amount
$m $m
Other financial assets 21 19HDSA receivable 69 102Trade and other receivables 50 63Tax recoverable – 1Cash and cash equivalents 323 320
Financial assets 463 505
Trade and other payables (193) (208)Bank loans (150) (506)
Financial liabilities (343) (714)
Net financial assets / (liabilities) 120 (209)
Other financial assets represent available for sale financial assets and restricted cash (see note 13). Available for salefinancial assets include listed investments which are marked to market and unlisted investment carried at Directors’ valuation.The residual balances relate to cash deposits held in respect of rehabilitation obligations for which carrying values are at fair value.
The HDSA receivable represents loans held at amortised cost.
Trade and other receivables (excluding prepayments and accrued income) and trade and other payables are typically due within one month and therefore the carrying amount is fair value.
For cash and cash equivalents the carrying value is equal to fair value.
For bank loans, there is considered to be no material difference between the carrying amount and fair value. Amounts are shown gross of unamortised bank fees unless the unamortised bank fees relate to undrawn facilities in which casethey are treated as other receivables.
01 /Strategic R
eport02 /
Governance
03 /Financial S
tatements
04 /A Deeper Look
05 /Shareholder Inform
ation/ 157Lonmin Plc
Annual Report and Accounts 2016
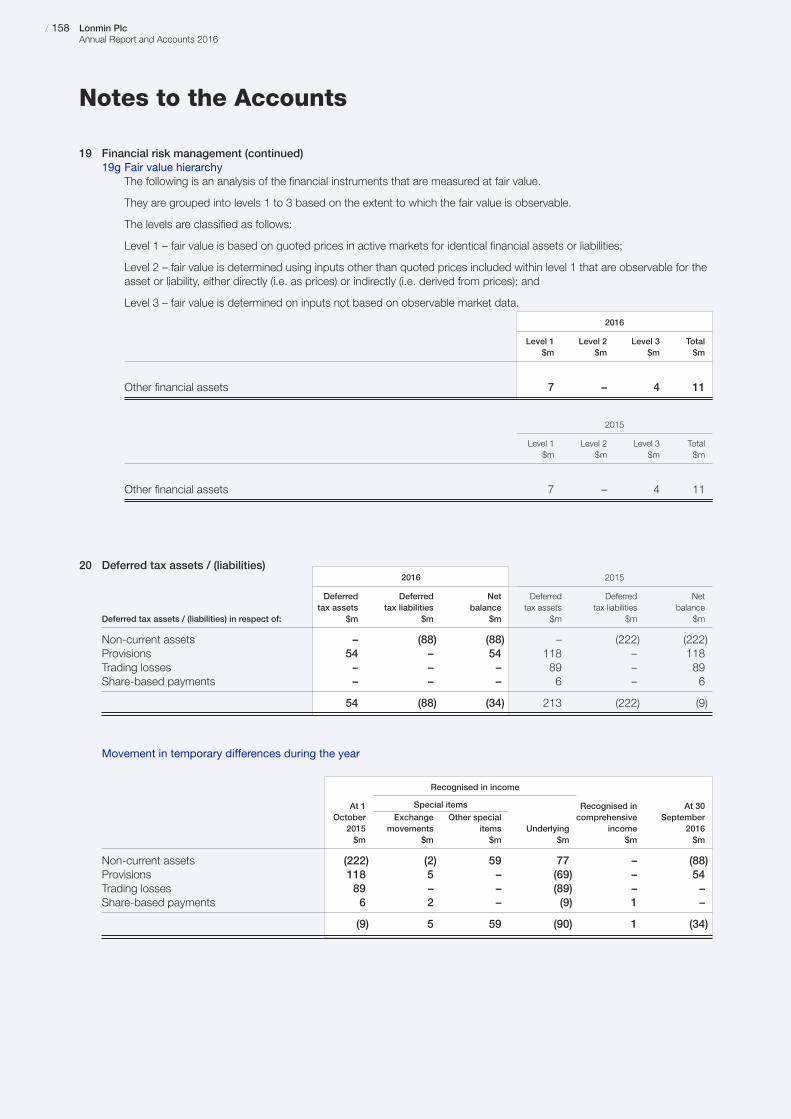
Notes to the Accounts
19 Financial risk management (continued)19g Fair value hierarchy
The following is an analysis of the financial instruments that are measured at fair value.
They are grouped into levels 1 to 3 based on the extent to which the fair value is observable.
The levels are classified as follows:
Level 1 – fair value is based on quoted prices in active markets for identical financial assets or liabilities;
Level 2 – fair value is determined using inputs other than quoted prices included within level 1 that are observable for theasset or liability, either directly (i.e. as prices) or indirectly (i.e. derived from prices); and
Level 3 – fair value is determined on inputs not based on observable market data.
2016
Level 1 Level 2 Level 3 Total$m $m $m $m
Other financial assets 7 – 4 11
2015
Level 1 Level 2 Level 3 Total$m $m $m $m
Other financial assets 7 – 4 11
20 Deferred tax assets / (liabilities)2016 2015
Deferred Deferred Net Deferred Deferred Nettax assets tax liabilities balance tax assets tax liabilities balance
Deferred tax assets / (liabilities) in respect of: $m $m $m $m $m $m
Non-current assets – (88) (88) – (222) (222)Provisions 54 – 54 118 – 118Trading losses – – – 89 – 89Share-based payments – – – 6 – 6
54 (88) (34) 213 (222) (9)
Movement in temporary differences during the year
Recognised in income
At 1 Special items Recognised in At 30October Exchange Other special comprehensive September
2015 movements items Underlying income 2016$m $m $m $m $m $m
Non-current assets (222) (2) 59 77 – (88)Provisions 118 5 – (69) – 54Trading losses 89 – – (89) – –Share-based payments 6 2 – (9) 1 –
(9) 5 59 (90) 1 (34)
/ 158 Lonmin PlcAnnual Report and Accounts 2016
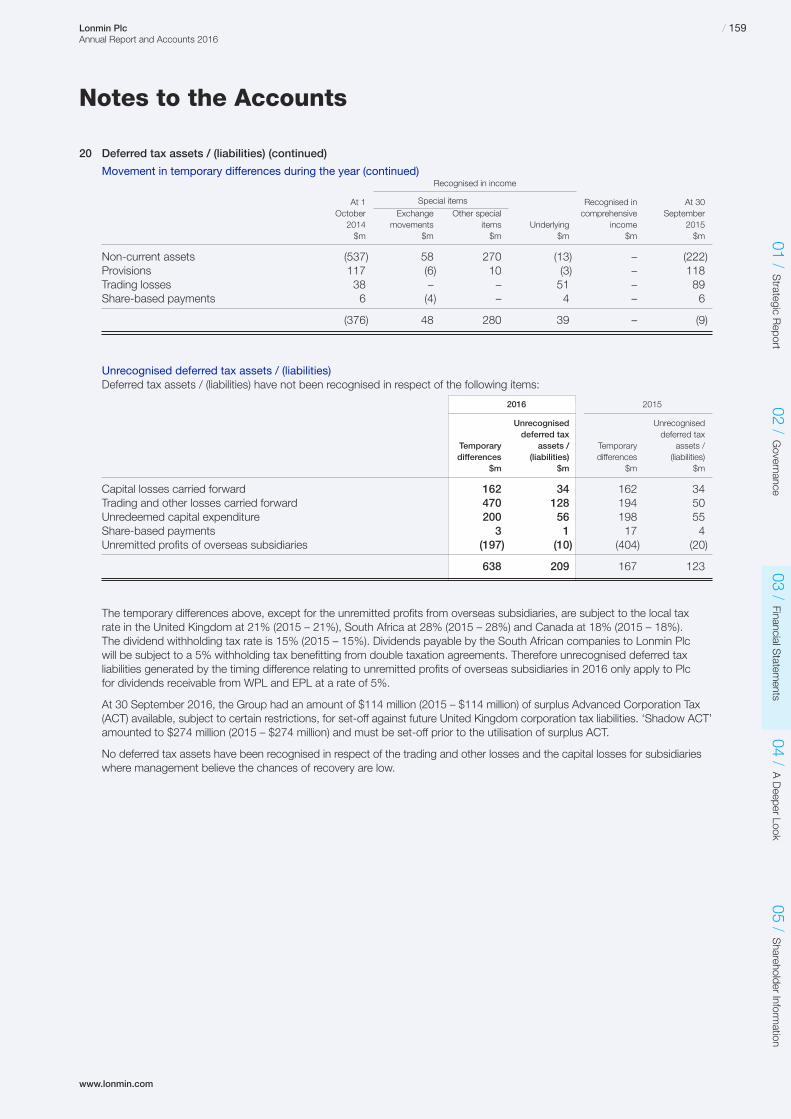
www.lonmin.com
Notes to the Accounts
20 Deferred tax assets / (liabilities) (continued)
Movement in temporary differences during the year (continued)Recognised in income
At 1 Special items Recognised in At 30October Exchange Other special comprehensive September2014 movements items Underlying income 2015$m $m $m $m $m $m
Non-current assets (537) 58 270 (13) – (222)Provisions 117 (6) 10 (3) – 118Trading losses 38 – – 51 – 89Share-based payments 6 (4) – 4 – 6
(376) 48 280 39 – (9)
Unrecognised deferred tax assets / (liabilities)Deferred tax assets / (liabilities) have not been recognised in respect of the following items:
2016 2015
Unrecognised Unrecogniseddeferred tax deferred tax
Temporary assets / Temporary assets /differences (liabilities) differences (liabilities)
$m $m $m $m
Capital losses carried forward 162 34 162 34Trading and other losses carried forward 470 128 194 50Unredeemed capital expenditure 200 56 198 55Share-based payments 3 1 17 4Unremitted profits of overseas subsidiaries (197) (10) (404) (20)
638 209 167 123
The temporary differences above, except for the unremitted profits from overseas subsidiaries, are subject to the local tax rate in the United Kingdom at 21% (2015 – 21%), South Africa at 28% (2015 – 28%) and Canada at 18% (2015 – 18%). The dividend withholding tax rate is 15% (2015 – 15%). Dividends payable by the South African companies to Lonmin Plc will be subject to a 5% withholding tax benefitting from double taxation agreements. Therefore unrecognised deferred taxliabilities generated by the timing difference relating to unremitted profits of overseas subsidiaries in 2016 only apply to Plc for dividends receivable from WPL and EPL at a rate of 5%.
At 30 September 2016, the Group had an amount of $114 million (2015 – $114 million) of surplus Advanced Corporation Tax(ACT) available, subject to certain restrictions, for set-off against future United Kingdom corporation tax liabilities. ‘Shadow ACT’amounted to $274 million (2015 – $274 million) and must be set-off prior to the utilisation of surplus ACT.
No deferred tax assets have been recognised in respect of the trading and other losses and the capital losses for subsidiarieswhere management believe the chances of recovery are low.
01 /Strategic R
eport02 /
Governance
03 /Financial S
tatements
04 /A Deeper Look
05 /Shareholder Inform
ation/ 159Lonmin Plc
Annual Report and Accounts 2016

Notes to the Accounts
21 Provisions2016 2015$m $m
Opening balance 161 141Capitalised on non-current assets 8 7Established in the year (13) (10)Unwinding of discount (note 6) 9 10Foreign exchange losses / (gains) (4) (26)Restructuring and reorganisation costs – 39Restructuring and reorganisation costs released (13) –Reversal of restructuring and reorganisation provision (21) –
Closing balance 127 161
Current liabilities
Provisions – 39
Non-current liabilities
Provisions 127 122
In 2015 current provisions related to provisions for the restructuring and reorganisation costs which was completed in 2016(refer to note 3).
Non-current provisions represent site rehabilitation liabilities and generally assume the cash flows occur at the end of the life of the mine. The Group provided third party guarantees to the Department of Mineral Resources amounting to $45 million(2015 – $45 million) in connection with these rehabilitation obligations which the Group has to fund in order to restore theenvironment once all mining operations have ceased.
Current cash and cash equivalents to the value of $6 million (2015 – $6 million) is treated as restricted cash to be utilised for rehabilitation obligations.
22 Contingent liabilities2016 2015$m $m
Third party guarantees– Eskom i 7 7– Department of Mineral Resources ii 45 45– Other iii 1 1
53 53
Footnotes:i The Group provided third party guarantees to Eskom as security to cover estimated electricity accounts for three months.
ii Refer to note 21 for more detail.
iii Other contingent liabilities relate to guarantees to various entities including the medical aid scheme, Transnet and Telkom.
/ 160 Lonmin PlcAnnual Report and Accounts 2016
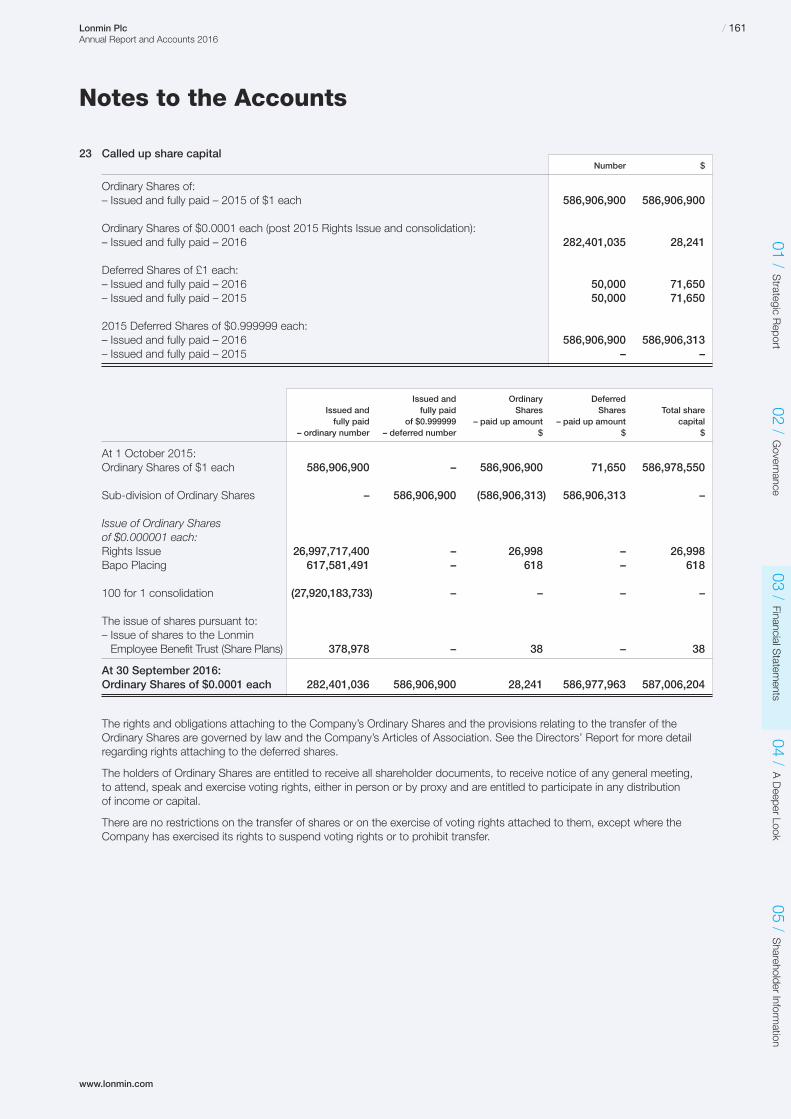
www.lonmin.com
Notes to the Accounts
23 Called up share capitalNumber $
Ordinary Shares of:– Issued and fully paid – 2015 of $1 each 586,906,900 586,906,900
Ordinary Shares of $0.0001 each (post 2015 Rights Issue and consolidation):– Issued and fully paid – 2016 282,401,035 28,241
Deferred Shares of £1 each:– Issued and fully paid – 2016 50,000 71,650– Issued and fully paid – 2015 50,000 71,650
2015 Deferred Shares of $0.999999 each:– Issued and fully paid – 2016 586,906,900 586,906,313– Issued and fully paid – 2015 – –
Issued and Ordinary DeferredIssued and fully paid Shares Shares Total sharefully paid of $0.999999 – paid up amount – paid up amount capital
– ordinary number – deferred number $ $ $
At 1 October 2015:Ordinary Shares of $1 each 586,906,900 – 586,906,900 71,650 586,978,550
Sub-division of Ordinary Shares – 586,906,900 (586,906,313) 586,906,313 –
Issue of Ordinary Sharesof $0.000001 each:Rights Issue 26,997,717,400 – 26,998 – 26,998Bapo Placing 617,581,491 – 618 – 618
100 for 1 consolidation (27,920,183,733) – – – –
The issue of shares pursuant to:– Issue of shares to the Lonmin Employee Benefit Trust (Share Plans) 378,978 – 38 – 38
At 30 September 2016:Ordinary Shares of $0.0001 each 282,401,036 586,906,900 28,241 586,977,963 587,006,204
The rights and obligations attaching to the Company’s Ordinary Shares and the provisions relating to the transfer of theOrdinary Shares are governed by law and the Company’s Articles of Association. See the Directors’ Report for more detailregarding rights attaching to the deferred shares.
The holders of Ordinary Shares are entitled to receive all shareholder documents, to receive notice of any general meeting, to attend, speak and exercise voting rights, either in person or by proxy and are entitled to participate in any distribution of income or capital.
There are no restrictions on the transfer of shares or on the exercise of voting rights attached to them, except where theCompany has exercised its rights to suspend voting rights or to prohibit transfer.
01 /Strategic R
eport02 /
Governance
03 /Financial S
tatements
04 /A Deeper Look
05 /Shareholder Inform
ation/ 161Lonmin Plc
Annual Report and Accounts 2016
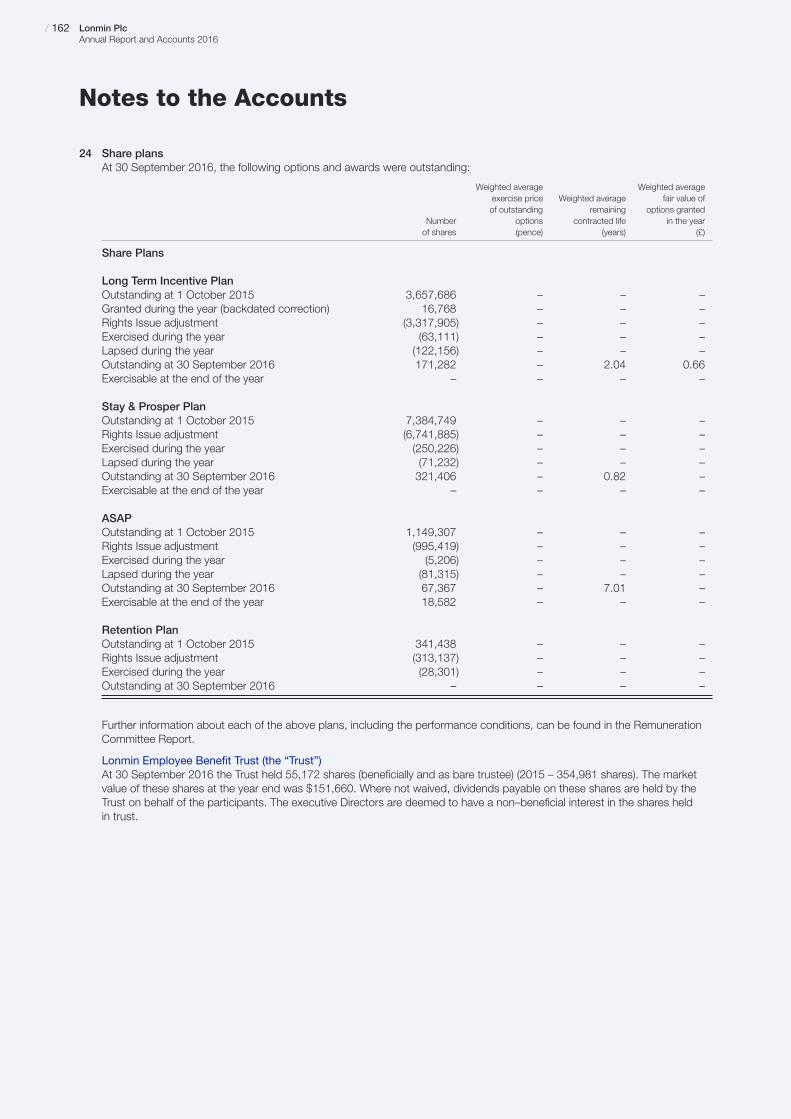
Notes to the Accounts
24 Share plansAt 30 September 2016, the following options and awards were outstanding:
Weighted average Weighted averageexercise price Weighted average fair value ofof outstanding remaining options granted
Number options contracted life in the yearof shares (pence) (years) (£)
Share Plans
Long Term Incentive PlanOutstanding at 1 October 2015 3,657,686 – – –Granted during the year (backdated correction) 16,768 – – –Rights Issue adjustment (3,317,905) – – –Exercised during the year (63,111) – – –Lapsed during the year (122,156) – – –Outstanding at 30 September 2016 171,282 – 2.04 0.66Exercisable at the end of the year – – – –
Stay & Prosper PlanOutstanding at 1 October 2015 7,384,749 – – –Rights Issue adjustment (6,741,885) – – –Exercised during the year (250,226) – – –Lapsed during the year (71,232) – – –Outstanding at 30 September 2016 321,406 – 0.82 –Exercisable at the end of the year – – – –
ASAPOutstanding at 1 October 2015 1,149,307 – – –Rights Issue adjustment (995,419) – – –Exercised during the year (5,206) – – –Lapsed during the year (81,315) – – –Outstanding at 30 September 2016 67,367 – 7.01 –Exercisable at the end of the year 18,582 – – –
Retention PlanOutstanding at 1 October 2015 341,438 – – –Rights Issue adjustment (313,137) – – –Exercised during the year (28,301) – – –Outstanding at 30 September 2016 – – – –
Further information about each of the above plans, including the performance conditions, can be found in the RemunerationCommittee Report.
Lonmin Employee Benefit Trust (the “Trust”)At 30 September 2016 the Trust held 55,172 shares (beneficially and as bare trustee) (2015 – 354,981 shares). The marketvalue of these shares at the year end was $151,660. Where not waived, dividends payable on these shares are held by theTrust on behalf of the participants. The executive Directors are deemed to have a non–beneficial interest in the shares heldin trust.
/ 162 Lonmin PlcAnnual Report and Accounts 2016
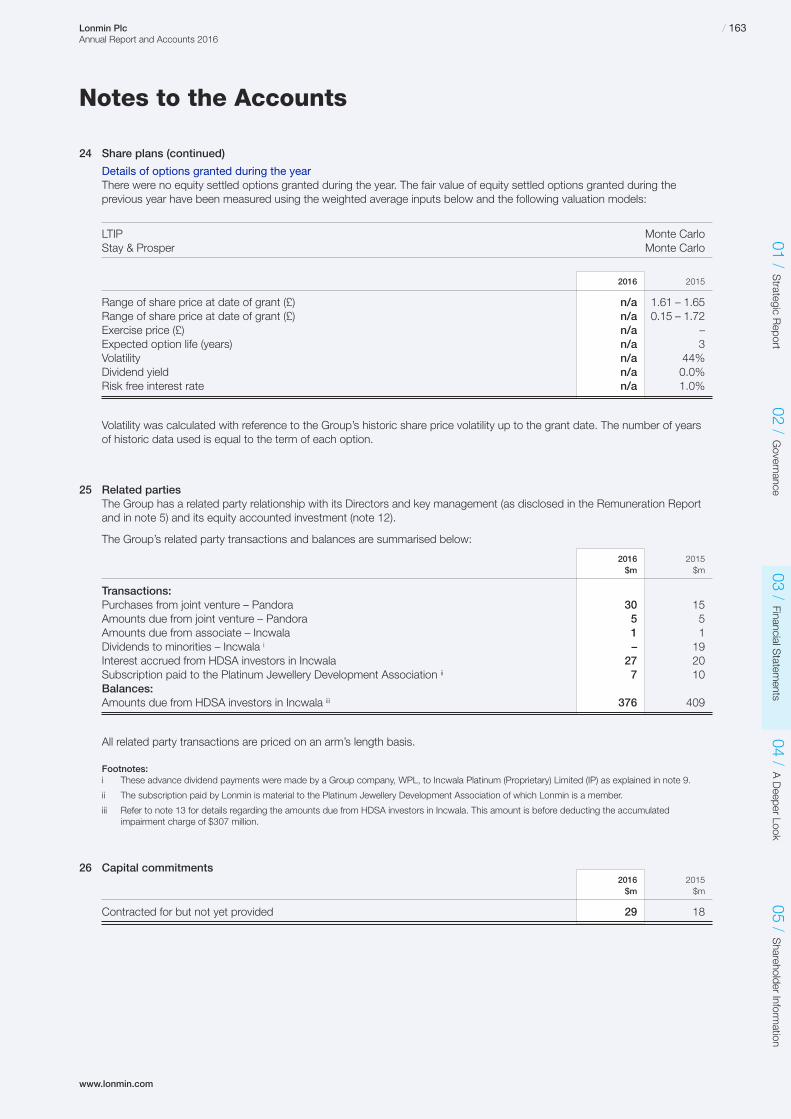
www.lonmin.com
Notes to the Accounts
24 Share plans (continued)
Details of options granted during the yearThere were no equity settled options granted during the year. The fair value of equity settled options granted during theprevious year have been measured using the weighted average inputs below and the following valuation models:
LTIP Monte CarloStay & Prosper Monte Carlo
2016 2015
Range of share price at date of grant (£) n/a 1.61 – 1.65Range of share price at date of grant (£) n/a 0.15 – 1.72Exercise price (£) n/a –Expected option life (years) n/a 3Volatility n/a 44%Dividend yield n/a 0.0%Risk free interest rate n/a 1.0%
Volatility was calculated with reference to the Group’s historic share price volatility up to the grant date. The number of yearsof historic data used is equal to the term of each option.
25 Related partiesThe Group has a related party relationship with its Directors and key management (as disclosed in the Remuneration Reportand in note 5) and its equity accounted investment (note 12).
The Group’s related party transactions and balances are summarised below:
2016 2015$m $m
Transactions:Purchases from joint venture – Pandora 30 15Amounts due from joint venture – Pandora 5 5Amounts due from associate – Incwala 1 1Dividends to minorities – Incwala i – 19Interest accrued from HDSA investors in Incwala 27 20Subscription paid to the Platinum Jewellery Development Association ii 7 10Balances:Amounts due from HDSA investors in Incwala iii 376 409
All related party transactions are priced on an arm’s length basis.
Footnotes:i These advance dividend payments were made by a Group company, WPL, to Incwala Platinum (Proprietary) Limited (IP) as explained in note 9.
ii The subscription paid by Lonmin is material to the Platinum Jewellery Development Association of which Lonmin is a member.
iii Refer to note 13 for details regarding the amounts due from HDSA investors in Incwala. This amount is before deducting the accumulatedimpairment charge of $307 million.
26 Capital commitments2016 2015$m $m
Contracted for but not yet provided 29 18
01 /Strategic R
eport02 /
Governance
03 /Financial S
tatements
04 /A Deeper Look
05 /Shareholder Inform
ation/ 163Lonmin Plc
Annual Report and Accounts 2016

Notes to the Accounts
27 Operating and finance leasesThe full aggregate lease payments of the Group under non-cancellable operating leases are set out below:
Land and buildings
2016 2015$m $m
Operating leases which fall due for payment:Within one year – 1Between one and five years 1 1
1 2
Lonmin Management Services is contracted in a lease agreement which expires on 31 October 2020. The contract is renewableevery 10 years with a compounded yearly escalation rate of 8%.
Lonmin Plc is contracted in a lease agreement which expires on 17 December 2018. The contract is renewable at the date of expiry and no escalation rate is applicable for the duration of the contract.
28 Net cash / (debt) as defined by the GroupTransfer of
Foreign unamortised As at exchange bank fees As at
1 October and non-cash to other 30 September2015 Cash flow movements receivables 2016$m $m $m $m $m
Cash and cash equivalents ii 320 (12) 15 – 323Current borrowings (506) 506 – – –Non-current borrowings – (150) – – (150)Unamortised bank fees iii 1 – – (1) –
Net (debt) / cash as defined by the Group i (185) 344 15 (1) 173
Transfer of Foreign unamortised
As at exchange bank fees As at1 October and non-cash to other 30 September
2014 Cash flow movements receivables 2015$m $m $m $m $m
Cash and cash equivalents ii 143 160 17 – 320Current borrowings (87) (331) (88) – (506)Non-current borrowings (88) – 88 – –Unamortised bank fees iii 3 – (2) – 1
Net debt as defined by the Group i (29) (171) 15 – (185)
Footnotes:i Net cash / (debt) as defined by the Group comprises cash and cash equivalents, bank overdrafts repayable on demand and interest bearing
loans and borrowings less unamortised bank fees, unless the unamortised bank fees relate to undrawn facilities in which case they are treated as other receivables.
ii Current cash and cash equivalents to the value of $6 million will be treated as restricted cash to be utilised for rehabilitation obligations (2015 – $6 million).
iii As at 30 September 2016 unamortised bank fees of $4 million relating to undrawn facilities were included in other receivables (2015 – $1 million of unamortised bank fees relating to drawn facilities were offset against net debt).
/ 164 Lonmin PlcAnnual Report and Accounts 2016

www.lonmin.com
Notes to the Accounts
29 Rights IssueOverview of the Rights Issue offerOn 9 November 2015, Lonmin announced a fully underwritten 46 for 1 Rights Issue of 26,997,717,400 new shares at £0.01per new share for shareholders on the London Stock Exchange and at ZAR0.214 per new share for shareholders on theJohannesburg Stock Exchange. In the prospectus, Lonmin anticipated raising $407 million of total proceeds which, net of feesand expenses relating to the Rights Issue of $26 million would raise funds of $381 million.
The offer period commenced on 20 November 2015 and closed for acceptance on 10 December 2015. The issue was successfulwith a take up of just below 71% and the remaining 29% raised through a rump placement. All new shares issued were paidfor. The Company raised total net proceeds of $368 million which was slightly below expectations given in the prospectus asa result of exchange differences between the prospectus exchange rate and that achieved ($11 million) as well as fees andexpenses being $1 million more than anticipated.
Accounting for the Rights IssueThe Rights Issue proceeds were received over the offer period and initially credited to a “shares to be issued” account at theprevailing spot exchange rates on the dates of receipt resulting in the recognition of cash inflow of $396 million before the impactof hedging arrangements. The retranslation of these receipts at the spot rate on closing resulted in a $1 million exchange gainrecognised through finance income as a special item.
Share capital and share premium of $26,998 and $395 million respectively were recognised on the statement of financialposition using the spot exchange rate on the date of issuance being 10 December 2015. Share issue costs of $27 million werealso recognised and charged against share premium. Therefore the total net increase in share capital and share premium was$368 million.
In order to minimise the risk of the exposure to currency fluctuations on the Rand and Pound Sterling proceeds expected, the Group entered into forward exchange contracts in synchronisation with the Rights Issue process. The Rand weakenedwhile the Pound Sterling strengthened against the Dollar over the offer period resulting in the net proceeds received andtranslated at forward exchange rate being more than those accounted for at spot rate. This resulted in the recognition ofexchange gains of $4 million. This $4 million forward exchange gain cannot be accounted for in equity (which it was effectivelyhedging for economic purposes) as, under IFRS, hedge accounting can only be applied to cash flows which ultimately affectprofit and loss. The gain on forward exchange contracts has therefore been reported as a special item in finance income inthe income statement.
A summary of the above transaction is shown below:
$m
Cash proceeds received at spot rates 396Foreign exchange gain on retranslation of advance cash proceeds (1)
Gross increase in share capital and share premium 395Costs of issue charged to share premium (27)
Net increase in share capital and share premium 368Gain on settlement of forward exchange contracts 4
Total 372
01 /Strategic R
eport02 /
Governance
03 /Financial S
tatements
04 /A Deeper Look
05 /Shareholder Inform
ation/ 165Lonmin Plc
Annual Report and Accounts 2016
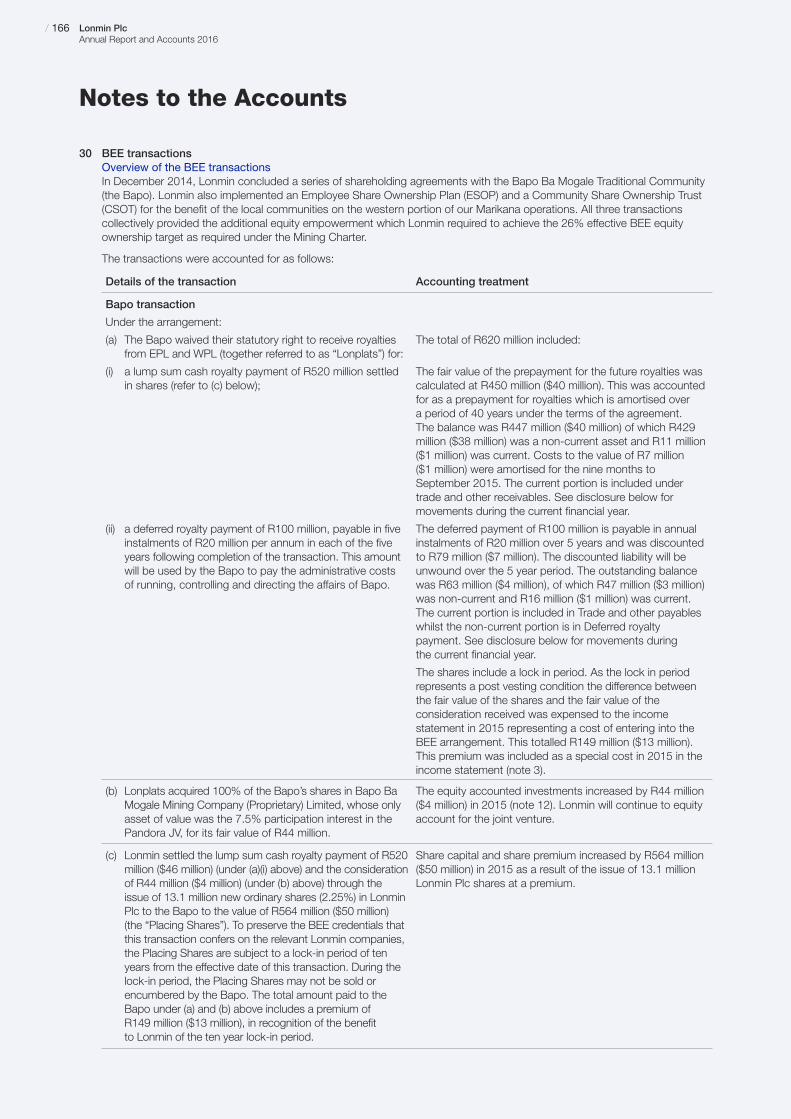
Notes to the Accounts
30 BEE transactionsOverview of the BEE transactionsIn December 2014, Lonmin concluded a series of shareholding agreements with the Bapo Ba Mogale Traditional Community(the Bapo). Lonmin also implemented an Employee Share Ownership Plan (ESOP) and a Community Share Ownership Trust(CSOT) for the benefit of the local communities on the western portion of our Marikana operations. All three transactionscollectively provided the additional equity empowerment which Lonmin required to achieve the 26% effective BEE equityownership target as required under the Mining Charter.
The transactions were accounted for as follows:
/ 166 Lonmin PlcAnnual Report and Accounts 2016
Details of the transaction Accounting treatment
Bapo transaction
Under the arrangement:
(a) The Bapo waived their statutory right to receive royaltiesfrom EPL and WPL (together referred to as “Lonplats”) for:
(i) a lump sum cash royalty payment of R520 million settledin shares (refer to (c) below);
(ii) a deferred royalty payment of R100 million, payable in fiveinstalments of R20 million per annum in each of the fiveyears following completion of the transaction. This amountwill be used by the Bapo to pay the administrative costs of running, controlling and directing the affairs of Bapo.
The total of R620 million included:
The fair value of the prepayment for the future royalties wascalculated at R450 million ($40 million). This was accountedfor as a prepayment for royalties which is amortised over a period of 40 years under the terms of the agreement. The balance was R447 million ($40 million) of which R429million ($38 million) was a non-current asset and R11 million($1 million) was current. Costs to the value of R7 million ($1 million) were amortised for the nine months toSeptember 2015. The current portion is included undertrade and other receivables. See disclosure below formovements during the current financial year.
The deferred payment of R100 million is payable in annualinstalments of R20 million over 5 years and was discountedto R79 million ($7 million). The discounted liability will beunwound over the 5 year period. The outstanding balancewas R63 million ($4 million), of which R47 million ($3 million)was non-current and R16 million ($1 million) was current.The current portion is included in Trade and other payableswhilst the non-current portion is in Deferred royaltypayment. See disclosure below for movements during the current financial year.
The shares include a lock in period. As the lock in periodrepresents a post vesting condition the difference betweenthe fair value of the shares and the fair value of theconsideration received was expensed to the incomestatement in 2015 representing a cost of entering into theBEE arrangement. This totalled R149 million ($13 million).This premium was included as a special cost in 2015 in theincome statement (note 3).
(b) Lonplats acquired 100% of the Bapo’s shares in Bapo BaMogale Mining Company (Proprietary) Limited, whose onlyasset of value was the 7.5% participation interest in thePandora JV, for its fair value of R44 million.
The equity accounted investments increased by R44 million($4 million) in 2015 (note 12). Lonmin will continue to equityaccount for the joint venture.
(c) Lonmin settled the lump sum cash royalty payment of R520million ($46 million) (under (a)(i) above) and the considerationof R44 million ($4 million) (under (b) above) through theissue of 13.1 million new ordinary shares (2.25%) in LonminPlc to the Bapo to the value of R564 million ($50 million)(the “Placing Shares”). To preserve the BEE credentials thatthis transaction confers on the relevant Lonmin companies,the Placing Shares are subject to a lock-in period of tenyears from the effective date of this transaction. During thelock-in period, the Placing Shares may not be sold orencumbered by the Bapo. The total amount paid to theBapo under (a) and (b) above includes a premium ofR149 million ($13 million), in recognition of the benefitto Lonmin of the ten year lock-in period.
Share capital and share premium increased by R564 million($50 million) in 2015 as a result of the issue of 13.1 millionLonmin Plc shares at a premium.
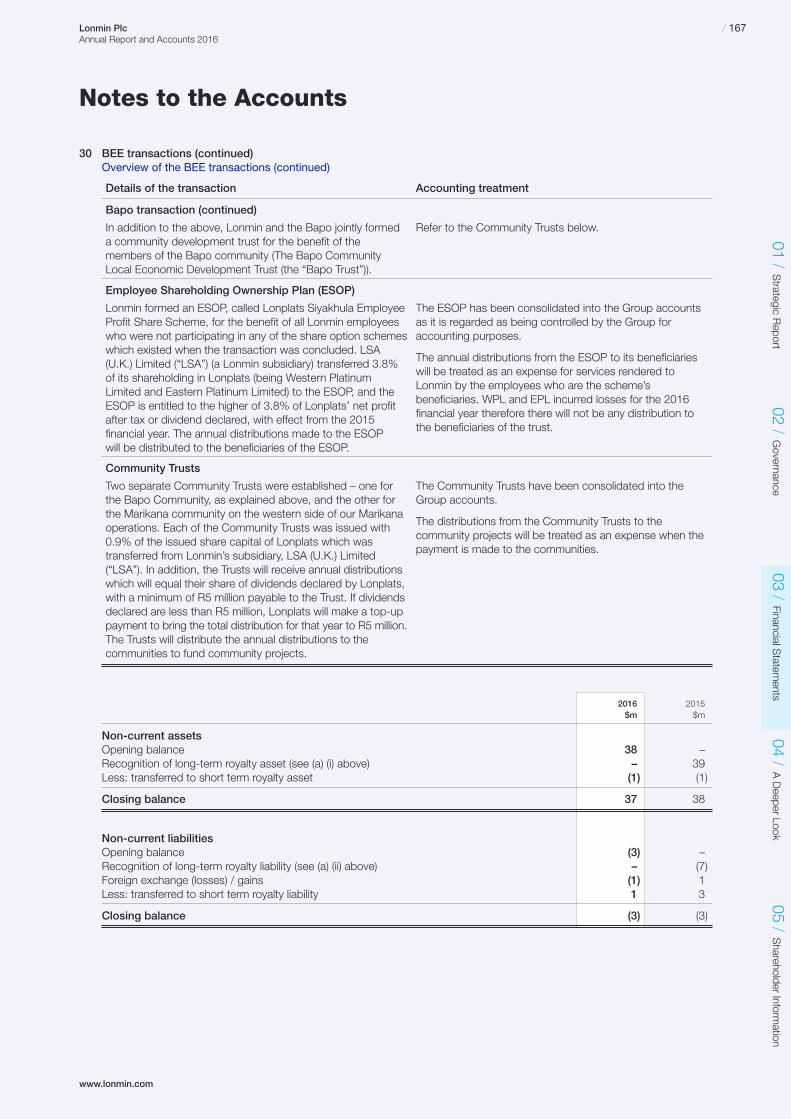
www.lonmin.com
Notes to the Accounts
30 BEE transactions (continued)Overview of the BEE transactions (continued)
2016 2015$m $m
Non-current assetsOpening balance 38 –Recognition of long-term royalty asset (see (a) (i) above) – 39Less: transferred to short term royalty asset (1) (1)
Closing balance 37 38
Non-current liabilitiesOpening balance (3) –Recognition of long-term royalty liability (see (a) (ii) above) – (7)Foreign exchange (losses) / gains (1) 1Less: transferred to short term royalty liability 1 3
Closing balance (3) (3)
01 /Strategic R
eport02 /
Governance
03 /Financial S
tatements
04 /A Deeper Look
05 /Shareholder Inform
ation/ 167Lonmin Plc
Annual Report and Accounts 2016
Details of the transaction Accounting treatment
Bapo transaction (continued)
In addition to the above, Lonmin and the Bapo jointly formed a community development trust for the benefit of themembers of the Bapo community (The Bapo CommunityLocal Economic Development Trust (the “Bapo Trust”)).
Refer to the Community Trusts below.
Employee Shareholding Ownership Plan (ESOP)
Lonmin formed an ESOP, called Lonplats Siyakhula EmployeeProfit Share Scheme, for the benefit of all Lonmin employeeswho were not participating in any of the share option schemeswhich existed when the transaction was concluded. LSA(U.K.) Limited (“LSA”) (a Lonmin subsidiary) transferred 3.8%of its shareholding in Lonplats (being Western PlatinumLimited and Eastern Platinum Limited) to the ESOP, and theESOP is entitled to the higher of 3.8% of Lonplats’ net profitafter tax or dividend declared, with effect from the 2015financial year. The annual distributions made to the ESOPwill be distributed to the beneficiaries of the ESOP.
The ESOP has been consolidated into the Group accountsas it is regarded as being controlled by the Group foraccounting purposes.
The annual distributions from the ESOP to its beneficiarieswill be treated as an expense for services rendered toLonmin by the employees who are the scheme’sbeneficiaries. WPL and EPL incurred losses for the 2016financial year therefore there will not be any distribution tothe beneficiaries of the trust.
Community Trusts
Two separate Community Trusts were established – one forthe Bapo Community, as explained above, and the other forthe Marikana community on the western side of our Marikanaoperations. Each of the Community Trusts was issued with0.9% of the issued share capital of Lonplats which wastransferred from Lonmin’s subsidiary, LSA (U.K.) Limited(“LSA”). In addition, the Trusts will receive annual distributionswhich will equal their share of dividends declared by Lonplats,with a minimum of R5 million payable to the Trust. If dividendsdeclared are less than R5 million, Lonplats will make a top-uppayment to bring the total distribution for that year to R5 million.The Trusts will distribute the annual distributions to thecommunities to fund community projects.
The Community Trusts have been consolidated into theGroup accounts.
The distributions from the Community Trusts to thecommunity projects will be treated as an expense when thepayment is made to the communities.

Notes to the Accounts
31 Impairment of non-financial assetsAt each financial reporting date, the Group assesses whether there is any indication that non-financial assets are impaired. If any such indication exists, the recoverable amount of the assets is estimated in order to determine the extent of the impairment(if any). The recoverable amount is the higher of fair value less costs to sell and value in use.
For impairment assessment, the Group’s net assets are grouped into CGUs being the Marikana CGU, Akanani CGU,Limpopo CGU and Other. The Marikana and Limpopo CGUs relate to the PGM segment and the Akanani CGU relates to the Evaluation segment.
The Marikana CGU is located in the Marikana district to the east of the town of Rustenburg in the North West province ofSouth Africa. It contains a number of producing underground mines, various development properties, concentrators, tailingsstorage facilities and smelting and refining operations.
The Akanani CGU is an evaluation asset and is located on the Northern Limb of the Bushveld Igneous Complex in theLimpopo province of South Africa. A pre-feasibility study was completed in 2012.
The Limpopo CGU is located on the Northern Sector of the Eastern Limb of the Bushveld Igneous Complex in the Limpopoprovince of South Africa and comprises two resource blocks (Baobab and Baobab east). The CGU includes mines whichwere placed on care and maintenance in 2009 and a concentrator complex.
For Marikana and Akanani, the recoverable amounts were calculated using a value in use valuation. The key assumptionscontained within the business forecasts and management’s approach to determine appropriate values in use are set out below:
For impairment testing, management projects cash flows over the life of the relevant mining operation which is significantlygreater than five years. For the Marikana CGU a life of mine spanning until 2062 was applied. Whilst the majority of mininglicenses are currently valid until 2037 the Director’s expect the licenses will be renewed until beyond 2062. For the AkananiCGU the life of mine spans until 2056.
The risk-adjusted pre-tax discount rate applied for impairment testing of the Marikana CGU for 2016 was 15.6% real (2015 – 15.6% real).
The Akanani asset was fully impaired at 30 September 2015. There have been no significant changes since that date to leadus to believe that the valuation of this asset is different. Therefore no full assessment has been performed at 30 September2016 as we do not expect a reversal of impairment at this stage.
The non-financial assets of the Limpopo CGU were also fully impaired at 30 September 2015.
/ 168 Lonmin PlcAnnual Report and Accounts 2016
Key assumption Management approach
PGM prices Projections are determined through a combination of the views of the Directors,market estimates and forecasts and other sector information. The Platinum price is projected to be in the range of $1,063 to $1,536 per ounce in real terms over the life of the mine. Palladium and Rhodium prices are expected to range between$600 to $842 and $764 to $1,251 respectively per ounce in real terms over thesame period.
Production volume Projections are based on the capacity and expected operational capabilities of themines, the grade of the ore and the efficiencies of processing and refining operations.
Production costs Projections are based on current cost adjusted for expected cost changes as wellas giving consideration to specific issues such as the difficulty in mining particularsections of the reef and the mining method employed.
Capital expenditure requirements Projections are based on the operational plan, which sets out the long-term plan of the business and is approved by the Board, and includes capital expenditure to access reported reserves from existing mining operations as well asmaintenance expenditure.
Foreign currency exchange rates Spot rates as at the end of the reporting period are applied.
Reserves and resources of the CGU Projections are determined through surveys performed by Competent Persons and the views of the Directors of the Company.
Discount rate The discount rate is based on a Weighted Average Cost of Capital (WACC)calculation using the Capital Asset Pricing Model grossed up to a pre-tax rate. The Group uses external consultants to calculate an appropriate WACC.

www.lonmin.com
Notes to the Accounts
31 Impairment of non-financial assets (continued)For the 2016 financial year, the Group’s non-financial assets were impaired by $335 million (2015 – $1,811 million) primarilydue to the downward revision of the Rhodium price outlook and the strengthening of the Rand against the US Dollar since our interim results in March 2016. The impact of these external factors, despite good progress made in the year against the Business Plan, led to the value in use declining below the carrying amount of the non-financial assets of the operations.The impairment charge was allocated as follows:
2016 2015Marikana Marikana Akanani Limpopo
CGU CGU CGU CGU Total$m $m $m $m $m
Carrying amount pre-impairment:Goodwill – 40 – – 40Other intangibles 91 180 219 53 452Property, plant and equipment 1,473 2,816 – 74 2,890Equity accounted investment 24 26 – – 26Royalty prepayment 37 38 – – 38
Total 1,625 3,100 219 127 3,446
Recoverable amount:Goodwill – – – – –Other intangibles 72 94 – – 94Property, plant and equipment 1,157 1,477 – – 1,477Equity accounted investment 24 26 – – 26Royalty prepayment 37 38 – – 38
Total 1,290 1,635 – – 1,635
Impairment:Goodwill – (40) – – (40)Other intangibles (19) (86) (219) (53) (358)Property, plant and equipment (316) (1,339) – (74) (1,413)Equity accounted investment – – – – –Royalty prepayment – – – – –
Total (335) (1,465) (219) (127) (1,811)
For the Marikana CGU, the impairment charge was allocated pro-rata to intangibles and property, plant and equipment, but limited to the assets’ recoverable amounts.
In preparing the financial statements, management has considered whether a reasonably possible change in the key assumptionson which management has based its determination of the recoverable amounts of the CGUs would cause the units’ carryingamounts to exceed their recoverable amounts. A reasonably possible change in any of the assumptions used to value theMarikana CGU will lead to a reduction or increase in the impairment charge as follows:
Assumption Movement in assumption Reversal of impairment / (Further impairment)
Metal prices +/−5% $345m / ($346m)Rand:US Dollar exchange rate −/+5% $267m / ($293m)Discount rate −/+100 basis points $140m / ($122m)Production +/−5% $309m / ($313m)
01 /Strategic R
eport02 /
Governance
03 /Financial S
tatements
04 /A Deeper Look
05 /Shareholder Inform
ation/ 169Lonmin Plc
Annual Report and Accounts 2016

Notes to the Accounts
32 Events after the financial reporting periodAs announced on 11 November 2016 the Group has entered into an agreement to acquire Anglo American Platinum’s (AAP)42.5% of the Pandora Joint Venture which will increase the Group’s ownership of the asset to 92.5%. The consideration isa cash payment of 20% of the distributable free cash flows generated by the Pandora E3 operations on an annual basis fora period of six year, subject to a minimum deferred consideration of R400 million (nominal terms) which is the expectedaggregate consideration. The Group has also entered into a 36 months rental agreement with Anglo American Platinum forthe Baobab concentrator at Limpopo, conditional upon the Transaction completing, whereby AAP will pay Lonmin a rentalfee of at least R46 million per year.
The acquisition allows Lonmin to consolidate its position in this relatively shallow and high-grade mineral resource providingan attractive option for development by EPL in both the short and longer term. The Pandora JV area is contiguous with ourexisting EPL operations, relies on Lonmin’s mining and processing infrastructure and is operated by EPL.
The transaction remains subject to certain conditions precedent including approval by the competition authorities of theRepublic of South Africa; and all necessary consents being obtained from the Department of Mineral Resources of SouthAfrica, including section 11 approval for the transfer of the mining rights. The transaction is also subject to approval byLonmin’s lending banks and remaining Pandora JV partner, Northam Limited. The transaction is expected to becomeunconditional during 2017 following the fulfilment of all conditions precedent.
33 Group companies and other entitiesThe following companies and other entities have been consolidated in the Group accounts and materially contributed to theassets and / or results of the Group and are classified according to their main activity.
Effectiveinterest inordinary
Principal place of Country of share capitalCompany business incorporation % Principal activities
Material subsidiariesEastern Platinum Ltd South Africa South Africa 86.2% Subsidiary Platinum miningWestern Platinum Ltd South Africa South Africa 86.2% Subsidiary Platinum mining
and refining
Other subsidiariesACGE Investments Limited England England 100.0% Subsidiary DormantAfriOre International (Barbados) Limited Barbados Barbados 100.0% Subsidiary Investment holdingsAfriOre Kenya Limited Kenya Kenya 100.0% Subsidiary Mineral explorationAfriOre Limited British Virgin Islands British Virgin Islands 100.0% Subsidiary DormantAfriOre Precious Metals Holdings Inc British Virgin Islands British Virgin Islands 100.0% Subsidiary DormantAfriOre (Proprietary) Limited South Africa South Africa 100.0% Subsidiary DormantAkanani Mining (Proprietary) Limited South Africa South Africa 80.1% Subsidiary Mineral exploration
and evaluationBAPO Mining Company (Proprietary) Limited South Africa South Africa 100.0% Subsidiary Investment holdingsBurchell Gold (Proprietary) Limited South Africa South Africa 100.0% Subsidiary DormantCanada Inc 4321677 Canada Canada 100.0% Subsidiary Investment holdingsCanada Inc 6529241 Canada Canada 100.0% Subsidiary Investment holdingsGabon Mining Corporation Gabon Gabon 100.0% Subsidiary DormantGreataward Limited England England 100.0% Subsidiary Investment holdingsKwagga Gold (Barbados) Limited Barbados Barbados 65.0% Subsidiary DormantKwagga Gold (Proprietary) Limited South Africa South Africa 100.0% Subsidiary Mineral explorationLondon Australian & General PropertyCompany Limited England England 100.0% Subsidiary DormantLondon City & Westcliff Properties Limited England England 100.0% Subsidiary DormantLonmin Bahamas Hotels Limited England England 100.0% Subsidiary DormantLonmin Canada Inc Canada Canada 100.0% Subsidiary Mineral explorationLonmin Finance Limited England England 100.0% Subsidiary DormantLonmin Insurance Limited Guernsey Guernsey 100.0% Subsidiary InsuranceLonmin Management Services South Africa South Africa 100.0% Branch Management of
strategic activities of SA operations
Lonmin Mining Company Limited England England 100.0% Subsidiary DormantLonmin Mining Supplies Limited England England 100.0% Subsidiary Dormant
/ 170 Lonmin PlcAnnual Report and Accounts 2016
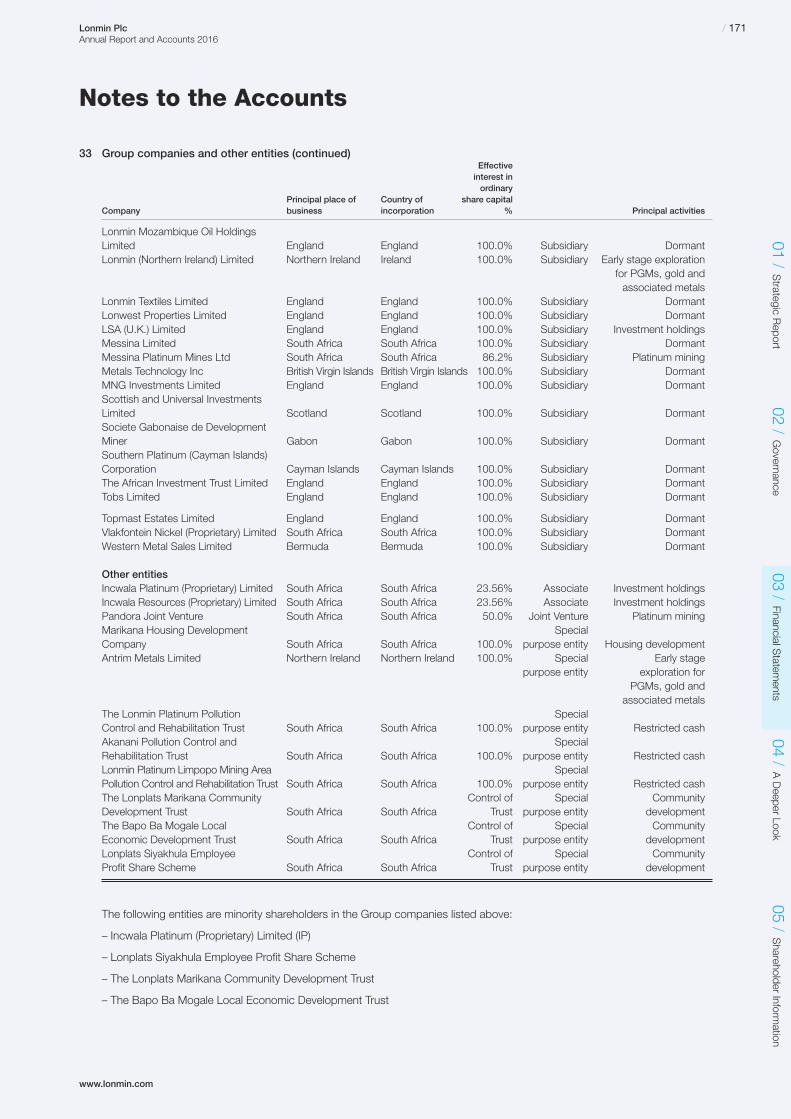
www.lonmin.com
Notes to the Accounts
33 Group companies and other entities (continued)Effectiveinterest inordinary
Principal place of Country of share capitalCompany business incorporation % Principal activities
Lonmin Mozambique Oil Holdings Limited England England 100.0% Subsidiary DormantLonmin (Northern Ireland) Limited Northern Ireland Ireland 100.0% Subsidiary Early stage exploration
for PGMs, gold and associated metals
Lonmin Textiles Limited England England 100.0% Subsidiary DormantLonwest Properties Limited England England 100.0% Subsidiary DormantLSA (U.K.) Limited England England 100.0% Subsidiary Investment holdingsMessina Limited South Africa South Africa 100.0% Subsidiary DormantMessina Platinum Mines Ltd South Africa South Africa 86.2% Subsidiary Platinum miningMetals Technology Inc British Virgin Islands British Virgin Islands 100.0% Subsidiary DormantMNG Investments Limited England England 100.0% Subsidiary DormantScottish and Universal Investments Limited Scotland Scotland 100.0% Subsidiary DormantSociete Gabonaise de Development Miner Gabon Gabon 100.0% Subsidiary DormantSouthern Platinum (Cayman Islands) Corporation Cayman Islands Cayman Islands 100.0% Subsidiary DormantThe African Investment Trust Limited England England 100.0% Subsidiary DormantTobs Limited England England 100.0% Subsidiary Dormant
Topmast Estates Limited England England 100.0% Subsidiary DormantVlakfontein Nickel (Proprietary) Limited South Africa South Africa 100.0% Subsidiary DormantWestern Metal Sales Limited Bermuda Bermuda 100.0% Subsidiary Dormant
Other entities Incwala Platinum (Proprietary) Limited South Africa South Africa 23.56% Associate Investment holdingsIncwala Resources (Proprietary) Limited South Africa South Africa 23.56% Associate Investment holdingsPandora Joint Venture South Africa South Africa 50.0% Joint Venture Platinum miningMarikana Housing Development SpecialCompany South Africa South Africa 100.0% purpose entity Housing developmentAntrim Metals Limited Northern Ireland Northern Ireland 100.0% Special Early stage
purpose entity exploration for PGMs, gold and
associated metalsThe Lonmin Platinum Pollution SpecialControl and Rehabilitation Trust South Africa South Africa 100.0% purpose entity Restricted cashAkanani Pollution Control and SpecialRehabilitation Trust South Africa South Africa 100.0% purpose entity Restricted cashLonmin Platinum Limpopo Mining Area SpecialPollution Control and Rehabilitation Trust South Africa South Africa 100.0% purpose entity Restricted cashThe Lonplats Marikana Community Control of Special CommunityDevelopment Trust South Africa South Africa Trust purpose entity developmentThe Bapo Ba Mogale Local Control of Special CommunityEconomic Development Trust South Africa South Africa Trust purpose entity developmentLonplats Siyakhula Employee Control of Special CommunityProfit Share Scheme South Africa South Africa Trust purpose entity development
The following entities are minority shareholders in the Group companies listed above:
– Incwala Platinum (Proprietary) Limited (IP)
– Lonplats Siyakhula Employee Profit Share Scheme
– The Lonplats Marikana Community Development Trust
– The Bapo Ba Mogale Local Economic Development Trust
01 /Strategic R
eport02 /
Governance
03 /Financial S
tatements
04 /A Deeper Look
05 /Shareholder Inform
ation/ 171Lonmin Plc
Annual Report and Accounts 2016

Lonmin Plc Company Balance Sheetas at 30 September
/ 172 Lonmin PlcAnnual Report and Accounts 2016
2016 2015Notes $m $m
Non-current assetsProperty, plant and equipment – 1Shares in subsidiary companies 37 726 922
726 923
Current assetsDeferred tax assets 42 1 1Trade and other receivables 38 1,563 1,171Other financial assets 13 69 102Cash and cash equivalents 45 54 224
1,687 1,498
Current liabilitiesTrade and other payables 39 (702) (697)Interest bearing loans and borrowings 40 – (361)
(702) (1,058)
Net current assets 985 440
Non-current liabilitiesInterest bearing loans and borrowings 40 (148) –
(148) –
Net assets 1,563 1,363
Capital and reservesShare capital 23 586 586Share premium 1,816 1,448Other reserves 88 88Accumulated loss (927) (759)
Total equity 1,563 1,363
The financial statements of Lonmin Plc, registered number 103002, were approved by the Board of Directors on 13 November 2016 and were signed on its behalf by:
Brian Beamish Chairman
Barrie van der Merwe Chief Financial Officer

www.lonmin.com
Lonmin Plc Company Statement of Changes in Equityfor the year ending 30 September
01 /Strategic R
eport02 /
Governance
03 /Financial S
tatements
04 /A Deeper Look
05 /Shareholder Inform
ation/ 173Lonmin Plc
Annual Report and Accounts 2016
Called Shareup share premium Other Accumulated Totalcapital account reserves i loss equity
$m $m $m $m $m
At 1 October 2015 586 1,448 88 (759) 1,363Loss for the year – – – (183) (183)Transactions with owners, recognised directly in equity: – 368 – 15 383– Share-based payments – – – 15 15– Share capital and share premium recognisedon equity issuance ii – 395 – – 395
– Equity issue costs charged to share premium ii – (27) – – (27)
At 30 September 2016 586 1,816 88 (927) 1,563
RetainedCalled Share earnings /
up share premium Other (Accumulated Totalcapital account reserves i loss) equity
$m $m $m $m $m
At 1 October 2014 570 1,411 88 83 2,152Loss for the year – – – (857) (857)Transactions with owners, recognised directly in equity: 16 37 – 15 68– Share-based payments – – – 15 15– Share capital and share premium recognisedon the BEE transaction 13 37 – – 50
– Shares issued on exercise of share options 3 – – – 3
At 30 September 2015 586 1,448 88 (759) 1,363
Footnotes:i Other reserves at 30 September 2016 represent the capital redemption reserve of $88 million (2015 – $88 million).
ii Refer to note 29 for more detail regarding the Rights Issue.

Lonmin Plc Company Statement of Cash Flowsfor the year ending 30 September
2016 2015Notes $m $m
Loss for the year (183) (857)Taxation 10 6Finance income 36 (91) (49)Finance expenses 36 75 700Impairment of investments in subsidiaries 37 196 214Change in trade and other receivables (336) (244)Change in trade and other payables 6 3Share-based payments 15 15
Cash outflow from operations (308) (212)Interest received 3 1Interest and bank fees paid (15) (14)Tax paid (10) (4)
Cash outflow from operating activities (330) (229)
Cash flow from financing activitiesProceeds from current borrowings 45 150 362Repayment of current borrowings 45 (362) –Proceeds from equity issuance 395 50Costs of issuing shares (27) –Profit on forward exchange contracts on equity issuance 5 –Issue of other ordinary share capital – 3
Cash inflow from financing activities 161 415
(Decrease) / increase in cash and cash equivalents 45 (169) 186Opening cash and cash equivalents 45 224 42Effect of foreign exchange rate changes 45 (1) (4)
Closing cash and cash equivalents 45 54 224
/ 174 Lonmin PlcAnnual Report and Accounts 2016

www.lonmin.com
Notes to the Company Accounts
34 Accounting PoliciesLonmin Plc (the “Company”) is a company incorporated and domiciled in the UK.
The Company financial statements have been prepared and approved by the directors in accordance with InternationalFinancial Reporting Standards as adopted by the EU (“Adopted IFRSs”).
The Company has taken advantage of the exemption contained in Section 408(4) of the Companies Act 2006 from presentingits own income statement and statement of other comprehensive income.
Transition to Adopted IFRSsThe Company is preparing its financial statements in accordance with Adopted IFRS for the first time and consequently hasapplied IFRS 1. The transition to Adopted IFRSs has not affected the reported financial position, financial performance andcash flows of the Company.
Measurement ConventionThe financial information has been prepared on a historic cost basis as modified by the revaluation of certain financial instruments.
Going ConcernThe accounts have been prepared on a going concern basis, as detailed in note 1 of the Group financial statements.
Foreign CurrencyTransactions in foreign currencies are translated to the Company’s functional currencies at the foreign exchange rate ruling at the date of the transaction. Monetary assets and liabilities denominated in foreign currencies at the balance sheet date are retranslated to the functional currency at the foreign exchange rate ruling at that date. Foreign exchange differences arising on translation are recognised in the income statement except for differences arising on the retranslation of available for salefinancial assets, which are recognised directly in equity. Non-monetary assets and liabilities that are measured in terms ofhistorical cost in a foreign currency are translated using the exchange rate at the date of the transaction.
Non-Derivative Financial InstrumentsThe Company’s principal financial instruments (other than derivatives) comprise bank loans, investments in subsidiaries, trade and other receivables, cash and cash equivalents, trade and other payables and short-term deposits.
Bank loansBank loans are recorded at amortised cost, net of transaction costs incurred, and are adjusted to amortise transaction costs over the term of the loan.
Investments in subsidiariesInvestments in subsidiaries are carried at cost less impairment.
Trade and other receivablesTrade and other receivables are recognised initially at fair value. Subsequent to initial recognition they are measured at amortisedcost using the effective interest method, less any impairment losses.
Cash and cash equivalentsCash and cash equivalents comprise cash balances and call deposits. These also comprise bank overdrafts that are repayableon demand, for the purpose of the statement of cash flows only.
Trade and other payablesTrade and other payables are recognised initially at fair value. Subsequent to initial recognition they are measured at amortisedcost using the effective interest method.
Property, Plant and EquipmentProperty, plant and equipment are stated at cost less accumulated depreciation and accumulated impairment losses.
Where parts of an item of property, plant and equipment have different useful lives, they are accounted for as separate itemsof property, plant and equipment.
Depreciation is charged to the income statement on a straight-line basis over the estimated useful lives of each part of an itemof property, plant and equipment. Land is not depreciated. The estimated useful lives are as follows:
Method Useful economic life Rate
Short term leasehold property Straight line Over the life of the lease 3 – 5 yearsFixtures and Fittings Straight line 10% – 33% per annum 3 – 10 years
01 /Strategic R
eport02 /
Governance
03 /Financial S
tatements
04 /A Deeper Look
05 /Shareholder Inform
ation/ 175Lonmin Plc
Annual Report and Accounts 2016

Notes to the Company Accounts
34 Accounting Policies (continued)Operating LeasesPayments made under operating leases are recognised in the income statement on a straight-line basis over the term of the lease.
TaxationTax on the profit or loss for the year comprises current and deferred tax. Tax is recognised in the income statement except to the extent that it relates to items recognised directly in equity, in which case it is recognised in equity.
Current tax is the expected tax payable or receivable on the taxable income or loss for the year, using tax rates enacted or substantively enacted at the balance sheet date, and any adjustment to tax payable in respect of previous years.
Deferred tax is provided on temporary differences between the carrying amounts of assets and liabilities for financial reportingpurposes and the amounts used for taxation purposes.
A deferred tax asset is recognised only to the extent that it is probable that future taxable profits will be available against whichthe temporary difference can be utilised.
Employee Benefits
Pension costs and other post-retirement benefitsFor current employees, the Company either makes payments on behalf of employees into a defined contribution schemewhich the Company has set up, or makes direct payments to employees who may then make their own arrangements.
A defined contribution plan is a post-employment benefit plan under which the Company pays fixed contributions into aseparate entity and will have no legal or constructive obligation to pay further amounts. Obligations for contributions todefined contribution pension plans are recognised as an expense in the income statement in the periods during whichservices are rendered by employees.
Share-based payment transactionsFor detail regarding share-based payments, refer to the Group accounting policy on share-based payments in note 1 to the Group accounts.
Financing expensesFinancing expenses comprise interest payable on borrowings, bank fees, interest costs of pension scheme liabilities, and losseson hedging instruments that are recognised in the income statement.
Borrowing costs that are directly attributable to the acquisition, construction or production of an asset that takes a substantialtime to be prepared for use, are capitalised as part of the cost of that asset.
Interest income and interest payable is recognised in profit or loss as it accrues, using the effective interest method.
35 EmployeesThe average number of employees and Directors during the year was as follows:
2016 2015No. No.
South Africa 32 41Europe 8 7
40 48
The aggregate payroll costs of employees, key management and Directors were as follows:
2016 2015Employee costs $m $m
Wages and salaries 9 8Social security costs 1 1Pension costs 1 1Share-based payments 1 5Termination payments 11 3
23 18
/ 176 Lonmin PlcAnnual Report and Accounts 2016

www.lonmin.com
Notes to the Company Accounts
35 Employees (continued)The vast majority of employee costs are denominated in Rand and reported US Dollar costs are therefore subject to foreignexchange movements.
The key management compensation analysed above represents amounts in respect of the Exco which comprised the threeexecutive Directors and four other senior managers (2015 – three executive Directors and four other senior managers).
The Sterling equivalents of total Directors’ emoluments and emoluments of the highest paid Director together with full detailsof Directors’ remuneration, pensions and benefits in kind are given in the Remuneration Committee Report. No emolumentsrelated specifically to their work in the Company.
The Company operates defined contribution schemes in the UK and South Africa. There were no accrued obligations underdefined contribution plans at 30 September 2016 and 2015.
For details of the Company’s share plan and share option schemes, refer to note 24 of the Group accounts.
36 Net finance income / (expenses)2016 2015$m $m
Finance income: 59 29– Interest receivable on cash and cash equivalents 2 1– Interest receivable from loans with subsidiaries 51 27– Dividend received from investment i 1 1– Foreign exchange gains on loans with subsidiaries 5 –
Finance expenses: (15) (39)– Interest payable on bank loans and overdrafts (12) (7)– Bank fees (2) (7)– Foreign exchange losses on net cash / (debt) ii (1) (4)– Foreign exchange losses on loans with subsidiaries – (21)
Special items: (28) (641)– Interest accrued from HDSA receivable (note 13) 27 20– Foreign exchange loss on HDSA receivable (note 13) (60) (28)– Impairment of HDSA receivable (note 13) – (227)– Impairment of loans with subsidiaries – (406)– Gain on retranslation and forward exchange contracts in respect of the Rights Issue (note 29) 5 –
Net finance income / (expenses) 16 (651)
Footnotes:i Dividends received relate to dividends accruing from our investment in Petrozim Line (Private) Limited which were remitted during the year.
The investment in Petrozim Line (Private) Limited has a $nil carrying value as it has been fully impaired.
ii Net (debt) / cash as defined by the Group and Company comprises cash and cash equivalents, bank overdrafts repayable on demand and interestbearing loans and borrowings less unamortised bank fees, unless the unamortised bank fees relate to undrawn facilities in which case they aretreated as other receivables.
01 /Strategic R
eport02 /
Governance
03 /Financial S
tatements
04 /A Deeper Look
05 /Shareholder Inform
ation/ 177Lonmin Plc
Annual Report and Accounts 2016
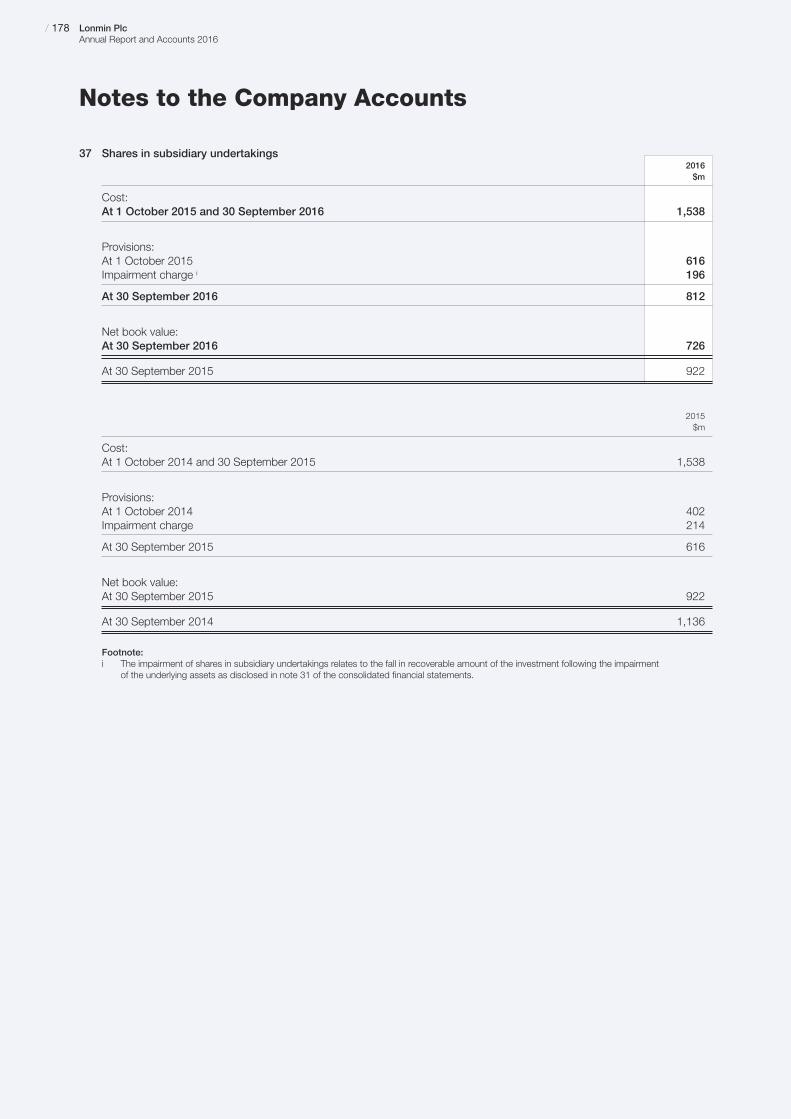
Notes to the Company Accounts
37 Shares in subsidiary undertakings2016$m
Cost:At 1 October 2015 and 30 September 2016 1,538
Provisions:At 1 October 2015 616Impairment charge i 196
At 30 September 2016 812
Net book value:At 30 September 2016 726
At 30 September 2015 922
2015$m
Cost:At 1 October 2014 and 30 September 2015 1,538
Provisions:At 1 October 2014 402Impairment charge 214
At 30 September 2015 616
Net book value:At 30 September 2015 922
At 30 September 2014 1,136
Footnote:i The impairment of shares in subsidiary undertakings relates to the fall in recoverable amount of the investment following the impairment
of the underlying assets as disclosed in note 31 of the consolidated financial statements.
/ 178 Lonmin PlcAnnual Report and Accounts 2016
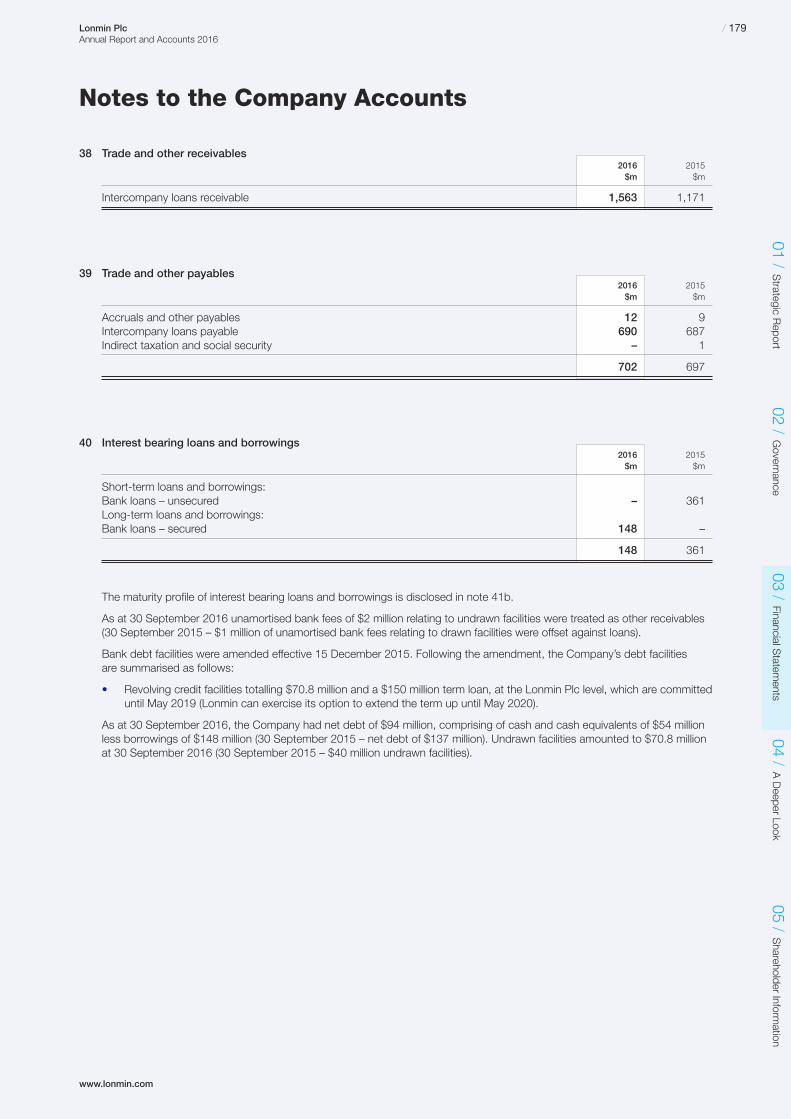
www.lonmin.com
Notes to the Company Accounts
38 Trade and other receivables2016 2015$m $m
Intercompany loans receivable 1,563 1,171
39 Trade and other payables2016 2015$m $m
Accruals and other payables 12 9Intercompany loans payable 690 687Indirect taxation and social security – 1
702 697
40 Interest bearing loans and borrowings2016 2015$m $m
Short-term loans and borrowings:Bank loans – unsecured – 361Long-term loans and borrowings:Bank loans – secured 148 –
148 361
The maturity profile of interest bearing loans and borrowings is disclosed in note 41b.
As at 30 September 2016 unamortised bank fees of $2 million relating to undrawn facilities were treated as other receivables(30 September 2015 – $1 million of unamortised bank fees relating to drawn facilities were offset against loans).
Bank debt facilities were amended effective 15 December 2015. Following the amendment, the Company’s debt facilities are summarised as follows:
Revolving credit facilities totalling $70.8 million and a $150 million term loan, at the Lonmin Plc level, which are committed•until May 2019 (Lonmin can exercise its option to extend the term up until May 2020).
As at 30 September 2016, the Company had net debt of $94 million, comprising of cash and cash equivalents of $54 millionless borrowings of $148 million (30 September 2015 – net debt of $137 million). Undrawn facilities amounted to $70.8 millionat 30 September 2016 (30 September 2015 – $40 million undrawn facilities).
01 /Strategic R
eport02 /
Governance
03 /Financial S
tatements
04 /A Deeper Look
05 /Shareholder Inform
ation/ 179Lonmin Plc
Annual Report and Accounts 2016
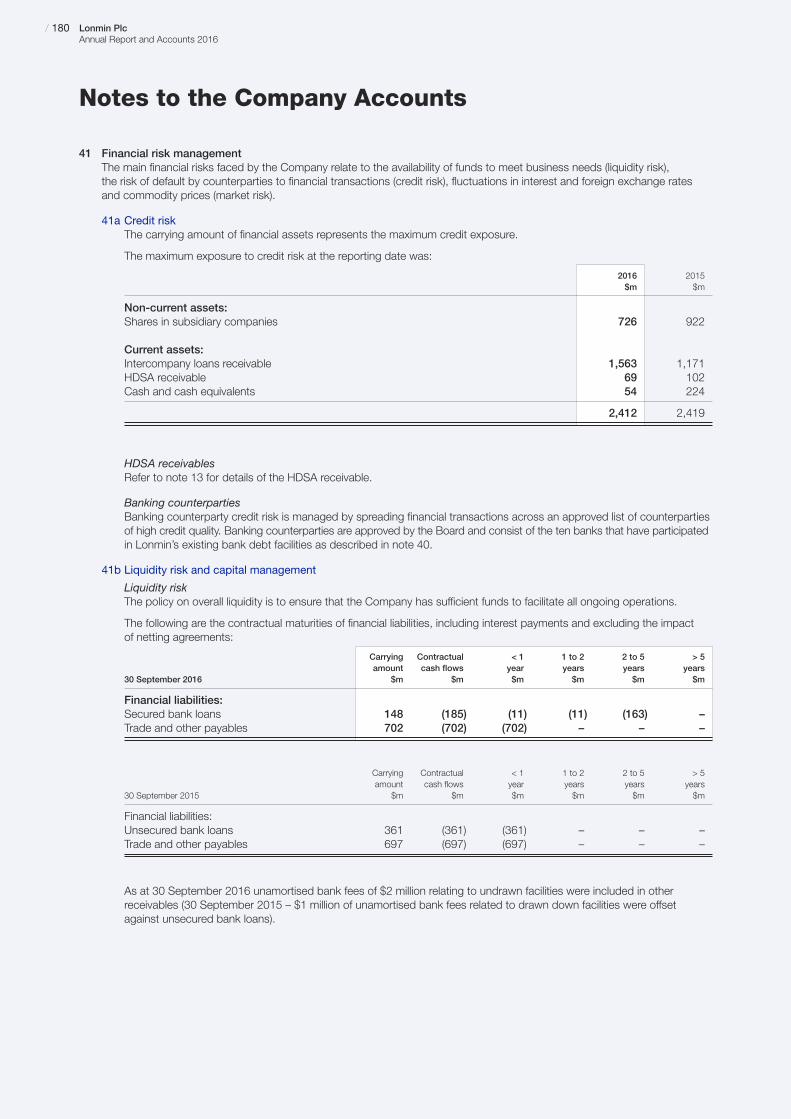
41 Financial risk managementThe main financial risks faced by the Company relate to the availability of funds to meet business needs (liquidity risk), the risk of default by counterparties to financial transactions (credit risk), fluctuations in interest and foreign exchange ratesand commodity prices (market risk).
41a Credit riskThe carrying amount of financial assets represents the maximum credit exposure.
The maximum exposure to credit risk at the reporting date was:
2016 2015$m $m
Non-current assets:Shares in subsidiary companies 726 922
Current assets:Intercompany loans receivable 1,563 1,171 HDSA receivable 69 102 Cash and cash equivalents 54 224
2,412 2,419
HDSA receivablesRefer to note 13 for details of the HDSA receivable.
Banking counterpartiesBanking counterparty credit risk is managed by spreading financial transactions across an approved list of counterpartiesof high credit quality. Banking counterparties are approved by the Board and consist of the ten banks that have participatedin Lonmin’s existing bank debt facilities as described in note 40.
41b Liquidity risk and capital management
Liquidity riskThe policy on overall liquidity is to ensure that the Company has sufficient funds to facilitate all ongoing operations.
The following are the contractual maturities of financial liabilities, including interest payments and excluding the impact of netting agreements:
Carrying Contractual < 1 1 to 2 2 to 5 > 5amount cash flows year years years years
30 September 2016 $m $m $m $m $m $m
Financial liabilities:Secured bank loans 148 (185) (11) (11) (163) –Trade and other payables 702 (702) (702) – – –
Carrying Contractual < 1 1 to 2 2 to 5 > 5amount cash flows year years years years
30 September 2015 $m $m $m $m $m $m
Financial liabilities:Unsecured bank loans 361 (361) (361) – – –Trade and other payables 697 (697) (697) – – –
As at 30 September 2016 unamortised bank fees of $2 million relating to undrawn facilities were included in otherreceivables (30 September 2015 – $1 million of unamortised bank fees related to drawn down facilities were offset against unsecured bank loans).
/ 180 Lonmin PlcAnnual Report and Accounts 2016
Notes to the Company Accounts
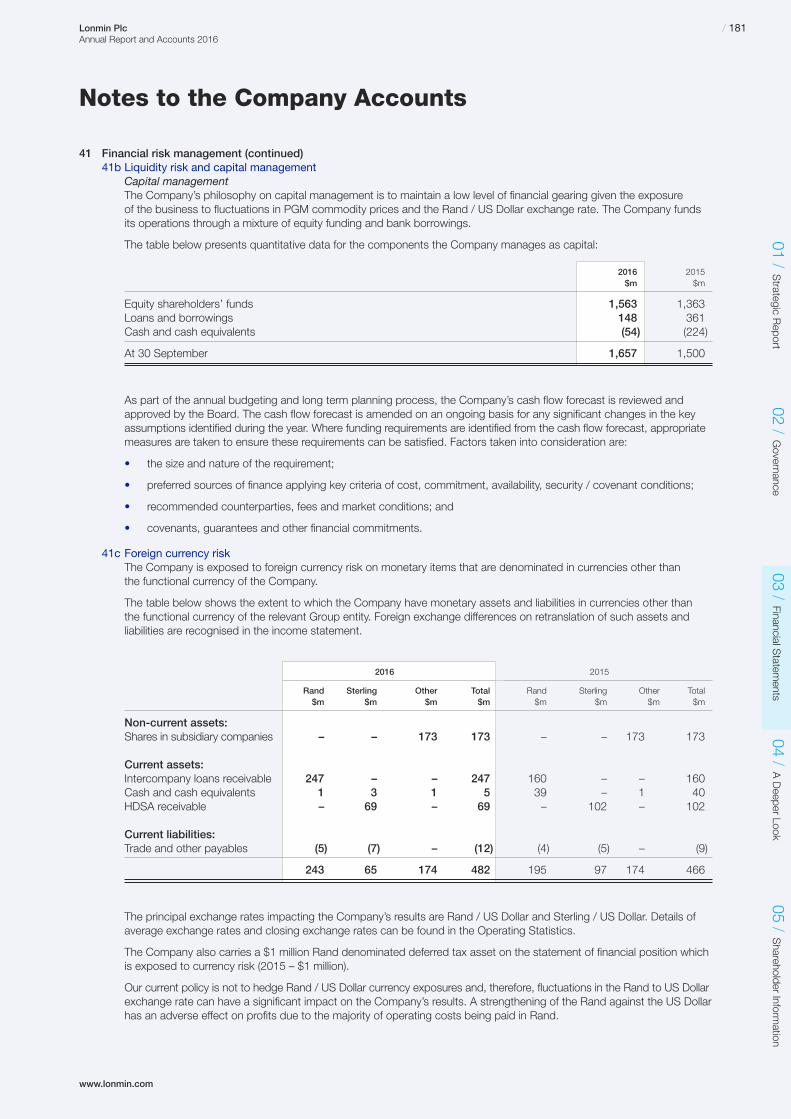
www.lonmin.com
41 Financial risk management (continued)41b Liquidity risk and capital management
Capital managementThe Company’s philosophy on capital management is to maintain a low level of financial gearing given the exposure of the business to fluctuations in PGM commodity prices and the Rand / US Dollar exchange rate. The Company fundsits operations through a mixture of equity funding and bank borrowings.
The table below presents quantitative data for the components the Company manages as capital:
2016 2015$m $m
Equity shareholders’ funds 1,563 1,363Loans and borrowings 148 361Cash and cash equivalents (54) (224)
At 30 September 1,657 1,500
As part of the annual budgeting and long term planning process, the Company’s cash flow forecast is reviewed andapproved by the Board. The cash flow forecast is amended on an ongoing basis for any significant changes in the keyassumptions identified during the year. Where funding requirements are identified from the cash flow forecast, appropriatemeasures are taken to ensure these requirements can be satisfied. Factors taken into consideration are:
the size and nature of the requirement;•
preferred sources of finance applying key criteria of cost, commitment, availability, security / covenant conditions;•
recommended counterparties, fees and market conditions; and•
covenants, guarantees and other financial commitments.•
41c Foreign currency riskThe Company is exposed to foreign currency risk on monetary items that are denominated in currencies other than the functional currency of the Company.
The table below shows the extent to which the Company have monetary assets and liabilities in currencies other than the functional currency of the relevant Group entity. Foreign exchange differences on retranslation of such assets andliabilities are recognised in the income statement.
2016 2015
Rand Sterling Other Total Rand Sterling Other Total$m $m $m $m $m $m $m $m
Non-current assets:Shares in subsidiary companies – – 173 173 – – 173 173
Current assets:Intercompany loans receivable 247 – – 247 160 – – 160Cash and cash equivalents 1 3 1 5 39 – 1 40HDSA receivable – 69 – 69 – 102 – 102
Current liabilities:Trade and other payables (5) (7) – (12) (4) (5) – (9)
243 65 174 482 195 97 174 466
The principal exchange rates impacting the Company’s results are Rand / US Dollar and Sterling / US Dollar. Details ofaverage exchange rates and closing exchange rates can be found in the Operating Statistics.
The Company also carries a $1 million Rand denominated deferred tax asset on the statement of financial position whichis exposed to currency risk (2015 – $1 million).
Our current policy is not to hedge Rand / US Dollar currency exposures and, therefore, fluctuations in the Rand to US Dollarexchange rate can have a significant impact on the Company’s results. A strengthening of the Rand against the US Dollarhas an adverse effect on profits due to the majority of operating costs being paid in Rand.
01 /Strategic R
eport02 /
Governance
03 /Financial S
tatements
04 /A Deeper Look
05 /Shareholder Inform
ation/ 181Lonmin Plc
Annual Report and Accounts 2016
Notes to the Company Accounts

Notes to the Company Accounts
41 Financial risk management (continued)41c Foreign currency risk (continued)
The approximate effects on the Company’s results of a 10% movement in the Rand to US Dollar 2016 average andclosing exchange rate would be as follows:
2016 2015$m $m
Underlying operating profit / (loss) +/− $1m +/− $1mUnderlying profit / (loss) for the year +/− $1m +/− $1mEquity +/− $1m +/− $1mEPS (cents) +/− 0.3c +/− 1.5c
These sensitivities are based on 2016 prices, costs and volumes and assume all other variables remain constant.
41d Interest rate riskThe bulk of our outstanding borrowings are in US Dollars and at floating rates of interest. The interest position is keptunder constant review in conjunction with the liquidity policy outlined in note 41b and the future funding requirements of the business.
Based on contracted maturities, the following amounts are exposed to interest rate risk over future years as shown below:
Weighted averageinterest rate in 2016 2017 2018 2019 2020
% $m $m $m $m
Liabilities:Secured bank loans i 6.2 (150) (150) (150) (150)
Non-interest bearing At floating interest rates At fixed interest rates
2016 2015 2016 2015 2016 2015$m $m $m $m $m $m
Financial assets:US Dollar 554 750 1,365 1,194 – –SA Rand 163 122 85 77 – –Sterling – – 3 – 69 102Other 173 173 1 1 – –
890 1,045 1,454 1,272 69 102
Non-interest bearing At floating interest rates At fixed interest rates
2016 2015 2016 2015 2016 2015$m $m $m $m $m $m
Financial liabilities:US Dollar 690 688 148 361 – –SA Rand 5 4 – – – –Sterling 7 5 – – – –
702 697 148 361 – –
Footnote:i Figures are based on facilities outstanding at the financial reporting date (refer to note 45).
/ 182 Lonmin PlcAnnual Report and Accounts 2016

www.lonmin.com
Notes to the Company Accounts
41 Financial risk management (continued)41e Commodity price risk
The Group policy is not to hedge commodity price exposure on PGMs, except Gold, and therefore any change in prices will have a indirect effect on the Company’s trading results in that the income generated by the branch are based on therevenue from fellow subsidiaries.
The approximate effects on the Company’s results of a 10% movement in the 2016 average metal prices achieved forPlatinum (Pt) ($1,095 per ounce), Palladium (Pd) ($718 per ounce) and Rhodium (Rh) ($998 per ounce) would be as follows:
2016 2015
Pt Pd Rh Pt Pd Rh
Underlying operating profit / (loss) +/− $2.8m +/− $0.8m +/− $0.3m +/− $3.2m +/− $1m +/− $0.4mUnderlying profit / (loss) for the year +/− $2.0m +/− $0.6m +/− $0.2m +/− $2.3m +/− $0.7m +/− $0.3mEquity +/− $2.0m +/− $0.6m +/− $0.2m +/− $2.3m +/− $0.7m +/− $0.3mEPS (cents) – – – – – –
These sensitivities are based on 2016 prices, costs and volumes and assume all other variables remain constant.
41f Fair valuesThe fair value of financial assets and liabilities were equivalent to their carrying amounts and are as follows:
2016 2015Carrying Carryingamount amount
$m $m
Shares in subsidiary companies 726 922HDSA receivable 69 102Intercompany loans receivable 1,563 1,171Cash and cash equivalents 54 224
Financial assets 2,412 2,419
Trade and other payables (702) (697)Bank loans (150) (362)
Financial liabilities (852) (1,059)
Net financial assets 1,560 1,360
The HDSA receivable represents loans held at amortised cost.
Trade and other receivables (excluding prepayments and accrued income) and trade and other payables are typically due within one month and therefore the carrying amount is fair value.
For financial assets and liabilities the carrying value is equal to fair value.
For bank loans, there is considered to be no material difference between the carrying amount and fair value. Amounts are shown gross of unamortised bank fees unless the unamortised bank fees relate to undrawn facilities in which casethey are treated as other receivables.
01 /Strategic R
eport02 /
Governance
03 /Financial S
tatements
04 /A Deeper Look
05 /Shareholder Inform
ation/ 183Lonmin Plc
Annual Report and Accounts 2016
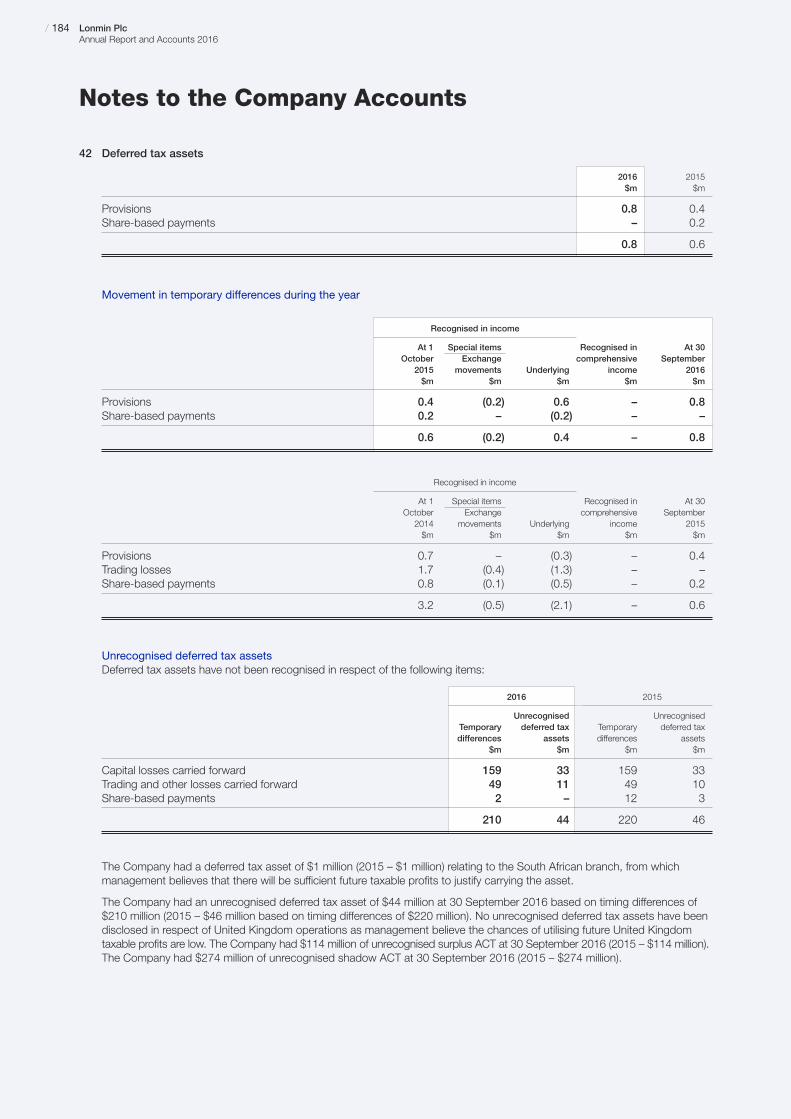
Notes to the Company Accounts
42 Deferred tax assets
2016 2015$m $m
Provisions 0.8 0.4Share-based payments – 0.2
0.8 0.6
Movement in temporary differences during the year
Recognised in income
At 1 Special items Recognised in At 30October Exchange comprehensive September
2015 movements Underlying income 2016$m $m $m $m $m
Provisions 0.4 (0.2) 0.6 – 0.8Share-based payments 0.2 – (0.2) – –
0.6 (0.2) 0.4 – 0.8
Recognised in income
At 1 Special items Recognised in At 30October Exchange comprehensive September2014 movements Underlying income 2015$m $m $m $m $m
Provisions 0.7 – (0.3) – 0.4Trading losses 1.7 (0.4) (1.3) – –Share-based payments 0.8 (0.1) (0.5) – 0.2
3.2 (0.5) (2.1) – 0.6
Unrecognised deferred tax assetsDeferred tax assets have not been recognised in respect of the following items:
2016 2015
Unrecognised UnrecognisedTemporary deferred tax Temporary deferred taxdifferences assets differences assets
$m $m $m $m
Capital losses carried forward 159 33 159 33Trading and other losses carried forward 49 11 49 10Share-based payments 2 – 12 3
210 44 220 46
The Company had a deferred tax asset of $1 million (2015 – $1 million) relating to the South African branch, from whichmanagement believes that there will be sufficient future taxable profits to justify carrying the asset.
The Company had an unrecognised deferred tax asset of $44 million at 30 September 2016 based on timing differences of$210 million (2015 – $46 million based on timing differences of $220 million). No unrecognised deferred tax assets have beendisclosed in respect of United Kingdom operations as management believe the chances of utilising future United Kingdomtaxable profits are low. The Company had $114 million of unrecognised surplus ACT at 30 September 2016 (2015 – $114 million).The Company had $274 million of unrecognised shadow ACT at 30 September 2016 (2015 – $274 million).
/ 184 Lonmin PlcAnnual Report and Accounts 2016
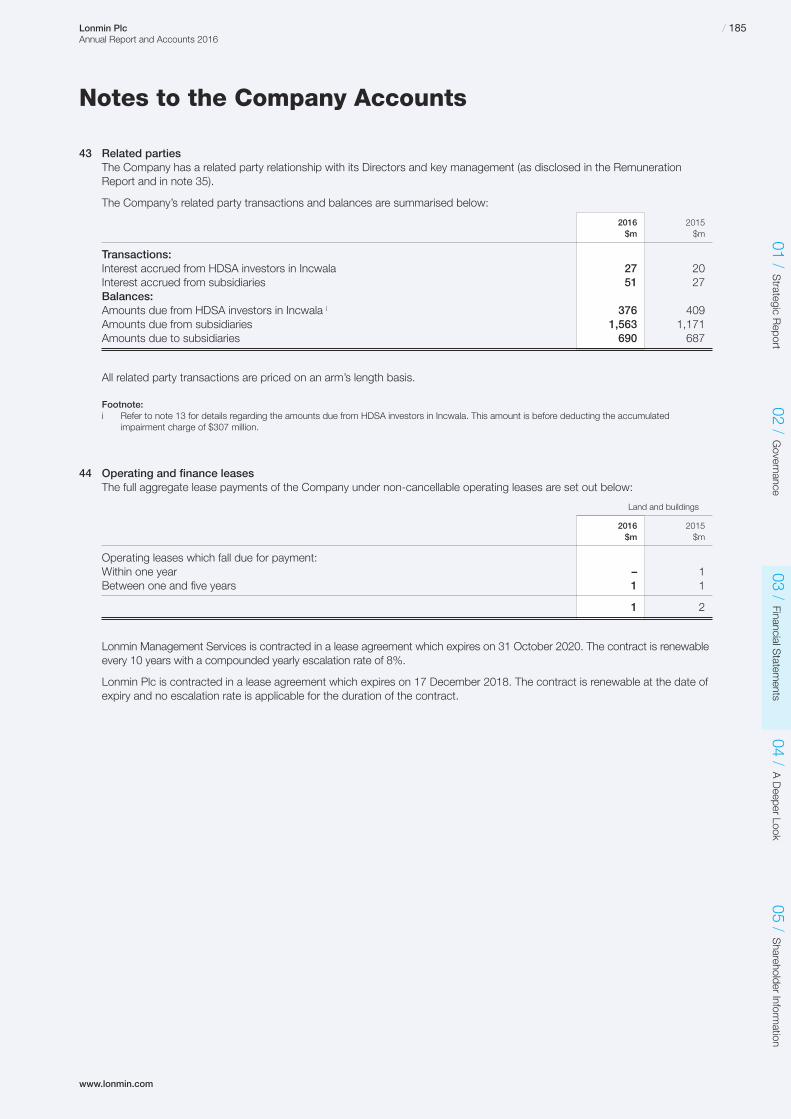
www.lonmin.com
Notes to the Company Accounts
43 Related partiesThe Company has a related party relationship with its Directors and key management (as disclosed in the RemunerationReport and in note 35).
The Company’s related party transactions and balances are summarised below:
2016 2015$m $m
Transactions:Interest accrued from HDSA investors in Incwala 27 20Interest accrued from subsidiaries 51 27Balances:Amounts due from HDSA investors in Incwala i 376 409Amounts due from subsidiaries 1,563 1,171Amounts due to subsidiaries 690 687
All related party transactions are priced on an arm’s length basis.
Footnote:i Refer to note 13 for details regarding the amounts due from HDSA investors in Incwala. This amount is before deducting the accumulated
impairment charge of $307 million.
44 Operating and finance leasesThe full aggregate lease payments of the Company under non-cancellable operating leases are set out below:
Land and buildings
2016 2015$m $m
Operating leases which fall due for payment:Within one year – 1Between one and five years 1 1
1 2
Lonmin Management Services is contracted in a lease agreement which expires on 31 October 2020. The contract is renewableevery 10 years with a compounded yearly escalation rate of 8%.
Lonmin Plc is contracted in a lease agreement which expires on 17 December 2018. The contract is renewable at the date ofexpiry and no escalation rate is applicable for the duration of the contract.
01 /Strategic R
eport02 /
Governance
03 /Financial S
tatements
04 /A Deeper Look
05 /Shareholder Inform
ation/ 185Lonmin Plc
Annual Report and Accounts 2016
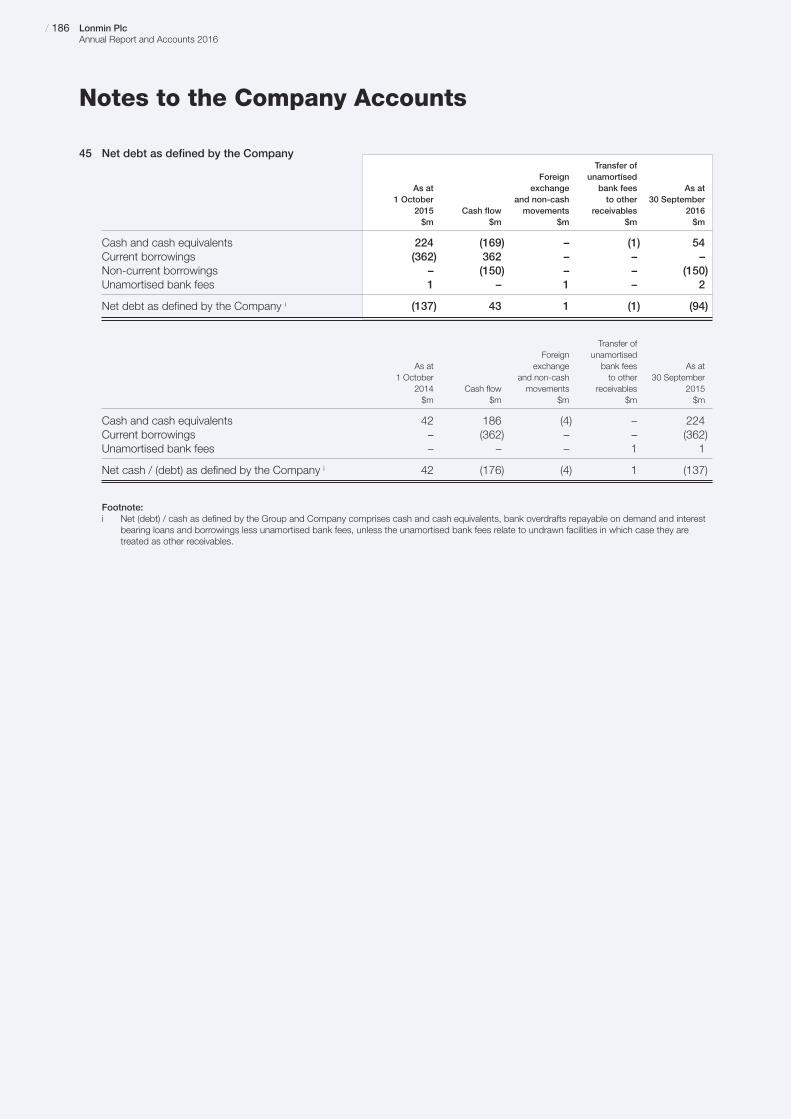
Notes to the Company Accounts
45 Net debt as defined by the CompanyTransfer of
Foreign unamortised As at exchange bank fees As at
1 October and non-cash to other 30 September2015 Cash flow movements receivables 2016$m $m $m $m $m
Cash and cash equivalents 224 (169) – (1) 54Current borrowings (362) 362 – – –Non-current borrowings – (150) – – (150)Unamortised bank fees 1 – 1 – 2
Net debt as defined by the Company i (137) 43 1 (1) (94)
Transfer of Foreign unamortised
As at exchange bank fees As at1 October and non-cash to other 30 September
2014 Cash flow movements receivables 2015$m $m $m $m $m
Cash and cash equivalents 42 186 (4) – 224Current borrowings – (362) – – (362)Unamortised bank fees – – – 1 1
Net cash / (debt) as defined by the Company i 42 (176) (4) 1 (137)
Footnote:i Net (debt) / cash as defined by the Group and Company comprises cash and cash equivalents, bank overdrafts repayable on demand and interest
bearing loans and borrowings less unamortised bank fees, unless the unamortised bank fees relate to undrawn facilities in which case they aretreated as other receivables.
/ 186 Lonmin PlcAnnual Report and Accounts 2016
A DeeperLook
01 /Strategic R
eport02 /
Governance
03 /Financial S
tatements
04 /A Deeper Look
05 /Shareholder Inform
ation/ 187Lonmin Plc
Annual Report and Accounts 2016
188 Consolidated Group Five Year Financial Record189 Operating Statistics – Five Year Review195 Mineral Resources and Mineral Reserves
04/
Key financial and operational statistics over the past five years anda summary of our mineral resource and mineral reserve information.
www.lonmin.com

/ 188 Lonmin PlcAnnual Report and Accounts 2016
Consolidated Group Five Year Financial Recordfor the year ended 30 September
Continuing operations 2016 2015 2014 2013 2012
Consolidated income statement:Revenue $m 1,118 1,293 965 1,520 1,614Operating (loss) / profit $m (322) (2,018) (255) 147 (702)Underlying operating profit / (loss) $m 7 (134) 52 164 67(Loss) / profit before taxation $m (355) (2,262) (326) 140 (698)Underlying (loss) / profit before taxation $m (3) (143) 46 158 57Attributable (loss) / profit for the year $m (342) (1,661) (188) 166 (410)Underlying attributable (loss) / profit for the year $m (89) (94) 31 109 15Basic (loss) / earnings per share i cents (137.0) (3,437.6) (398.1) 376.4 (1,299.3)Underlying (loss) / earnings per share i cents (35.6) (194.5) 65.7 247.2 47.5
Consolidated statement of financial position:Non-current assets – property, plant and equipment $m 1,158 1,477 2,882 2,908 2,889Non-current assets – other $m 156 177 552 968 1,077Net current assets $m 511 – 574 422 177Net cash / (debt) $m 173 (185) (29) 201 (421)Equity shareholders’ funds $m 1,669 1,629 3,233 3,409 2,488Equity shareholders’ funds per share i cents 591 3,349 6,835 7,233 7,870Cost of dividend paid $m – – – – 31Dividends per share paid cents – – – – 15.0Dividend in respect of the year per share cents – – – – –
Consolidated statement of cash flows:Cash inflow / (outflow) from operating activities $m 58 (12) (116) 16 263Free cash outflow $m (31) (167) (246) (154) (159)Trading cash inflow / (outflow) per share i cents 23.2 (24.8) (245.7) 36.3 833.4Free cash (outflow) / inflow per share i cents (12.4) (345.6) (521.0) (349.2) (503.9)
Footnote:i The number of shares held prior to 12 December 2015 has been adjusted by a factor of 0.08 to reflect the bonus element of the Rights Issue.

www.lonmin.com
/ 189Lonmin PlcAnnual Report and Accounts 2016
01 /Strategic R
eport02 /
Governance
03 /Financial S
tatements
04 /A Deeper Look
05 /Shareholder Inform
ation
Operating Statistics – Five Year Review
Units 2016 2015 2014 2013 2012
Tonnes mined1 Generation 2 K3 shaft kt 2,687 2,713 1,484 3,101 2,646Rowland shaft kt 1,731 1,872 1,005 1,781 1,599Saffy shaft kt 2,055 1,758 782 1,150 8984B shaft kt 1,588 1,409 768 1,559 1,333
Generation 2 kt 8,061 7,752 4,039 7,591 6,475
1B shaft kt 6 219 123 286 289Hossy shaft kt 712 953 609 1,051 864
Generation 1 Newman shaft kt 346 765 428 948 919W1 shaft kt 162 180 102 170 126East 1 shaft kt 141 148 104 390 496East 2 shaft kt 293 390 279 426 397East 3 shaft kt 63 68 28 94 104Pandora (100%)2 kt 471 544 299 571 435
Generation 1 kt 2,196 3,267 1,973 3,935 3,628
K4 shaft kt – 49 – 4 117
Total Underground kt 10,256 11,067 6,012 11,531 10,221
Opencast kt 49 230 333 528 443
Total Underground & Opencast kt 10,305 11,297 6,345 12,058 10,663
Limpopo3 Underground kt – – 6 – –
Lonmin (100%) Total Tonnes mined kt 10,305 11,297 6,351 12,058 10,663% tonnes mined from UG2 reef (100%) % 75.3% 75.1% 74.1% 73.9% 71.7%
Lonmin (attributable) Underground & Opencast kt 10,070 11,016 6,180 11,730 10,413
Ounces mined4 Lonmin excluding Pandora Platinum oz 627,245 668,319 371,651 717,882 635,346Pandora (100%) Platinum oz 32,509 36,458 20,327 40,917 30,714Limpopo Platinum oz – – 255 – –
Lonmin Platinum oz 659,754 704,776 392,233 758,799 666,060Lonmin excludingPandora Total PGMs oz 1,200,244 1,280,964 707,913 1,340,678 1,174,776Pandora (100%) Total PGMs oz 63,857 71,861 40,044 78,353 58,300Limpopo Total PGMs oz – – 572 – –
Lonmin Total PGMs oz 1,264,101 1,352,825 748,529 1,419,032 1,233,076
Tonnes milled5 Marikana Underground kt 9,806 10,930 5,389 10,854 9,936Opencast kt 98 318 422 393 450Total kt 9,904 11,248 5,810 11,248 10,386
Pandora (100%)6 Underground kt 471 562 281 574 432
Limpopo7 Underground kt – – 27 – –
Lonmin Platinum Underground kt 10,277 11,491 5,696 11,428 10,367Opencast kt 98 318 422 393 450Total kt 10,375 11,810 6,118 11,822 10,817
Milled head Lonmin Platinum Underground g/t 4.60 4.51 4.48 4.60 4.56grade8 Opencast g/t 3.59 3.08 3.20 2.92 3.01
Total g/t 4.59 4.47 4.39 4.54 4.49
Concentrator Lonmin Platinum Underground % 86.7 86.8 87.0 87.0 86.1recovery rate9 Opencast % 73.6 85.1 84.5 85.3 85.9
Total % 86.6 86.7 86.9 87.0 86.1

/ 190 Lonmin PlcAnnual Report and Accounts 2016
Operating Statistics – Five Year Review
Units 2016 2015 2014 2013 2012
Metals-in- Marikana Platinum oz 631,066 696,489 355,926 706,012 646,393 concentrate10 Palladium oz 292,315 323,177 164,960 323,622 295,409
Gold oz 15,206 16,503 9,879 17,664 16,925Rhodium oz 90,151 101,435 49,908 95,241 83,144Ruthenium oz 147,740 165,689 81,693 144,304 127,269Iridium oz 29,845 32,416 16,143 33,059 27,610Total PGMs oz 1,206,322 1,335,710 678,508 1,319,902 1,196,750
Limpopo Platinum oz – – 1,121 – –Palladium oz – – 974 – –Gold oz – – 93 – –Rhodium oz – – 114 – –Ruthenium oz – – 161 – –Iridium oz – – 44 – –Total PGMs oz – – 2,508 – –
Pandora Platinum oz 32,509 37,553 18,913 41,117 30,625Palladium oz 15,231 17,496 8,960 19,190 14,261Gold oz 95 131 54 315 228Rhodium oz 5,360 6,383 3,226 6,563 4,743Ruthenium oz 8,852 10,466 5,168 9,764 7,135Iridium oz 1,811 1,988 916 1,773 1,195Total PGMs oz 63,857 74,019 37,237 78,721 58,188
Lonmin Platinum Platinum oz 663,575 734,042 375,960 747,129 677,019before Concentrate Palladium oz 307,545 340,673 174,894 342,812 309,670Purchases Gold oz 15,301 16,635 10,026 17,979 17,153
Rhodium oz 95,511 107,818 53,248 101,803 87,886Ruthenium oz 156,591 176,156 87,022 154,067 134,404Iridium oz 31,655 34,405 17,103 34,832 28,805Total PGMs oz 1,270,179 1,409,729 718,253 1,398,623 1,254,938
Concentrate Platinum oz 5,129 6,273 4,398 3,813 2,802Purchases Palladium oz 1,555 1,869 1,242 1,132 973
Gold oz 18 18 14 14 10Rhodium oz 565 816 531 421 329Ruthenium oz 919 1,079 546 428 404Iridium oz 242 338 224 172 129Total PGMs oz 8,429 10,394 6,955 5,980 4,647
Lonmin Platinum Platinum oz 668,704 740,315 380,359 750,942 679,821Palladium oz 309,101 342,542 176,136 343,944 310,643Gold oz 15,319 16,653 10,040 17,993 17,163Rhodium oz 96,076 108,634 53,779 102,225 88,216Ruthenium oz 157,510 177,235 87,567 154,495 134,808Iridium oz 31,898 34,743 17,327 35,004 28,934Total PGMs oz 1,278,607 1,420,122 725,208 1,404,603 1,259,585Nickel11 MT 3,265 3,669 2,092 3,743 3,489Copper11 MT 1,983 2,250 1,314 2,340 2,226
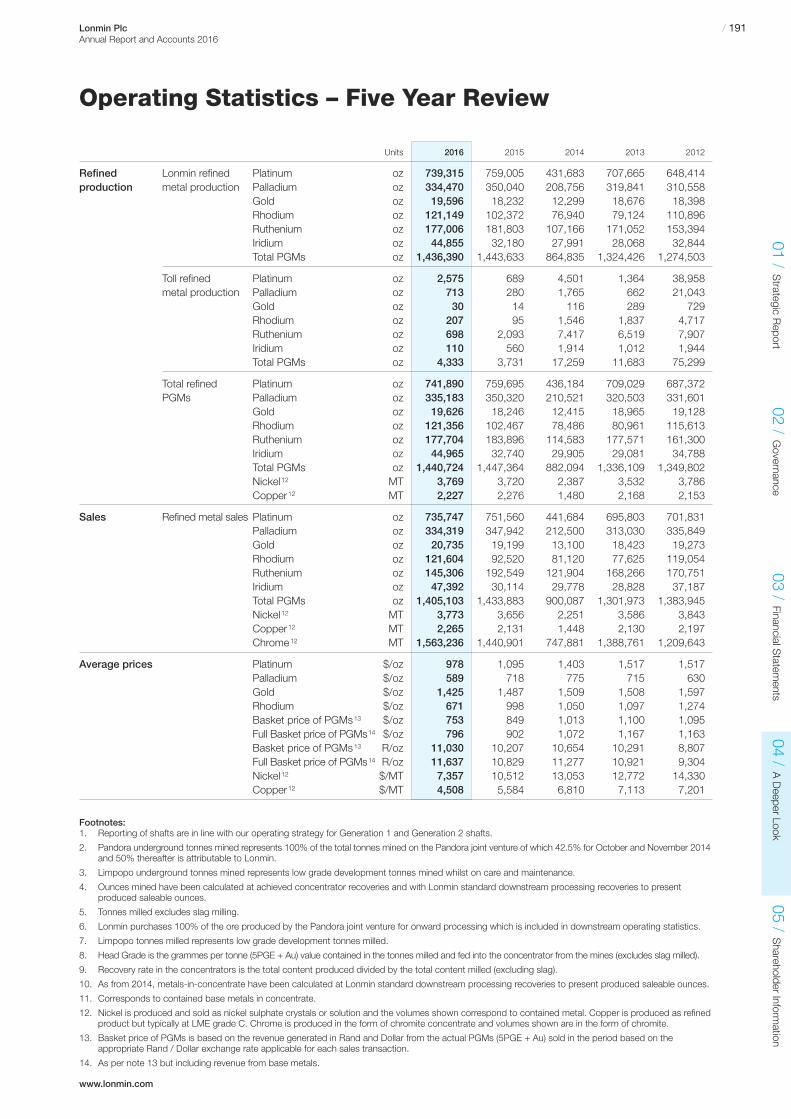
www.lonmin.com
/ 191Lonmin PlcAnnual Report and Accounts 2016
01 /Strategic R
eport02 /
Governance
03 /Financial S
tatements
04 /A Deeper Look
05 /Shareholder Inform
ation
Operating Statistics – Five Year Review
Units 2016 2015 2014 2013 2012
Refined Lonmin refined Platinum oz 739,315 759,005 431,683 707,665 648,414production metal production Palladium oz 334,470 350,040 208,756 319,841 310,558
Gold oz 19,596 18,232 12,299 18,676 18,398Rhodium oz 121,149 102,372 76,940 79,124 110,896Ruthenium oz 177,006 181,803 107,166 171,052 153,394Iridium oz 44,855 32,180 27,991 28,068 32,844Total PGMs oz 1,436,390 1,443,633 864,835 1,324,426 1,274,503
Toll refined Platinum oz 2,575 689 4,501 1,364 38,958metal production Palladium oz 713 280 1,765 662 21,043
Gold oz 30 14 116 289 729Rhodium oz 207 95 1,546 1,837 4,717Ruthenium oz 698 2,093 7,417 6,519 7,907Iridium oz 110 560 1,914 1,012 1,944Total PGMs oz 4,333 3,731 17,259 11,683 75,299
Total refined Platinum oz 741,890 759,695 436,184 709,029 687,372PGMs Palladium oz 335,183 350,320 210,521 320,503 331,601
Gold oz 19,626 18,246 12,415 18,965 19,128Rhodium oz 121,356 102,467 78,486 80,961 115,613Ruthenium oz 177,704 183,896 114,583 177,571 161,300Iridium oz 44,965 32,740 29,905 29,081 34,788Total PGMs oz 1,440,724 1,447,364 882,094 1,336,109 1,349,802Nickel12 MT 3,769 3,720 2,387 3,532 3,786Copper12 MT 2,227 2,276 1,480 2,168 2,153
Sales Refined metal sales Platinum oz 735,747 751,560 441,684 695,803 701,831Palladium oz 334,319 347,942 212,500 313,030 335,849Gold oz 20,735 19,199 13,100 18,423 19,273Rhodium oz 121,604 92,520 81,120 77,625 119,054Ruthenium oz 145,306 192,549 121,904 168,266 170,751Iridium oz 47,392 30,114 29,778 28,828 37,187Total PGMs oz 1,405,103 1,433,883 900,087 1,301,973 1,383,945Nickel12 MT 3,773 3,656 2,251 3,586 3,843Copper12 MT 2,265 2,131 1,448 2,130 2,197Chrome12 MT 1,563,236 1,440,901 747,881 1,388,761 1,209,643
Average prices Platinum $/oz 978 1,095 1,403 1,517 1,517Palladium $/oz 589 718 775 715 630Gold $/oz 1,425 1,487 1,509 1,508 1,597Rhodium $/oz 671 998 1,050 1,097 1,274Basket price of PGMs13 $/oz 753 849 1,013 1,100 1,095Full Basket price of PGMs14 $/oz 796 902 1,072 1,167 1,163Basket price of PGMs13 R/oz 11,030 10,207 10,654 10,291 8,807Full Basket price of PGMs14 R/oz 11,637 10,829 11,277 10,921 9,304Nickel12 $/MT 7,357 10,512 13,053 12,772 14,330Copper12 $/MT 4,508 5,584 6,810 7,113 7,201
Footnotes:1. Reporting of shafts are in line with our operating strategy for Generation 1 and Generation 2 shafts.
2. Pandora underground tonnes mined represents 100% of the total tonnes mined on the Pandora joint venture of which 42.5% for October and November 2014and 50% thereafter is attributable to Lonmin.
3. Limpopo underground tonnes mined represents low grade development tonnes mined whilst on care and maintenance.
4. Ounces mined have been calculated at achieved concentrator recoveries and with Lonmin standard downstream processing recoveries to presentproduced saleable ounces.
5. Tonnes milled excludes slag milling.
6. Lonmin purchases 100% of the ore produced by the Pandora joint venture for onward processing which is included in downstream operating statistics.
7. Limpopo tonnes milled represents low grade development tonnes milled.
8. Head Grade is the grammes per tonne (5PGE + Au) value contained in the tonnes milled and fed into the concentrator from the mines (excludes slag milled).
9. Recovery rate in the concentrators is the total content produced divided by the total content milled (excluding slag).
10. As from 2014, metals-in-concentrate have been calculated at Lonmin standard downstream processing recoveries to present produced saleable ounces.
11. Corresponds to contained base metals in concentrate.
12. Nickel is produced and sold as nickel sulphate crystals or solution and the volumes shown correspond to contained metal. Copper is produced as refinedproduct but typically at LME grade C. Chrome is produced in the form of chromite concentrate and volumes shown are in the form of chromite.
13. Basket price of PGMs is based on the revenue generated in Rand and Dollar from the actual PGMs (5PGE + Au) sold in the period based on theappropriate Rand / Dollar exchange rate applicable for each sales transaction.
14. As per note 13 but including revenue from base metals.

/ 192 Lonmin PlcAnnual Report and Accounts 2016
Operating Statistics – Five Year Review
Units 2016 2015 2014 2013 2012
Capital expenditure15 Rm 1,268 1,641 992 1,500 3,296$m 89 136 93 159 408
Employees and as at 30 September Employees # 25,296 26,968 28,276 28,379 28,230contractors as at 30 September Contractors # 7,497 8,701 10,016 10,042 8,293
Productivity m2 per mining K3 shaft m2/person 5.6 5.5 2.9 6.0 5.5(Generation 2) employee 4B/1B shaft16 m2/person 7.6 6.8 3.7 7.7 6.9
(shaft head) Rowland shaft m2/person 5.6 5.9 3.1 5.7 5.7Saffy shaft m2/person 5.5 4.6 2.1 3.8 3.8
Generation 2 m2/person 5.9 5.6 2.9 5.8 5.5
m2 per stoping K3 shaft m2/crew 284.5 285.4 151.4 313.4 n/a& white area crew 4B/1B shaft16 m2/crew 387.7 338.8 180.5 371.2 n/a
Rowland shaft m2/crew 340.7 335.1 200.2 344.4 n/aSaffy shaft m2/crew 292.6 243.5 121.7 249.4 n/a
Generation 2 m2/crew 316.4 296.4 160.6 321.8 n/a
Exchange rates Average rate for period17 R/$ 14.77 12.01 10.55 9.24 8.05£/$ 0.70 0.65 0.60 0.64 0.63
Closing rate R/$ 13.71 13.83 11.29 9.99 8.30£/$ 0.77 0.66 0.62 0.62 0.62
Underlying cost PGM operations Mining $m (625) (785) (622) (919) (877)of sales segment Concentrating $m (114) (145) (107) (159) (168)
Smelting and refining18 $m (102) (120) (106) (133) (147)Shared services $m (49) (71) (74) (101) (100)Management and marketing services $m (21) (25) (24) (26) (35)Ore, Concentrate and other purchases $m (34) (48) (38) (64) (48)Limpopo mining $m (2) (2) (3) (7) (9)Special item adjustment $m – – 287 – 121Community trusts donations $m (1) (1) – – –Royalties $m (7) (9) (5) (6) (8)Share based payments $m (11) (14) (15) (13) (12)Inventory movement $m (34) (84) (79) 203 (140)FX and Group Charges $m (1) 51 25 44 14
Total PGM operations segment $m (998) (1,253) (761) (1,181) (1,412)
Evaluation – excluding FX $m – – – 1 2Exploration – excluding FX $m (5) (7) (6) (4) (5)Corporate – excluding FX $m (3) (2) (2) (10) (4)FX $m (2) (10) (1) (4) (2)
Total underlying cost of sales $m (1,008) (1,272) (771) (1,199) (1,421)
PGM operations Mining Rm (9,155) (9,414) (6,556) (8,545) (7,079)segment Concentrating Rm (1,650) (1,731) (1,121) (1,469) (1,346)
Smelting and refining18 Rm (1,470) (1,426) (1,119) (1,235) (1,183)Shared services Rm (721) (810) (786) (928) (805)Management and marketing services Rm (304) (294) (256) (243) (287)Ore, Concentrate and other purchases Rm (494) (574) (402) (597) (385)Limpopo mining Rm (23) (25) (31) (61) (76)Special Item Adjustment Rm – – 3,028 – 966Community trusts donations Rm (15) (10) – – –Royalties Rm (94) (103) (52) (55) (68)Share based Payments Rm (158) (164) (148) (121) (99)Inventory movement Rm (510) 6 (480) 2,145 (842)FX and Group Charges Rm 265 (2,659) (1,117) (1,247) (218)
Rm (14,328) (17,203) (9,040) (12,356) (11,424)

www.lonmin.com
/ 193Lonmin PlcAnnual Report and Accounts 2016
01 /Strategic R
eport02 /
Governance
03 /Financial S
tatements
04 /A Deeper Look
05 /Shareholder Inform
ation
Operating Statistics – Five Year Review
Units 2016 2015 2014 2013 2012
Shaft head Rand per tonne K3 shaft R/T (890) (840) (990) (629) (599)unit cost 4B/1B shaft16 R/T (714) (760) (859) (571) (527)– underground operations Rowland shaft R/T (936) (825) (992) (694) (631)excluding K4 Saffy shaft R/T (858) (886) (1,164) (878) (853)
Generation 2 R/T (857) (830) (995) (666) (623)
Hossy shaft R/T (915) (927) (1,002) (749) (698)Newman shaft R/T (1,008) (738) (907) (592) (603)East 1 shaft R/T (1,041) (1,025) (1,162) (611) (505)East 2 shaft R/T (1,033) (824) (831) (657) (642)East 3 shaft & ore purchases R/T (927) (872) (964) (905) (788)W1 shaft R/T (920) (902) (987) (934) (989)
Generation 1 R/T (957) (858) (956) (720) (662)
Total Underground R/T (878) (838) (983) (683) (636)
Rand per PGM oz K3 shaft R/oz (7,409) (7,171) (8,683) (5,314) n/a4B/1B shaft16 R/oz (6,806) (7,442) (8,231) (5,385) n/aRowland shaft R/oz (7,359) (6,428) (7,727) (5,292) n/aSaffy shaft R/oz (6,755) (7,143) (9,702) (7,912) n/a
Generation 2 R/oz (7,118) (7,023) (8,539) (5,683) n/a
Hossy shaft R/oz (6,961) (8,375) (8,472) (6,671) n/aNewman shaft R/oz (7,568) (5,412) (6,741) (4,626) n/aEast 1 shaft R/oz (7,949) (7,406) (8,233) (4,805) n/aEast 2 shaft R/oz (7,654) (6,163) (6,924) (5,175) n/aEast 3 shaft& ore purchases R/oz (6,960) (6,522) (7,201) (6,606) n/aW1 shaft R/oz (7,565) (7,362) (6,969) (7,695) n/a
Generation 1 R/oz (7,257) (6,774) (7,487) (5,778) n/a
Total Underground R/oz (7,150) (6,950) (8,195) (5,714) n/a
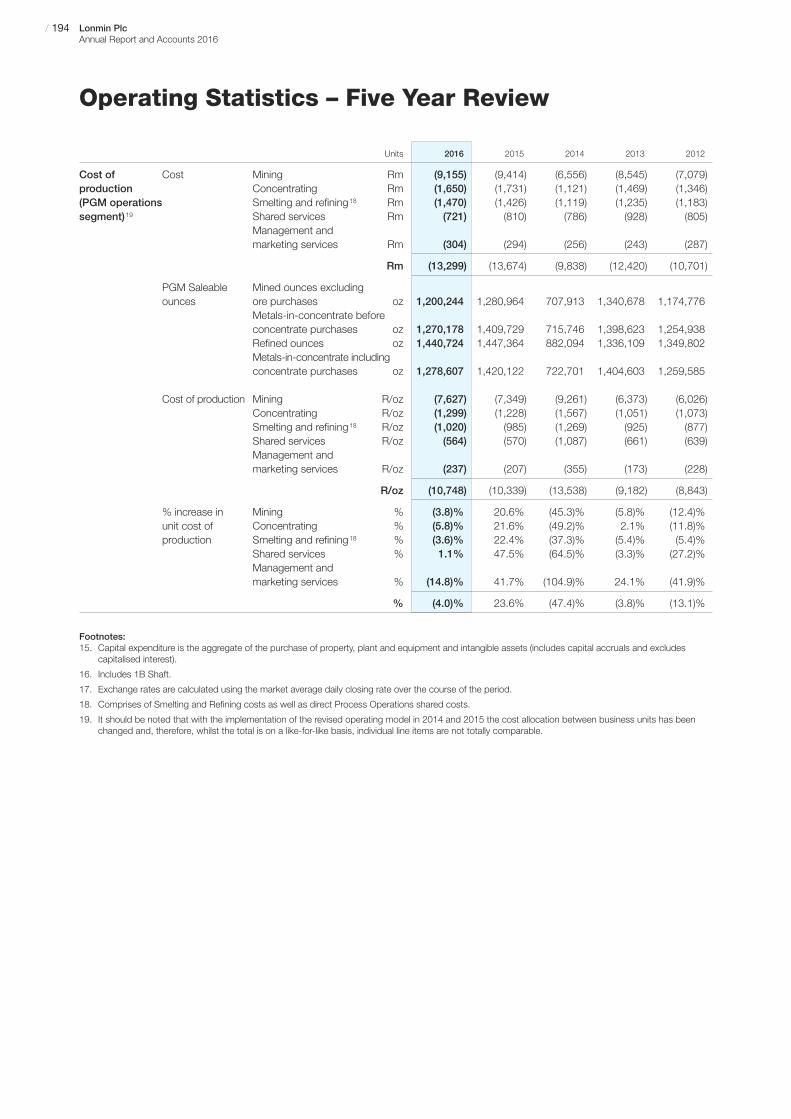
/ 194 Lonmin PlcAnnual Report and Accounts 2016
Operating Statistics – Five Year Review
Units 2016 2015 2014 2013 2012
Cost of Cost Mining Rm (9,155) (9,414) (6,556) (8,545) (7,079)production Concentrating Rm (1,650) (1,731) (1,121) (1,469) (1,346)(PGM operations Smelting and refining18 Rm (1,470) (1,426) (1,119) (1,235) (1,183)segment)19 Shared services Rm (721) (810) (786) (928) (805)
Management and marketing services Rm (304) (294) (256) (243) (287)
Rm (13,299) (13,674) (9,838) (12,420) (10,701)
PGM Saleable Mined ounces excluding ounces ore purchases oz 1,200,244 1,280,964 707,913 1,340,678 1,174,776
Metals-in-concentrate before concentrate purchases oz 1,270,178 1,409,729 715,746 1,398,623 1,254,938Refined ounces oz 1,440,724 1,447,364 882,094 1,336,109 1,349,802Metals-in-concentrate including concentrate purchases oz 1,278,607 1,420,122 722,701 1,404,603 1,259,585
Cost of production Mining R/oz (7,627) (7,349) (9,261) (6,373) (6,026)Concentrating R/oz (1,299) (1,228) (1,567) (1,051) (1,073)Smelting and refining18 R/oz (1,020) (985) (1,269) (925) (877)Shared services R/oz (564) (570) (1,087) (661) (639)Management and marketing services R/oz (237) (207) (355) (173) (228)
R/oz (10,748) (10,339) (13,538) (9,182) (8,843)
% increase in Mining % (3.8)% 20.6% (45.3)% (5.8)% (12.4)%unit cost of Concentrating % (5.8)% 21.6% (49.2)% 2.1% (11.8)%production Smelting and refining18 % (3.6)% 22.4% (37.3)% (5.4)% (5.4)%
Shared services % 1.1% 47.5% (64.5)% (3.3)% (27.2)%Management and marketing services % (14.8)% 41.7% (104.9)% 24.1% (41.9)%
% (4.0)% 23.6% (47.4)% (3.8)% (13.1)%
Footnotes:15. Capital expenditure is the aggregate of the purchase of property, plant and equipment and intangible assets (includes capital accruals and excludes
capitalised interest).
16. Includes 1B Shaft.
17. Exchange rates are calculated using the market average daily closing rate over the course of the period.
18. Comprises of Smelting and Refining costs as well as direct Process Operations shared costs.
19. It should be noted that with the implementation of the revised operating model in 2014 and 2015 the cost allocation between business units has beenchanged and, therefore, whilst the total is on a like-for-like basis, individual line items are not totally comparable.
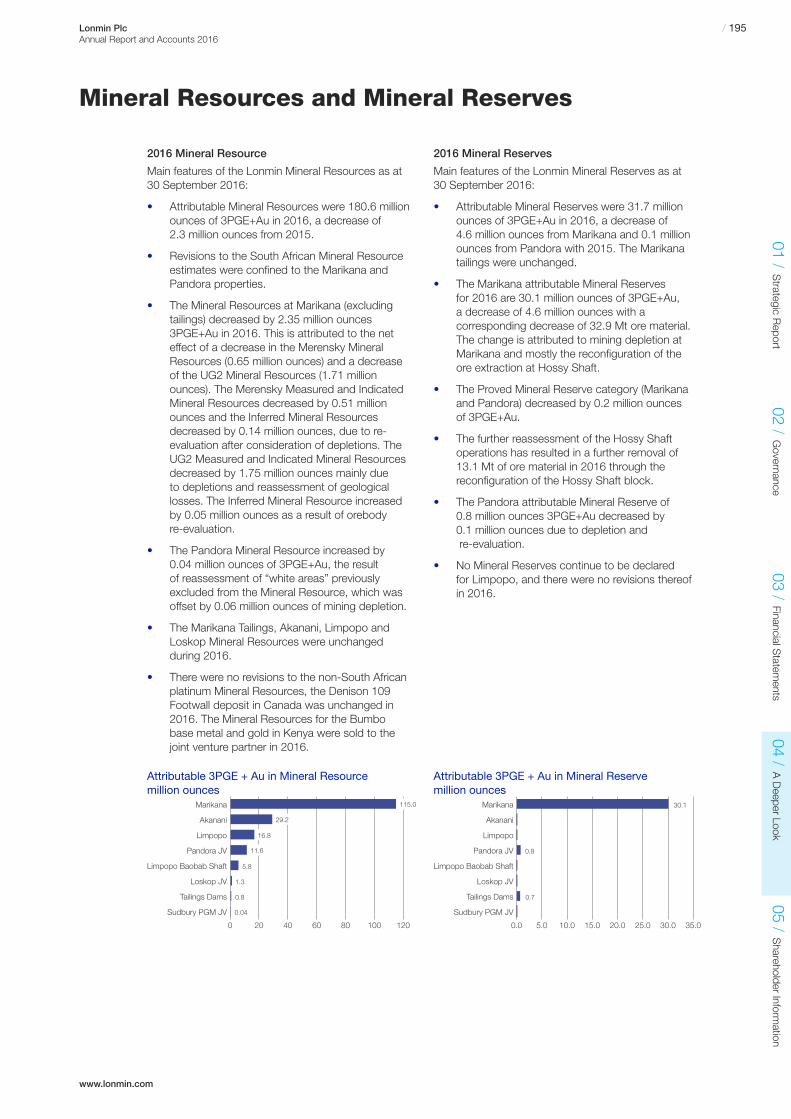
www.lonmin.com
/ 195Lonmin PlcAnnual Report and Accounts 2016
01 /Strategic R
eport02 /
Governance
03 /Financial S
tatements
04 /A Deeper Look
05 /Shareholder Inform
ation
Mineral Resources and Mineral Reserves
2016 Mineral Resource
Main features of the Lonmin Mineral Resources as at30 September 2016:
Attributable Mineral Resources were 180.6 million•ounces of 3PGE+Au in 2016, a decrease of 2.3 million ounces from 2015.
Revisions to the South African Mineral Resource•estimates were confined to the Marikana andPandora properties.
The Mineral Resources at Marikana (excluding•tailings) decreased by 2.35 million ounces3PGE+Au in 2016. This is attributed to the neteffect of a decrease in the Merensky MineralResources (0.65 million ounces) and a decreaseof the UG2 Mineral Resources (1.71 millionounces). The Merensky Measured and IndicatedMineral Resources decreased by 0.51 millionounces and the Inferred Mineral Resourcesdecreased by 0.14 million ounces, due to re-evaluation after consideration of depletions. TheUG2 Measured and Indicated Mineral Resourcesdecreased by 1.75 million ounces mainly due to depletions and reassessment of geologicallosses. The Inferred Mineral Resource increasedby 0.05 million ounces as a result of orebody re-evaluation.
The Pandora Mineral Resource increased by •0.04 million ounces of 3PGE+Au, the result of reassessment of “white areas” previouslyexcluded from the Mineral Resource, which wasoffset by 0.06 million ounces of mining depletion.
The Marikana Tailings, Akanani, Limpopo and•Loskop Mineral Resources were unchangedduring 2016.
There were no revisions to the non-South African•platinum Mineral Resources, the Denison 109Footwall deposit in Canada was unchanged in2016. The Mineral Resources for the Bumbobase metal and gold in Kenya were sold to thejoint venture partner in 2016.
Attributable 3PGE + Au in Mineral Resource million ounces
2016 Mineral Reserves
Main features of the Lonmin Mineral Reserves as at 30 September 2016:
Attributable Mineral Reserves were 31.7 million•ounces of 3PGE+Au in 2016, a decrease of 4.6 million ounces from Marikana and 0.1 millionounces from Pandora with 2015. The Marikanatailings were unchanged.
The Marikana attributable Mineral Reserves •for 2016 are 30.1 million ounces of 3PGE+Au, a decrease of 4.6 million ounces with acorresponding decrease of 32.9 Mt ore material.The change is attributed to mining depletion atMarikana and mostly the reconfiguration of theore extraction at Hossy Shaft.
The Proved Mineral Reserve category (Marikana•and Pandora) decreased by 0.2 million ounces of 3PGE+Au.
The further reassessment of the Hossy Shaft•operations has resulted in a further removal of13.1 Mt of ore material in 2016 through thereconfiguration of the Hossy Shaft block.
The Pandora attributable Mineral Reserve of •0.8 million ounces 3PGE+Au decreased by 0.1 million ounces due to depletion andre-evaluation.
No Mineral Reserves continue to be declared •for Limpopo, and there were no revisions thereofin 2016.
Attributable 3PGE + Au in Mineral Reserve million ounces
0.04
0.8
1.3
5.8
11.6
16.8
29.2
115.0
0 20 40 60 80 100 120
Sudbury PGM JV
Tailings Dams
Loskop JV
Limpopo Baobab Shaft
Pandora JV
Limpopo
Akanani
Marikana
0.0 5.0 10.0 15.0 20.0 25.0 30.0 35.0 40.0
Sudbury PGM JV
Tailings Dams
Loskop JV
Limpopo Baobab Shaft
Pandora JV
Limpopo
Akanani
Marikana
0.7
0.8
30.1
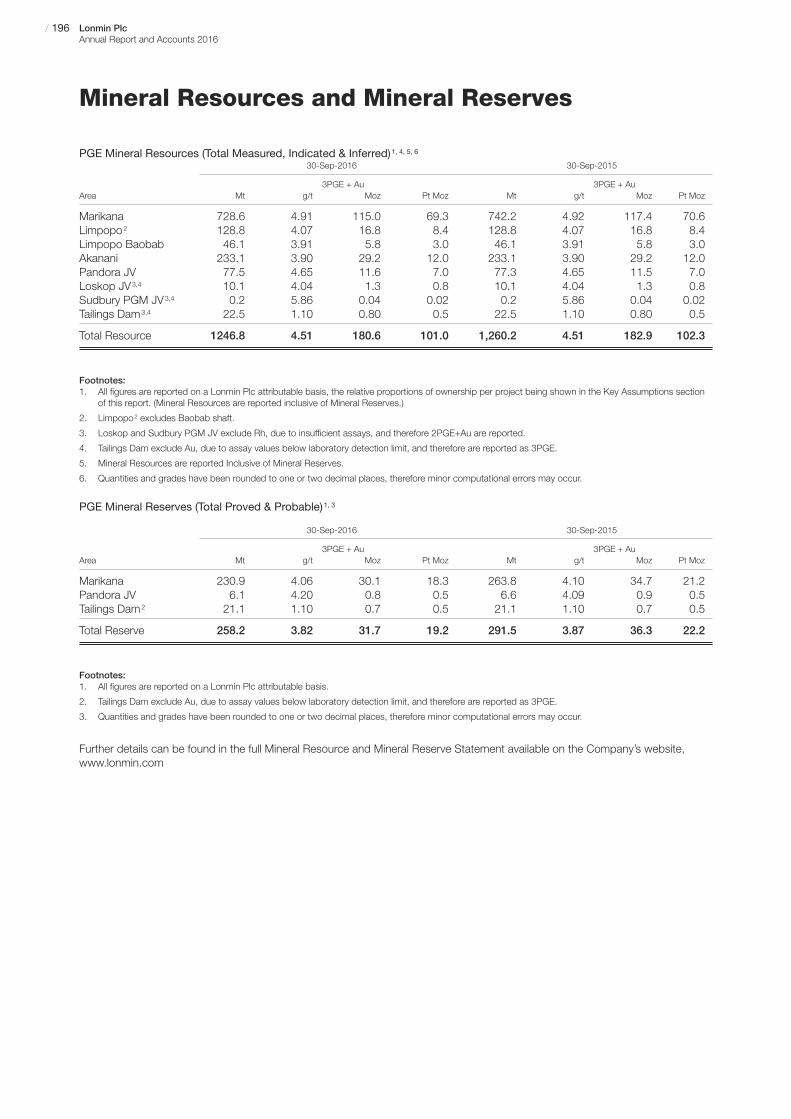
/ 196 Lonmin PlcAnnual Report and Accounts 2016
Mineral Resources and Mineral Reserves
PGE Mineral Resources (Total Measured, Indicated & Inferred)1, 4, 5, 630-Sep-2016 30-Sep-2015
3PGE + Au 3PGE + AuArea Mt g/t Moz Pt Moz Mt g/t Moz Pt Moz
Marikana 728.6 4.91 115.0 69.3 742.2 4.92 117.4 70.6Limpopo2 128.8 4.07 16.8 8.4 128.8 4.07 16.8 8.4Limpopo Baobab 46.1 3.91 5.8 3.0 46.1 3.91 5.8 3.0Akanani 233.1 3.90 29.2 12.0 233.1 3.90 29.2 12.0Pandora JV 77.5 4.65 11.6 7.0 77.3 4.65 11.5 7.0Loskop JV3,4 10.1 4.04 1.3 0.8 10.1 4.04 1.3 0.8Sudbury PGM JV3,4 0.2 5.86 0.04 0.02 0.2 5.86 0.04 0.02Tailings Dam3,4 22.5 1.10 0.80 0.5 22.5 1.10 0.80 0.5
Total Resource 1246.8 4.51 180.6 101.0 1,260.2 4.51 182.9 102.3
Footnotes:1. All figures are reported on a Lonmin Plc attributable basis, the relative proportions of ownership per project being shown in the Key Assumptions section
of this report. (Mineral Resources are reported inclusive of Mineral Reserves.)
2. Limpopo2 excludes Baobab shaft.
3. Loskop and Sudbury PGM JV exclude Rh, due to insufficient assays, and therefore 2PGE+Au are reported.
4. Tailings Dam exclude Au, due to assay values below laboratory detection limit, and therefore are reported as 3PGE.
5. Mineral Resources are reported Inclusive of Mineral Reserves.
6. Quantities and grades have been rounded to one or two decimal places, therefore minor computational errors may occur.
PGE Mineral Reserves (Total Proved & Probable)1, 3
30-Sep-2016 30-Sep-2015
3PGE + Au 3PGE + AuArea Mt g/t Moz Pt Moz Mt g/t Moz Pt Moz
Marikana 230.9 4.06 30.1 18.3 263.8 4.10 34.7 21.2Pandora JV 6.1 4.20 0.8 0.5 6.6 4.09 0.9 0.5Tailings Dam2 21.1 1.10 0.7 0.5 21.1 1.10 0.7 0.5
Total Reserve 258.2 3.82 31.7 19.2 291.5 3.87 36.3 22.2
Footnotes:1. All figures are reported on a Lonmin Plc attributable basis.
2. Tailings Dam exclude Au, due to assay values below laboratory detection limit, and therefore are reported as 3PGE.
3. Quantities and grades have been rounded to one or two decimal places, therefore minor computational errors may occur.
Further details can be found in the full Mineral Resource and Mineral Reserve Statement available on the Company’s website,www.lonmin.com
www.lonmin.com
ShareholderInformation
01 /Strategic R
eport02 /
Governance
03 /Financial S
tatements
04 /A Deeper Look
05 /Shareholder Inform
ation/ 197Lonmin Plc
Annual Report and Accounts 2016
198 Shareholder Information200 Corporate Information201 Reporting Calendar202 Acronyms and Abbreviations203 The Sixteen-Eight Memorial Trustibc Lonmin Charter
05/
Additional information for shareholders including our forthcoming reporting calendar.

/ 198 Lonmin PlcAnnual Report and Accounts 2016
Shareholder Information
Lonmin’s shares are quoted on the London and Johannesburg stock exchanges and American Depositary Receipts (ADRs)representing Lonmin shares are also traded in an OTC market in the USA.
UK share register informationAll holdings of the Company’s shares are maintained on the Company’s UK share register, with the exception of those held on the South African branch register. The register is administered by Equiniti Registrars (formerly known as Lloyds TSB Registrars).
You can access information about your shareholding including balance movements and dividend payments on Shareview, an electronic communications service provided by Equiniti. It also allows you to change your registered address details, set up a dividend mandate, vote at general meetings and register to receive Company communications electronically.
To register for this free service, visit www.shareview.co.uk and follow the simple instructions. You will need your shareholderreference number, which can be found on your share certificate, dividend tax voucher or proxy card.
South African branch register informationThe South African branch register is administered by Link Market Services South Africa (Pty) Ltd.
Contact details for both the UK and South African registrars can be found in Corporate Information on page 200.
DividendsNo dividends will have been recommended or declared for the year ended 30 September 2016.
The following information regarding UK Capital Gains Tax and Individual Savings Accounts is relevant for UK resident, ordinarilyresident and domiciled individual shareholders. None of this information constitutes financial or tax advice and is intended as ageneral guide only.
UK Capital Gains TaxFor UK Capital Gains Tax purposes, shareholders disposing of shares in either Lonmin Plc or Lonrho Africa Plc after 7 May 1998,who held shares prior to that date, should apportion the base cost of their original Lonmin Plc shares between the two companies.Based on the closing share prices on 7 May 1998 of Lonmin Plc and Lonrho Africa Plc, this apportionment would be 80.498% for Lonmin Plc and 19.502% for Lonrho Africa Plc.
The Company’s capital reduction was completed on 22 February 2002. For the purposes of assessing any liability to capital gainstax, UK shareholders should apportion 13.33% of the base cost of their original shareholding to the capital reduction and thebalance to their new holding of ordinary shares of $1 each.
The base cost of Lonmin Plc ordinary shares, for shareholders who held shares prior to that date:
as at 31 March 1982 was 38.9 pence (as adjusted for subsequent capitalisation issues)•
as adjusted for the consolidation of the Company’s shares on 24 April 1998 was 155.6 pence•
as adjusted for the de-merger of Lonrho Africa Plc on 7 May 1998 was 125.3 pence•
as adjusted for shareholders who took up their full entitlement of ordinary shares in the Rights Issue in June 2009 •was 266.1 pence
as adjusted for shareholders who took up their full entitlement of ordinary shares in the Rights Issue in November 2012 •was 185 pence
as adjusted for shareholders who took up their full entitlement of ordinary shares in the Rights Issue in November 2015 •was 4.9 pence, and
as adjusted for the consolidation of the Company’s shares on 19 November 2015 was 491.5 pence assuming in each case•that shares have been held continuously by the relevant shareholder throughout the period.
The precise tax analysis for each shareholder may depend on the shareholder’s own position, for example, shareholders who did not take up their full entitlement in the Rights Issues but who instead sold some or all of their rights may be required to adjust their base cost in their Lonmin Plc ordinary shares and the base costs provided above are indicative only.Shareholders should seek independent tax advice as to their liability for capital gains tax in the event that they sell theirLonmin Plc Ordinary Shares.
www.lonmin.com
01 /Strategic R
eport02 /
Governance
03 /Financial S
tatements
04 /A Deeper Look
05 /Shareholder Inform
ation/ 199Lonmin Plc
Annual Report and Accounts 2016
Shareholder Information
Beware of share fraud
Fraudsters use persuasive and high-pressure tactics to lure investors into scams.
They may offer to sell shares that turn out to be worthless or non-existent, or to buy shares at an inflated price in return for an upfront payment.
While high profits are promised, if you buy or sell shares in this way you will probably lose your money.
How to avoid share fraud1 Keep in mind that firms authorised by the FCA are unlikely to contact you out of the blue with an offer to buy or sell shares.
2 Do not get into a conversation, note the name of the person and firm contacting you and then end the call.
3 Check the Financial Services Register from www.fca.org.uk to see if the person and firm contacting you is authorised by the FCA.
4 Beware of fraudsters claiming to be from an authorised firm, copying its website or giving you false contact details.
5 Use the firm’s contact details listed on the Register if you want to call it back.
6 Call the FCA on 0800 111 6768 if the firm does not have contact details on the Register or you are told they are out of date.
7 Search the list of unauthorised firms to avoid at www.fca.org.uk/scams.
8 Consider that if you buy or sell shares from an unauthorised firm you will not have access to the Financial Ombudsman Serviceor Financial Services Compensation Scheme.
9 Think about getting independent financial and professional advice before you hand over any money.
10 Remember: if it sounds too good to be true, it probably is!
Report a scamIf you are approached by fraudsters please tell the FCA using the share fraud reporting form at www.fca.org.uk/scams, where you can find out more about investment scams.
You can also call the FCA Consumer Helpline on 0800 111 6768.
If you have already paid money to share fraudsters you should contact Action Fraud on 0300 123 2040.
Lonmin Corporate Individual Savings Account (ISAs)Investec Wealth & Investment Limited offers the Lonmin Corporate Stocks & Shares ISA for investment in Lonmin Plc shares.
UK registered shareholders may subscribe to the Lonmin Corporate ISA up to a maximum of £15,240 for the current tax year2016/17 in cash to purchase Lonmin Plc shares or by direct transfer of eligible employees shares within 90 days of the releasefrom an eligible Sharesave Scheme up to a maximum value of £15,240 for the current tax year 2016/17.
Contact details can be found in Corporate Information on page 200. Investec Wealth & Investment Limited is regulated by theFCA. This is not a recommendation that shareholders should subscribe to the ISA. The advantages of holding shares in an ISAvary according to individual circumstances and shareholders who are in any doubt should consult their financial adviser.
ShareGiftLonmin is proud to support ShareGift, an independent charity share donation scheme administered by the Orr MackintoshFoundation (registered charity number 1052686). Those shareholders who hold only a small number of shares, the value of whichmake them uneconomic to sell, can donate the shares to ShareGift who will sell them and donate the proceeds to a wide range of charities. Further information about ShareGift can be obtained from their website at www.ShareGift.org and a ShareGift transferform can be downloaded from the Company’s website.
/ 200 Lonmin PlcAnnual Report and Accounts 2016
Corporate Information
RegistrarsEquinitiAspect HouseSpencer RoadLancingWest SussexBN99 6DAUnited Kingdom
UK Callers:Tel: +44 (0)371 384 20521
Fax: +44 (0)871 384 2100
International Callers:Tel: +44 (0)121 415 0230Fax: +44 (0)1903 883113Website: www.shareview.co.uk
Link Market Services South Africa (Pty) LtdPhysical address:13th FloorRennie House19 Ameshoff Street2001 BraamfonteinSouth Africa
Postal address:PO Box 4844Johannesburg 2000South AfricaTel: +27 (0)11 713 0800Fax: +27 (0)866 742450Website: www.linkmarketservices.co.za
ADR DepositoryBNY Mellon Shareowner ServicesPO Box 30170College StationTX77842-3170
US Callers:Tel: +1 888 269 2377 (toll free in the US)
International Callers:Tel: +1 201 680 6825E-mail: [email protected]: www.mybnymdr.com
ISA ProviderInvestec Wealth & Investment LimitedCorporate ISA DepartmentThe Plaza100 Old Hall StreetLiverpoolL3 9ABUnited KingdomTel: +44 (0)151 237 2160Fax: +44 (0)151 227 1730
Lonmin PlcRegistered in England and WalesCompany number 103002
Registered in the Republic of SouthAfrica as an external companyRegistration number 1969/000015/10
TIDM for Lonmin Ordinary Shares tradedon the LSE: LMIISIN: GB0031192486 JSE code: LON
Registered OfficeLonmin Plc4 Grosvenor PlaceLondonSW1X 7YLUnited KingdomTel: +44 (0)20 7201 6000Fax: +44 (0)20 7201 6100E-mail: [email protected]: www.lonmin.com
Operational HeadquartersPhysical address:34 Melrose Boulevard1st FloorBuilding 13Melrose North Melrose Arch2196South Africa
Postal address:PO Box 98811Sloane Park2152South AfricaTel: +27 (0)11 218 8300Fax: +27 (0)11 218 8310E-mail: [email protected]: www.lonmin.com
Company SecretarySeema Kamboj
Head of Investor RelationsTanya Chikanza
External AuditorsKPMG LLP15 Canada SquareLondonE14 5GLUnited KingdomTel: +44 (0)20 7311 1000
Financial AdvisersGreenhill & Co. International LLPLansdowne House57 Berkeley SquareLondonW1J 6ERLondonUnited KingdomTel: +44 (0)20 7198 7400Fax: +44 (0)20 7198 7500
Joint StockbrokersUnited Kingdom:J.P. Morgan Limited25 Bank StreetCanary WharfLondonE14 5JPTel: +44 (0)20 7742 1000
HSBC Bank plc8 Canada SquareLondonE14 5HQTel: +44 (0)20 7991 8888
South Africa (and JSE Sponsor):J.P. Morgan Equities South Africa (Pty)Limited1 Fricker RoadIllovoJohannesburg 2196South AfricaTel: +27 (0)11 507 0430Fax: +27 (0)11 507 0503
1 Calls to this number cost 8p per minute plus network extras. Lines are open 8.30am to 5.30pm,Monday to Friday.

www.lonmin.com
01 /Strategic R
eport02 /
Governance
03 /Financial S
tatements
04 /A Deeper Look
05 /Shareholder Inform
ation/ 201Lonmin Plc
Annual Report and Accounts 2016
Reporting Calendar
26 January 2017 AGM
26 January 2017 Q1 Production Report
January 2017 Sustainable Development Report
15 May 2017 Interim Results including Q2 Production Report
28 July 2017 Q3 Production Report
13 November 2017 Final Results including Q4 Production Report
/ 202 Lonmin PlcAnnual Report and Accounts 2016
Acronyms and Abbreviations
ACT Advanced Corporation Tax
AGM Annual General Meeting
Akanani Akanani Mining (Pty) Limited
AMCU Association of Mineworkers andConstruction Union
ASAP Annual Shareholder Award Plan
Au Gold
Bapo Bapo Ba Mogale Traditional Community
BEE Black Economic Empowerment
BMR Base metal refinery
BSC Balanced Scorecard
BTT Bulk Tailings Treatment
CEO Chief Executive Officer
CFO Chief Financial Officer
CGU Cash generating unit
CODM Chief Operating Decision Maker
COO Chief Operating Officer
CO2 Carbon dioxide
CO2-e Carbon dioxide equivalent
Code The UK Corporate Governance Codepublished by the Financial Reporting Council in June 2010
CPI Consumer Price Index
DMR Department of Mineral Resources
DTR The Disclosure Rules and TransparencyRules issued by the FSA
EBIT Earnings Before Interest and Taxation
EBITDA Earnings Before Interest, Tax, Depreciationand Amortisation
EPL Eastern Platinum Limited
EPS Earnings Per Share
EPSS Employee profit share scheme
ESOP Employee Share Option Plan
ETF Exchange Traded Fund
EU European Union
EVP Executive Vice President
Exco Executive Committee
GHG Greenhouse gases
GJ Gigajoules
GLC Greater Lonmin Community
g/t Grammes per tonne
HDSA Historically Disadvantaged South African
HIV / AIDS Human immuno-deficiency virus / acquiredimmune deficiency syndrome
HRD Human Resource Development
IAOR Immediately available ore reserves
ICMM International Council on Mining and Metals
IFRS International Financial Reporting Standard
Incwala Incwala Resources (Pty) Limited
IP Incwala Platinum (Proprietary) Limited
ISA Individual Savings Account
ISO International Standards Organisation
JSE Johannesburg Stock Exchange
JV Joint Venture
KPI Key Performance Indicator
LBITDA Loss Before Interest, Tax, Depreciationand Amortisation
LPS Loss per share
LoBP Life of Business Plan
LR Listing Rules
LSE London Stock Exchange
LTI Lost time injury
LTIFR Lost time injury frequency rate
LTIP Long-Term Incentive Plan
MISS Management induced safety stoppages
MK2 Middelkraal resource (to be extracted viaRowland shaft)
Moz Million ounces
MPRDA Mineral and Petroleum ResourcesDevelopment Act
NED Non-executive Director
NRV Net Realisable Value
OEAE Once Empowered Always Empowered
Oz Ounce
Pd Palladium
PGE Platinum Group Elements
PGM Platinum Group Metal
PMR Precious metal refinery
Pt Platinum
PwC PricewaterhouseCoopers Ltd
R South African Rand
Rh Rhodium
RIMS Risk Information Management System
RTSR Relative Total Shareholder Return
SET Social, Ethics and Transformation
Shanduka Shanduka Group (Proprietary) Limited
SHE Safety, Health and Environment
SLP Social and Labour Plan
TB Tuberculosis
UG2 Upper Group 2
UK United Kingdom
VSL Visible Felt Leadership
WCM Working Capital Model
WPL Western Platinum Limited
ZAR South African Rand
$ US Dollar
£ Great British Pound

The Sixteen-Eight Memorial TrustThe Memorial Trust was founded in 2012 by Lonmin and its partner Shanduka Resources to fund the education needs ofthe dependent children of the Lonmin employees who died during the violence of 10-16 August 2012. The Trust Fund has141 beneficiaries of which 115 children are in primary and secondary schools (including seven in creche), 13 are in tertiaryinstitutions, six are older and have completed their schooling and seven are babies or toddlers. The Trust, which was registeredby the Master of the High Court in South Africa on 11 January 2013, was capitalised at R5 million through seed capital fromLonmin and Shanduka. It has since grown to over R6 million thanks to the R1 million contribution from Glencore PLCformerly Xstrata plc.
The Trust Fund approved applications of R3.5 million for the education of its beneficiaries in 2016 (2015 – R1.4 million).
Beneficiary Analysis per Gender and Age
Number of beneficiaries Female Male Age 1-10 Age 11-20 Age 21+
141 67 74 47 69 25
The Trust Fund provides for the payment of education costs relating to:
• Education assistance which is defined as the cost of attending a government public school or other education facility.Assistance includes registration costs, school fees, cost of books, uniform, transport allowance and other directeducation costs which the trustees may consider relevant
• Extramural activities such as sport and excursions
• Boarding fees
The bank account to which donations can be made is:
Branch Name: The Standard Bank of South Africa Limited (Sandton Branch, Johannesburg, South Africa)Branch Code: 01-9205Trust Current Account: 42 099 362 2A/C name: Sixteen-Eight MemorialSwift code: SBZAZAJJ
/ 203
www.lonmin.com
Lonmin PlcAnnual Report and Accounts 2016

/ 204 Lonmin PlcAnnual Report and Accounts 2016
DisclaimerThe Strategic Report has been prepared to provide the Company’s shareholders with a fair review of the business of the Group and a description of theprincipal risks and uncertainties it faces. It may not be relied upon by anyone, including the Company’s shareholders, for any other purpose. The StrategicReport is designed to provide shareholders with an understanding of the Company’s business and the environment in which it operates, and, of necessity,only focuses on material issues and facts. The omission of reporting on any specific topic should not be taken as implying that it is not being addressed.It should be read in conjunction with the section titled ‘A Deeper Look’ and the Directors’ Report which contain other more information which cannot beincluded in the Strategic Report, on the grounds of materiality.
The Strategic Report and other sections of the Annual Report and Accounts contain forward-looking statements. By their nature, forward-looking statementsinvolve a number of risks, uncertainties and future assumptions because they relate to events and / or depend on circumstances that may or may not occurin the future and could cause actual results and outcomes to differ materially from those expressed in or implied by the forward-looking statements. Noassurance can be given that the forward-looking statements will be realised. Statements about the Directors’ expectations, beliefs, hopes, plans, intentionsand strategies are inherently subject to change and they are based on expectations and assumptions as to future events, circumstances and other factorswhich are in some cases outside the Company’s control. The information contained in the Annual Report and Accounts has been prepared on the basis ofthe knowledge and information available to Directors at the date of its preparation and the Company does not undertake any obligation to update or revisethe Annual Report and Accounts during the financial year ahead (other than as required by law or regulation). It is believed that the expectations set out inthese forward-looking statements are reasonable, but they may be affected by a wide range of variables which could cause actual results or trends to differmaterially. The forward-looking statements should be read in particular in the context of the specific risk factors for the Company, including those identifiedin the Strategic Report. The Company’s shareholders are cautioned not to place undue reliance on the forward-looking statements. Shareholders shouldnote that certain parts of this Annual Report and Accounts have not been audited or otherwise independently verified.
CreditsThe paper used in this report is produced using virgin wood fibre from well managed forests in Brazil, Sweden and Germany with FSC®
certification. All pulps used are Elemental Chlorine Free (ECF) and manufactured at a mill that has been awarded the ISO14001 andEMAS certificates for environmental management. The use of the FSC logo identifies products which contain wood from well-managedforests certified in accordance with the rules of the Forest Stewardship Council.
Printed by Pureprint Group Limited, a Carbon Neutral Printing Company.Pureprint Group Limited is FSC certified and ISO 14001 certified showing that it is committed to all round excellence and improvingenvironmental performance is an important part of this strategy. We aim to reduce at source the effect our operations have on the environment,and are committed to continual improvement, prevention of pollution and compliance with any legislation or industry standards.
Designed and produced by MAGEEwww.magee.co.uk
www.lonmin.com
Lonmin PlcAnnual Report and Accounts 2016
Lonmin Charter
Our Mission
To grow and build our portfolioof high quality assets.
To deliver the requirementsof the South African broad-based socio-economic MiningCharter and we welcome theopportunity to transform ourbusiness.
To build a value-basedculture, which is foundedon safe work, continuousimprovement, commonstandards and procedures,community involvement andone that rewards employeesfor high performance.
We are successfulwhenOur employees live and worksafely and experience the personal satisfaction thatcomes with high performanceand recognition.
Our shareholders are realisinga superior total return on theirinvestment and support ourcorporate sustainability values.
The communities in which weoperate value our relationships.
We are meeting ourcommitments to all businesspartners and our suppliers,contractors, partners andcustomers support ourCharter.
Our Values
Zero HarmWe are committed to ZeroHarm to people and the environment.
Integrity, Honesty & TrustWe are committed ethical people who do what we saywe will do.
TransparencyOpen, honest communicationand free sharing of information.
Respect For Each OtherEmbracing our diversity enriched by openness, sharing, trust, teamworkand involvement.
High PerformanceStretching our individual andteam capabilities to achieve innovative and superioroutcomes.
Employee Self-WorthTo enhance the quality oflife for our employees andtheir families and promoteself esteem.
We are Lonmin, a primary producer of Platinum Group Metals. We create value bythe discovery, acquisition, development and marketing of minerals and metals.
We respect the communities and nations that host our operations and conduct business in a sustainable, socially and environmentally responsible way.
Brian BeamishChairman
May 2014
Ben MagaraChief Executive Officer
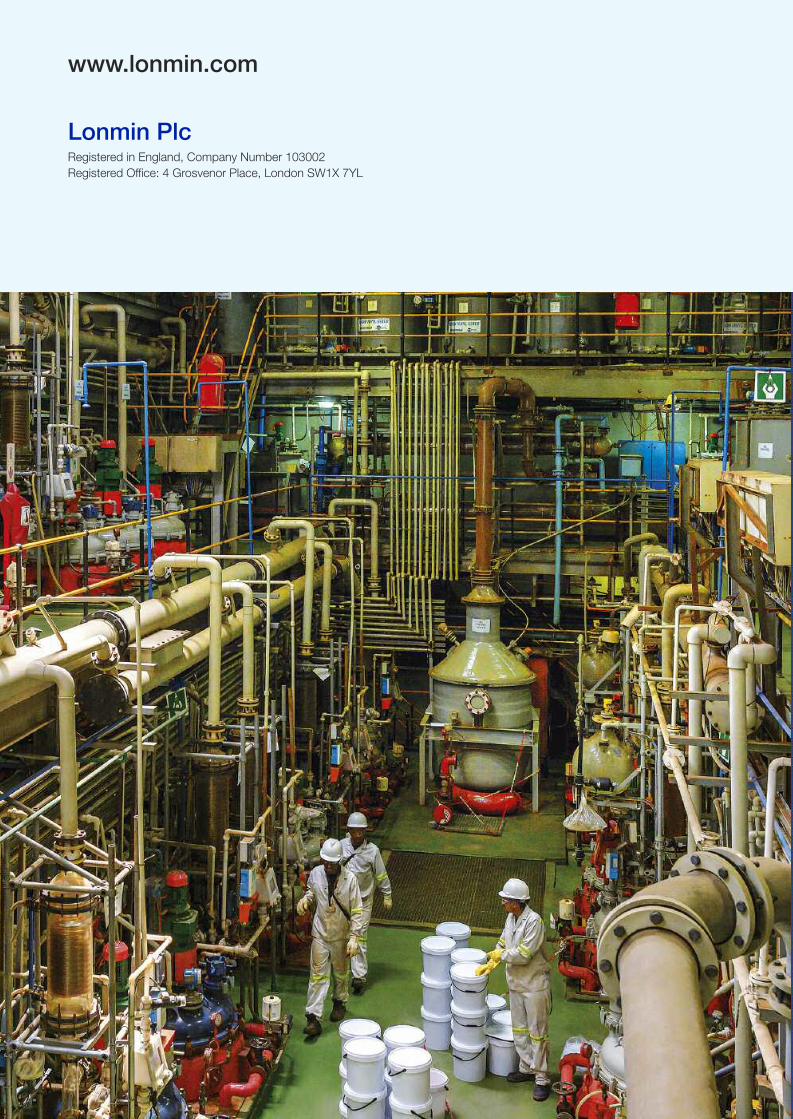
Lonmin P
lcA
nnual Report and A
ccounts for the year ended 30 Septem
ber 2016
www.lonmin.com
Lonmin PlcRegistered in England, Company Number 103002Registered Office: 4 Grosvenor Place, London SW1X 7YL
Annual Report and Accounts 2016For the year ended 30 September 2016
Lonmin Plc
MUCH ACHIEVEDWELL REPOSITIONED


