15 Royal Street, East Perth Western Australia – 6004 phone: +61 (0) 412 167 294 email: [email protected]web: www.smco.com.au abn: 13 267 625 066 Muchea Industrial Park Land Demand and Economic Assessment Department of Planning, Lands and Heritage November 2019
Author: Syme and McLeod Client: DPLH Name of Document: Muchea Demand Document Version: Final 1 2 Project Number: P1903
Disclaimer
Syme Marmion & Co reports and advice are either of a general nature, or for specific circumstances.
Syme Marmion & Co is not liable for any loss or damage incurred by any person relying on such
reports or advice, except where they are created by Syme Marmion & Co expressly for that person.
Nothing in these terms shall be taken as excluding, limiting or modifying any term, condition or
warranty implied by any applicable act of parliament that cannot be so affected. To the extent that
such a term, condition or warranty is implied, the liability of Syme Marmion & Co for breach of that
term, condition or warranty is, where permitted, limited at the option of Syme Marmion & Co, to
the supplying of the relevant goods or services again; or the payment of the cost of having the
relevant goods or services supplied again.
Syme Marmion & Co: Muchea Industrial Park Land Demand and Economic Assessment i
Contents Executive Summary ................................................................................................................................. i
Syme Marmion & Co: Muchea Industrial Park Land Demand and Economic Assessment i
Executive Summary
Key points
• There is a surplus provision of future of light and general industrial land in the North East and
North West sub-regions and a substantial deficit in provision in the Metro South / Peel sub-
region.
• This is partly due to the effective inclusion of Muchea into the North East sub-region industrial
land supply equation, made possible by the Northlink project.
• The population of the North East sub-region is projected to grow by 241,430 from 209,150 at 2011 to
450,580 by 2050. Depending on the analysis used, this implies a demand for new industrial land of
between 2,580 and 3,444 ha (net). Potential new supply identified in the North East Sub-regional
Framework for long term development is 3,580 ha (gross – around 2,680 ha net) excluding
Muchea. With the addition of Muchea to the prospective land supply, and allowing for gross area
to net industrial land adjustments and the different time scales for each of the above demand
estimates, overall this would suggest a surplus provision in the planning framework for the sub-
region of around 625 ha (net) or 830 ha (gross) for the period 2015 - 2050.
• The implication is that development on one of the major estates in the North East sub-region will
delay or curtail development on others. Not all land in Bullsbrook /North Ellenbrook and Muchea
will be developed to its short and medium term schedule, or even meet long term development
expectations.
• There is a range of potential supply of industrial land in the Perth metro area overall, demand
estimates for any part of it need to consider:
• Population factors:
- Access to skilled labour;
- Access to customers and end uses;
• Location factors – access to:
- Import /export transport routes;
- Local distribution and servicing transport routes;
- Agglomeration economies, i.e. access to goods and services in the value chain.
• Muchea scores well on some transport-related location factors, but not as well as locations closer
to population centres in the Perth metropolitan area for population factors. This reinforces the
likely focus for Muchea as long-haul transport and agricultural products and livestock handling.
Muchea has not been as visible or accessible as other industrial areas closer to Perth in the north-east
corridor, resulting in some uncertainty over the role Muchea would play in the industrial land market.
From a broader metropolitan development perspective, it lacked visibility and accessibility compared to
the large areas prospectively available at Bullsbrook and North Ellenbrook.
Syme Marmion & Co: Muchea Industrial Park Land Demand and Economic Assessment ii
The Northlink project has fundamentally changed the assessment of Muchea’s role, positioning Muchea
directly within the broader metropolitan industrial land market. Northlink will render Muchea visible and
will have a significant effect on the accessibility of Muchea to the Perth metro area. Muchea will now be
seamlessly connected to the Perth metropolitan transport system with an interchange providing direct
access to the estate. To add to this, transport connections to the Mid West and North West will be
improved with RAV10 access to Muchea.
Muchea has a gross area of 1,167 ha, with a net area of 896 ha after allowing for 221 ha for conservation
reserves, environmental protection areas and drainage and 50 ha for roads. Of the 1,167ha of industrial
land, 302 ha is taken up by WAMIA. In addition, there are several projects (for transport depot and for
grain handling) either existing or in very advanced planning adjacent to but outside of the Muchea
Industrial Park area which add to the industrial and rural product processing operations in the area.
There is a general surplus provision of potential industrial land in the North East sub region and this is
increased by the effective inclusion of Muchea into the North East sub-region industrial land supply
equation. The population of the North East sub-region is projected to grow by 241,430 from 209,150 at 2011 to
450,580 by 2050. Depending on the analysis used, this implies a demand for new industrial land of between
2,580 and 3,444 ha (net). Potential new supply identified in the North East Sub-regional Framework for
long term development is 3,580 ha (gross – around 2,680 ha net) excluding Muchea. With the addition of
Muchea to the prospective land supply, and allowing for gross area to net industrial land adjustments and
the different time scales for each of the above demand estimates, overall this would suggest a surplus
provision in the planning framework for the sub-region of around 625 ha (net) or 830 ha (gross) for the
period 2015 - 2050. This is supply for many years after 2050.
The development projects already planned and underway are likely sufficient to meet all short and
medium term demand for land at Muchea, including for local uses, and possibly for the long term. The
expected over-provision of industrial land supply in the North East inclusive of Muchea means that take-
up of land at Muchea will be dependent on individual projects that can take advantage of Muchea’s
location and improved connectivity based on the combined Northlink and RAV10 access. For more
general requirements (e.g. road transport operations and local demand) and for specialised processing
(e.g. feed mills), there is likely to be already enough land in development with the combined Precinct 3,
Harvis, CBH and Linfox developments (the latter two are outside of the Muchea Industrial Park area) to
satisfy short and medium term demand. Together these account for a gross land area of 505 ha and might
be expected to yield total net development sites of around 380 ha. Of this, transport-related uses are
likely to account for around one-third to one-half of all demand. Depending on the outcome of
development at Bullsbrook / North Ellenbrook, it might also be sufficient for long term needs.
It needs to be emphasized that some of these projects and their land uses (e.g. CBH, feed mill, concrete
batching) are still in the planning/assessment stages. However, if they do happen, there is adequate land
to accommodate their plans. Moreover, beyond these projects, further demand will likely emerge only
slowly. Full development will likely be outside of the planning timeframe.
Syme Marmion & Co: Muchea Industrial Park Land Demand and Economic Assessment iii
Recommendations
Based on the analysis and consultations there are a number of things that could be done to facilitate
Muchea developments:
• Clarify the long term relationship between Muchea and Bullsbrook / North Ellenbrook,
particularly with regards to priorities for services supply. It is possible that gas supply is viable for
Muchea, but not Bullsbrook. This would enable some gas-dependent activities at Muchea (e.g.
feed mills) but it might make necessary some other upgrades, e.g. better access to water supply.
• Confirm Muchea as the most southern point of RAV 9 and RAV10 access (current planning has
proceeded on this basis).
• Allow or facilitate RAV10 access to all sites throughout the estate.
• Expand services and security at the common user road train assembly facility. Even with precinct
wide access, this facility is still needed and basic services are required beyond just a hardstand.
• Review gas and general services access.
• Ensure local government policies for industrial development at the Muchea Industrial Park are
commensurate with its role as a general industrial estate.
Syme Marmion & Co: Muchea Industrial Park Land Demand and Economic Assessment 1
1. Introduction
The Muchea Industrial Park is located approximately 55 km north of Perth at the intersection of the Great
Northern Highway and the Brand Highway. The area encompasses 1,167 ha in total, across five precincts,
including 896 ha of developable land (refer Map 1.1).
The majority of Precinct 1B is occupied by the Muchea Livestock Centre and owned by the Western
Australian Meat Industry Authority (WAMIA). Precinct 1A is majority owned by Harvis, a real estate fund
manager, currently developing the area as part of the Northern Gateway Industrial Park. A local structure
plan and preliminary subdivision approval for 12 industrial lots have been approved. A development
application for a large BP service centre and truck stop as part of the Northern Gateway development was
approved in June 2019. A Local Structure Plan and Scheme Amendment for industrial zoning has recently
been lodged with the Shire of Chittering on behalf of landowners in Precinct 3 and is currently under
assessment.
Table 1.1 Muchea Industrial Estate, Land Use by Area (ha)
Use Area (ha)
Industrial Land 896
Conservation reserves, environmental protection areas and drainage 221
Roads 50
Total 1,167
The purpose of this report is to provide the Department of Planning, Lands and Heritage, on behalf of the
WAPC, a Land Demand and Economic Assessment that can inform an update of the Muchea Industrial
Park (MIP) Structure Plan.
This assessment is informed by:
• A review of previous demand studies for Muchea and other relevant industrial areas;
• A review of available data;
• Individual consultation and meetings with key stakeholders, including:
o Key users and potential users;
o Landowners and developers;
o Infrastructure and regulatory agencies;
o Transport industry representative bodies;
o Transport industry operators.
Syme Marmion & Co: Muchea Industrial Park Land Demand and Economic Assessment 2
Map 1.1 Muchea Structure Plan Precincts (Muchea Structure Plan, 2011)
Syme Marmion & Co: Muchea Industrial Park Land Demand and Economic Assessment 3
2. Planning background and context
2.1. Muchea Industrial Park The current position and configuration of the Muchea Industrial Park reflects the history of planning studies and policy decisions affecting the outer North East metropolitan area. The North East Corridor was originally identified in the 1990 Metroplan (Department of Planning and Urban Development, 1990), including regional open space, rural/non-urban uses, major industry and future urban development. Subsequently, the North-East Corridor Structure Plan (Ministry for Planning, 1994) provided more detail and guidance on planning in the corridor. In 1996, the State Planning Strategy (Western Australian Planning Commission, 1996) identified an extension to the North-East Corridor as a core area for future structure planning. This incorporated an urban settlement of 5,000 to 10,000 people in the general vicinity of Bullsbrook, a strategic industrial site/employment node, a new town near Bindoon and a possible extension to the combined Strategic Freight and Tourist Road Network. More recent strategies have formalized details of planning for the area and embodied employment planning for the area.
• WAPC: North-East Corridor Extension Strategy (2003) The Western Australian Planning Commission released the North-East Corridor Extension Strategy in 2003. This Strategy identified an Employment Node Investigation Area located on the Chittering and Swan local government borders. (See Figure 2.1) The previous planning documents had indicated the need to make provision for a strategic general industrial site/employment node within the southern portion of the study area between the Gnangara Groundwater Mound and Great Northern Highway, possibly in the southern vicinity of RAAF Base Pearce. An employment node was identified in the draft North-East Corridor Extension Strategy to the south-west of RAAF Base Pearce. However, public submissions on the draft strategy, including comment from the Environmental Protection Authority, indicated a lack of support for the proposed site due to environmental concerns. A site for the employment node investigation area was ultimately identified in the middle of the study area on the Chittering and Swan local government borders to the east of Muchea and the Great Northern Highway. The employment node identified in the final strategy was predominantly service based, including commercial, warehousing and wholesaling industries. Heavy industry or noxious industries were not to be accommodated. The area was intended to provide 550ha (net) of general industrial employment area for the residents of Ellenbrook, Egerton and The Vines as well as the future residents of the study area. A general area of 1,172ha (gross) was identified to accommodate this and other proposed land uses. No detailed rationale is given in the Strategy for the precise boundaries of the Employment Node Investigation Area. However, it is noted that preparation of the Land Use Management Plan (shown in Figure 2.1) was guided by an Opportunities and Constraints Map, based on 106 variables grouped into 10 categories. The Employment Node Investigation Area, and an adjacent potential urban area to the south, is in an area with relatively few development constraints.
Syme Marmion & Co: Muchea Industrial Park Land Demand and Economic Assessment 4
Around this time the WA Meat Industry Authority (WAMIA) began implementing the relocation of the livestock centre in Midland to a portion of the Employment Node Investigation Area, north of Muchea East Road. It was thought possible that relocating the livestock centre to Muchea would provide the opportunity for complementary uses to be located in the area. The WA Meat Industry Authority (WAMIA) opened the Muchea Livestock Centre in May 2010 on a 302 ha site. To date, the anticipated complementary uses have not materialised.
Fig 2.1: North-East Corridor Extension Strategy (2003), Land Use Management Plan
Syme Marmion & Co: Muchea Industrial Park Land Demand and Economic Assessment 5
• Syme Marmion & Co, Muchea Employment Node Demand Assessment, Department for Planning and Infrastructure, October 2007; and
• Syme Marmion & Co and Connell Wagner, Demand Assessment Muchea Employment Node, November 2007
This demand study, undertaken in 2007, assessed the potential future demand for appropriately zoned employment land within the Employment Node Investigation Area. The analysis assessed the likely base demand generated by the projected population in the region, primarily the local population in the Shire of Chittering. It also estimated additional demand likely to result from metropolitan “spill-over” uses complementary to existing and planned uses and uses likely to take advantage of the strategic location of the site adjacent to major transport routes. The area was not regarded as a premium location for industrial land. It was seen as being poorly located compared with other existing and potential industrial locations to the south in the Perth metro area. At that time, the only rationale for development, in the short and medium terms, was the anchor of the WAMIA operations and the site’s location at the intersection of Brand and Great Northern Highways. There was also the remote possibility of a brickworks being developed to take advantage of the clay mining on the site. The analysis showed demand in several categories:
o Local Demand for up to 60 - 70 ha of local level industrial land in the short term and up to an additional 70 - 80 ha over the subsequent 30 years, to a total of up to 139 ha over a 30 year timeframe.
o Complementary Uses to Existing and Planned Uses: It was considered that additional uses associated with the WAMIA operations could locate to the area, but be predominantly on the WAMIA site. There was the possibility of some commercial operators wishing to locate near the WAMIA site, but in a more visible location (on Great Northern Highway) with approximately 10 ha sufficient to cater for these businesses.
o The Midland Brick clay extraction activities in the area and the sites relative proximity to the rapidly growing north-west metropolitan development corridor, raised the possibility of a brickworks operation in the region at some time in the future, albeit Midland Brick had no plans for a brickworks in the foreseeable future and therefore the likely demand for a brickworks located at Muchea was seen as uncertain.
o Transport: There was evidence to suggest that the Muchea location would provide an advantage for businesses involved in transporting large equipment and other goods to locations in the Mid West and North West region. The likely lower cost of the land would enable some businesses involved in manufacturing and storage of equipment used in mining operations to the north to manufacture, store, service and maintain goods and equipment for the mining regions. Up to 95 ha of land was anticipated to be required for these businesses over a medium to long term timeframe.
o The anticipated price advantages of the land at Muchea was seen as likely to attract metropolitan “spill-over” for industrial land uses, with that up to 50 ha of land required to cater for this demand
The overall level of demand for industrial land in the Muchea area was anticipated in the study to be up to 294 ha of general industrial and service commercial land for all purposes, in addition to the WAMIA site of 302 ha to arrive at a total of 596 ha of land.
Syme Marmion & Co: Muchea Industrial Park Land Demand and Economic Assessment 6
• WAPC, Muchea Employment Node Structure Plan, August 2011 The Muchea Employment Node Structure Plan was released in 2011. This provided a 20 year land use planning framework. It draws on the demand analysis contained in the 2007 Connell Wagner / Syme Marmion report. It is noted in the Plan that the Shire of Chittering’s preference is that industries that would impact on the amenity of Muchea and surrounds should not be allowed to set up in the employment node. However, complementary agri-industry businesses that would not impact on the amenity should be encouraged. The Structure Plan includes as ‘Proposed Industrial Development’ all the land identified as Employment Node Investigation Area in the North-East Corridor Extension Strategy (2003) – Precincts 1, 2 and 4 east of Great Northern Highway - and adds land to the west of the Highway (Precinct 3), Precinct 1A (the Harvis site) to that category and removed the area of land in the City of Swan from the Structure Plan area. (Figure 2.2). The Structure Plan notes the following services availability:
o Stormwater: On-site management of stormwater will occur in a staged manner concurrent with subdivision and development.
o Sewerage: The preferred option for the structure plan area is for treatment in a centralised wastewater treatment plant. The provision of deep sewerage and a wastewater treatment plant could be considered in conjunction with the demand for new or additional capacity in the Shire and wider area such as at the Bullsbrook wastewater treatment plant. A suitable site for a wastewater treatment plant was to be identified as part of local structure planning.
o Water supply: Local water resources are considered as a source of reticulated water supply on a site specific and land use basis. Local surface water supplies are not suitable due to a lack of consistency of supply and water quality issues. Rainwater tanks and hardstand harvesting are available for supplementary supply but would not be sufficient for a primary supply. There is groundwater available through bulk water suppliers. Preliminary discussions with suppliers and utility service providers indicated they are prepared to supply water for a potable scheme – via water trading – and this source is the recommended option for supply of potable water for the employment node.
o Electricity: Western Power advised that to supply power to the employment node in the short-term, new 22 kV feeders out of the Muchea substation would be constructed. This would only be suitable to supply initial developments and would be conditional on sufficient substation capacity existing at the time of development. Initial predictions by Western Power were that two new 132/22 kV zone substations with three 33 MVA transformers per zone substation, would ultimately be required to service the industrial area
o Gas: There are no plans for the provision of reticulated gas to the Muchea structure plan area. The cost of installing a connection to the Dampier to Bunbury natural gas pipeline was significant. The demand for gas by the type of development expected in the structure plan area was not expected to justify the cost of installation.
Syme Marmion & Co: Muchea Industrial Park Land Demand and Economic Assessment 7
Fig 2.2: WAPC, Muchea Employment Node Structure Plan, August 2011
Syme Marmion & Co: Muchea Industrial Park Land Demand and Economic Assessment 8
• Shire of Chittering, Local Planning Strategy 2018, DRAFT The Shire of Chittering Local Planning Strategy (2019) was approved by the Western Australian Planning Commission in July 2019. The Strategy supports industrial development within the Muchea Industrial Park and seeks to limit the introduction of further sensitive land uses within one kilometre of the estate, to allow development of the Park with a range of industrial uses and to ensure than any amenity impacts from the estate do not affect sensitive land uses. By containing the Shire’s industrial activity within the Muchea Industrial Park, the aim is for rural land to be retained for primary production, rural based activities and natural resource management, while retaining the Shire’s natural and rural landscape character and rural amenity.
• Lucid Economics, Muchea Industrial Estate Demand Assessment, Shire of Chittering, September 2018
The Shire of Chittering engaged Lucid Economics to conduct a demand assessment for the Muchea
Industrial Estate in 2018. The Lucid report identifies the following attributes making the Muchea
Industrial Estate potentially attractive as an industrial area:
• NorthLink.
• Cost Advantages compared with other industrial areas in Perth.
• Access to Great Northern Highway.
• Muchea Road Train Assembly Area.
• Muchea Livestock Centre.
• Availability of utilities.
• Existing Industries.
• Growing Future Workforce Pool.
It suggests that the Muchea Industrial Estate is attractive for transport and logistics operators, some
large-scale manufacturing operations and firms engaged in agricultural equipment sales and service and
that demand for the Estate will be driven by a number of factors, including:
• Mining and agricultural activity in Western Australia;
• General economic conditions in Western Australia;
• Transport efficiencies created through the delivery of NorthLink;
• Cost advantages that the area can provide to developers and tenants;
• General lack of large industrial sites within the Perth Metropolitan region.
The report estimates demand for industrial land in the Estate by 2046 at a gross area of 800 ha, including
roads, infrastructure corridors, buffers and environmental corridors. No detail is given on the breakdown
of this estimate.
Syme Marmion & Co: Muchea Industrial Park Land Demand and Economic Assessment 9
2.2. Regional Context The future development of the Muchea Industrial Park now needs to be evaluated as part of the general
development of industrial land within the Perth metropolitan area, particularly in the northern sectors.
Northlink is the catalyst for changing the planning view of Muchea.
Previous demand analysis was undertaken on the assumption that the Northlink project (formerly called
the Perth – Darwin Highway) would be a long term project and would only have a large influence on the
Park in the very long term. On this basis, development was seen as relying on local factors – local demand,
the presence of the WAMIA facility and the road train assembly area – with only a small amount of long
term metropolitan “spill-over” development. Land at Muchea was seen as less attractive than land
available closer to the Perth metropolitan area, particularly the large areas prospectively available at
Bullsbrook and North Ellenbrook. From a broader metropolitan perspective, it lacked visibility and
accessibility and, in the event, there has been little new development in Muchea since the construction
of the WAMIA facility.
However, Northlink is now under construction, ahead of previous timeframes, fundamentally changing
the positioning of Muchea within the broader industrial land market. Most importantly, Northlink will
greatly increase the visibility of Muchea and it will have a significant effect on the accessibility of Muchea
to the Perth metro area. It will now be seamlessly connected to the Perth metropolitan transport system.
The travel time reductions are substantial. For example, current travel times to Malaga (at the main Reid
Highway / Tonkin Highway interchange) is now at least 40 -50 minutes, with multiple light controlled
intersections. When Northlink is opened, this time will reduce to less than 30 minutes, with no controlled
intersections. Suppliers operating from Muchea will be well connected to the Metro area, Mid West and
North West with improvements to Great Northern Highway and construction of the Bindoon Bypass.
Similarly, access to a large labour force at Ellenbrook will be 15 – 20 minutes and to the North West
Corridor (e.g. Neerabup industrial estate and the nearest residential areas of the North West Corridor)
around 30 minutes.
For a range of activities, Muchea is now emerging as a viable alternative for existing and planned industrial
land in the metropolitan area, particularly the Bullsbrook / North Ellenbrook industrial precinct. Its
improved connectivity and lower land prices make it potentially attractive for a range of activity
relocations when firms currently occupying high value land but engaged in lower value land intensive
activities come to make reinvestment or relocation decisions in the future.
Muchea is currently outside of the Perth Metropolitan area and as such has never been formally included
in any supply and demand analysis of industrial land in the Perth metropolitan area. However, Northlink
changes the economics of Muchea, such that it now should be seen within the broader Metro land market.
It is thus necessary to now review relevant research and policy for Perth metropolitan industrial land, and
place Muchea in that context.
Syme Marmion & Co: Muchea Industrial Park Land Demand and Economic Assessment 10
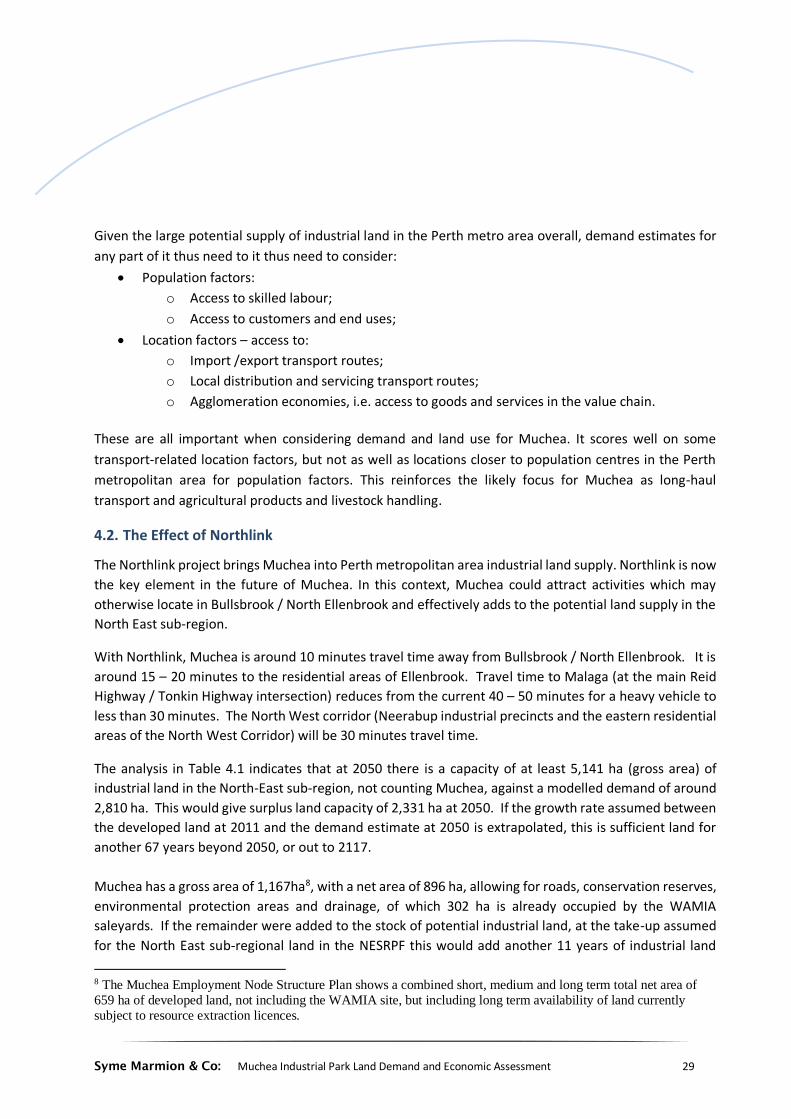
The North-East Sub-regional Planning Framework (NESRPF) is an element of the Towards Perth and Peel
@ 3.5 million suite of documents. The Framework expects a significant amount of future employment
1 Syme Marmion & Co, Industrial Land Needs Study, LandCorp and DPI, 2008 2 WAPC, Economic and Employment Lands Strategy: non-heavy industrial, Perth metropolitan and Peel regions,
April 2012
Syme Marmion & Co: Muchea Industrial Park Land Demand and Economic Assessment 11
within the sub-region to be located within existing and proposed industrial centres. It estimates that there
is approximately 760 ha of undeveloped industrial zoned land available within the sub-region.
The most significant industrial land provision in the Framework is an area of over 2,500 ha located at
Bullsbrook and North Ellenbrook (generally to the south and west of the Pearce Airbase), which expands
upon the Bullsbrook (South) industrial centre that is zoned industrial in the MRS. Of this 1,450 ha of land
is classified Industrial Investigation in the Framework and this will require further planning to confirm its
suitability for industrial use in the longer term. An intermodal (road–rail) freight terminal is proposed at
Bullsbrook in the medium to long term, subject to future investigations.
The amount of additional land identified for industry is based on projections in the draft framework
scenario which indicate an overall demand for new land of approximately 2,810 ha to 2050. The projected
demand for industrial land is based on average demand of 78.2 ha (gross) per annum that was adopted in
the draft (2015) Framework. The basis of this take-up figure is not clear, but it appears to be based on
historic take-up levels. The Framework estimates 3,580 ha (gross) of potential industrial land supply in
the sub-region at 2015.
There is some interaction of industrial land demand between the North-East sub-region and the North-
West subregion, particularly for the Bullsbrook / North Ellenbrook land. The North-West Sub-regional
Planning Framework shows 3,260 ha (gross) of potential industrial land supply in the sub-region at 2015,
with land demand of 1,770 ha to 2050. This is based on average demand of 49.2 ha (gross) per annum
that was adopted in the draft (2015) Framework and indicates an ample supply of potential industrial land
in the North-West sub-region. There is no reconciliation in the documents of the substantially different
take-up rates assumed between the North-East sub-region and the North-West subregion.
MacroplanDimasi / GHD, Bullsbrook Freight and Industrial Market Needs Assessment, March 2019
The Bullsbrook / North Ellenbrook industrial area is in the City of Swan approximately 32km from the
Perth CBD and around 15 km (or less than 10 minutes travel time on Northlink) south of Muchea. It covers
a gross land area of 2,650 ha across four major precincts:
• Bullsbrook South Extension A: 300 ha gross (shown as ‘industrial expansion’ in the Framework)
• Bullsbrook South Extension B: 100 ha gross (‘industrial investigation’)
• North Ellenbrook: 900 ha gross (‘industrial expansion’)
• North Ellenbrook Extension: 1,350 ha gross (‘industrial investigation’).
Syme Marmion & Co: Muchea Industrial Park Land Demand and Economic Assessment 12
Source: Department of Planning, Lands and Heritage
MacroPlan estimates that environmental constraints and infrastructure requirements in the area mean
that the likely development yield may be around 50-70 per cent of the gross area or between 1,325 and
1,855 ha. It considers that the Bullsbrook Freight and Industrial Area could have two development fronts
catering to different industrial needs, focusing on freight and logistics and the other providing land for
general and light industrial uses. MacroPlan considers these combined could potentially achieve an
average take-up of up to 20 ha per annum. This would imply a development timeframe of at least 70 years
across the whole area, although increases in economic land use intensity over that timeframe might
extend the supply beyond 2100. It uses similar take-up rates and methodology to those used in the WAPC
Framework to arrive at these estimates.
As with Muchea, the timing of its development and the types of land uses are constrained by lack of
services infrastructure, particularly water, sewer and telecommunications. MacroPlan proposes a
typology of industrial estates, shown in Table 2.1 below and considers that all except heavy industry
(category 1) are potentially applicable to Bullsbrook / North Ellenbrook. They could all also be applicable
to Muchea.
North Ellenbrook Extension
North Ellenbrook
Bullsbrook South B
Bullsbrook South B
Syme Marmion & Co: Muchea Industrial Park Land Demand and Economic Assessment 13
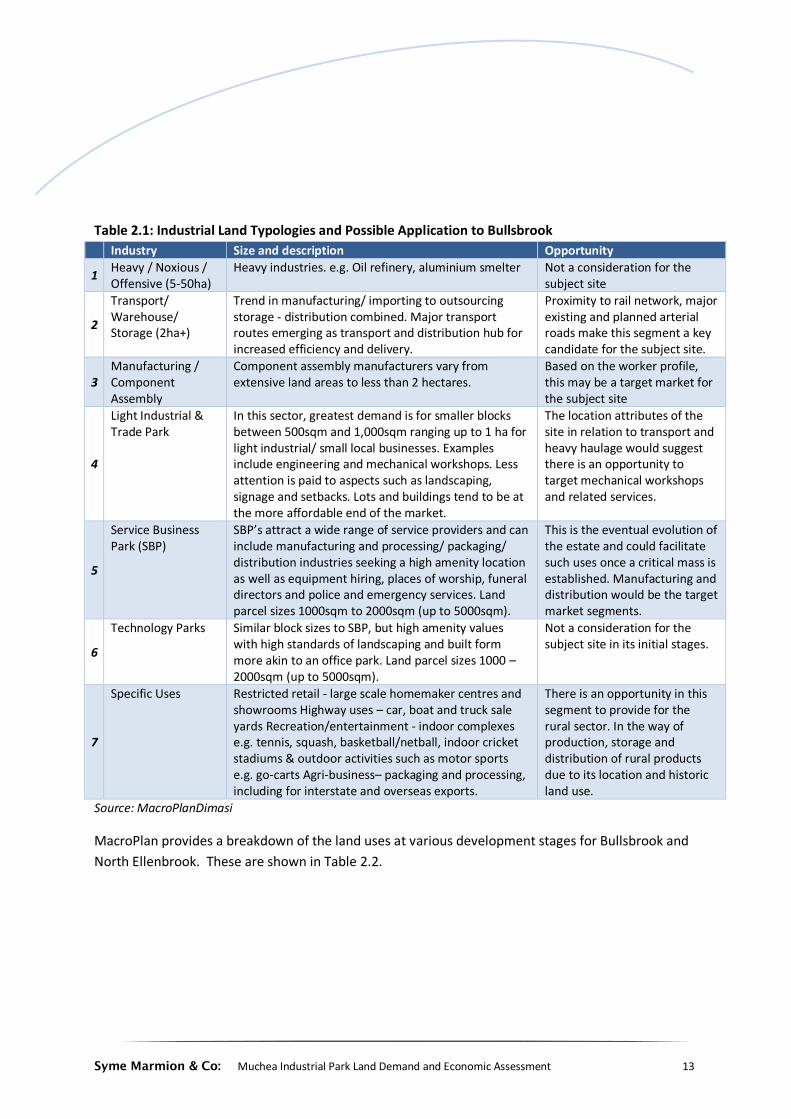
Table 2.1: Industrial Land Typologies and Possible Application to Bullsbrook
Industry Size and description Opportunity
1 Heavy / Noxious / Offensive (5-50ha)
Heavy industries. e.g. Oil refinery, aluminium smelter Not a consideration for the subject site
2
Transport/ Warehouse/ Storage (2ha+)
Trend in manufacturing/ importing to outsourcing storage - distribution combined. Major transport routes emerging as transport and distribution hub for increased efficiency and delivery.
Proximity to rail network, major existing and planned arterial roads make this segment a key candidate for the subject site.
3 Manufacturing / Component Assembly
Component assembly manufacturers vary from extensive land areas to less than 2 hectares.
Based on the worker profile, this may be a target market for the subject site
4
Light Industrial & Trade Park
In this sector, greatest demand is for smaller blocks between 500sqm and 1,000sqm ranging up to 1 ha for light industrial/ small local businesses. Examples include engineering and mechanical workshops. Less attention is paid to aspects such as landscaping, signage and setbacks. Lots and buildings tend to be at the more affordable end of the market.
The location attributes of the site in relation to transport and heavy haulage would suggest there is an opportunity to target mechanical workshops and related services.
5
Service Business Park (SBP)
SBP’s attract a wide range of service providers and can include manufacturing and processing/ packaging/ distribution industries seeking a high amenity location as well as equipment hiring, places of worship, funeral directors and police and emergency services. Land parcel sizes 1000sqm to 2000sqm (up to 5000sqm).
This is the eventual evolution of the estate and could facilitate such uses once a critical mass is established. Manufacturing and distribution would be the target market segments.
6
Technology Parks Similar block sizes to SBP, but high amenity values with high standards of landscaping and built form more akin to an office park. Land parcel sizes 1000 – 2000sqm (up to 5000sqm).
Not a consideration for the subject site in its initial stages.
7
Specific Uses Restricted retail - large scale homemaker centres and showrooms Highway uses – car, boat and truck sale yards Recreation/entertainment - indoor complexes e.g. tennis, squash, basketball/netball, indoor cricket stadiums & outdoor activities such as motor sports e.g. go-carts Agri-business– packaging and processing, including for interstate and overseas exports.
There is an opportunity in this segment to provide for the rural sector. In the way of production, storage and distribution of rural products due to its location and historic land use.
Source: MacroPlanDimasi
MacroPlan provides a breakdown of the land uses at various development stages for Bullsbrook and
North Ellenbrook. These are shown in Table 2.2.
Syme Marmion & Co: Muchea Industrial Park Land Demand and Economic Assessment 14
Table 2.2: Industrial Land Typologies and Possible Application to Bullsbrook
Precincts Initial land development and uses
Additional growth phase development and uses
Additional mature development and uses
Bullsbrook South Extension A & B
Freight and logistics - road Value-added industry (packaging, processing)
Potential for intermodal facility (small scale)
Enterprise / business park including technology and training precinct
North Ellenbrook Small-scale service commercial and light industry
General industry Business/office park
North Ellenbrook Extension
Mining industry autonomous vehicle ‘test-bed’
Logistics- road freight and warehousing
Freight and logistics- rail intermodal with full customs and quarantine services
Source: MacroPlanDimasi
Syme Marmion & Co: Muchea Industrial Park Land Demand and Economic Assessment 15
3. Current Uses and Projects
Notwithstanding the various demand analyses already carried out, until recently Muchea has experienced
no significant developments post WAMIA. However, largely reflecting the accessibility improvements due
to Northlink, new activities are now being planned. They have the potential to change Muchea
substantially. An examination of the current projects underway and in prospect at Muchea gives a good
indication of its short, medium and even long term future. There are four main facilities and projects in
and around the Muchea Industrial Park. They are shown on Map 3.1.
• WAMIA
The WA Meat Industry Authority (WAMIA) opened the Muchea Livestock Centre in May 2010 on its 302
ha site. It was a replacement for saleyards at Midland. Muchea Livestock Centre is the largest dual species
undercover livestock selling facility in Australia. Annually, it currently handles around 100,000 head of
cattle (mainly from the north) and 600,000 sheep. There is likely to be little change to the WAMIA
operations in the short to medium term.
WAMIA is currently considering excavating and selling sand from a hill at the northern end of the property.
The resulting level area could be a site for a feedlot to allow for resting of cattle prior to sale. There may
be other opportunities for small scale developments on the property. The WAMIA Board is happy to allow
further developments as long as it does not interfere with current operations.
RAV 10 access is seen as a major planning issue for WAMIA. With the upgrade of the Wubin-Muchea
road, allowing RAV10 access to Muchea, WAMIA is seeking RAV 10 access to the site with an upgrade of
Muchea East Road. Uncoupling trucks at the road train assembly common user facility near the BP service
station is seen as unacceptable, because of animal welfare and security issues. Direct RAV 10 access would
also reduce truck movements by 10-15 per week.
• Precinct 3 (RTA / IPG)
Precinct 3 is currently subject to structure planning by the landowners to facilitate industrial development.
The lots are owned by Road Trains Australia (RTA), represented by Tomahawk Property, and by the
Ingham Property Group (IPG). These have a gross area of 206 ha and might yield around 155 ha (net) of
developed sites. The plans are for a loop road with RAV10 capability to link all lots developed in the
Precinct. The first stage in the southern-most lots is now in preparation. Developed lots will be 3 ha – 5
ha., with capacity for provision of larger sites. The sites will initially be used by the developer (RTA) as a
transport yard for its own purposes (RTA carts cattle, fuel, cement and crude oil). They plan to operate
cement silos to hold bulk cement and are seeking permission to build a concrete batching plant.
Second stage development is not likely within 5 years.
The developers report interest from other transporters, shed builders and machinery suppliers, and
clients of fuel suppliers. Their aim is to attract businesses that service transporters. They identify the
main competitive advantages for Muchea to the transport industry as land price and the availability of
Syme Marmion & Co: Muchea Industrial Park Land Demand and Economic Assessment 16
large lots, with Northlink as the main catalyst. Water and gas availability (lack thereof) are identified as
key land use constraints.
Map 3.1: Muchea: Main Projects
CBH
Precinct 3
(RTA / IPG)
Harvis
WAMIA
Linfox
Syme Marmion & Co: Muchea Industrial Park Land Demand and Economic Assessment 17
• Harvis
Harvis Capital is developing a key site at the
relocated main intersection of Great
Northern Highway and Brand Highway in
Precinct 1A. It has a gross area of 147 ha.
Lots available range from 0.5 ha to 17 ha,
with most at 3 ha – 5ha (see map 3.2). Roads
are configurated for RAV10 access.
Preliminary subdivision approval was issued
in May 2018 with works proceeding to clear
conditions of approval.
A water source is arranged from a private
potable water supplier, with storage and
dosage on the property. There is no
wastewater plant at present. Anticipated
land uses include freight (transport), mining
and drilling contractors and dump truck
trays. 2.5 ha of land has been pre-sold to BP
for a diesel cellar.
Harvis estimates it would cost around $1
million to get gas to the Muchea site and this
is within the capability of an individual
developer to provide, if demand justifies it.
Proximity to the main gas tap is important as
it is prohibitively expensive to install a new
tap. Bullsbrook is further away and it is
consequently seen as less viable for an
individual developer to provide gas there.
Feed mills are an obvious candidate for gas use on this site. However, there may be a question of the
odour conditions of feed mills to be addressed and its impact, if any, on other users. It is not known
whether the proximity of the WAMIA saleyards would deter the establishment of a feed mill on the Harvis
land.
Harvis are also developing a 200 ha site at Bullsbrook on Stock Road with railway access. The main
objective for this site is as an intermodal transport depot and assembly point for containerised inbound
goods for assembly and packaging for north-west markets. Gas will not be available for this development.
Map 3.2: Harvis Development Subdivision Plan
Syme Marmion & Co: Muchea Industrial Park Land Demand and Economic Assessment 18
• CBH
CBH has acquired 132 ha of land at Muchea with rail frontage. This is close to, but outside of
the Muchea Industrial Park area. This is part of an overall CBH Network strategy to rationalise
older less efficient upcountry sites:
o To optimise the time from the paddock to receival site delivery rotations; o By building larger receival sites and phasing out smaller sites; and
o Seeking productivity improvements.
Grain production in the CBH Areas 3 and 4, including Eneabba to Moora and south to Muchea,
are generating improved yields from advanced agronomic practices, resulting in greater grain
movements. The current facilities at CBH Forrestfield are for the purpose of value adding and
cannot be accessed by RAV10 vehicles. CBH would prefer rail movements for any agri-business
precinct. The CBH Muchea site will allow a greater capacity of grain to be moved to the Kwinana
port via rail and this will reduce the number of trucks carting grain from the northern corridor
across the city bypass roads to the port.
Current CBH plans for Muchea land are for a rail-based inter-modal agri-business precinct with:
o Segregated grain bulk receival and storage for approximately 400,000 tonne of grain for
hubbing on rail for delivery to the CBH Kwinana port terminal then for export.
o Receival of containerised hay for export, involving up to 4,000 containers annually.
o Out-turn of grain for the domestic feed market. CBH envisages co-location of complementary industries. These might include:
o Container loading (20Ft and 40Ft). o Grain value-adding, including cleaning, drying, grading and bagging for different grain
types. This might involve approximately 5,000 containers annually. o Feed milling. These would require access to gas, water and power. This appears to be
achievable on this site. o A renewable energy group is interested in converting various agricultural waste
materials to provide a micro-grid energy service across the precinct development. o Consolidation of industrial bulk materials onto rail to Kwinana. This may also have gas
and water requirements. o Truck & transport freight services, including refuelling and convenience facilities.
• Linfox Linfox has a 19.8 ha site at 3241 Great Northern Highway, in the City of Swan and immediately south of
the Muchea Industrial Park area. The site contains 60,000 m2 of sealed industrial hardstand and 37,347
m2 of unsealed laydown area. It is used as a transport yard and freight load assembly area for loads to the
north-west and for storage of large items such as dump truck tyres. Their intention is to use it a road train
assembly point when RAV 10 access is available.
Syme Marmion & Co: Muchea Industrial Park Land Demand and Economic Assessment 19
4. Assessment and analysis
Key points
• There is a surplus provision of future of light and general industrial land in the North East and North
West sub-regions and a substantial deficit in provision in the Metro South / Peel sub-region.
• This is partly due to the effective inclusion of Muchea into the North East sub-region industrial land
supply equation, made possible by the Northlink project.
• The population of the North East sub-region is projected to grow by 241,430 from 209,150 at 2011 to
450,580 by 2050. Depending on the analysis used, this implies a demand for new industrial land of
between 2,580 and 3,444 ha (net). Potential new supply identified in the North East Sub-regional
Framework for long term development is 3,580 ha (gross – around 2,680 ha net) excluding Muchea.
With the addition of Muchea to the prospective land supply, and allowing for gross area to net
industrial land adjustments and the different time scales for each of the above demand estimates,
overall this would suggest a surplus provision in the planning framework for the sub-region of
around 625 ha (net) or 830 ha (gross) for the period 2015 - 2050.
• The implication is that development on one of the major estates in the North East sub-region will
delay or curtail development on others. Not all land in Bullsbrook /North Ellenbrook and Muchea
will be developed to its short and medium term schedule, or even meet long term development
expectations.
• There is a range of potential supply of industrial land in the Perth metro area overall, demand
estimates for any part of it need to consider:
• Population factors:
o Access to skilled labour;
o Access to customers and end uses;
• Location factors – access to:
o Import /export transport routes;
o Local distribution and servicing transport routes;
• Agglomeration economies, i.e. access to goods and services in the value chain.
• Muchea scores well on some transport-related location factors, but not as well as locations closer
to population centres in the Perth metropolitan area for population factors. This reinforces the
likely focus for Muchea as long-haul transport and agricultural products and livestock handling.
Syme Marmion & Co: Muchea Industrial Park Land Demand and Economic Assessment 20
4.1. Overall Demand
4.1.1 Metropolitan Context – Industrial Land Supply
The North East Sub-Regional Framework shows a total of 3,580 ha (gross) of vacant land identified for
industrial use (i.e. already zoned industrial or categorised as Industrial Expansion or Industrial
Investigation) in the sub-region. At around 2,760 ha., the Bullsbrook / N Ellenbrook complex (including
the Bullsbrook Town-Site Precinct North) is the largest component of this. The Framework also shows an
estimated 760 ha of undeveloped land that is zoned industrial in the North East sub-region. This does not
include existing zoned land which has already been developed.
Table 4.1 provides an examination of the sub-regional industrial land supply and the potential but
unzoned industrial land between the EELS and the Sub-regional Framework:
• at 2011/2012 (from the 2012 Economic and Employment Lands Strategy - EELS3); and
• the potential but unzoned industrial land at 2018 (i.e. Industrial Expansion and Industrial
Investigation in the Framework); plus
• land that had been identified as potential in the EELS and has since been zoned industrial.
It shows that in 2011/12 the EELS estimated a total of 5,165 ha of land in the sub-region either zoned for
industrial use (of which 1,458 ha was developed for this use in 2011 /12) or assessed as having the location
and land characteristics to make it suitable for industrial development in the short, medium or longer
term.
In the 2018 Framework, some parcels of land previously identified in EELS with industrial potential have
been zoned urban (chiefly those near the new Forrestfield rail station), some new parcels have been
added and the potential of some has been refined. However, there is little difference from the 2012 EELS
estimate. Using the data in the Framework shows an estimated gross total of 5,141 ha of land either
currently zoned industrial or with the location and land characteristics to make it suitable for industrial
development in the short, medium or longer term.
3 WAPC, Economic and Employment Lands Strategy: non-heavy industrial, Perth metropolitan and Peel regions,
April 2012
Syme Marmion & Co: Muchea Industrial Park Land Demand and Economic Assessment 21
Table 4.1: Industrial Land Estimates EELS (2012) NESRPF (2018)
Zoned Industrial Ha. Ha.
Developed 1,458
short term 37
medium 100
long term 170
Zoned Industrial (at 2011 /12) 1,765 1,765
Additional (includes land yet to be zoned industrial plus land zoned for industrial land use since
2011/12)
Forrestfield 1 71 - Now zoned urban
Hazelmere S 100 50
Wattle Grove 10
Whiteman 85 85 Now zoned industrial (not in NESRPF)
North Ellenbrook 2,428 2,250
Forrestfield 2 22 - Now zoned urban
Forrestfield 3 108 - Now zoned urban
Bullsbrook S 471 471 Now zoned industrial (not in NESRPF)
Bullsbrook S Extension 400
Bullsbrook townsite 115 110
Total Additional 3,400 3,376 Total Zoned and Potential 5,165 5,141
The North East Sub-regional Framework estimates a total ‘gross demand’ of 2,810 ha of industrial land in
the sub-region by 2050. This estimate appears to be calculated on the assumption of a linear average
increase in land demand from 2015 to 2050. This estimate and its context are worthy of examination.
Forecasting industrial land demand is a tricky business. Base planning and demand analysis for industrial land in Perth and Peel was completed over 10 years ago for the Industrial Land Needs Study4 (undertaken by SMCo for LandCorp and the WAPC). This demand modelling formed the basis for the subsequent key WAPC policy document, the Economic and Employment Lands Strategy (EELS), which included supply and demand analysis to 2031. Based on considerable research and analysis, the demand modelling used projected sub-regional workforce size as the best predictor for non-heavy industrial land demand.
However, as noted previously, this relationship between industrial land and workforce is almost certainly changing. With the rapid incorporation of automated systems for some categories of industrial land use,
4 Syme Marmion & Co, Industrial Land Needs Study, LandCorp and DPI, 2008
Syme Marmion & Co: Muchea Industrial Park Land Demand and Economic Assessment 22
particularly freight and logistics and some categories of manufacturing, it is apparent the nexus between industrial land and workforce size is now weaker. Although there are few research studies of the demand for industrial land this idea is being recognized. For example, a recent study of industrial land demand in the Netherlands has found that the relationship between employment and industrial land demand is non-linear but that overall, employment is not a reliable indicator for forecasting long term industrial land demand.5 To illustrate, the changes in floorspace employment densities in the Western Trade Coast (including the Kwinana Industrial Complex and Henderson) are shown in Figure 4.1. Similar patterns have emerged in other major industrial areas.
Fig 4.1: Western Trade Coast – Floorspace Employment Density
Source: WAPC Land Use and Employment Surveys, 1993, 1997, 2017.
While the most marked decrease in employment density has been in storage/distribution uses, only retail
and office / business uses have not shown a decrease in floorspace employment density.
However, it is likely that the nexus between total population and industrial land demand endures. While
employment densities in industrial estates that contain a high proportion of freight and logistics and
manufacturing (East Rockingham is a good example) are declining, the economic activity being undertaken
there is still essential to support the population and the land is required to accommodate that activity.
5 Beckers, P. and Schuur, J. (2015) ‘The Future Demand for Industrial Sites in the Netherlands: Is Employment a
Good Predictor?’, Regional Studies, 49(9), pp. 1535–1547. doi: 10.1080/00343404.2013.838320.