Multi-Criteria Policy Scenarios Analysis for Public Management of Irrigated Agriculture L. Riesgo 1 and J.A. Gómez-Limón 2 1 Department of Economics. Pablo de Olavide University. Ctra. de Utrera, km 1. 41013 Seville, Spain 2 Department of Agricultural Economics. E.T.S.II.AA. Palencia. Valladolid University. Avda. de Madrid, 57. 34071Palencia, Spain Contribution appeared in Arfini, F. (Ed.) (2005) “Modelling Agricultural Policies: State of the Art and New Challenges”, proceedings of the 89 th EAAE Seminar, pp. 351 - 374 February 2-5, 2005 Parma, Italy Copyright 2005 by L. Riesgo and J.A. Gómez-Limón. All rights reserved. Readers may make verbatim copies of this document for non-commercial purposes by any means, provided that this copyright notice appears on all such copies.
Transcript
Multi-Criteria Policy Scenarios Analysis for Public Management of Irrigated Agriculture
L. Riesgo1 and J.A. Gómez-Limón2
1 Department of Economics. Pablo de Olavide University. Ctra. de Utrera, km 1. 41013 Seville, Spain 2 Department of Agricultural Economics. E.T.S.II.AA. Palencia. Valladolid University. Avda. de Madrid, 57.
34071Palencia, Spain
Contribution appeared in Arfini, F. (Ed.) (2005) “Modelling Agricultural Policies: State of the Art and New Challenges”, proceedings of the 89th EAAE Seminar, pp. 351 - 374
February 2-5, 2005
Parma, Italy
Copyright 2005 by L. Riesgo and J.A. Gómez-Limón. All rights reserved. Readers may make verbatim copies of this document for non-commercial purposes by any means, provided that this copyright notice appears on all such copies.
351
Multi-Criteria Policy Scenarios Analysis
for Public Management of Irrigated Agriculture
L. Riesgo* and J.A. Gómez-Limón**
Abstract
This paper presents a methodological approach to analysing combinations of different agricul-tural policy and irrigation water pricing alternatives. The approach takes into account the fact that farmers consider a broad set of criteria when they make decisions. Policy scenarios are simulated by means of multi-criteria mathematical programming models capable of simulating the future behaviour of farmers. The Multi-Attribute Utility Theory (MAUT) has been chosen as a methodological framework for model-building. A set of relevant economic, social and en-vironmental attributes related to public criteria are also obtained as a way of measuring the ef-ficiency of the suggested policy scenarios. This methodology has been applied to the Duero Basin in Spain.
Keywords: Multiple-Criteria Modelling, Irrigated Agriculture, Scenario Analysis, CAP, Water Policy.
1. Introdu cti on
Like many other countries, during the past few decades Spain has entered a mature stage of the water economy. This has demonstrated the growing relative shortage of this natural resource and has encouraged an intense discussion about the efficiency of use of water by irrigated farms, which are responsible for 80 per cent of national water consumption (Ministry of Envi-ronment, 1998). However, the water economy has matured not only in Spain, but is shared by other Member States of the European Union (EU). This situation has led to the recent approval of Directive 2000/60/CE, which establishes a framework for Community action in the field of water policy (the Water Framework Directive, or WFD). There is no doubt that one of the most
* Department of Economics. Pablo de Olavide University. Ctra. de Utrera, km 1. 41013 Seville, Spain. E-mail: [email protected]. ** Department of Agricultural Economics. E.T.S.II.AA. Palencia. Valladolid University. Avda. de Madrid, 57. 34071 Palencia, Spain. E-mail: [email protected].
Modelling Agricultural Policies: State of the Art and New Challenges
352
important topics of this directive is the article related to water pricing (article 9), that has been proposed as the main economic instrument for dealing with the demand for water in the EU, in order to “provide adequate incentives for users to use water resources efficiently, and thereby contribute to the environmental objectives of this Directive”.
Although water pricing is an environmentalist demand, the reasoning on which the instrument is based is purely economic, in the sense that water users (for example, farmers in irrigated areas), according to neoclassical economic theory, would respond to the introduction of (or an increase in) water prices by reducing their consumption, in accordance with a negatively sloping demand curve. The water savings obtained would be redistributed among more productive uses (for example, industrial consumption or leisure activities) or those with a more social profile (environmental uses), according to the preferences of society. Nevertheless, the use of this economic instrument, although justified from the economic point of view, has aroused the opposition of current users (especially farmers) to paying more for the resource. This rejection of the increase of water pricing is also shared by those who prize the social role of the irrigated agriculture in rural areas (rural development). In this sense, before implementing water pricing, we need to consider the social (e.g. rural viability) and territorial (e.g. regional development) effects of this economic instrument on the irrigated agriculture sector.
Besides the introduction of water pricing, irrigated agriculture currently has to adapt to an-other challenge, the continuous process of reforms of the Common Agricultural Policy (CAP). The latest landmark in this process was the approval of a fundamental reform in June 2003. Among the novelties presented, the “decoupling” of public subsidies received by producers is worth mentioning. Thus, the previous system of public subsidies that linked subsidies to pro-duction has been replaced by a single income payment, personally calculated on the base of the subsidies historically received by farmers. Furthermore, it is worth noting that this change in the system of public subsidies is accompanied by a new fall in commercial protection, through a reduction in guaranteed prices to the world markets. With these changes in the support mechanisms the UE is attempting to win greater legitimacy at both internal (vis-à-vis consum-ers and taxpayers) and external level, harmonizing European subsidies with the regulations es-tablished by the World Trade Organization (WTO) regarding international trade.
These normative novelties (WFD and the CAP reform) expose the uncertainty facing the European irrigated agriculture sector in general and Spanish farmers in particular. Indeed, the application of volumetric water pricing that recovers the costs associated with the resource, and the decoupling of public subsidies and the reduction of guaranteed prices, is generating a “price snipping” effect. Certainly, while CAP reduces the protection given to European agri-cultural products (fall in prices), pleading for a more competitive and market-oriented sector, the application of the WFD will raise production costs due to water prices increase.
It is also worth pointing out that the application of the new CAP and the WFD affect not only the financial viability of irrigated farms, but also the environmental and social functions of agriculture in rural districts (multifunctionality). Therefore, both CAP and decisions related to water pricing should be complementary, with the aim of achieving an appropriate balance among the objectives of economic efficiency, social equity and conservation of the environ-ment, which are usually in conflict, in accordance with the preferences of society as a whole.
5. Modelling Multifunctional and Environmental Issue
353
Given the importance of the above issues, this study tries to establish a methodology for analysing the impact of water pricing and various agricultural policy scenarios on irrigated agri-culture, studying its economic, social and environmental effects. Finally, the study attempts to apply the proposed methodology to the irrigated agriculture of the Duero basin, treating this region as representative of continental irrigated agriculture.
2. Methodology
2.1 Multi-attribute Utility Theory
In neoclassical economic theory economic agents behave as profit maximizers. According to this theory, the decision-making of agricultural producers can be modelled by the maximiza-tion of single-objective models. However, real-life observations refute this simplification, and the behaviour of farmers is not adjusted to crop-mixes that produce maximum profit. Indeed, many authors have demonstrated the complexity of farmers’ decision-making: e.g. Perkin and Rehman (1994), Sumpsi et al. (1997), Berbel and Rodríguez (1998), Costa and Rehman (1999), Willock et al. (1999), Solano et al. (2001) and Bergevoet et al. (2004). These recent studies all suggest that decision-making is driven by other criteria in addition to the expected profit or its higher moments (risk), such as the maximization of leisure, the minimization of managerial problems, the minimization of working capital, etc. Hence, farmers take their decisions while trying to simultaneously optimise a range of conflicting objectives.
In the light of the above-mentioned findings, Multi-Attribute Utility Theory (MAUT) has been proposed as a theoretical framework for the Multi-criteria Decision Making (MCDM) programming modelling technique that is employed in this study. MAUT, largely developed by Keeney and Raiffa (1976) overcomes the limitations of the neoclassical single-attribute utility function (profit maximization) and take into account other attributes (and their associated ob-jectives) involved in the farmers’ decision-making process.
Nevertheless, the main drawback of the MAUT approach comes from the elicitation of the multi-attribute utility function (MAUF), as pointed out by Herath (1981) or Hardaker et al. (1997, p. 162). First, the mathematical shape of utility functions, and secondly, the estimation of the weights of each attribute, force us to assume simplifying assumptions pragmatically. This thus assumes that MAUFs are additive and linear. For a justification of these assumptions, as well as their limitations, the work of Gómez-Limón and Riesgo (2004) and Gómez-Limón et al. (2004) may be consulted. In mathematical terms, the MAUF considering these simplifica-tions takes the following shape:
!=
=n
j
ijji fwU1
j = 1, ..., m Equation (1)
Modelling Agricultural Policies: State of the Art and New Challenges
354
where Ui is the utility value of the alternative i, wj is the weight of attribute j and fij is the value of attribute j for the alternative i. In this way the ranking of farmers’ crop-mix alternatives is obtained by adding the contributions of each attribute that these producers regard as relevant (profit, risk, leisure-time, etc.). The weighting of each attribute expresses its relative impor-tance.
In order to elicit the additive MAUF the methodology devised by Sumpsi et al. (1997) and Amador et al. (1998) has been utilised, with further modifications proposed by Gómez-Limón et al. (2003) and Gómez-Limón and Riesgo (2004). In order to avoid unnecessary repetition, we refer to the papers mentioned above for details of this multi-criteria technique.
2.2 Multi-criteria models at farm level
The farmer himself/herself can determine the crop distribution, that is, he/she decides what area (xi) should be devoted to each activity (crop i), as decision variables. This decision-making as expressed through the decision variables is focused in such a way as to achieve the various objectives that are taken into account by the decision-maker, being limited by certain con-straints that need to be fulfilled. Decision variables, objectives and constraints are thus the main elements of the model that is described for our particular case study.
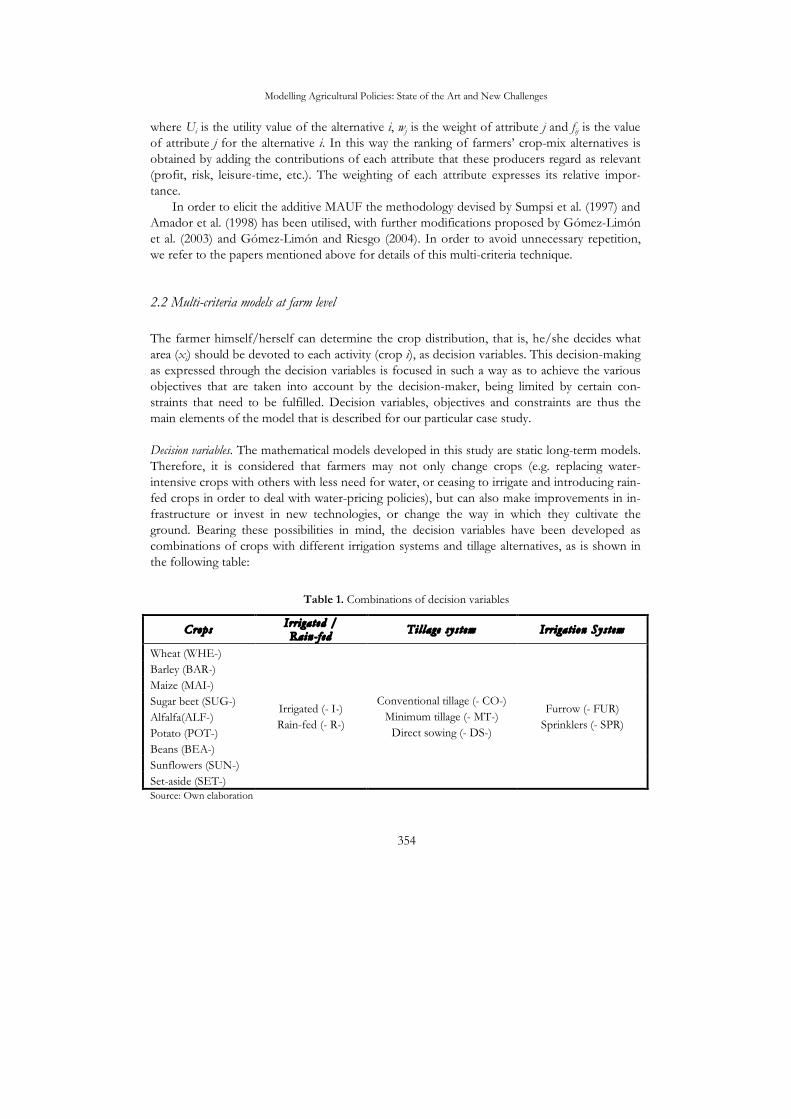
Decision variables. The mathematical models developed in this study are static long-term models. Therefore, it is considered that farmers may not only change crops (e.g. replacing water-intensive crops with others with less need for water, or ceasing to irrigate and introducing rain-fed crops in order to deal with water-pricing policies), but can also make improvements in in-frastructure or invest in new technologies, or change the way in which they cultivate the ground. Bearing these possibilities in mind, the decision variables have been developed as combinations of crops with different irrigation systems and tillage alternatives, as is shown in the following table:
5. Modelling Multifunctional and Environmental Issue
355
Nevertheless, in spite of the range of possibilities considered a priori as combinations of the columns of the previous table, it should be noted that not all such combinations are feasi-ble from an agronomics point of view. In fact, only 47 different activities were considered, as is shown in Table 2.
Table 2. Decision variables in the case study
Wheat
WHEI
CO
FUR
WHEI
CO
SPR
WHEI
MT
FUR
WHEI
MT
SPR
WHEI
DS
FUR
WHEI
DS
SPR
WHER
CO
WHER
MT
WHER
DS
Barley
BARI
CO
FUR
BARI
CO
SPR
BARI
MT
FUR
BARI
MT
SPR
BARI
DS
FUR
BARI
DS
SPR
BARR
CO
BARR
MT
BARR
DS
Maize
MAII
CO
FUR
MAII
CO
SPR
MAII
MT
FUR
MAII
MT
SPR
MAII
DS
FUR
MAII
DS
SPR
Sugar-beet
SUGI
CO
SPR
SUGI
MT
SPR
SUGI
DS
SPR
Alfalfa
ALFI
CO
FUR
ALFI
CO
SPR
ALFI
MT
FUR
ALFI
MT
SPR
ALFR
CO
Potato
POTI
CO
FUR
POTI
CO
SPR
Beans
BEAI
CO
FUR
BEAI
CO
SPR
Sunflowers
SUNI
CO
FUR
SUNI
CO
SPR
SUNI
MT
FUR
SUNI
MT
SPR
SUNI
DS
FUR
SUNI
DS
SPR
SUNR
CO
SUNR
MT
SUNR
DS
Set-aside SET
CO
SET
MT
Source: Own elaboration
Objective function. The long-term models developed to simulate farmers’ decision-making take the MAUFs obtained for each farm-type (see Section 2.4) as objective functions. According to the literature, and on the basis of the answers given by the farmers in the survey developed for data gathering, the main attributes in the area have been identified. In this sense, the particular attributes considered a priori by farmers within individual MAUFs are:
Modelling Agricultural Policies: State of the Art and New Challenges
356
a) Total Gross Margin (TGM). The gross margin is considered a proxy for profit in the short term, and producers try to maximize it.
b) Risk (VAR). This is an attribute to be minimized by farmers. In this case risk was measured as the variance of the TGM (VAR), following the classical Markowitz (1952) approach. Risk is thus computed as [ ]
i
t
iXXVARrr
cov= , where [cov] is the vari-ance-covariance matrix of the crop gross margins during the considered period, and X
r is the crop decision vector.
c) Total Labour (TL). The objective associated with this attribute (min. TL) implies not only a reduction in the cost of this input but also an increase in leisure time and the reduction of managerial involvement (labour-intensive crops require more technical supervision).
d) Working capital (K). The aim of reducing the level of indebtedness is also considered as an objective pursued by farmers.
These objectives were included in the objective functions of the different farm-type as follows:
where wj expresses the different weightings of the attributes considered by different farmers, and kj is a normalising factor. It is worth mentioning that both wj and kj have been calculated in a particular way for each farm-type considered.
Constraints. Finally, the following constraints were included in the construction of the models for each farm-type:
a) Land constraint. The sum of the land devoted to each crop must be equal to the total land available to each farm.
b) CAP constraints. Ten percent of the surface devoted to cereal, oilseed and protein crops (COPs) is treated as compulsory set-aside, as is the sugar-beet quota (maximum surface) as required by the CAP.
c) Rotational and agronomic constraints. d) Market constraints. These affect alfalfa and potato crops due to their being perishable
products.
The models were fed with primary data collected ad hoc for this study (irrigated land, crop dis-tribution, sugar-beet quotas, etc. at farm level) through a survey and with secondary data (prices, subsidies, etc.) from different public databases. All information regarding the data and the development of the models can be consulted in Riesgo (2004).
Simulation of the decision-making at farm level. The basic models at farm level described above allow us to simulate farmers’ decision-making in the current situation as well as in any hypothetical long-term scenario. To do so, it is necessary to adjust the parameters that defined each model (product
5. Modelling Multifunctional and Environmental Issue
357
prices, inputs costs, subsidies, quotas, etc.). It is worth mentioning here that MAUFs estimated with current situation data may be regarded as structural characteristics of producers. This is justi-fied because estimates of these functions are based on certain psychological and/or cultural fea-tures of producers that are unlikely to change in the short and medium term (Gómez-Limón et al., 2003). MAUFs for each farm-type may thus be regarded as invariable, irrespective of any change in the scenarios. It is therefore assumed that producers will try to maximize these utility functions in the future, whatever the scenario or institutional framework they face.
2.3. Economic, social and environmental indicators
One of the principal elements of this study is a set of indicators that allow us to analyze the potential impacts (economic, social and environmental) of the various political scenarios on irrigated agriculture from a public point of view. In fact, they should be regarded as public cri-teria on which political decisions may be based. These indicators are outlined in Table 3. The proposed selection is based on the guidelines published by the OECD (OECD, 2001).
Table 3. Indicators for the short term analysis
Source: Own elaboration
The indicators showed above will be introduced as “accountants” in the simulation models. In this sense, it is worth pointing out that indicators are deduced from the vector of decision vari-ables (crop plans) chosen by agricultural producers. In fact, these indicators are of interest to policy-makers (public objectives), but in most cases they are not considered by farmers in their decision-making process (they do not constitute private objectives).
The interpretation of each indicator is explained below. a) Economic indi cators :
• Total Gross Margin (TGM). Farmers’ revenue may be measured in terms of the gross margin obtained by farming activities. The use of this indicator enables the financial
Area under analys is Indicators Measurement units
Farmers’ profit (TGM) € / ha Public subsidies (SUBSID) € / ha Economic impact
Public revenue due to water tariffs (PUBCOL) € / ha Total labour (TL) Person-day/ha
Social impact Seasonal labour employment (SEASONA) % Genetic diversity (DIVERS) no. crops Landscape and
biodiversity Soil cover (SOILCOV) % Water use Water demand (WATER) m3/ha
Nitrogen balance (BALNIT) kg N/ha Energy balance (BALENE) 106 kcal/ha
Environ-mental impact Fertilizers and
pesticides Pesticide risk (PESTRISK) 103 PR/ha
Modelling Agricultural Policies: State of the Art and New Challenges
358
viability of irrigation to be analysed. This way, it can be considered that any activity is not economically sustainable if it repeatedly produces a negative financial result.
• Public subsidies (SUBSID). This indicator measures the protection received by agricul-tural activities. In this sense, this indicator is used in order to analyze how direct sub-sidies received by the agriculture would be affected.
• Public revenues (PUBCOL). This indicator calculates the revenues obtained by the State from water tariffs, thus allowing the level of cost recovery for the provision of water services to be calculated.
b) Soc ial indi cators :
• Total Labour (TL). The extent of employment may illustrate the social importance of the agricultural sector in as a source of income for the rural population, and the dis-tribution of this income.
• Seasonality of labour employment (SEASONA). Labour requirements in agricultural activi-ties are subject to seasonal variations that depend on the crop cycle and the agricul-tural operations required. During certain periods such as harvesting, there are peaks in agricultural employment, and seasonal labour usually has to be recruited. In this particular case this indicator is measured as the percentage of employment demand during the critical periods of the agricultural year.
c) Environmental indicators :
• Genetic diversity (DIVERS). This indicator shows the number of different crops on the farm, allowing the level of agricultural biodiversity to be measured.
• Soil cover (SOILCOV). A lack of vegetable cover is important for agricultural soils, due to the problems caused by soil erosion. The indicator of soil cover represents the per-centage of days a year during which vegetation protects the soil.
• Water use (WATER). Water use is quantified in terms of the quantity of water re-quired by farms, measured in absolute terms per irrigated hectare.
• Nitrogen balance (BALNIT). Excess nitrogen can be harmful to the environment, espe-cially for water quality. In this analysis, nitrogen balance is used as an indicator that calculates the physical difference (excess/deficit) between the nitrogen in the inputs (fertilizers) and outputs (harvests). The difference gives the nitrogen balance liberated to the environment (air, soil and water).
• Energy balance (BALENE). The energy balance is calculated using the same input-output framework as for the calculation of nitrogen balance. Adding the energy con-tained in the agricultural inputs (seeds, fertilizers, etc.) and consumed in farming ac-tivities (machinery, fuels, etc.) gives us the total energy contained in inputs. This is balanced against the energy contained in agricultural production. .
• Pesticide risk (PESTRISK). This indicator provides information on toxic products re-leased to the environment by pesticides. The quantity of toxins was estimated in terms of the biomass of living organisms killed by these pesticides.
5. Modelling Multifunctional and Environmental Issue
359
For more detailed information about methods of calculating these indicators and the tech-nical information requested, see Bazzani et al. (2004) and Riesgo (2004).
2.4. Aggregation procedure
Modelling agricultural systems at sector level (or at any other level that aggregates individual farms) tends to introduce problems of aggregation bias (Hazell and Norton, 1986, p. 145). The final result of these models is that the value obtained for the objective function is always up-wardly biased and the values obtained for decision variables tend to be unachievable in the real world. These aggregation biases can only be avoided if the farms included in the models fulfil strict criteria regarding homogeneity: technological homogeneity, pecuniary proportionality and institutional proportionality (Day, 1963). However, if a multicriteria perspective is being con-sidered, an additional homogeneity requirement emerges in order to avoid aggregation bias; viz., homogeneity related to choice criteria. Thus, in order to avoid aggregation bias resulting from lumping together farmers with significantly different objective functions, a classification of all farmers into homogeneous groups with similar decision-making behaviour (objective functions) is also required.
For this issue, we sample 367 farmers as representatives of the study area, which have been grouped following the criteria that respects the homogeneity approach discussed above. To this end, we classified the elements of the sample (farms) according to the irrigated area to which they belong, assuming that this geographical classification allows groups of farms fulfill-ing technological homogeneity, pecuniary proportionality and institutional proportionality re-quirements to be obtained. Furthermore, inside each irrigated area a classification of farmers was implemented, considering the functional shape of their MAUFs as the criterion for typifi-cation. Thus, the resulting groups of farmers also fulfil the requirement of the homogeneity of decision-making.
Following this approach, we obtained 22 groups of farmers or farm-types that can be ana-lyzed by means of a unique mathematical model for each one. The results of these models may be regarded as appropriate for farmers within each group without aggregation biases (they have sufficient internal homogeneity).
Once we had obtained individual results corresponding to each farm-type, according to the criteria discussed above, we aggregates those to obtain results at basin level. Taking into account that the sample of farms is representative of the case study; the aggregation process has been carried out by weighted summation of the decision variables and the attributes ob-tained at farm-type level. The weights given to individual values are related to the quantitative importance of each group of farms, i.e. the percentage of irrigated land that represents the total surface of the case study.
Modelling Agricultural Policies: State of the Art and New Challenges
360
2.5. Implementation of the WFD. Scenario proposal
In this study we selected future scenarios for water pricing in accordance with the WFD guide-lines:
• “Subsidized” price. In this scenario, this considers a price of 0.02 €/m3. • “Medium” price. This price attempts to apply the water cost recovery principle in the ir-
rigated area under study. This way, a price of 0.04 €/m3 may be regarded as a “fair” value for cost recovery, but it will not be capable of recovering environmental costs.
• “FCR” price. This considers a price of 0.06 €/m3. This price would be a tough applica-tion of full-cost recovery principle in the basin, including a provision for environ-mental costs.
In order to compare results, we also considered an additional water pricing scenario for the status quo, characterized by a zero price for water resources (non-application of the WFD).
2.6. Agricultural policy scenarios
We have defined future scenarios that can be presented in European agriculture for 2015, as-suming certain hypotheses concerning agricultural policy, international trade and environment conservation instruments. The development of agricultural scenarios is based on a review of future scenarios constructed by the UK Foresight Programme for the agricultural sector (Berkhout et al., 1998 and DTI, 1999 and 2002). Taking into account the above-mentioned framework, we can distinguish four future scenarios for the agricultural sector within this time horizon, as we can see in Figure 1.
Globalisation
World Global
Markets Sustainability
Consumerism Community
Provincial Local
Enterprise Stewardship
Regionalisation
Conventional development
Source: DTI (1999)
Figure 1. Future scenarios for the European agriculture
5. Modelling Multifunctional and Environmental Issue
361
We now introduce the individual scenarios, explaining their main features: a) World Agricultural Markets. This scenario emphasizes private consumption and a highly
developed and integrated world trading system, emphasising economic development (consumerism) and global integration (globalization). In practice, this scenario as-sumes a fall in agricultural prices due to severe international competition, as well as a rise in yields of genetically modified organisms (GMO). Likewise the simulation of this scenario assumes a decrease in the costs of agricultural inputs and the disappear-ance of agricultural public subsidies, also as a consequence of the liberalization of in-ternational markets.
b) Global Sustainable Agriculture. In this scenario special importance is attributed to social and ecological values (community) in a global economic framework (globalization). Bearing these assumptions in mind, there is a collective action to address environ-mental and social issues. To simulate this scenario, a reduction in agricultural prices due to very severe international competition is assumed, although this is less acute than in the first scenario. A rise in crop yields and a moderate reduction in public subsidies in comparison with the current situation are also assumed. Finally, the prices of agricultural inputs will tend to increase, especially those considered as “pol-lutants” (fertilizers, pesticides and fossil energy), due to the introduction of eco-taxes.
c) Provincial Enterprise. This scenario emphasizes private consumption (consumerism), but unlike the other scenarios, it takes account of national or regional level policy de-cision-making (regionalism), in order to reflect local priorities and interests. To simu-late this scenario, we have assumed an increase in agricultural prices as a consequence of national agriculture protection policies. On the other hand, agricultural yields will increase due to the introduction of GMO. Finally, agricultural subsidies will be practi-cally the same as the current ones, although the prices of inputs will increase as a re-sult of trade protectionism.
d) Local Stewardship. In this situation, regional or local governments emphasize social and environmental values (community) that promote local interests (regionalization). This scenario assumes a significant increase in agricultural prices resulting from a higher degree of protectionism. Nevertheless, it is worth mentioning that in contrast to the other scenarios, the agricultural yields will decrease. This is due to the rejection of GMO and strict controls on the use of inputs. Public subsidies will increase slightly, as well the prices of agricultural inputs as a consequence of environmental taxes charged on the consumption of these products.
Besides these four agricultural policy scenarios, we analysed a further one: the status quo, i.e. the situation of the irrigated agriculture in 2000, characterised by the current agricultural policy (subsidies and trade protectionism), yields and prices. The main purpose of this scenario is to enable proper comparisons to be made between the current situation and the scenarios pro-posed before.
Modelling Agricultural Policies: State of the Art and New Challenges
362
For a detailed definition of the above-mentioned agricultural policy scenarios (story lines), see Morris et al. (2004). For an analysis of the implications of these scenarios in the construc-tion of the simulation models (quantitative parameter estimation), see Riesgo (2004).
3. Case s tudy
The evaluation of the impact of both water pricing and agricultural policy scenarios needs to be developed in the context of real agricultural systems. The practical application of the meth-odology proposed above is therefore implemented in the Duero basin in Spain. Within this area 555,582 hectares are used for irrigated agriculture, which consumes an average of 3,500 hm3 of water annually (about 6,300 m3/ha.year). In fact, irrigation is the main user of water in this basin, consuming 93% of the available resources. The rest of the water is used for urban and industrial purposes, consuming 6% and 1% respectively of the total available resources. The preponderance of the agricultural sector indicates that the greatest potential for improving resource allocation at basin level lies in the implementation of irrigation water pricing.
This basin may be treated as representative of the continental agriculture of central Spain, being highly dependent on CAP subsidies and characterized by extensive, low-value-added and few labour-intensive crops (cereals, sunflowers, alfalfa or sugar-beet).
Irrigation in the Duero basin, as established by Spanish legislation, is divided into irrigated areas, internally managed by associations of water users known as “Comunidades de Regantes” (CRs). For this study, given the practical impossibility of considering all of them, we selected seven representative CRs at basin level, covering 51,343 watered hectares (9.2% of the total irrigation in the Duero).
Within each CR the cluster technique was utilised to generate homogeneous groups of farmers. Once this statistical procedure had been applied in each CR, a total of 22 different homogeneous groups were defined as farm-type to be modelled. For more information, see Riesgo (2004).
The multicriteria methodology described below calculates the different weighting vectors have been applied to each cluster.
4. Resul ts
The methodology for scenario simulation was applied to various combinations of agricultural policies and water policies (water pricing). For the 20 feasible scenarios (5 CAP alternatives by 4 water prices), this gave us results for each farm-type related to farmers’ private decision vari-ables and regarding the public criteria indicators. The results of the simulation of the status quo agricultural policy and zero water pricing (current situation) were used to validate the models,
5. Modelling Multifunctional and Environmental Issue
363
verifying that there were only slight differences between the simulated and real (observed) val-ues.
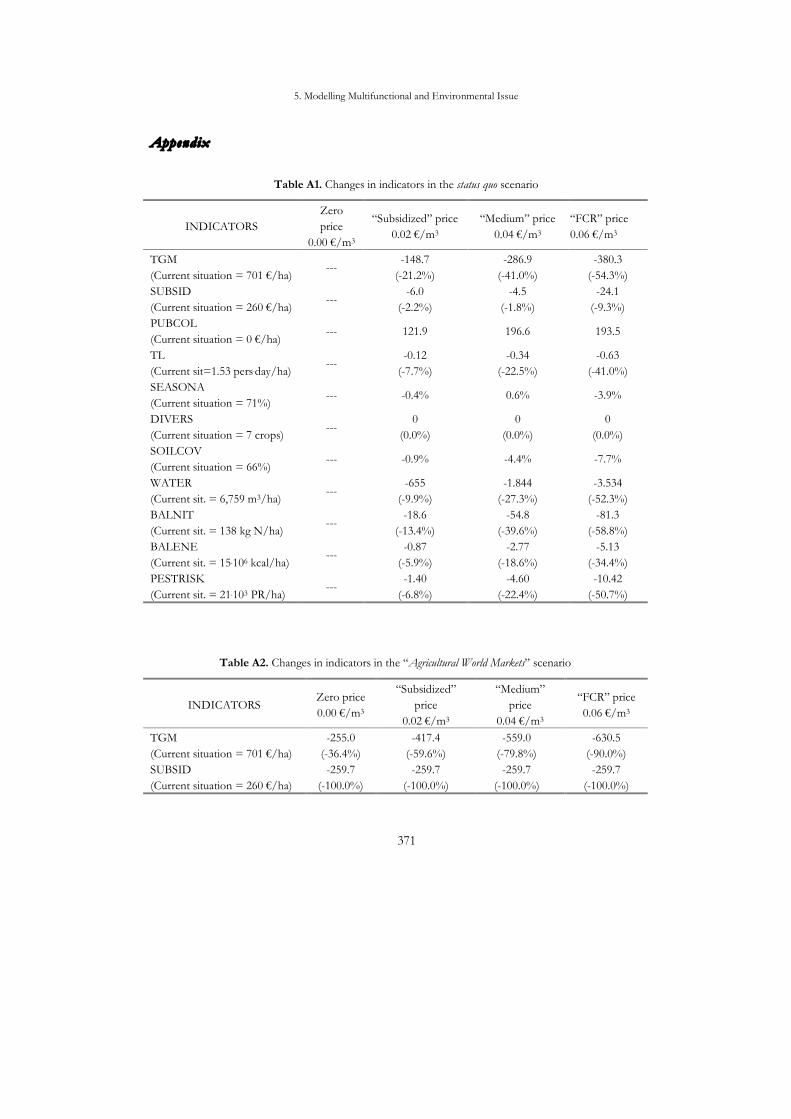
The huge amount of data generated by these particular analyses can be summarized by in-tegrating all results obtained at farm-type level into basin level, taking the Duero basin as a whole. These aggregated results are shown in Tables A1-A5 in the Appendix.
4.1. Economic indicators
Total gross margin (TGM). Taking into account only water pricing impact, and assuming an agri-cultural policy scenario equivalent to the status quo (Table A1), we can observe how this eco-nomic instrument implies an important loss in farmers’ income, generating reductions in the TGM from 21% for a “subsidized” price to 54% for the “FCR” tariff. This drop in the profit-ability of irrigated agriculture has two possible causes: first, the rise in payments of water tariffs to the State and second, the withdrawal of activities that generate greater profits, usually with higher water demands (maize, sugar-beet or alfalfa).
If the remainder of the agricultural policy scenarios (Tables A2-A5) are also considered in the analysis, the greatest losses in farmers’ income will result from the World Agricultural Mar-
kets scenario. These maximum losses in TGM range from 60% for the “subsidized” price to 90% for the highest tariff considered. On the other hand, water pricing would cause the lowest decreases in TGM in the Provincial Enterprise scenario, from 4% for the “subsidized” price to 40% for the “FCR” price. These falls in farmers' income might well lead to a considerable drop in the competitiveness of irrigated agriculture, which in turn might involve the withdrawal of a large proportion of farmers from Duero basin agriculture.
The conclusion that can be drawn from these results is that irrigation water pricing always causes a considerable decrease in the profitability of irrigated agriculture, but agricultural policy is the main driving force that determines farmers’ income (TGM). This circumstance is espe-cially marked for the case study analysed here, where agricultural systems are mainly devoted to continental crops, which are highly dependent on public subsidies.
Public subsidies (SUBSID). The evolution of the subsidies indicator is also analysed in the tables in the Appendix. It can be seen that a rise in the price of water would lead to a decrease in the public support to the irrigation sector. This is due to the changes in the crop mixes due to wa-ter pricing. Such drops in the subsidies received by farmers are caused by the withdrawal of the most water-intensive crops (for example maize), which normally attract higher subsidies. In the current agricultural policy scenario (status quo), these decreases in public subsidies range be-tween 2% (“subsidized” price) and 9% (“FCR” price).
The behaviour of this indicator follows the same pattern in all agricultural policy scenarios. In any case, it can be seen that the greatest fall in public subsidies is produced by the World Ag-
ricultural Markets scenario. In this context, CAP subsidies would disappear. This is the reason why this scenario is the most favourable one for the public budget, regardless of water price. On the other hand, the status quo would be the most favourable scenario for farmers (least loss of subsidies) for water tariffs between 0.02 €/m3 and 0.04 €/m3. For the implementation of
Modelling Agricultural Policies: State of the Art and New Challenges
364
higher water tariffs (0.06 €/m3), the Local Stewardship scenario would generate the least losses (5%).
In any case, it is convenient to point out that the agricultural policy scenario is much more relevant than the water pricing policy in determining the value of this indicator.
Public revenues (PUBCOL). When the hypothetical water tariffs are analysed in the current agri-cultural policy scenario (status quo), it can be seen that an increase in water pricing would lead to a rise in public-sector revenue. However, this rising trend reaches its maximum value at a water price of 0.05 €/m3, where revenues received by the State would reach 206 €/ha.year. Beyond this tariff, public revenue begins to decrease. We may therefore observe that if “FCR” price is applied instead of a “medium” price, public-sector revenue would have decreased (from 197 to 193 €/ha). In any case, in order to reach a final conclusion about the efficiency of each water tariff, it would be necessary to analyse the willingness to pay of the rest of economic sectors for the water saved in the agricultural sector. Nevertheless if, as it is expected, there was no effective water demand from other potential users of the “new” water available in the Duero basin for a “FCR” tariff (1,400 hm3 as discussed in Section 4.3.3), the aim of recovering all the costs of providing water services could not be met. In fact, it should be noted that if this were to happen, the economic inefficiency caused by the “FCR” tariff would have to be borne by taxpayers via budgetary transfers to public water agencies.
When water tariffs proposed are analysed in different agricultural policy scenarios, we can see that the highest income to the State is obtained by the Provincial Enterprise scenario, where it would range between 132 €/ha for the “subsidized” tariff and 302 €/ha for the “FCR” price. On the other hand, Local Stewardship produces the lowest public-sector revenue at “subsidized” and “medium” prices (102 €/ha and 170 €/ha respectively), and World Agricultural Markets at the “FCR” price (179 €/ha). In consequence, these two agricultural policy scenarios would be where the water pricing would be least efficient in raising funds.
In any case, we can that water pricing is more important than agricultural policy in deter-mining the revenues collected by the State through water tariffs.
4.2. Social indicators
Total labour (TL). Water pricing would lead to a decrease in the employment directly generated by the agricultural sector. For the status quo scenario (Table A1), it can be seen that any increase in the price of irrigation water would result in a fall in agricultural employment. This decrease is a social cost caused by the substitution of the most water-intensive activities (normally also more labour-intensive) by others with lower water and labour requirements. It is worth point-ing out here that for the current agricultural policy scenario a “subsidized” tariff could produce a slight reduction in labour demand (less than 8%), although such decreases might increase for the “FCR” price (even higher than 40%).
However, these decreases in demand for labour would not have a serious impact in the area under study. In fact, these drops in demand for labour in the Duero basin would tend to translate into an enlargement in farmers’ leisure rather than a direct fall in employment. At any
5. Modelling Multifunctional and Environmental Issue
365
rate, it is necessary to emphasize the risk of abandoning farming activities due to the falls in both employment and the TGM in the long term.
The impacts of water pricing on this indicator would also vary with respect to the agricul-tural policy scenarios considered. As Tables A2-A5 show, the introduction of irrigation water pricing would produce higher impacts in the Local Stewardship scenario for a range of prices from 0.02 €/m3 to 0.04 €/m3 (decreases in labour demand quantified at 16% and 26% respec-tively). However, when water tariffs rise, the greatest drop in employment is produced by the status quo scenario (41%). On the other hand, irrigation water pricing would have a positive ef-fect on employment in the World Agricultural Markets scenario for a “subsidized” price (increases of more than 8%). Nevertheless, for higher water tariffs, all agricultural policy scenarios would produce a drop in this indicator. The lowest decreases would thus result from the Provincial En-
terprise scenario, ranging from 5% for a “medium” price to 13% for a “FCR” price.
Seasonality (SEASONA). Water pricing in the status quo scenario has only slight effects on sea-sonal demand for agricultural labour. Thus, we observe only small decreases in this indicator following successive tariff increases, all of them lower than 4%. It should thus be noted that this economic instrument has little impact on annual distribution of labour demand.
The tables in the Appendix show the influence of water pricing under different agricultural policy scenarios. In fact, the status quo scenario is the least favourable one for the study area at any price of water (“subsidized”, “medium” or “FCR”). Consequently, in this scenario water pric-ing would produce the fewest decreases in seasonality. On the other hand, it can be seen that Local Stewardship would be the scenario where “subsidized” and “FCR” prices generate the great-est drops in this indicator, at close to 16%. If “medium” pricing were to be applied, the World
Agrarian Markets scenario would produce the largest decrease in seasonality (17%). This sug-gests that a positive change in this indicator could be achieved more efficiently by means of agricultural policy rather than via water pricing.
4.3. Environmental indicators
Genetic diversity (DIVERS). Water pricing would bring about scarcely any changes in the num-ber of crops included in farmers’ crop-mixes. As can be seen in the status quo scenario, this economic instrument would not have an effect on the biodiversity of the study area. Neverthe-less, the application of different agricultural policy scenarios would modify this indicator sig-nificantly. Tables A2-A5 show the estimated changes in the number of crops within the Duero basin in different agricultural policy scenarios if water tariffs were implemented. On the basis of these results, we might note that the highest impacts would result from both Provincial Enter-
prise and Local Stewardship scenarios, which have a larger number of crops than the other scenar-ios.
These results thus underline the fact that the number of crops in the area studied is more dependent on agricultural policy scenarios than on the price of water.
Modelling Agricultural Policies: State of the Art and New Challenges
366
Soil cover (SOILCOV). As far as soil cover is concerned, if only the implementation of irrigation water pricing is considered (status quo scenario), increasing water tariffs would produce slight drops in this indicator. These decreases could range from 1% for the “subsidized” price to 8% for the “FCR” price. The drop in soil cover would have negative environmental consequences such as an increased likelihood of soil erosion. The changes experienced by SOILCOV be-cause of water pricing are due to the cessation of water-intensive activities, with longer life cy-cle (more days on the land) such as maize or sugar-beet.
If the other agricultural policy scenarios outlined here are also considered, we may note that Agricultural World Markets would be the most favourable one. The implementation of “sub-
sidized” or “medium” prices would thus produce slight increments in this indicator (6% and 0.3% respectively), whereas for the “FCR” price we can observe a slight decrease (4%). On the other hand, it needs to be pointed out that water pricing would produce large decreases in soil cover in the Local Stewardship scenario, with drops that range from 12% for the “subsidized” price to 18% for the “FCR” price.
Thus, if avoiding soil erosion is a political objective, both policies (agricultural policy and water pricing) should be implemented in order to obtain efficient results.
Water use (WATER). Analysing the impact of water pricing in the status quo scenario, we can see how farmers would modify their mix of activities when faced with increments in tariffs that have the aim of reducing water consumption. In this particular instance, Table A1 shows the influence of implementing water tariffs on agricultural water consumption in our case study area for the current agricultural policy scenario. In fact, “subsidized” and “medium” prices would generate decreases of 10% and 27% in current water consumption respectively. On the other hand, the implementation of an “FCR” price would produce important savings, reducing the current consumption of irrigation water by 52 percent.
This pattern of water consumption as a result of water pricing is due to the cessation of activities with higher water requirements (maize, sugar-beet and alfalfa) and to the increase in the area devoted to rain-fed activities (winter cereals). However it is worth mentioning that, unlike what was expected, water pricing scarcely favours the adoption of irrigation technology. This circumstance can be justified by the low profitability of irrigation activities and the risk aversion behaviour of farmers. Thus, willingness to invest in irrigation technologies (sprinkler) is really limited in the study area.
As Tables A2-A5 show, irrigation water consumption would also vary among the different agricultural policy scenarios. This way, the greatest savings would be obtained in the Local Stew-
ardship scenario for both “subsidized” and “medium” prices (24% and 37% respectively). If the “FCR” tariff were implemented the highest savings in water consumption would be located in Agricultural Water Markets (56%). On the other hand, the Provincial Enterprise scenario would produce the least savings in consumption for available water tariffs. These savings range from 3% for the “subsidized” price to 26% for the “FCR” price.
These results enable us to affirm that water pricing and agricultural policies are equally im-portant factors in reducing the consumption of irrigation water.
5. Modelling Multifunctional and Environmental Issue
367
Nitrogen balance (BALNIT). If the status quo scenario is analysed, it can be seen that the intro-duction of irrigation water pricing will also affect nitrogen discharges into the environment. This is due to the substitution of fertilizer-intensive activities (maize or sugar-beet) by others with lower nitrogen requirements (rain-fed activities, such as winter cereals or alfalfa).This de-crease would thus vary between 13% for the “subsidized” price and 59% for the “FCR” price. The conclusion derived from these results is that irrigation water pricing would be an effective instrument for diminishing non-point source pollution produced by the agricultural sector.
Considering all the agricultural policy scenarios (Tables A2-A5), it is worth emphasizing that the Local Stewardship scenario would generate the highest drops in nitrogen balance for all water tariffs (between 78% for the “subsidized” price and 87% for the “FCR” price). On the other hand, the status quo scenario would register the lowest decreases in nitrogen balance, regardless of the water price implemented.
These results demonstrate that water pricing and agricultural policies are both equally im-portant in determining nitrogen balance, and thus reducing the risk of non-point source pollu-tion produced by the consumption of nitrogen fertilizers in the agricultural sector.
Energy balance (BALENE). For the current agricultural policy scenario, we can see that a rise in the price of water would lead to a decrease in energy balance. This drop could thus be greater than 34% for the “FCR” price. This is also due to the changes in farmers’ mix of activities; in such a way that rain-fed activities, which are less energy-efficient, increase their importance vis-à-vis irrigated crops. Water pricing would thus have a negative environmental impact, since it would decrease CO2 (greenhouse-gas) capture by the agricultural sector.
The results of all the policy scenarios and water prices produced the energy balance are shown in the tables in the Appendix. We can see that Local Stewardship generates the greatest decreases in energy balance for “subsidized” and “medium” prices (16% and 25% respectively) although for the “FCR” price, the highest drop in this indicator would be placed in Agricultural
World Markets (41%). On the other hand, Provincial Enterprise would result in the lowest reduc-tions in energy balance, regardless of the water tariff. These decreases would vary between 3% for the “subsidized” price and 18% for the “FCR” price.
These results imply that in the Duero basin water pricing and agricultural policies are of equal importance in encouraging a shift to more energy-efficient crops.
Pesticide risk (PESTRISK). In the status quo scenario we can see that chemical toxicity generated by the agricultural sector would also diminish when the price of water increases. As in the other indicator, this is due to the changes in the farmers’ mix of activities in the direction of activities with lower requirements for water and lower individual toxicity risk, such as the rain-fed ones. As Table A1 shows, this drop would vary between 4% for the “subsidized” price and 17% for the “FCR” price in a policy scenario featured by the current CAP. This way, water pricing could be regarded as an effective instrument for reducing non-point source pollution produced by pesticide consumption by irrigated agriculture.
The tables also show that the Local Stewardship scenario would generate the highest drops in pesticide risk, regardless of water tariffs. These decreases vary among 68% for the “subsi-
dized” price and 80% for the “FCR” price. On the other hand, the status quo would be the most
Modelling Agricultural Policies: State of the Art and New Challenges
368
adverse scenario for this indicator, as it would produce the least decrease in pesticide risk due to water pricing (between 7% for the “subsidized” price and 51% for the “FCR” price).
In any case, in spite of the influence of agricultural policies, it appears that water pricing would be the most important policy instrument capable of reducing the risk of pesticide use in the agriculture of the Duero basin.
5. Concluding remarks
The conclusions derived from this paper can be summarized in terms of methodological and empirical issues.
Within the first set of issues, what is remarkable is the wide variety of management criteria that use to plan their crop-mixes. This fact is what makes it necessary to analyze these produc-ers’ decision-making processes under the MCDM paradigm. In this particular case, we chose Multi-attribute Utility Theory as our MCDM programming modelling technique. This method-ology can be regarded as a valuable technique for simulating the behaviour of farmers when they are faced with various policy scenarios (e.g. water and agricultural policies). In the second place, we wish to point out the complexity of public decision-making. In fact, policy decision-making is a process based not only on achieving economic efficiency, but also on other eco-nomic, social and environmental topics of importance to society as a whole and to policy mak-ers. Consequently, like farmers’ private decision-making processes, we must assume that the selection of policy instruments is also a multicriteria process. In view of this, we have included a set of indicators that help us to analyze the impacts of both policies in irrigated agriculture in our model building.
The practical application of the methodology proposed was implemented in the Duero ba-sin, which is a typical example of the continental agriculture of central Spain where low value-added crops that are highly dependent on CAP subsidies are dominant. It should thus be em-phasized that the results obtained in this study can be only extrapolated to other similar agri-cultural systems, such as the irrigated areas of the Tajo or Guadiana basins in Spain.
According to this practical application, it is worth pointing out that CAP is a more relevant policy than water pricing to achieve the objectives of policy-makers in this irrigated area. In fact, in the study area, by an adequate implementation of the agricultural policy, most of the above-mentioned positive impacts dealing with water pricing (decrease in water consumption, increase in public-sector revenues and reduction in pollution generated by fertilizers and pesti-cides) could be obtained in an efficient manner. It is also interesting to remark that appropriate application of this policy would minimize the negative impacts generated by implementing wa-ter pricing, such as the decrease in farmers’ income and demand for labour, the increased risk of soil erosion and reduction in the energy balance in agriculture. In sum, we conclude that both policies should be closely coordinated, in order to satisfy policy objectives.
Considering this research as a useful tool for policy advice, it can be concluded that the re-sults obtained in this study confirm the usefulness of a low water tariff (0.02-0.03 €/m3) that favours the implementation of the WFD environmental objectives (efficient water allocation
5. Modelling Multifunctional and Environmental Issue
369
and improvement of water ecosystems). In spite of the negative impacts caused by water pric-ing, therefore, a low volumetric water pricing might still be regarded as necessary in order to make farmers conscious of the actual value of water to society, and the importance of using it properly. Nevertheless, water pricing should be coordinated with a proper CAP with the aim of avoiding severe negative impacts on irrigated farms and guaranteeing the survival of rural areas (by minimising falls in farmers’ income and the demand for agricultural labour).
Acknowledgments
This research was co-financed by the European Commission (research project WADI, EVK1-CT-200-0057) and the Spanish Comisión Interministerial de Ciencia y Tecnología (research project MULTIAGRO (AGL2003-07446-C03-01).
Reference s
Amador F., Sumpsi J.M. and Romero C. (1998): “A non-interactive methodology to assess
farmers’ utility functions: An application to large farms in Andalusia, Spain”, European Review of Agricultural Economics, 25 (1): 95-109.
Bazzani G.M., Viaggi D., Berbel J., López M.J. and Gutiérrez C. (2004): “A methodology for the analysis of irrigated farming in Europe”, in Berbel J. and Gutiérrez C. (eds.): The Sustainability of European Irrigated Agriculture under Water Framework Directive and Agenda 2000, Brussels, Commission of the European Communities, forthcoming, http://www.uco.es/grupos/wadi.
Berbel J. and Rodríguez A. (1998): “An MCDM approach to production analysis: An appli-cation to irrigated farms in Southern Spain”, European Journal of Operational Research, 107 (1): 108-118.
Bergevoet R.H.M., Ondersteijn C.J.M., Saatkamp H.W., Van Woerkum C.M.J. and Huirne R.B.M. (2004): “Entrepreneurial behaviour of Dutch dairy farmers under a milk quota system: goals, objectives and attitudes”, Agricultural Systems, 80 (1): 1-21.
Berkhout F., Eames M. and Skea J. (1998): Environmental Futures Scoping Study, Brighton, Fi-nal Report, Science and Technology Policy Research Unit, http://www.foresight.gov.uk/
Costa F.P. and Rehman T. (1999): “Exploring the link between farmers’ objectives and the phenomenon of pasture degradation in the beef production systems of Central Brazil”, Agricultural Systems, 61 (1): 135-146.
Day R.H. (1963): “On aggregating linear programming models of production”, Journal of Farm Economics, 45 (4): 797-813.
Modelling Agricultural Policies: State of the Art and New Challenges
370
DTI (1999): Environmental futures, PB 4475, Department of Trade and Industry, http://www.foresight.gov.uk/.
DTI (2002): Foresight futures 2020: revised scenarios and guidance, Department of Trade and In-dustry, UK.
Escartín C.M. and Santafé J.M. (2000): “Application of the Cost Recovery Principle in Spain: Policies and Impacts”, Sintra Seminar “Pricing Water: Economics, Environment and Society”, European Commission DGXI and Instituto da Água, Sintra (Portugal).
Gómez-Limón J.A. and Riesgo L. (2004): “Irrigation water pricing: Differential impacts on irrigated farms”, Agricultural Economics, 31 (1): 47-66.
Gómez-Limón J.A., Riesgo L. and Arriaza M. (2004): “Multi-Criteria analysis of input use in agriculture, Journal of Agricultural Economics, 55 (3): 381-398.
Gómez-Limón J.A., Arriaza M. and Riesgo L. (2003): “A MCDM analysis of agricultural risk aversion”, European Journal of Operational Research, 151 (3): 569-585.
Hardaker J.B., Huirne R.B.M. and Anderson J.R. (1997): Coping with Risk in Agriculture, CAB International, Oxford (UK).
Hazell P.B.R. and Norton R.D. (1986): Mathematical programming for economic analysis in agricul-ture, MacMillan Publishing Company, New York.
Herath H.M.G. (1981): “An empirical evaluation of multiatribute utility theory in peasant agriculture”, Oxford Agrarian Studies, 10 (2): 240-254.
Keeney R.L. and Raiffa H. (1976): Decisions with multiple objectives: preferences and value trade-offs, John Wiley & Sons, New York.
Ministerio de Medio Ambiente (1998), Libro blanco del agua, MIMAM, Madrid. Morris J., Vasileiou K. and Berbel J. (2004): “WADI scenario definition”, in Berbel J. and
Gutiérrez C. (eds.): The Sustainability of European Irrigated Agriculture under Water Framework Directive and Agenda 2000, Brussels, Commission of the European Communities, forth-coming, http://www.uco.es/grupos/wadi.
OECD (2001): Environmental indicators for agriculture. Volume 3 - Methods and Results, OECD, Paris.
Perkin P. and Rehman T. (1994): “Farmers’ objectives and their interactions with business and life styles: evidence from Berkshire, England”, in Dent J.B. and McGregor M.J. (eds.): Rural and farming systems analysis: a European perspective, CAB International, Walling-ford: 193-212.
Riesgo L. (2004): Sostenibilidad del regadío en la cuenca del Duero ante los retos de la DMA y la re-forma de la PAC, unpublished PhD, Universidad de Oviedo.
Solano C., León H., Pérez E. and Herrero M. (2001): “Characterising objective profiles of Costa Rican dairy farmers”, Agricultural Systems, 67 (1): 153-179.
Sumpsi J.M., Amador F. and Romero C. (1997): “On farmers’ objectives: a multi-criteria approach”, European Journal of Operational Research, 96 (1): 64-71.
Willock J., Deary I.J., Edwards-Jones G., McGregor M.J., Sutherland A., Dent J.B., Morgan O. and Grieve R. (1999): “The role of attitudes and objectives in farmer decision mak-ing: business and environmentally-oriented behaviour in Scotland”, Journal of Agricultural Economics, 50 (2): 286-303.
5. Modelling Multifunctional and Environmental Issue
371
Appendix
Table A1. Changes in indicators in the status quo scenario
INDICATORS Zero price
0.00 €/m3
“Subsidized” price 0.02 €/m3
“Medium” price 0.04 €/m3
“FCR” price 0.06 €/m3
TGM (Current situation = 701 €/ha)
--- -148.7
(-21.2%) -286.9
(-41.0%) -380.3
(-54.3%) SUBSID (Current situation = 260 €/ha)
--- -6.0
(-2.2%) -4.5
(-1.8%) -24.1
(-9.3%) PUBCOL (Current situation = 0 €/ha)
--- 121.9 196.6 193.5
TL (Current sit=1.53 pers.day/ha)
--- -0.12
(-7.7%) -0.34
(-22.5%) -0.63
(-41.0%) SEASONA (Current situation = 71%)
--- -0.4% 0.6% -3.9%
DIVERS (Current situation = 7 crops)
--- 0
(0.0%) 0
(0.0%) 0
(0.0%) SOILCOV (Current situation = 66%)
--- -0.9% -4.4% -7.7%
WATER (Current sit. = 6,759 m3/ha)
--- -655
(-9.9%) -1.844
(-27.3%) -3.534
(-52.3%) BALNIT (Current sit. = 138 kg N/ha)
--- -18.6
(-13.4%) -54.8
(-39.6%) -81.3
(-58.8%) BALENE (Current sit. = 15.106 kcal/ha)
--- -0.87
(-5.9%) -2.77
(-18.6%) -5.13
(-34.4%) PESTRISK (Current sit. = 21.103 PR/ha)
--- -1.40
(-6.8%) -4.60
(-22.4%) -10.42
(-50.7%)
Table A2. Changes in indicators in the “Agricultural World Markets” scenario
INDICATORS Zero price 0.00 €/m3
“Subsidized” price
0.02 €/m3
“Medium” price
0.04 €/m3
“FCR” price 0.06 €/m3
TGM (Current situation = 701 €/ha)
-255.0 (-36.4%)
-417.4 (-59.6%)
-559.0 (-79.8%)
-630.5 (-90.0%)
SUBSID (Current situation = 260 €/ha)
-259.7 (-100.0%)
-259.7 (-100.0%)
-259.7 (-100.0%)
-259.7 (-100.0%)
Modelling Agricultural Policies: State of the Art and New Challenges
372
PUBCOL (Current situation = 0 €/ha)
0.0 130.2 209.6 178.8
TL (Current sit=1.53 pers.day/ha)
0.26 (17.0%)
0.13 (8.2%)
-0.10 (-6.8%)
-0.52 (-34.1%)
SEASONA (Current situation = 71%)
-14.9% -15.7% -17.4% -14.2%
DIVERS (Current situation = 7 crops)
0 (0.0%)
1 (14.3%)
0 (0.0%)
-1 (-14.3%)
SOILCOV (Current situation = 66%)
7.3% 5.7% 0.3% -3.8%
WATER (Current sit. = 6,759 m3/ha)
503 (7.4%)
-250 (-3.7%)
-1.519 (-22.5%)
-3.778 (-55.9%)
BALNIT (Current sit. = 138 kg N/ha)
-37.5 (-27.1%)
-46.2 (-33.4%)
-61.3 (-44.3%)
-87.8 (-63.4%)
BALENE (Current sit. = 15.106 kcal/ha)
-0.27 (-1.8%)
-1.40 (-9.4%)
-3.50 (-23.5%)
-6.31 (-42.4%)
PESTRISK (Current sit. = 21.103 PR/ha)
-5.17 (-25.2%)
-7.69 (-37.4%)
-11.16 (-54.3%)
-14.70 (-71.5%)
Table A3. Changes in indicators in the “Global Sustainable Agriculture” scenario
INDICATORS Zero price 0.00 €/m3
“Subsidized” price 0.02 €/m3
“Medium” price 0.04 €/m3
“FCR” price 0.06 €/m3
TGM (Current situation = 701 €/ha)
-11.4 (-1.6%)
-168.6 (-24.1%)
-311.1 (-44.4%)
-416.0 (-59.4%)
SUBSID (Current situation = 260 €/ha)
-42.4 (-16.3%)
-39.3 (-15.1%)
-35.0 (-13.5%)
-36.3 (-14.0%)
PUBCOL (Current situation = 0 €/ha)
0.0 121.4 201.5 260.3
TL (Current sit=1.53 pers.day/ha)
0.20 (12.8%)
0.04 (2.5%)
-0.15 (-9.9%)
-0.28 (-18.3%)
SEASONA (Current situation = 71%)
-11.9% -12.5% -10.3% -9.8%
DIVERS (Current situation = 7 crops)
1 (14.3%)
1 (14.3%)
1 (14.3%)
1 (14.3%)
SOILCOV (Current situation = 66%)
-2.8% -4.5% -6.8% -9.4%
WATER (Current sit. = 6,759 m3/ha)
116 (1.7%)
-689 (-10.2%)
-1.722 (-25.5%)
-2.421 (-35.8%)
5. Modelling Multifunctional and Environmental Issue
373
BALNIT (Current sit. = 138 kg N/ha)
-88.4 (-63.8%)
-91.7 (-66.2%)
-98.5 (-71.1%)
-103.8 (-75.0%)
BALENE (Current sit. = 15.106 kcal/ha)
-0.20 (-1.3%)
-1.56 (-10.5%)
-3.43 (-23.1%)
-4.49 (-30.1%)
PESTRISK (Current sit. = 21.103 PR/ha)
-10.11 (-49.2%)
-11.00 (-53.5%)
-13.65 (-66.4%)
-14.59 (-71.0%)
Table A4. Changes in indicators in the “Provincial Enterprise” scenario
INDICATORS Zero price 0.00 €/m3
“Subsidized” price 0.02 €/m3
“Medium” price 0.04 €/m3
“FCR” price 0.06 €/m3
TGM (Current situation = 701 €/ha)
123.8 (18.0%)
-26.2 (-3.7%)
-165.1 (-23.6%)
-283.8 (-40.5%)
SUBSID (Current situation = 260 €/ha)
-32.8 (-12.6%)
-33.1 (-12.7%)
-31.0 (-11.9%)
-31.0 (-11.9%)
PUBCOL (Current situation = 0 €/ha)
0.0 131.7 236.3 301.8
TL (Current sit=1.53 pers.day/ha)
0.08 (5.1%)
0.03 (1.7%)
-0.08 (-5.1%)
-0.20 (-13.1%)
SEASONA (Current situation = 71%)
-15.6% -16.0% -16.2% -16.1%
DIVERS (Current situation = 7 crops)
2 (28.6%)
2 (28.6%)
2 (28.6%)
2 (28.6%)
SOILCOV (Current situation = 66%)
-2.4% -3.6% -5.0% -7.1%
WATER (Current sit. = 6,759 m3/ha)
91 (1.4%)
-175 (-2.6%)
-851 (-12.6%)
-1.728 (-25.6%)
BALNIT (Current sit. = 138 kg N/ha)
-102.3 (-73.9%)
-103.6 (-74.8%)
-105.6 (-76.2%)
-109.6 (-79.2%)
BALENE (Current sit. = 15.106 kcal/ha)
0.08 (0.5%)
-0.36 (-2.4%)
-1.37 (-9.2%)
-2.56 (-17.2%)
PESTRISK (Current sit. = 21.103 PR/ha)
-8.92 (-43.4%)
-9.16 (-44.6%)
-9.65 (-46.9%)
-10.64 (-51.8%)
Modelling Agricultural Policies: State of the Art and New Challenges
374
Table A5. Changes in indicator in the “Local Stewardship” scenario