Multi-elemental speciation analysis of barley genotypes differing in tolerance to cadmium toxicity using SEC-ICP-MS and ESI-TOF-MS Daniel P. Persson, a Thomas H. Hansen, ab Peter E. Holm, b Jan K. Schjoerring, a Hans Christian B. Hansen, b John Nielsen, b Ismail Cakmak c and Søren Husted* a Received 19th June 2006, Accepted 22nd August 2006 First published as an Advance Article on the web 5th September 2006 DOI: 10.1039/b608701a Plants respond to Cd exposure by synthesizing heavy-metal-binding oligopeptides, called phytochelatins (PCs). These peptides reduce the activity of Cd 2+ ions in the plant tissues by forming Cd chelates. The main objective of the present work was to develop an analytical technique, which allowed identification of the most prominent Cd species in plant tissue by SEC-ICP-MS and ESI-TOF-MS. An integrated part of the method development was to test the hypothesis that differential Cd tolerance between two barley genotypes was linked to differences in Cd speciation. Only one fraction of Cd species, ranging from 700–1800 Da, was detected in the shoots of both genotypes. In the roots, two additional fractions ranging from 2900–4600 and 6700–15 000 Da were found. The Cd-rich SEC fractions were heart-cut, de-salted and de- metallized using reversed-phase chromatography (RPC), followed by ESI-MS-TOF to identify the ligands. Three different families of PCs, viz.(gGlu-Cys) n -Gly (PC n ), (gGlu-Cys) n -Ser (iso-PC n ) and Cys-(gGlu-Cys) n -Gly (des-gGlu-PC n ), the last lacking the N-terminal amino acid, were identified. The PCs induced by Cd toxicity also bound several essential trace elements in plants, including Zn, Cu, and Ni, whereas no Mn species were detected. Zn, Cu and Ni-species were distributed between the 700–1800 Da and 6700–15 000 Da fractions, whereas only Cd species were found in the 2900–4600 Da fraction dominated by PC 3 ligands. Although the total tissue concentration of Cd was similar for the two species, the tolerant barley genotype synthesized significantly more CdPC 3 species with a high Cd specificity than the intolerant genotype, clearly indicating a correlation between Cd tolerance and the Cd–PC speciation. Introduction Cadmium (Cd) is a heavy metal, which is present in almost all terrestrial environments. It is highly toxic to almost all organ- isms, including humans, even at very low concentrations. 1 It is estimated that the dietary intake accounts for up to 50% of the tolerable weekly intake of Cd in Europe, of which plant products are the main Cd source. 1 Higher plants, algae, bacteria, yeast and some fungi, are able to induce the synthesis of sulfur-rich compounds in response to exposure to toxic elements like Cd, As, and Pb, but also in response to excess of essential trace elements, such as Zn, Cu and Se. The synthesis of the detoxifying oligopep- tides, known as phytochelatins (PCs), is considered one of the most abundant mechanisms for Cd detoxification among higher plants. 2–4 A Cd 2+ ion bound to the thiol group of a PC molecule becomes approximately 1000 times less toxic to most plant enzymes than ‘‘free’’ Cd 2+ aqua ions. 4 PCs are a group of short, non-protein, metal-binding pep- tides, with the general formula (g-Glu-Cys) n -X, where n = 2–11 and X can be glycine, 2 b-alanine, 2 serine, 5 glutamate, 6 glutamine 7 or missing. 8 The N-terminal linked g-Glu can also be missing (des-g-Glu-PCs). 9 Thus, seven families of PCs exist to date, which vary among plant species. 10,11 All of these families function analogically by chelating metals, forming oligopeptide based coordination complexes. 12 The synthesis of PCs is controlled by the enzyme PC-synthase (g-glutamyl-cysteine-dipeptidyl-transpeptidase), which is constitutively present in the cytoplasm of plants and activated by elevated metal ion concentrations. 2 The precursor is reduced glutathione (GSH), which undergoes a transpeptidal reaction catalyzed by PC synthase, resulting in PC-chains of various lengths. Cd is regarded as the most potent inducer of PC synthesis in higher plants, 4 and biosynth- esis of PCs typically occurs within minutes after Cd-exposure, as it is independent of de novo protein synthesis. 13 PC synthase is deactivated when all Cd ions are bound to PCs. 3 The low molecular weight Cd–PC species are transported across the tonoplast into the vacuole. This transport is mediated by an ATP-binding cassette-type transport protein, but free Cd 2+ ions are also pumped into the vacuole by a Cd 2+ /H + antiporter protein. Together with additional g-Glu-Cys-peptides and free sulfide, Cd–PC complexes with a higher molecular weight are formed. 3 The molecular mass of Cd–PC complexes a Plant and Soil Science Laboratory, Department of Agricultural Sciences, Thorvaldsensvej 40, 1871 Frederiksberg, Denmark. E-mail: [email protected]; Fax: +45 35283460; Tel: +45 35283498 b Department of Natural Sciences, Thorvaldsensvej 40, 1871 Frederiksberg, Denmark c Faculty of Engineering and Natural Sciences, Sabanci University, Tuzla-Istanbul, Turkey 996 | J. Anal. At. Spectrom., 2006, 21, 996–1005 This journal is c The Royal Society of Chemistry 2006 PAPER www.rsc.org/jaas | Journal of Analytical Atomic Spectrometry
Transcript
Multi-elemental speciation analysis of barley genotypes differing in
tolerance to cadmium toxicity using SEC-ICP-MS and ESI-TOF-MS
Daniel P. Persson,a Thomas H. Hansen,ab Peter E. Holm,b Jan K. Schjoerring,a
Hans Christian B. Hansen,bJohn Nielsen,
bIsmail Cakmak
cand Søren Husted*
a
Received 19th June 2006, Accepted 22nd August 2006
First published as an Advance Article on the web 5th September 2006
DOI: 10.1039/b608701a
Plants respond to Cd exposure by synthesizing heavy-metal-binding oligopeptides, called
phytochelatins (PCs). These peptides reduce the activity of Cd2+ ions in the plant tissues by
forming Cd chelates. The main objective of the present work was to develop an analytical
technique, which allowed identification of the most prominent Cd species in plant tissue by
SEC-ICP-MS and ESI-TOF-MS. An integrated part of the method development was to test the
hypothesis that differential Cd tolerance between two barley genotypes was linked to differences
in Cd speciation. Only one fraction of Cd species, ranging from 700–1800 Da, was detected in the
shoots of both genotypes. In the roots, two additional fractions ranging from 2900–4600 and
6700–15 000 Da were found. The Cd-rich SEC fractions were heart-cut, de-salted and de-
metallized using reversed-phase chromatography (RPC), followed by ESI-MS-TOF to identify the
ligands. Three different families of PCs, viz. (gGlu-Cys)n-Gly (PCn), (gGlu-Cys)n-Ser (iso-PCn) and
Cys-(gGlu-Cys)n-Gly (des-gGlu-PCn), the last lacking the N-terminal amino acid, were identified.
The PCs induced by Cd toxicity also bound several essential trace elements in plants, including
Zn, Cu, and Ni, whereas no Mn species were detected. Zn, Cu and Ni-species were distributed
between the 700–1800 Da and 6700–15 000 Da fractions, whereas only Cd species were found in
the 2900–4600 Da fraction dominated by PC3 ligands. Although the total tissue concentration of
Cd was similar for the two species, the tolerant barley genotype synthesized significantly more
CdPC3 species with a high Cd specificity than the intolerant genotype, clearly indicating a
correlation between Cd tolerance and the Cd–PC speciation.
Introduction
Cadmium (Cd) is a heavy metal, which is present in almost all
terrestrial environments. It is highly toxic to almost all organ-
isms, including humans, even at very low concentrations.1 It is
estimated that the dietary intake accounts for up to 50% of the
tolerable weekly intake of Cd in Europe, of which plant
products are the main Cd source.1
Higher plants, algae, bacteria, yeast and some fungi, are
able to induce the synthesis of sulfur-rich compounds in
response to exposure to toxic elements like Cd, As, and Pb,
but also in response to excess of essential trace elements, such
as Zn, Cu and Se. The synthesis of the detoxifying oligopep-
tides, known as phytochelatins (PCs), is considered one of the
most abundant mechanisms for Cd detoxification among
higher plants.2–4 A Cd2+ ion bound to the thiol group of a
PC molecule becomes approximately 1000 times less toxic to
most plant enzymes than ‘‘free’’ Cd2+ aqua ions.4
PCs are a group of short, non-protein, metal-binding pep-
tides, with the general formula (g-Glu-Cys)n-X, where n =
2–11 and X can be glycine,2 b-alanine,2 serine,5 glutamate,6
glutamine7 or missing.8 The N-terminal linked g-Glu can also
be missing (des-g-Glu-PCs).9 Thus, seven families of PCs exist
to date, which vary among plant species.10,11 All of these
families function analogically by chelating metals, forming
already after 24 hours. These symptoms were initially whitish
areas in the middle of the older leaves, which evolved to
necrotic spots and spread along the ribs to the leaf tip (Fig. 1).
Cd in plant tissue
No significant difference was found in the shoot tissue con-
centrations of Cd between the genotypes (Table 1) despite the
obvious difference in visual appearance (Fig. 1). In both
genotypes, only approximately 3–4% of the absorbed Cd
was translocated to the shoots. This shows that most of the
Cd was prevented from reaching the shoot, where biochemical
processes such as photosynthesis are highly sensitive to Cd.
The observed difference in Cd tolerance between the two
genotypes could thus not be explained by differences in uptake
or translocation.
Extraction efficiencies of elements
Relative to the other trace elements, plants were exposed to
high Cd concentrations in order to specifically induce Cd-
toxicity. Removal of exchangeable Cd2+ in the root cell walls
was found to be important in order to reduce the risk of ligand
exchange during extraction and analysis. Thus, roots were
carefully washed several times with 5 mM CaCl2, but still it
was evident that large amounts of Cd were trapped, relative to
the other trace elements, apparently in the non-exchangeable
ion pool of the root tissue (Table 1).
In the roots approximately 20% of total tissue Cd was
extractable to the LMW-fraction of both genotypes (Table
1), and in the shoots the corresponding values were 65% and
39% for Hamidiye and Tokak, respectively. Interestingly, only
a negligible amount of Cd occurred in the HMW-fraction after
ultra-filtration (o1% of Cd in the LMW), indicating that
most Cd species in the supernatant had a molecular size below
50 kDa.
Precision, recovery and polyatomic interferences
The Cd speciation was determined in the LMW fraction
extracted from shoots and roots. However, it was initially
impossible to reproduce the chromatography due to an ex-
cessive amount of free metal ions being retained on the SEC
column, leading to ligand exchange and destabilization of the
Table 1 The concentrations and extraction efficiencies of four elements (Mn, Cu, Zn and Cd) in the root and shoot tissues of two barley genotypesdiffering in Cd tolerance. The plants were exposed to 15 mMCdCl2 for 4 days before analysis. The concentrations were measured in total tissue andin the low molecular weight fraction (LMWo 50 kDa) of the tissue extract. Concentrations are given as mean values of 3 replicates and extractionefficiencies are listed as percentage of total tissue concentrations �SE
Elemental concentrations/mg g�1 tissue DM
Genotypes and tissue Element Total tissue LMW elemental species Extraction efficiency (%)
tins reconstituted with Cd in equimolar concentrations. (A) A sample
containing all isolated phytochelatins, (B) GSH and des-gGlu-PC2, (C)
PC2, (D) PC3 and (E) a mixture of PC4, PC5 and PC6. For comparison
of retention times, each chromatogram is displayed together with a
barley root sample (solid line).
Table 2 The retention times, mass ranges and fractional distribution in root and shoot samples, analyzed by SEC-ICP-MS. The distribution offractionated Cd-species is presented as mean percentages (�SE) of the whole LMW-fraction (o50 kDa), based on three replications
Distribution of fractionated Cd-species (% of LMW)
Root Shoot
Genotypes
SEC-fraction Retention time/s Mass range/Da Tolerant Intolerant Tolerant Intolerant
This journal is �c The Royal Society of Chemistry 2006 J. Anal. At. Spectrom., 2006, 21, 996–1005 | 1001
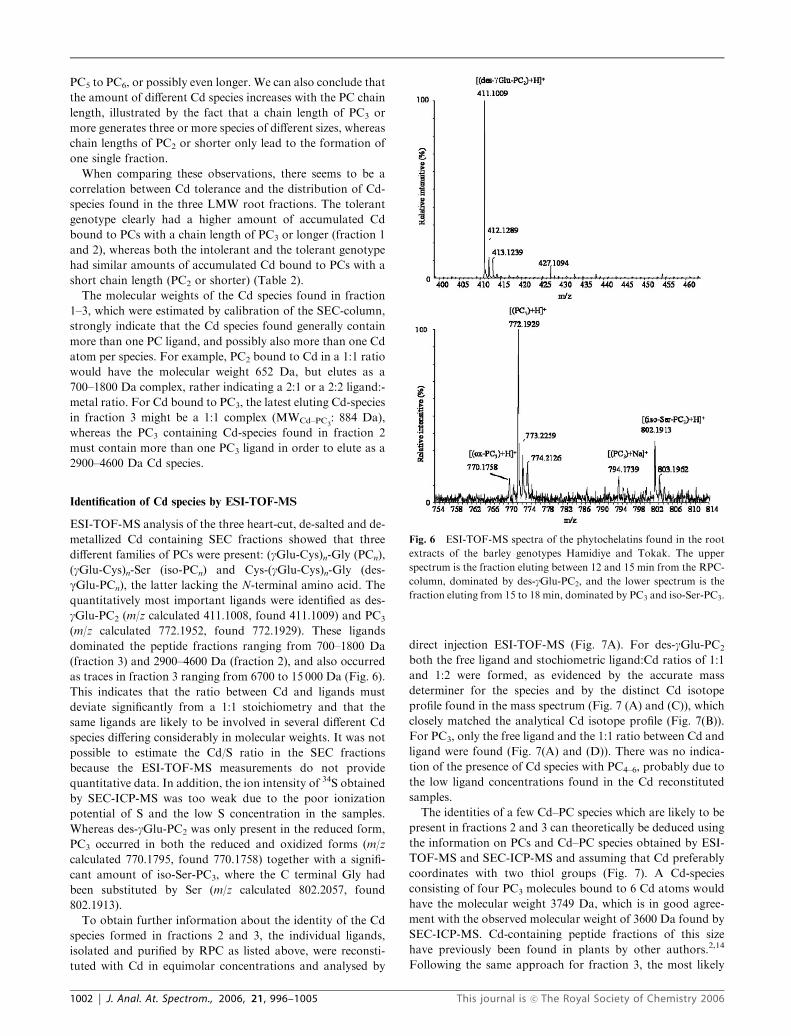
PC5 to PC6, or possibly even longer. We can also conclude that
the amount of different Cd species increases with the PC chain
length, illustrated by the fact that a chain length of PC3 or
more generates three or more species of different sizes, whereas
chain lengths of PC2 or shorter only lead to the formation of
one single fraction.
When comparing these observations, there seems to be a
correlation between Cd tolerance and the distribution of Cd-
species found in the three LMW root fractions. The tolerant
genotype clearly had a higher amount of accumulated Cd
bound to PCs with a chain length of PC3 or longer (fraction 1
and 2), whereas both the intolerant and the tolerant genotype
had similar amounts of accumulated Cd bound to PCs with a
short chain length (PC2 or shorter) (Table 2).
The molecular weights of the Cd species found in fraction
1–3, which were estimated by calibration of the SEC-column,
strongly indicate that the Cd species found generally contain
more than one PC ligand, and possibly also more than one Cd
atom per species. For example, PC2 bound to Cd in a 1:1 ratio
would have the molecular weight 652 Da, but elutes as a
700–1800 Da complex, rather indicating a 2:1 or a 2:2 ligand:-
metal ratio. For Cd bound to PC3, the latest eluting Cd-species
in fraction 3 might be a 1:1 complex (MWCd–PC3: 884 Da),
whereas the PC3 containing Cd-species found in fraction 2
must contain more than one PC3 ligand in order to elute as a
2900–4600 Da Cd species.
Identification of Cd species by ESI-TOF-MS
ESI-TOF-MS analysis of the three heart-cut, de-salted and de-
metallized Cd containing SEC fractions showed that three
different families of PCs were present: (gGlu-Cys)n-Gly (PCn),
(gGlu-Cys)n-Ser (iso-PCn) and Cys-(gGlu-Cys)n-Gly (des-
gGlu-PCn), the latter lacking the N-terminal amino acid. The
quantitatively most important ligands were identified as des-
gGlu-PC2 (m/z calculated 411.1008, found 411.1009) and PC3
(m/z calculated 772.1952, found 772.1929). These ligands
dominated the peptide fractions ranging from 700–1800 Da
(fraction 3) and 2900–4600 Da (fraction 2), and also occurred
as traces in fraction 3 ranging from 6700 to 15 000 Da (Fig. 6).
This indicates that the ratio between Cd and ligands must
deviate significantly from a 1:1 stoichiometry and that the
same ligands are likely to be involved in several different Cd
species differing considerably in molecular weights. It was not
possible to estimate the Cd/S ratio in the SEC fractions
because the ESI-TOF-MS measurements do not provide
quantitative data. In addition, the ion intensity of 34S obtained
by SEC-ICP-MS was too weak due to the poor ionization
potential of S and the low S concentration in the samples.
Whereas des-gGlu-PC2 was only present in the reduced form,
PC3 occurred in both the reduced and oxidized forms (m/z
calculated 770.1795, found 770.1758) together with a signifi-
cant amount of iso-Ser-PC3, where the C terminal Gly had
been substituted by Ser (m/z calculated 802.2057, found
802.1913).
To obtain further information about the identity of the Cd
species formed in fractions 2 and 3, the individual ligands,
isolated and purified by RPC as listed above, were reconsti-
tuted with Cd in equimolar concentrations and analysed by
direct injection ESI-TOF-MS (Fig. 7A). For des-gGlu-PC2
both the free ligand and stochiometric ligand:Cd ratios of 1:1
and 1:2 were formed, as evidenced by the accurate mass
determiner for the species and by the distinct Cd isotope
profile found in the mass spectrum (Fig. 7 (A) and (C)), which
closely matched the analytical Cd isotope profile (Fig. 7(B)).
For PC3, only the free ligand and the 1:1 ratio between Cd and
ligand were found (Fig. 7(A) and (D)). There was no indica-
tion of the presence of Cd species with PC4–6, probably due to
the low ligand concentrations found in the Cd reconstituted
samples.
The identities of a few Cd–PC species which are likely to be
present in fractions 2 and 3 can theoretically be deduced using
the information on PCs and Cd–PC species obtained by ESI-
TOF-MS and SEC-ICP-MS and assuming that Cd preferably
coordinates with two thiol groups (Fig. 7). A Cd-species
consisting of four PC3 molecules bound to 6 Cd atoms would
have the molecular weight 3749 Da, which is in good agree-
ment with the observed molecular weight of 3600 Da found by
SEC-ICP-MS. Cd-containing peptide fractions of this size
have previously been found in plants by other authors.2,14
Following the same approach for fraction 3, the most likely
Fig. 6 ESI-TOF-MS spectra of the phytochelatins found in the root
extracts of the barley genotypes Hamidiye and Tokak. The upper
spectrum is the fraction eluting between 12 and 15 min from the RPC-
column, dominated by des-gGlu-PC2, and the lower spectrum is the
fraction eluting from 15 to 18 min, dominated by PC3 and iso-Ser-PC3.
1002 | J. Anal. At. Spectrom., 2006, 21, 996–1005 This journal is �c The Royal Society of Chemistry 2006
Cd species would be either [Cd2(des-gGlu-PC2)2], [Cd3(des-gGlu-PC2)3] or a 1:1 Cd:PC3 complex, all combinations
lying within the 700–1800 Da range.
In fraction 2 both PC3 and des-gGlu-PC2 were observed,
which may indicate the presence of a Cd species consisting of
both PC3 and des-gGlu-PC2, rather than two separate, co-
eluting Cd-species, since des-gGlu-PC2 reconstituted with Cd
eluted only as fraction 3. Assuming that each Cd binds to two
thiol groups, and that unchelated thiol groups are highly
unlikely in the Cd rich environment of the root cytosol, only
three coordination complexes in the range 2900–4600 Da,
containing both PC3 and des-gGlu-PC2, are theoretically
possible. These are [Cd6(PC3)2(des-gGlu-PC2)3], (MW: 3437
Da), [Cd7(PC3)2(des-gGlu-PC2)4], (MW: 3958 Da) or
[Cd8(PC3)2(des-gGlu-PC2)5], (MW: 4479). However, the actual
existence of such complexes has yet to be confirmed. Thus,
fraction 2 in this work was possibly dominated by a 4:6
PC3:Cd complex, but with traces of the [Cdx(PC3)x(des-gGlu-PC2)x] species listed above.
In fraction 3, the ESI-TOF-MS mass-spectrum showed the
presence of both des-gGlu-PC2 and PC3, suggesting a possible
co-elution of [Cdx(des-gGlu-PC2)x] species and the simplest
form of [Cd(PC3)].
Earlier work by several groups has used ESI-MS to eluci-
date how PCs form coordination complexes with Cd. Yen
et al. (1999)18 showed that PC5 coordinates with up to three
Cd atoms and that the PC3–4 can coordinate 1–2 Cd atoms.
Burford et al. (2005)24 showed that also GSH can coordinate
with Cd, and in a later study by Navaza et al. (2006)20 it was
shown that GSH actually can coordinate with up to four Cd
atoms. This group also presented data suggesting the pres-
cence of a Cd–PC2 species in Brassica juncea, even though no
Cd isotope profile could be shown. The perfectly matching Cd
isotope profile obtained in the present work (Fig. 7 (B) and
(C)) confirms the existence of a Cd–PC2 complex. In addition,
the presence of several new 2:1 and 1:2 Cd-species is docu-
mented and it is shown that PC chains larger than PC2 may
form several Cd species, differing in size and Cd:PC ratio.
Comparison of the Cd speciation in barley genotypes with
differential Cd tolerance provide strong evidence that Cd
speciation is linked to Cd tolerance in planta with the biolo-
gically relevant Cd species generally being the largest possible
having PC chains with n 4 2.
Several minor peaks in the ESI-TOF-MS spectra were
observed which could not be assigned to any PCs (data not
shown). A similar observation was made by Vacchina et al.
(2000),19 who also analyzed Cd species in plant samples
fractionated by SEC. This is presumably related to the rela-
tively low resolution of SEC causing some co-elution of
oligopeptides other than PCs. Thus, it cannot be excluded
that ligands other than PCs might be of minor importance in
controlling the binding of Cd in plant tissue.
Multi-elemental speciation analysis by SEC-ICP-MS
The simultaneous measurements of the 66Zn, 60Ni, 63Cu,55Mn, 111Cd and 114Cd isotopes generated new information
on the speciation of elements other than Cd in root tissue
Fig. 7 ESI-TOF-MS spectra of synthesized Cd–phytochelatin complexes. (A) is the whole spectrum for a mixture of various phytochelatins
reconstituted with an equimolar Cd concentration, and (B) is the theoretical isotopic distribution for Cd. (C) and (D) are close-ups of the most
prominent Cd species [Cd(PC2) + H]+ and [Cd(PC3) + H]+.
This journal is �c The Royal Society of Chemistry 2006 J. Anal. At. Spectrom., 2006, 21, 996–1005 | 1003
exposed to Cd toxicity. Cd induced a 1000-fold increase in
tissue Cd concentration (Table 1) and was followed by a
marked increase in the synthesis of metal ion scavenging
peptides (Fig. 8). Apart from Cu only trace amounts of the
other elements were found in coordination complexes in the
control plants (Fig. 9). However, Cd exposure induced a
remarkable change in the speciation of the other trace ele-
ments due to the increased intercellular concentration of PCs
(Fig. 8). Approximately five times more Cu was bound to PCs
in the Cd treated samples compared with the control. The
chelation of Ni and Zn by PCs was also markedly increased
due to Cd exposure. No Mn speciation was observed in any of
the treatments, confirming the poor ability of Mn to form
thiol-based species. Thus, Cd-induced PC synthesis may affect
the bioavailability of essential trace elements in plants, which
subsequently may lead to secondary deficiencies of essential
elements adding to the cellular stress level imposed by Cd
toxicity.
The highest ion intensities of Zn, Cu and Ni were found in
fraction 3, where they co-eluted with Cd, suggesting that these
elements primarily formed coordination complexes with des-
gGlu-PC2, or a single PC3 ligand. In particular, the Cu/Cd
ratio was high despite the much lower bulk tissue concentra-
tion of Cu compared with Cd (Table 1). The Cd species in
fractions 1 and 2, containing many of the longer peptide
chains, had a higher affinity for Cd than for the other metals
under the conditions given. This indicates that PC3, being the
dominating ligand in fraction 2, had a high affinity for Cd.
Fraction 1, consisting of PCs with n 4 6 and possibly also
other non-phytochelatin ligands, was dominated by Cd and
Cu-species, whereas the ion intensity of Ni and Zn was not
significantly different from the background. This shows that
important elements such as Zn, Cu and Ni with essential
metabolic functions in plants form complexes with different
PCs and with highly variable affinities and that major differ-
ences even occur in the speciation of closely related elements
such as Cd and Zn. Chiefly, the PCs in fraction 2 with peptide
chain lengths 43, in this particular case dominated by PC3,
predominantly chelated Cd, whereas only trace amounts of Cu
were measured. The tolerant genotype synthesized signifi-
cantly more of these Cd-specific complexes (Table 2), clearly
indicating a correlation between Cd tolerance, PC chain length
and the amount of PCs formed. It is noteworthy that none of
these ligands occurred in shoot tissue where only Cd species,
ranging from 700–1800 Da, were identified (Fig. 4). The higher
affinity for Cd than for Cu of PCs with n 4 3 invalidates the
general assumption that Cu is always preferentially spe-
ciated.25 This seems only to be the case for PCs with n o 3.
Conclusions
This study confirms that plants respond to Cd toxicity by
synthesizing metal ion scavenging oligopeptide phytochelatins,
which reduce the Cd ion activity in tissue by forming Cd based
coordination complexes. Ligand exchange on the column used
for size exclusion chromatography (SEC) was a major chal-
lenge as several artefact Cd species were formed which could
not be efficiently removed by the hitherto reported methods.
An effective automatic injection program of repetitive EDTA
injections between samples was developed, which ensured a
rapid and efficient removal of non-chelated metal ions and
produced data with an excellent precision. The amount of
extractable Cd bound in coordination complexes was 70% in
the shoot and 34–50% in the root tissue, depending on the
genotype considered. No certified Cd–phytochelatin species
are commercially available, but re-injection of isolated Cd
species with known compositions showed recoveries of 86%
for Cd–GSH and nearly 100% for Cd species with ligands
larger than PC2. In the shoot tissue only one fraction of Cd
species was found, ranging from 700–1800 Da, whereas at least
two additional fractions ranging from 2900–4600 and 6700–
Fig. 8 SEC-ICP-MS chromatogram showing the binding of two Cd
isotopes, Zn, Cu, Ni and Mn to ligands in a Cd treated root sample.
For comparison with a non-Cd treated sample, see Fig. 9.
Fig. 9 SEC-ICP-MS chromatogram showing the negligible binding
of two Cd isotopes, Zn, Ni and Mn to ligands in a non Cd-treated root
sample. The only element which clearly speciated with ligands was Cu.
1004 | J. Anal. At. Spectrom., 2006, 21, 996–1005 This journal is �c The Royal Society of Chemistry 2006
15 000 Da were found in the root tissue. Three different
families of phytochelatins, viz. (gGlu-Cys)n-Gly (PCn), (gGlu-
Cys)n-Ser (iso-PCn) and compounds lacking the N-terminal
amino acid Cys-(gGlu-Cys)n-Gly (des-gGlu-PCn) were identi-
fied. The quantitatively most important ligands were des-gGlu-
PC2 (m/z calculated 411.1008, found 411.1009), and PC3 (m/z
calculated 772.1952, found 772.1929), dominating the peptide
fractions ranging from 700 to 1800 Da and 2900–4600 Da.
This indicates that the ratio between Cd and ligands deviated
significantly from a 1:1 stoichiometry and that the same
ligands were involved in several Cd-species differing consider-
ably in molecular weights. The phytochelatins induced by Cd
toxicity also bound several essential trace elements in plants,
including Zn, Cu, Ni, whereas no Mn species were found. Zn,
Cu and Ni-species were found in the 700–1800 Da and 6700–
15 000 Da fractions, whereas only Cd species were found in the
2900–4600 Da fraction dominated by PC3 ligands. In contrast,
the des-gGlu-PC2 ligands dominating the 700–1800 Da peptide
fraction chelated much more Cu than Cd, despite the fact that
the Cu tissue concentration was approximately 50 times lower
than those observed for Cd. Finally, we conclude that the
tolerant genotype synthesized significantly more Cd–PC3 and
that the PC3 ligand had a high Cd-specificity, clearly indicating
a correlation between Cd tolerance and the Cd speciation.
Acknowledgements
The phytochelatins purified from a Silene vulgaris cell culture
were kindly provided by Professor M. H. Zenk, University of
Munich, Germany. The study was supported by grant number
23-03-0138 from the Danish Research Council for Technology
and Production Sciences.
References
1 L. Nasreddine and D. Parent-Massin, Toxicol. Lett., 2002, 127, 29.
2 E. Grill, E.-L. Winnacker and M. H. Zenk, Proc. Natl Acad. Sci.U. S. A., 1987, 84, 439.
3 W. E. Rauser, Plant Physiol., 1995, 109, 1141.4 M. H. Zenk, Gene, 1996, 179, 21.5 S. Klapheck, B. Chrost, J. Starke and H. Zimmermann, Bot. Acta,1995, 105, 174.
6 P. Meuwly, P. Thibault and W. E. Rauser, FEBS Lett., 1995, 336,472.
7 H. Kubota, K. Sato, T. Yamada and T. Maitani, Phytochemistry,2000, 53, 239.
8 R. K. Mehra and D. R. Winge, Proc. Natl Acad. Sci. U. S. A.,1988, 85, 8815.
9 H. Chassaigne, V. Vaccina, T. Kutchan and M. H. Zenk, Phyto-chemistry, 2000, 56, 657.
10 S. Klapheck, W. Fliegner and I. Zimmer, Plant Physiol., 1994, 104,1325.
11 P. Meuwly, P. Thibault, A. L. Schwen and W. E. Rauser, Plant J.,1995, 7(3), 391.
12 K. Po"ec-Pawlak, R. Ruzik, K. Abramski, M. Ciurzynska and H.Gawronska, Anal. Chim. Acta, 2005, 540, 61.
13 C. S. Cobbett, Plant Physiol., 2000, 123, 825.14 V. Vaccina, K. Po"ec and J. Szpunar, J. Anal. At. Spectrom., 1999,
14, 1557.15 R. Kneer and M. H. Zenk, Phytochemistry, 1997, 44, 69.16 F. E. C. Sneller, L. M. van Heerwaarden, P. L. M. Koevoets, R.
Vooijs, H. Schat and J. A. C. Verkleij, J. Agric. Food Chem., 2000,48, 4014.
17 K. A. Francesconi and M. Sperling, Analyst, 2005, 130, 998.18 T.-Y. Yen, J. A. Villa and J. G. DeWitt, J. Mass Spectrom., 1999,
34, 930.19 V. Vacchina, R. yobinski, M. Oven and M. H. Zenk, J. Anal. At.
Spectrom., 2000, 15, 529.20 A. P. Navaza, M. Montes-Bayon, D. L. LeDuc, N. Terry and
A. Sanz-Medel, J. Mass Spectrom., 2006, 41, 323.21 S. Mounicou, V. Vacchina, J. Szpunar, M. Potin-Gautier and
R. yobinski, Analyst, 2001, 126, 624.22 J. Szpunar, Analyst, 2005, 130, 442.23 N. F. C. Visser, H. Lingeman and H. Irth, Anal. Bioanal. Chem.,
2005, 382, 535.24 N. Burford, M. D. Eelman and K. Groom, J. Inorg. Biochem.,
2005, 99, 1992.25 I. Leopold and D. Gunther, Fresenius’ J. Anal. Chem., 1997, 359,
364.26 M. Tiryakioglu, S. Eker, O. F. S. Husted and I. Camak, J. Trace
Elem. Med. Biol., in the press.
This journal is �c The Royal Society of Chemistry 2006 J. Anal. At. Spectrom., 2006, 21, 996–1005 | 1005