1 Multi Entity Perspective Transportation Infrastructure Investment Decision Making Sabyasachee Mishra a1 , Snehamay Khasnabis b , Subrat Swain c a National Center for Smart Growth Research and Education, University of Maryland, College Park, MD 20742, United States b Department of Civil and Environmental Engineering, Wayne State University, Detroit, MI 48202, United States c Department of Electrical, Computer and Energy Engineering, Arizona State University, Tempe, AZ 85287, United States Abstract Investment in new large transportation infrastructure is capital-intensive and irreversible in nature. Private sector participation in infrastructure investment has gained popularity in recent times because of scarcity of resources at the public sector, and because of the ability of the private sector to build, operate, maintain such facilities, and share future uncertainties. In such cases, there are multiple entities each with different objectives in the project. The analytic techniques used to determine feasibility of such projects are often deterministic and do not consider two critical elements. First, the need to identify major entities involved in these projects and their individual objectives; second, the importance of analyzing measures of effectiveness of each entity in a multi objective context. A framework is proposed in this paper to address these issues. Also, a set of relaxation policies is proposed to reflect the nature and level of participation of the entities. First, the feasibility of each single entity perspective is determined and next, a multi-objective optimization (MOO) is proposed reflecting the perspectives of all entities. The MOO results in pareto optimal solutions to serve as tradeoff between the participation levels of the multiple entities. Analytic Hierarchy Process (AHP) is used as a tool to narrow down number of options for decision makers for further consideration. AHP and MOO are integrated to determine the feasibility of strategies from multi entity 1 Corresponding author.: Tel.: +1 301 405 9424, fax.: +1 301 314 5639 E-mail address: [email protected](Sabyasachee Mishra), [email protected](Snehamay Khasnabis), [email protected](Subrat Swain)
Transcript
1
Multi Entity Perspective Transportation Infrastructure Investment Decision Making Sabyasachee Mishra a1, Snehamay Khasnabis b, Subrat Swain c a National Center for Smart Growth Research and Education, University of Maryland, College Park, MD 20742, United States b Department of Civil and Environmental Engineering, Wayne State University, Detroit, MI 48202, United States c Department of Electrical, Computer and Energy Engineering, Arizona State University, Tempe, AZ 85287, United States
Abstract Investment in new large transportation infrastructure is capital-intensive and irreversible in nature. Private sector participation in infrastructure investment has gained popularity in recent times because of scarcity of resources at the public sector, and because of the ability of the private sector to build, operate, maintain such facilities, and share future uncertainties. In such cases, there are multiple entities each with different objectives in the project. The analytic techniques used to determine feasibility of such projects are often deterministic and do not consider two critical elements. First, the need to identify major entities involved in these projects and their individual objectives; second, the importance of analyzing measures of effectiveness of each entity in a multi objective context. A framework is proposed in this paper to address these issues. Also, a set of relaxation policies is proposed to reflect the nature and level of participation of the entities. First, the feasibility of each single entity perspective is determined and next, a multi-objective optimization (MOO) is proposed reflecting the perspectives of all entities. The MOO results in pareto optimal solutions to serve as tradeoff between the participation levels of the multiple entities. Analytic Hierarchy Process (AHP) is used as a tool to narrow down number of options for decision makers for further consideration. AHP and MOO are integrated to determine the feasibility of strategies from multi entity 1 Corresponding author.: Tel.: +1 301 405 9424, fax.: +1 301 314 5639
perspectives. The framework is examined on the proposed multibillion dollar international river crossing connecting the city of Detroit in the U.S. and the city of Windsor in Canada. This methodology provides a tool for large scale transportation infrastructure investment decision making process consisting of multiple entities.
Typically, large scale transportation investments are irreversible in nature and require long-term commitment by the public at-large relative to utilization, maintenance, and operation. Examples are mass-transit systems, freeway corridors, subways, crossings in the form of bridges and tunnels, high occupancy vehicle (HOV) lanes, and toll roads. A National Transportation Statistics report suggests that total gross transportation investment by the federal, state and local governments reached $80 billion in the US in the fiscal year 2003 (BTS 2008). Similarly expenditures in operating, maintaining and administering the nation’s transportation facilities are over $200 billion annually. Projected federal, state and local highway revenues are insufficient to meet estimates of future highway requirements (USDOT 2006). Lack of capital funds to meet the infrastructure needs of the country may result in increased private participation in such projects (Roth 1996).
Investment in major transportation infrastructure involving public and private agencies is often a complex process, with the respective agencies having different missions and motivations. The public sector may consist of national, state and local agencies with a social welfare perspective, and with a mission to maximize consumer surplus2.The private entity, on the other hand, is interested in maximizing profit typically realized through revenue collected for toll facilities. Since the public sector is the eventual the owner of the facility, it must ensure that the facility attracts users and serves the needs of the community (Yang & Meng 2000). Thus, the travel cost (in the form of toll charges, travel time and other road-user costs) must be viable to the ultimate end-users. One of the ways to ensure such viability is to minimize inequality in the distribution of services among the user-community. Hence, in the investment decision making process, the perspectives of the three entities: (1) the private, (2) the public, and (3) the user should be duly considered. The fact that these perspectives are distinctively different makes the decision-making process extremely complex.
A single objective optimization may be used to represent the interest of a specific entity perspective. The optimum solution thus obtained might not be best suited to other entities. A multi-objective optimization (MOO) is the process of simultaneously considering two or more objective functions each with a specific optimization defined. Different solutions of MOO may produce conflicting solutions (trade-offs) among different objectives. Examples of MOO in transportation application include: scheduling of trains for single and multiple tracks with varying capacity of trains to platforms
2 The additional value or benefit received over and above the expenses actually made is known as consumer
surplus.
4
(Ghoseiri et al. 2004), vehicle routing and scheduling for hazardous material transportation (Meng et al. 2005), optimal transit network design (Fan & Machemehl 2006), optimal responsive plans for traffic signal coordination (Abbas & Sharma 2006), optimum project selection model from portfolio (Doerner et al. 2006; Lee & Kim 2001; Santhanam & Kyparisis 1995; Ringuest & Graves 1989). In spite of these examples, the application of MOO in investment decisions is somewhat limited. Most investment decisions share three important characteristics in varying degrees. First, the investment is partially or completely irreversible in that the funds invested are completely “sunk” in the project. Thus the agency or agencies responsible for managing the project must be fully committed to the project once the investment is made. Second, there are uncertainties over the future outcome from the investment. One way to address this is to assess the probabilities of the alternative outcomes that can mean greater or smaller profit (or loss) for the investment. The third characteristic is related to time frame of the investment. Traditional economic analysis techniques are based upon the assumption of deterministic future cash flows. In reality, many of these projects are associated with significant uncertainties. The term “uncertainty” refers to situations when this randomness cannot be expressed in terms of mathematical probabilities (Knight 1921). With proper planning, investment decisions can be postponed until credible information about future outcomes may be available. These three characteristics interact to determine the optimal decision of investors (Weston & Brigham 1976).
Thus, there are a number of problems in decision making that are often ignored. These include the need to consider the perspectives of different entities, and lack of ability to incorporate future uncertainties using deterministic techniques, and to provide a methodology in a multi-objective decision making framework. This paper focuses on the last aspect mentioned above, and the objective of research is
“to present a methodology for investment decision making consisting of multiple-entities with different objectives in a multi-objective framework and to demonstrate the application of the methodology in a real world case study.”
2. Entity Perspectives in Investment Decision Making
The multi-entity decision making process for a typical toll facility can be viewed as a bi-level process where, the upper level involves policy maker’s decision to determine the toll value, while road users are assigned to the proposed facility at the lower level. The policy maker (upper level) is assumed to have some understanding of the road users’ likely response (lower level) to a given strategy. Quantitative formulation of upper and lower level can be found in the literature
5
(Mishra et al. 2011). However, the strategy set by the policy maker can only influence (but not control) the road users’ route choice. Further, the upper level may be subdivided into three categories (1) private Investor, (2) public Investor, (3) road user, the three entities whose perspectives must be duly considered in the decision making process.
Private Investor’s Perspective The objective of the private investor is to maximize profit. The annual profit is the difference between benefit and cost. The revenue generated is a function of demand and toll.
Public Investor’s Perspective The primary objective of the public entity is to maximize consumer surplus, typically measured as the additional monetary value over and above the price paid (Wohl & Hendrickson 1984). There are other social benefits such as improved traffic flow, environmental benefits, higher safety etc., that may be derived from major infrastructure projects. There are conflicting viewpoints regarding the degree to which these social benefits should be considered in investment decisions (Johnson et al. 2007). These are not incorporated in the proposed framework and the classical approach of maximization of consumer surplus was used at the only public benefit from toll and travel time savings.
Road User’s Perspective The benefits and costs of the project for all Origin Destination (OD) pairs should be reasonably distributed to establish spatial equity which is the objective from road user’s view point. A project that results in benefits only for a small fraction of travelers in the study area cannot be considered as equitable. Theil’s index, one of the commonly used measures of inequality distribution, was used in this research because of its flexible structure (Theil 1967).
3. A Framework for Multi-Entity Perspective Decision Making
A framework for investment decision making in transportation infrastructure with multiple entities is presented in Figure 1. Multi-entity decision making will identify a single preferred alternative or rank alternatives in a manner that reflects the decision makers’ choice. The proposed methodology consists of four steps: (1) identification of entities in investment decision making, (2) multi-objective problem definition, (3) development of experimental design, and (4) choice determination. The four steps are described below.
3.1 Identification of entities in investment decision making
Such investments typically involve different types of decision makers (or investors / users) termed as entities in Figure 1. Each entity has a different objective from
6
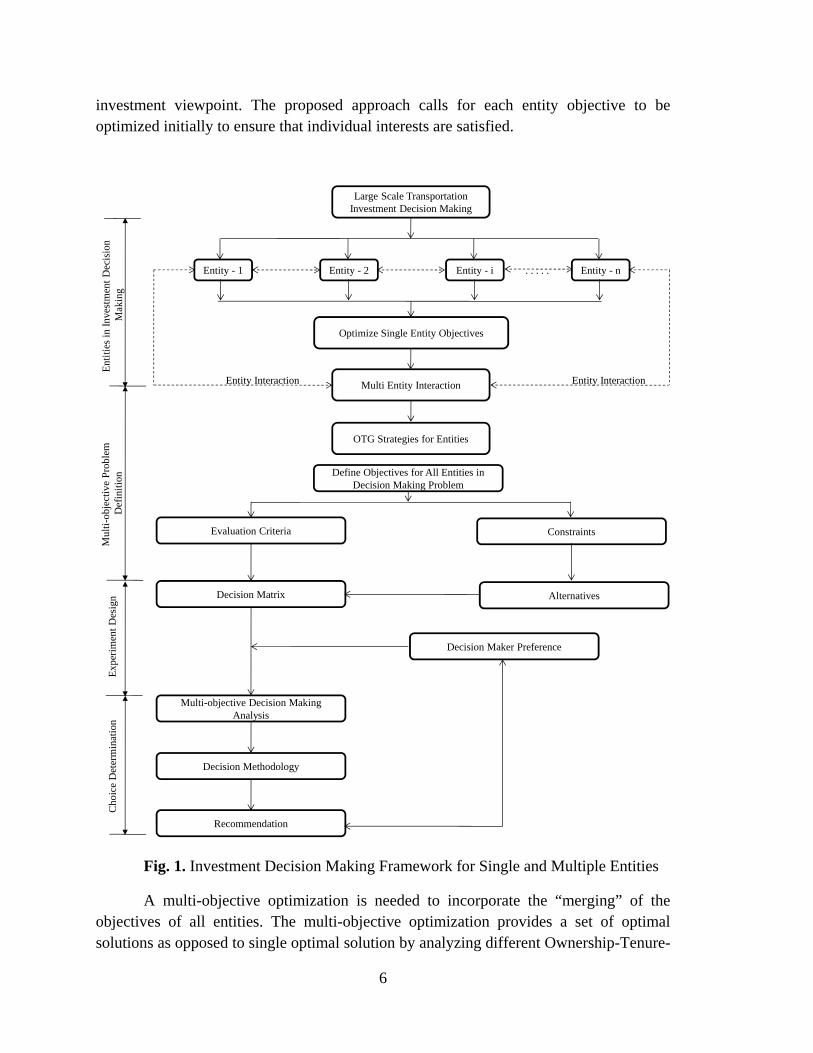
investment viewpoint. The proposed approach calls for each entity objective to be optimized initially to ensure that individual interests are satisfied.
Fig. 1. Investment Decision Making Framework for Single and Multiple Entities
A multi-objective optimization is needed to incorporate the “merging” of the objectives of all entities. The multi-objective optimization provides a set of optimal solutions as opposed to single optimal solution by analyzing different Ownership-Tenure-
Large Scale Transportation Investment Decision Making
Entity - 1 Entity - 2 Entity - i Entity - n. . . . .
Optimize Single Entity Objectives
Multi Entity Interaction
OTG Strategies for Entities
Define Objectives for All Entities in Decision Making Problem
Evaluation Criteria Constraints
Decision Matrix Alternatives
Decision Maker Preference
Multi-objective Decision Making Analysis
Decision Methodology
Recommendation
Mul
ti-o
bjec
tive
Pro
blem
D
efin
itio
nE
xper
imen
t Des
ign
Cho
ice
Det
erm
inat
ion
Ent
itie
s in
Inv
estm
ent
Dec
isio
n M
akin
g
Entity InteractionEntity Interaction
7
Governance (OTG) strategies. An OTG strategy can be looked upon as a mechanism to implement joint ownership projects. These three terms can be defined as follows (Mishra et al. 2011):
The term “Ownership” has embedded in it, the concept of ‘possession’ and ‘title’ related to the property in question.
“Tenure” refers to the status of holding a possession of a project for a specific period, ranging from few days to a number of years.
“Governance” refers to management, policy and decision making pertaining to an organization with the intent of producing desired results.
Each strategy represents specific roles of individual entities involved in the investment process. A methodology is proposed to interface the solution obtained from the multi-objective optimization with the OTG strategies, considering the preferences of each entity involved in the decision making procedure.
3.2 Multi-objective Decision Making Problem Definition
The multi-objective problem definition consists of objective of multiple entities in the transportation investment decision making. MOO approach can be divided into two categories: (1) exact methods and (2) heuristic method. Few examples of exact method
are: weighted sum method, -constraint method, weighted metric method, value function method, and goal programming method (Deb 2001). The exact method does not use any a priori information in estimation of pareto-optimal solution. The approach is applied to a number of MOO problems. Examples include: traffic assignment and traffic flow (Lee & Pulat 1991), shortest path problem (Aneja & Nair 1979; Diaz 1978; Isermann 1979; Srinivasan & Thompson 1976), spanning tree (Newman 1983). Heuristic method requires less computation load but does not guarantee optimality. A heuristic algorithm includes constrained logic programming, genetic algorithm, simulated annealing, tabu search, and neural networks. Heuristic methods are extensively used in applied research (Deb 2001). In this paper an exact method is employed and discussed below (Ehrgott & Gandibleux 2000):
8
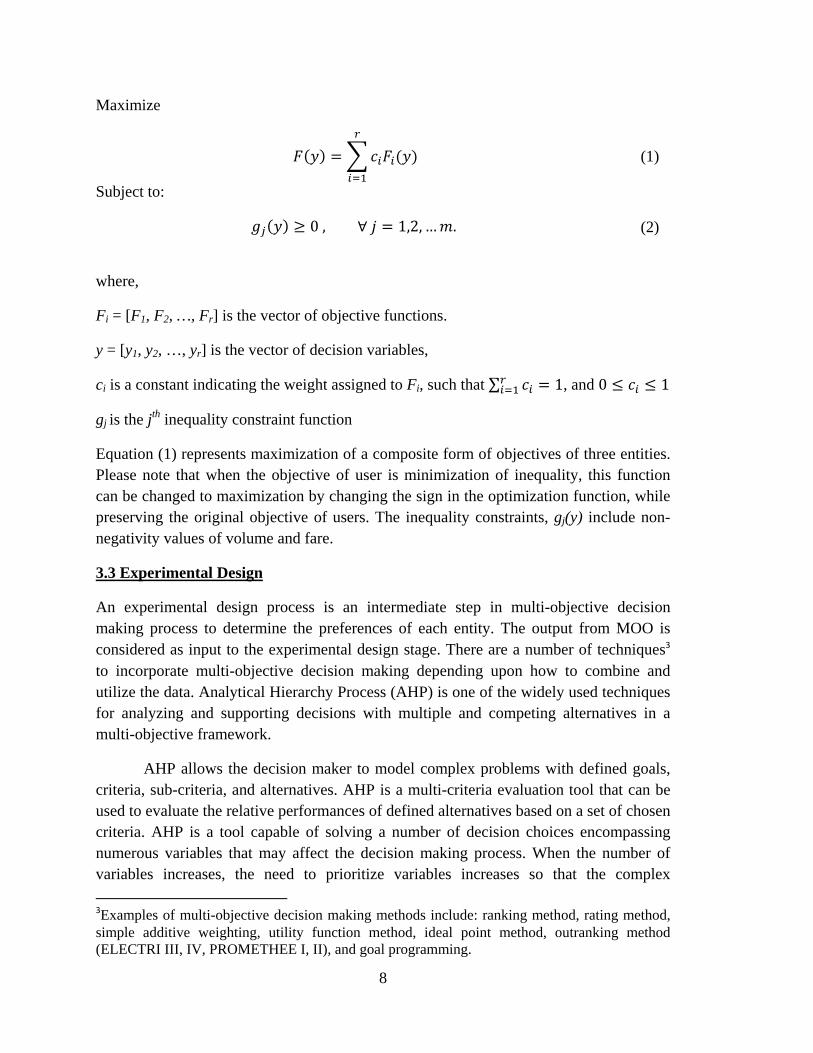
Maximize
(1)
Subject to:
0, ∀ 1,2, … . (2)
where,
Fi = [F1, F2, …, Fr] is the vector of objective functions.
y = [y1, y2, …, yr] is the vector of decision variables,
ci is a constant indicating the weight assigned to Fi, such that ∑ 1, and 0 1
gj is the jth inequality constraint function
Equation (1) represents maximization of a composite form of objectives of three entities. Please note that when the objective of user is minimization of inequality, this function can be changed to maximization by changing the sign in the optimization function, while preserving the original objective of users. The inequality constraints, gj(y) include non-negativity values of volume and fare.
3.3 Experimental Design
An experimental design process is an intermediate step in multi-objective decision making process to determine the preferences of each entity. The output from MOO is considered as input to the experimental design stage. There are a number of techniques3 to incorporate multi-objective decision making depending upon how to combine and utilize the data. Analytical Hierarchy Process (AHP) is one of the widely used techniques for analyzing and supporting decisions with multiple and competing alternatives in a multi-objective framework.
AHP allows the decision maker to model complex problems with defined goals, criteria, sub-criteria, and alternatives. AHP is a multi-criteria evaluation tool that can be used to evaluate the relative performances of defined alternatives based on a set of chosen criteria. AHP is a tool capable of solving a number of decision choices encompassing numerous variables that may affect the decision making process. When the number of variables increases, the need to prioritize variables increases so that the complex
3Examples of multi-objective decision making methods include: ranking method, rating method, simple additive weighting, utility function method, ideal point method, outranking method (ELECTRI III, IV, PROMETHEE I, II), and goal programming.
9
decision-making process becomes manageable. The process begins with establishing hierarchies. The main problem to be solved resides at the top of the hierarchy scale. The levels below the main problem are the criteria and sub criteria, with each level supporting the one above it. The bottom level of the hierarchy includes the alternatives or, “scenarios” for solving the main problem (Saaty 1995). The priorities, in the form of weighted values, are calculated at each level until the lower level alternatives are rated or prioritized as the best solution to the main problem listed at the top of the hierarchy.
3.4 Choice Determination: MOO and AHP Integration
A set of solutions obtained from the MOO is taken as input to formulate a decision matrix (Multi-objective decision making problem definition step in Figure 1). Further, the decision matrix will contain the OTG strategies associated with the alternatives under consideration (Experimental Design step in Figure 1). The objective of designing the decision matrix is to obtain the decision maker’s preference to the objective of each entity embedded within each alternative. The preferences of the decision makers are analyzed by AHP (choice determination step in Figure 1) to obtain an OTG strategy- specific solution, with each OTG strategy depicting the roles of the entities involved.
4. Case Study A proposed international bridge between the city of Detroit in the US and the city
of Windsor in Canada is selected as the case study area. Surface trade between Southwestern Ontario and Southeastern Michigan exceeded 200 billion in 2004 and is expected to increase by twofold by the year 2030 (MDOT 2003). 70 percent of trade movement between the US and Canada is by trucks. Approximately 28 percent of surface trading is by trucks for the crossings between Southeast Michigan and Southwest Ontario(MDOT 2008). Majority of the trade is for the crossings in the Detroit River area, connecting the city of Detroit in the US and the city of Windsor in Canada. This large trade volume has a significant positive effect on the local, regional and national economies, through cross-border employment opportunities.
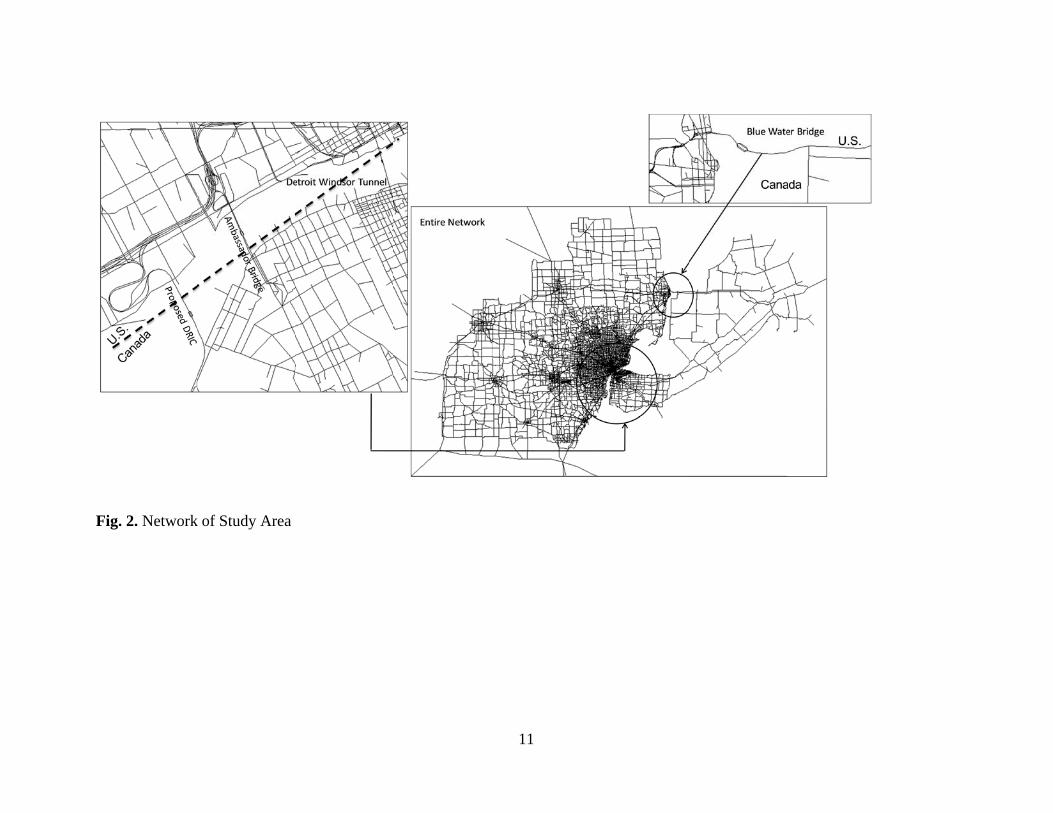
The Central Business Districts (CBDs) of the cities of Detroit and Windsor are currently connected by four crossings: (1) The Ambassador Bridge (AB), (2) The Detroit Windsor Tunnel (DWT), (3) a Rail Tunnel (RT), and (4) The Detroit Windsor Truck Ferry (DWTF). Both AB and DWT across the Detroit River, both built during the late 1920s. AB is a privately owned four-lane suspension structure, while DWT is a two-lane facility with height restriction, jointly owned by the two cities and operated by a private corporation. The Blue Water Bridge (BWB) across the St. Clair River (100 km north of Detroit) that connects Port Huron in the USA with Sarnia in Canada. BWB is a six lane arch structure built in 1938.The bridge was renovated in 1999, and is jointly owned by
10
the two cities. The RT and DWTF, both constructed under the Detroit River, carry cargo between two cities.
The Canada–US–Ontario–Michigan Transportation Partnership Study (Partnership Study) attempted to develop long-term strategies to provide safe and efficient movement of people and goods between Michigan and Ontario (MDOT 2008). Even though the current capacities of the Ambassador Bridge and the Detroit-Windsor tunnel adequately serve the traffic needs during most hours, on specific days during peak periods the systems do run at full capacity. Considering long-term traffic growth and the overall importance of the Detroit River crossings on the regional economy, the need for a third crossing seems immensely justified. As a result of number of studies initiated in early 2000’s and currently nearing completion, MDOT, in collaboration with the Ontario Ministry of Transportation have identified a bridge known as X-10(B) as the most preferred alternative to built in the vicinity of the Ambassador Bridge (MDOT 2008). The alternative has been referred to as the Detroit River International Crossing (DRIC) in the case study. Proposed DRIC and other river crossings are presented in Figure 2.
5. Results
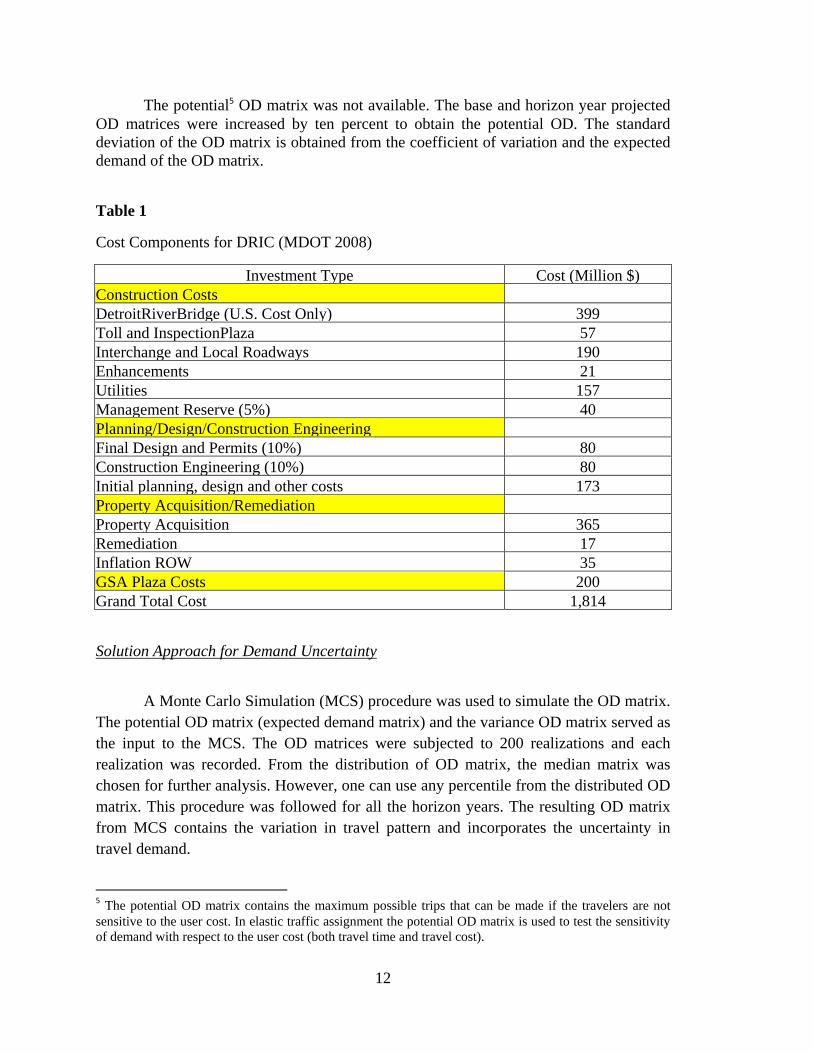
Two types of bridges are proposed for X-10(B); (1) suspension bridge, and (2) cable-stay bridge. The costs of the bridges along with associated infrastructures are $1809 million and $1814 million respectively; and the case study is based on the assumption of a suspension bridge. The cost components are shown in Table 1. The planning for the bridge was started in 2004. A part of the planning/design/construction engineering cost is already incurred. The construction is expected to be complete in 2014, and the bridge will be open to traffic in 2015. The cost elements shown in Table 1 are only for the US part of the bridge. Similarly, all the toll revenue compiled to assess the benefits reflects the fare collected at the Detroit end of the bridge.
5.1 Travel Demand Uncertainty
The Origin-Destination (O-D) matrices (1510*1510) for the study area are obtained from MDOT for the years 2015, 2025, and 2035. The study area consists of 960 Traffic Analysis Zones (TAZ) in the Detroit (US) side of the border, 527 TAZs in the Windsor (Canada) side of the border, and 23 external TAZs for a total of 1510 TAZs. The analysis period for the case study is considered as 35 years (2015-2050). The OD matrices for the years 2045, and 2050 were projected by considering the growth trends of the TAZ,s. A coefficient of variation4 of 0.15 is considered to incorporate variance in travel demand.
4The coefficient of variation (COV) is the ratio of the standard deviation and the mean. For this research a COV of 0.15 is assumed by observing the variation in demand over time for ten years.
FFig. 2. Networkk of Study Area
11
12
The potential5 OD matrix was not available. The base and horizon year projected OD matrices were increased by ten percent to obtain the potential OD. The standard deviation of the OD matrix is obtained from the coefficient of variation and the expected demand of the OD matrix.
Table 1
Cost Components for DRIC (MDOT 2008)
Investment Type Cost (Million $) Construction Costs DetroitRiverBridge (U.S. Cost Only) 399 Toll and InspectionPlaza 57 Interchange and Local Roadways 190 Enhancements 21 Utilities 157 Management Reserve (5%) 40 Planning/Design/Construction Engineering Final Design and Permits (10%) 80 Construction Engineering (10%) 80 Initial planning, design and other costs 173 Property Acquisition/Remediation Property Acquisition 365 Remediation 17 Inflation ROW 35 GSA Plaza Costs 200 Grand Total Cost 1,814
Solution Approach for Demand Uncertainty
A Monte Carlo Simulation (MCS) procedure was used to simulate the OD matrix. The potential OD matrix (expected demand matrix) and the variance OD matrix served as the input to the MCS. The OD matrices were subjected to 200 realizations and each realization was recorded. From the distribution of OD matrix, the median matrix was chosen for further analysis. However, one can use any percentile from the distributed OD matrix. This procedure was followed for all the horizon years. The resulting OD matrix from MCS contains the variation in travel pattern and incorporates the uncertainty in travel demand.
5 The potential OD matrix contains the maximum possible trips that can be made if the travelers are not sensitive to the user cost. In elastic traffic assignment the potential OD matrix is used to test the sensitivity of demand with respect to the user cost (both travel time and travel cost).
13
The proposed traffic assignment model is calibrated for the base year 2004. Actual toll values for cars and trucks for the year 2004 are utilized to determine the assigned volume on the existing river crossings in the network. The proposed elastic traffic assignment model and the potential OD matrix for the year 2004 is utilized to determine the assigned volume for cars and trucks. The observed car and truck volumes are obtained from MDOT (MDOT 2008). The relative closeness of assigned and observed volume at the respective crossings demonstrates the calibration of the model. Results of the calibration are not presented in the paper for the sake of brevity. The details of calibration of the model are discussed in the project report (Khasnabis et al. 2010).
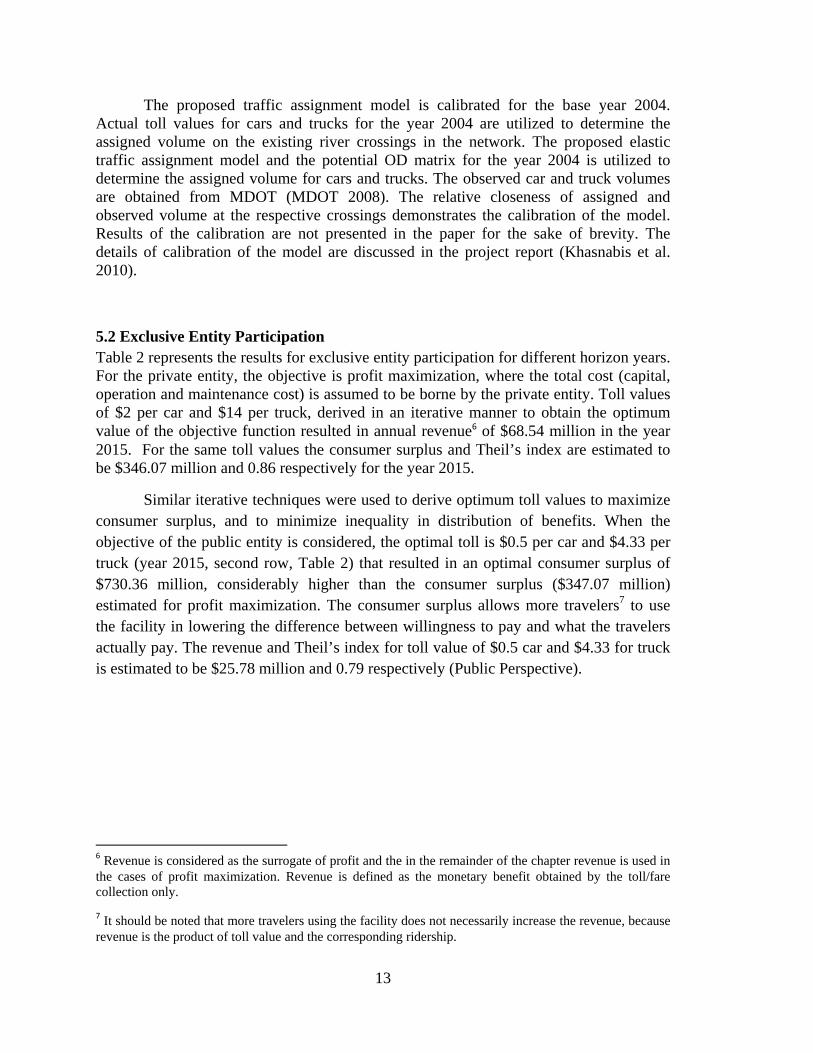
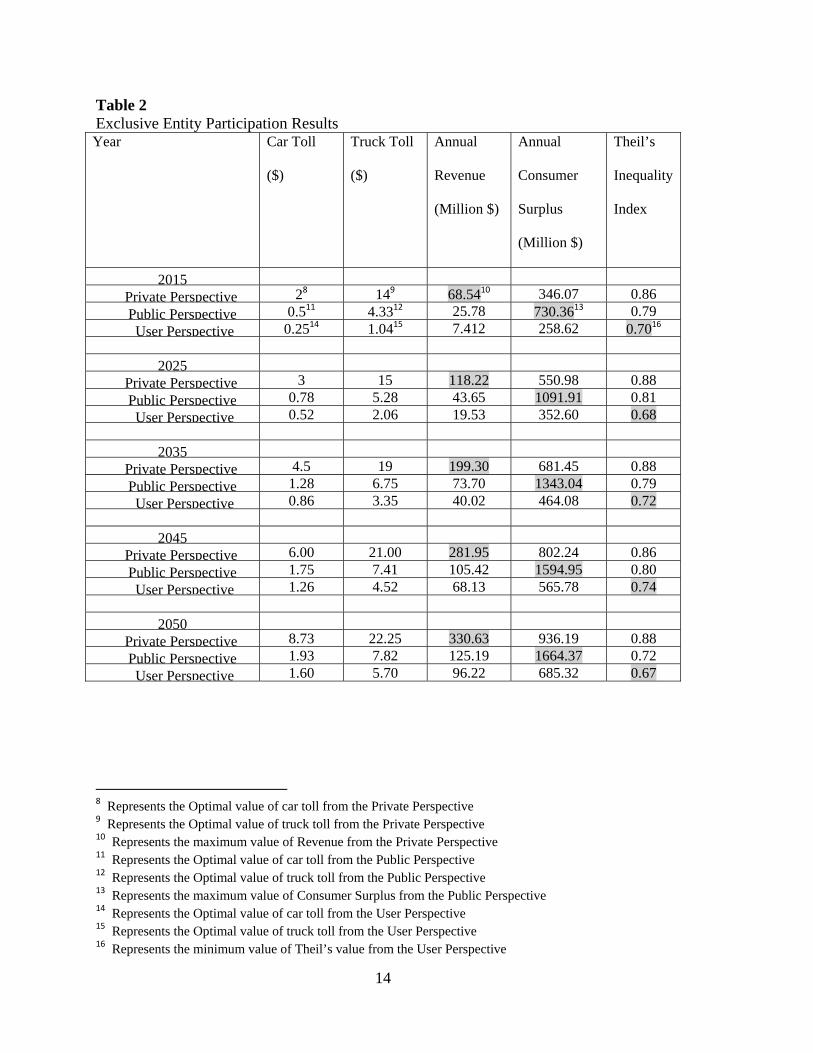
5.2 Exclusive Entity Participation Table 2 represents the results for exclusive entity participation for different horizon years. For the private entity, the objective is profit maximization, where the total cost (capital, operation and maintenance cost) is assumed to be borne by the private entity. Toll values of $2 per car and $14 per truck, derived in an iterative manner to obtain the optimum value of the objective function resulted in annual revenue6 of $68.54 million in the year 2015. For the same toll values the consumer surplus and Theil’s index are estimated to be $346.07 million and 0.86 respectively for the year 2015.
Similar iterative techniques were used to derive optimum toll values to maximize consumer surplus, and to minimize inequality in distribution of benefits. When the objective of the public entity is considered, the optimal toll is $0.5 per car and $4.33 per truck (year 2015, second row, Table 2) that resulted in an optimal consumer surplus of $730.36 million, considerably higher than the consumer surplus ($347.07 million) estimated for profit maximization. The consumer surplus allows more travelers7 to use the facility in lowering the difference between willingness to pay and what the travelers actually pay. The revenue and Theil’s index for toll value of $0.5 car and $4.33 for truck is estimated to be $25.78 million and 0.79 respectively (Public Perspective).
6 Revenue is considered as the surrogate of profit and the in the remainder of the chapter revenue is used in the cases of profit maximization. Revenue is defined as the monetary benefit obtained by the toll/fare collection only.
7 It should be noted that more travelers using the facility does not necessarily increase the revenue, because revenue is the product of toll value and the corresponding ridership.
14
Table 2 Exclusive Entity Participation Results Year Car Toll
8 Represents the Optimal value of car toll from the Private Perspective 9 Represents the Optimal value of truck toll from the Private Perspective 10 Represents the maximum value of Revenue from the Private Perspective 11 Represents the Optimal value of car toll from the Public Perspective 12 Represents the Optimal value of truck toll from the Public Perspective 13 Represents the maximum value of Consumer Surplus from the Public Perspective 14 Represents the Optimal value of car toll from the User Perspective 15 Represents the Optimal value of truck toll from the User Perspective 16 Represents the minimum value of Theil’s value from the User Perspective
15
Similarly, when the objective of the users is considered (year 2015, third row, Table 2) the optimal toll values obtained are $0.25 per car and $ 1.04 per truck, resulting in a Theil’s index of 0.70 (minimum of the three Theil’s index values) for the year 2015. For the same toll values the revenue and consumer surplus are estimated at $7.41 and $258.62 million respectively.
Three distinct toll values are obtained for three different entities each of which results in optimum value for the three objective functions defined. The highest toll value resulted for profit maximization and the least toll value for minimization of inequity thereby demonstrating that the objectives of the private investor and the users are satisfied. Additionally, the toll value for the public entity perspective resulting in maximization of consumer’s surplus is lower than that for the private perspective. Similar trends are observed for the other horizon years during the analysis period presented in Table 2. Increased travel demand in future years resulted in higher toll values, higher revenue and higher consumer surplus in succeeding years. For the Theil’s Index that is considered as a minimization function, there are some minor variations between different horizon years, without any specific patterns.
5.3 Ownership, Tenure and Governance Strategies
The authors’ initial work on the concept of OTG scenarios was presented at the World Conference on Transport Research at the University of California, Berkeley in 2007 (Khasnabis et al. 2007). Ownership, Tenure and Governance (OTG) may be considered as the three principal components of a joint ownership.
The authors considered a number of OTG strategies to encourage joint entity participation in the DRIC project. The strategies reflect varying degrees of participation by the public and the private entity. The OTG strategies considered are:
1. OTG-1: Exclusive Private Participation
2. OTG-2: Major Private Participation
3. OTG-3: Moderate Private Participation
4. OTG-4: Major Public Participation
5. OTG-5: Exclusive Public Participation
A number of relaxation policies are also considered as a part of the OTG strategies and is explained below. The feasibility of OTG strategies are determined by considering the analysis period till 2050. A Minimum Attractive Rate of Return of six percent was assumed for the OTG analysis.
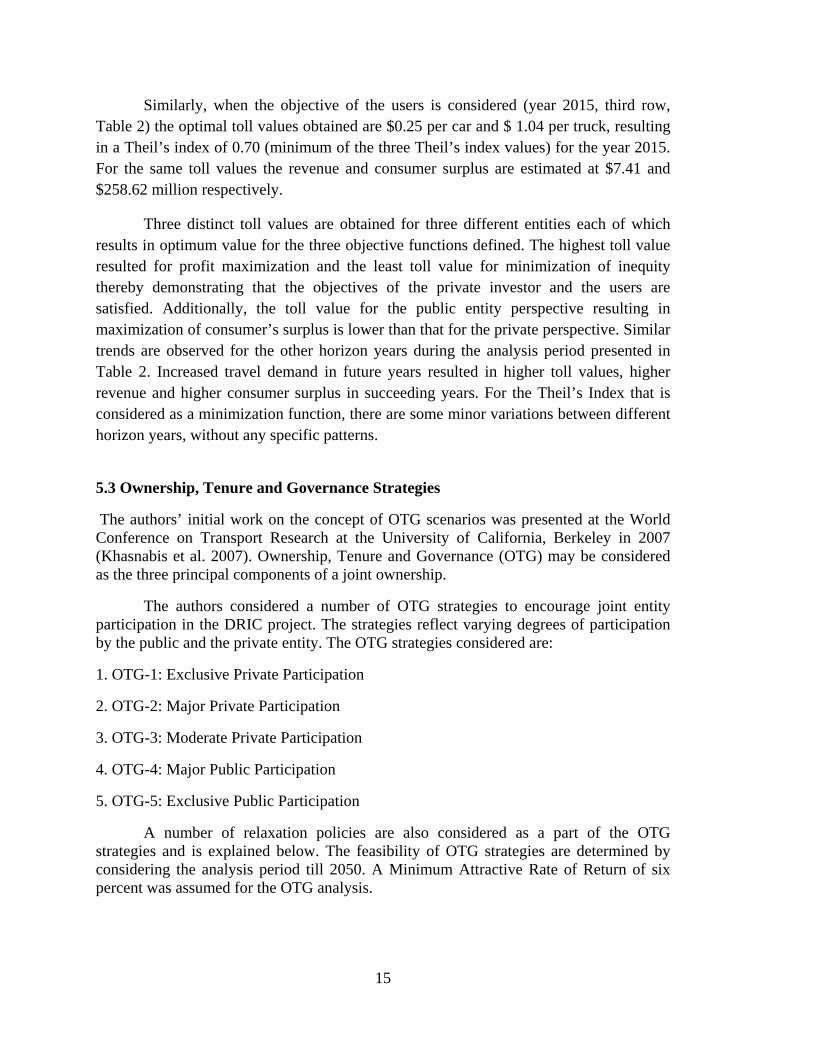
and constrve negative k even periostrategy is css than the e for the stra
mulative Cas
here is no Ieceived. The
vides an estimwith their exp
esent Worth (o
al capital comaximization
es and maihe facility isthe concessi
ive cash flogative cost ruction of th
value of caod occurs in computed as
MARR (asategy (OTG-
h Flow and IR
IRR value tie IRR at the
mate of the returpected dates ovr Net Annual W
1
ost is borne n. After conintains the s the public ion period.
ow and IRRelements du
he facility. Wash flow dec
the year 20s 4.61% ovesumed as s
-1).
RR: Exclusiv
ill the end oend of 2030
rn or yield of tver the life of thWorth or Net F
16
by the privnstruction offacility durientity that a
R for OTG-1uring the 2When the freases, as th
034. The Inteer the 35 yeix percent)
ve Private Part
of 2025 as th is -1.82)
the investment,he project. IRR
Future Worth) o
vate entity. f the faciliting the conassumes the
1 are the tw2004-2014 pfacility is ophe toll chargernal Rate oear concessilends the p
ticipation (OT
he cost is m
, given a set ofR is defined asof the investme
The objectity, the privancession pere responsibil
wo MOEs pperiod reprepened to trages are colleof Return (IRion period. Tproject econ
TG-1)
much higher
f expenditure as the interest raent is equal to
ve of the ate entity riod. The lity of the
plotted in esent the affic, the ected and RR)17 for The IRR
nomically
than the
and revenue ate at which zero.
17
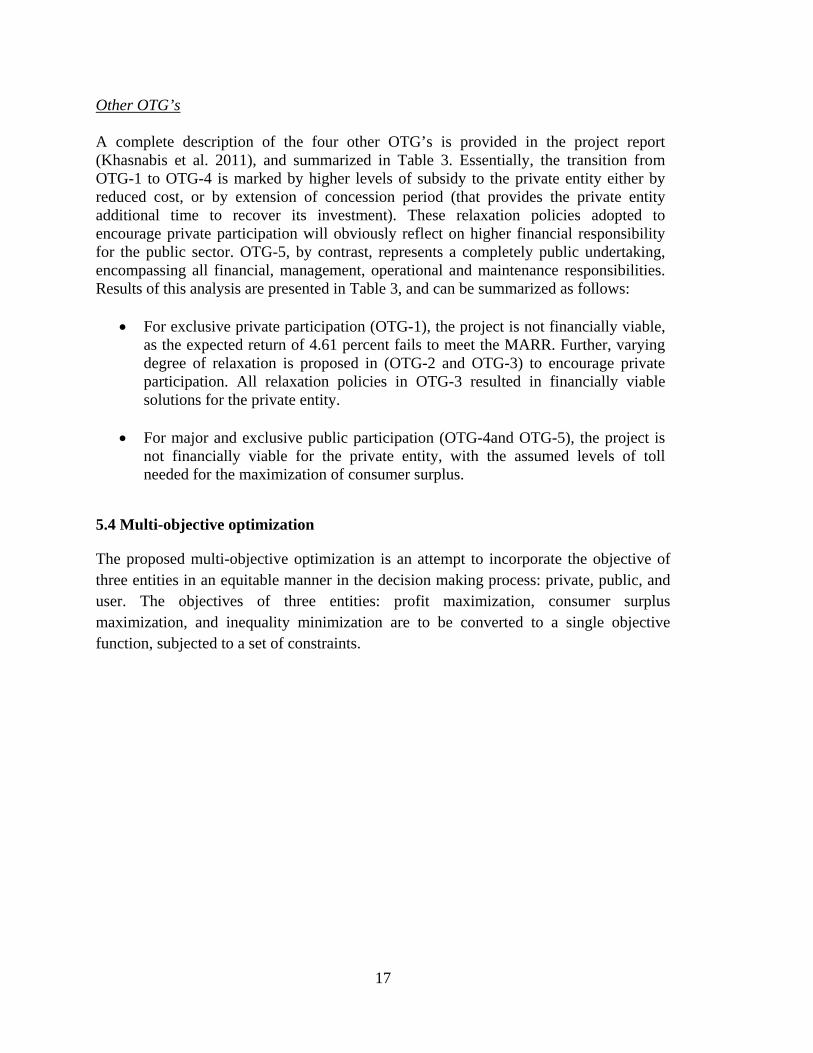
Other OTG’s A complete description of the four other OTG’s is provided in the project report (Khasnabis et al. 2011), and summarized in Table 3. Essentially, the transition from OTG-1 to OTG-4 is marked by higher levels of subsidy to the private entity either by reduced cost, or by extension of concession period (that provides the private entity additional time to recover its investment). These relaxation policies adopted to encourage private participation will obviously reflect on higher financial responsibility for the public sector. OTG-5, by contrast, represents a completely public undertaking, encompassing all financial, management, operational and maintenance responsibilities. Results of this analysis are presented in Table 3, and can be summarized as follows:
For exclusive private participation (OTG-1), the project is not financially viable, as the expected return of 4.61 percent fails to meet the MARR. Further, varying degree of relaxation is proposed in (OTG-2 and OTG-3) to encourage private participation. All relaxation policies in OTG-3 resulted in financially viable solutions for the private entity.
For major and exclusive public participation (OTG-4and OTG-5), the project is not financially viable for the private entity, with the assumed levels of toll needed for the maximization of consumer surplus.
5.4 Multi-objective optimization
The proposed multi-objective optimization is an attempt to incorporate the objective of three entities in an equitable manner in the decision making process: private, public, and user. The objectives of three entities: profit maximization, consumer surplus maximization, and inequality minimization are to be converted to a single objective function, subjected to a set of constraints.
18
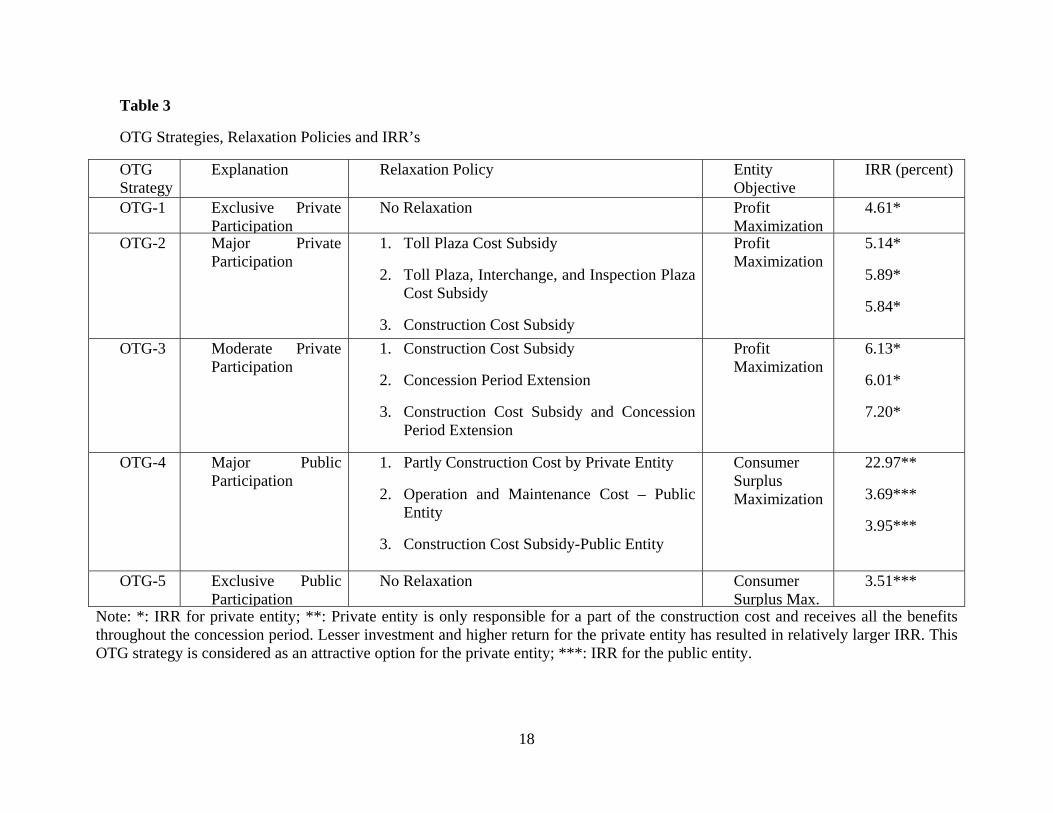
Table 3
OTG Strategies, Relaxation Policies and IRR’s
OTG Strategy
Explanation Relaxation Policy Entity Objective
IRR (percent)
OTG-1 Exclusive Private Participation
No Relaxation Profit Maximization
4.61*
OTG-2 Major Private Participation
1. Toll Plaza Cost Subsidy
2. Toll Plaza, Interchange, and Inspection Plaza Cost Subsidy
3. Construction Cost Subsidy
Profit Maximization
5.14*
5.89*
5.84*
OTG-3 Moderate Private Participation
1. Construction Cost Subsidy
2. Concession Period Extension
3. Construction Cost Subsidy and Concession Period Extension
Profit Maximization
6.13*
6.01*
7.20*
OTG-4 Major Public Participation
1. Partly Construction Cost by Private Entity
2. Operation and Maintenance Cost – Public Entity
3. Construction Cost Subsidy-Public Entity
Consumer Surplus Maximization
22.97**
3.69***
3.95***
OTG-5 Exclusive Public Participation
No Relaxation Consumer Surplus Max.
3.51***
Note: *: IRR for private entity; **: Private entity is only responsible for a part of the construction cost and receives all the benefits throughout the concession period. Lesser investment and higher return for the private entity has resulted in relatively larger IRR. This OTG strategy is considered as an attractive option for the private entity; ***: IRR for the public entity.
19
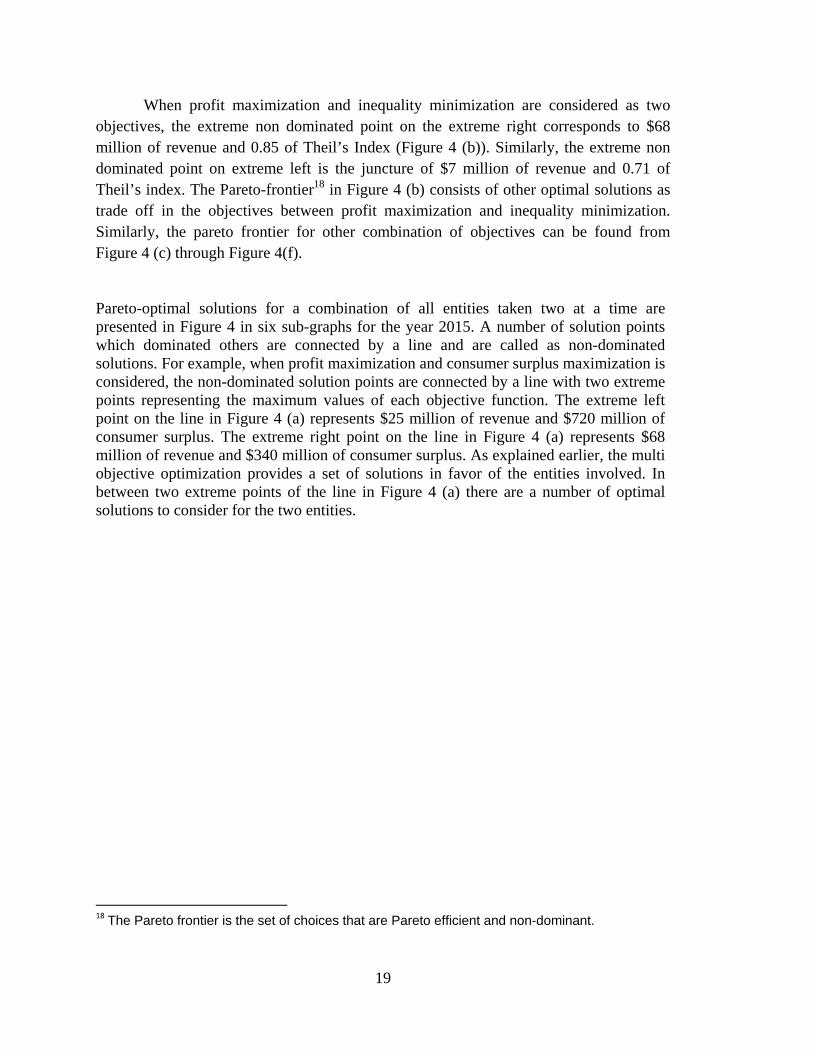
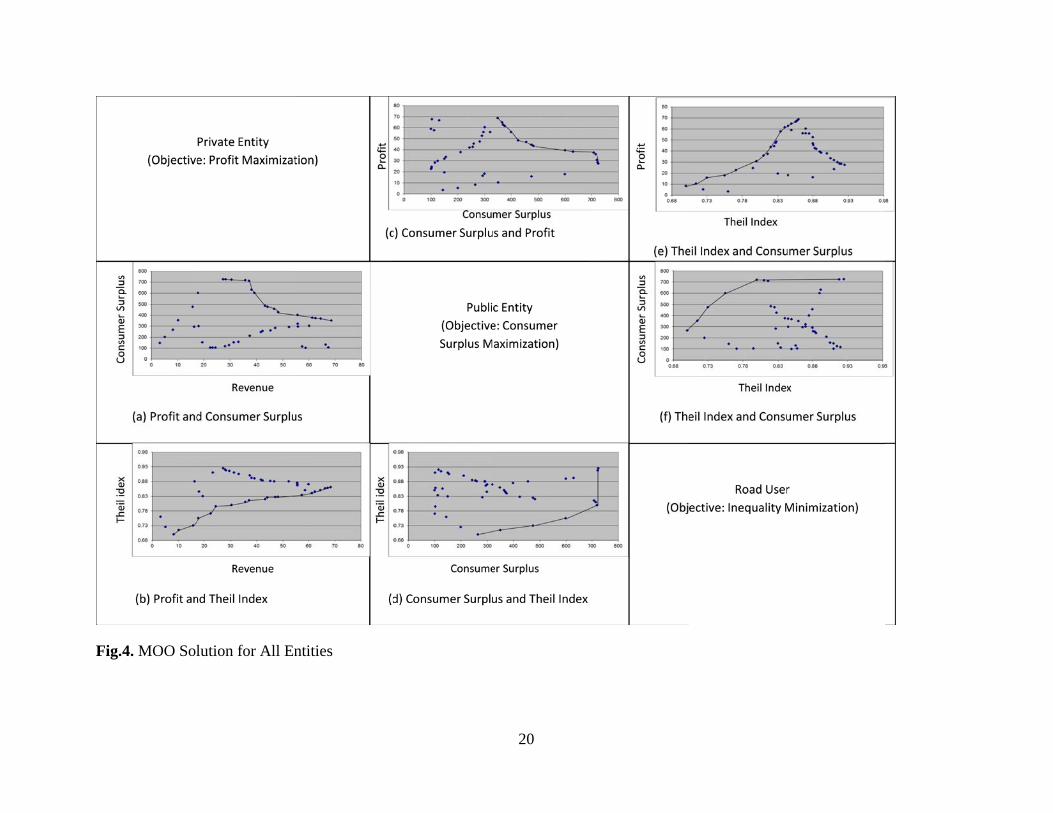
When profit maximization and inequality minimization are considered as two objectives, the extreme non dominated point on the extreme right corresponds to $68 million of revenue and 0.85 of Theil’s Index (Figure 4 (b)). Similarly, the extreme non dominated point on extreme left is the juncture of $7 million of revenue and 0.71 of Theil’s index. The Pareto-frontier18 in Figure 4 (b) consists of other optimal solutions as trade off in the objectives between profit maximization and inequality minimization. Similarly, the pareto frontier for other combination of objectives can be found from Figure 4 (c) through Figure 4(f).
Pareto-optimal solutions for a combination of all entities taken two at a time are presented in Figure 4 in six sub-graphs for the year 2015. A number of solution points which dominated others are connected by a line and are called as non-dominated solutions. For example, when profit maximization and consumer surplus maximization is considered, the non-dominated solution points are connected by a line with two extreme points representing the maximum values of each objective function. The extreme left point on the line in Figure 4 (a) represents $25 million of revenue and $720 million of consumer surplus. The extreme right point on the line in Figure 4 (a) represents $68 million of revenue and $340 million of consumer surplus. As explained earlier, the multi objective optimization provides a set of solutions in favor of the entities involved. In between two extreme points of the line in Figure 4 (a) there are a number of optimal solutions to consider for the two entities.
18 The Pareto frontier is the set of choices that are Pareto efficient and non-dominant.
FFig.4. MOO Sollution for All Enntities
20
21
5.5 From Pareto-Optimal to Feasible Solution
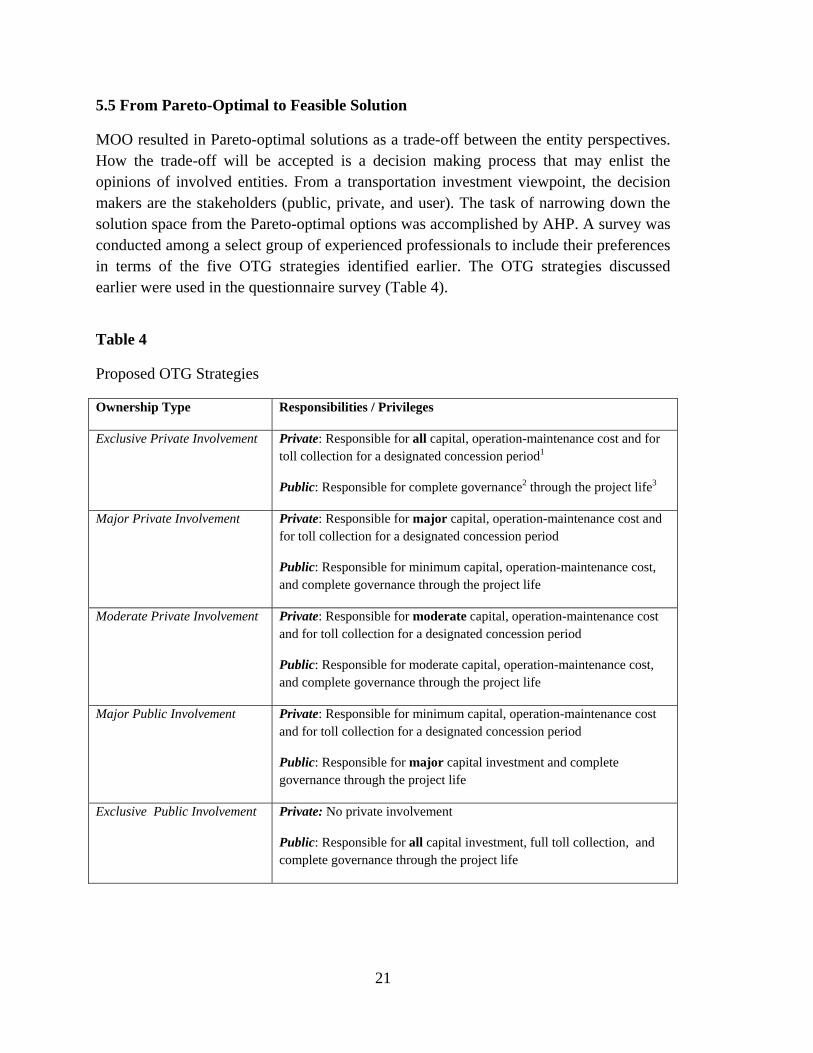
MOO resulted in Pareto-optimal solutions as a trade-off between the entity perspectives. How the trade-off will be accepted is a decision making process that may enlist the opinions of involved entities. From a transportation investment viewpoint, the decision makers are the stakeholders (public, private, and user). The task of narrowing down the solution space from the Pareto-optimal options was accomplished by AHP. A survey was conducted among a select group of experienced professionals to include their preferences in terms of the five OTG strategies identified earlier. The OTG strategies discussed earlier were used in the questionnaire survey (Table 4).
Table 4
Proposed OTG Strategies
Ownership Type Responsibilities / Privileges
Exclusive Private Involvement Private: Responsible for all capital, operation-maintenance cost and for toll collection for a designated concession period1
Public: Responsible for complete governance2 through the project life3
Major Private Involvement Private: Responsible for major capital, operation-maintenance cost and for toll collection for a designated concession period
Public: Responsible for minimum capital, operation-maintenance cost, and complete governance through the project life
Moderate Private Involvement Private: Responsible for moderate capital, operation-maintenance cost and for toll collection for a designated concession period
Public: Responsible for moderate capital, operation-maintenance cost, and complete governance through the project life
Major Public Involvement Private: Responsible for minimum capital, operation-maintenance cost and for toll collection for a designated concession period
Public: Responsible for major capital investment and complete governance through the project life
Exclusive Public Involvement Private: No private involvement
Public: Responsible for all capital investment, full toll collection, and complete governance through the project life
22
Note:
1Concession Period- The time period during the service life of a project when the private entity is allowed to collect revenue to regain its earlier committed investment. The concession period often termed as “tenure” and may vary depending upon specific ownership type. The ownership of the facility is expected to revert back to the public entity at the end of the concession period.
2 Governance: Relates to the management, policy and decision making for the general area of responsibility. The public entity is assumed to have full governance rights through the project life because it is the ultimate owner of the facility.
3 Project Life- The time period from the start day till the facility is considered no longer beneficial for service.
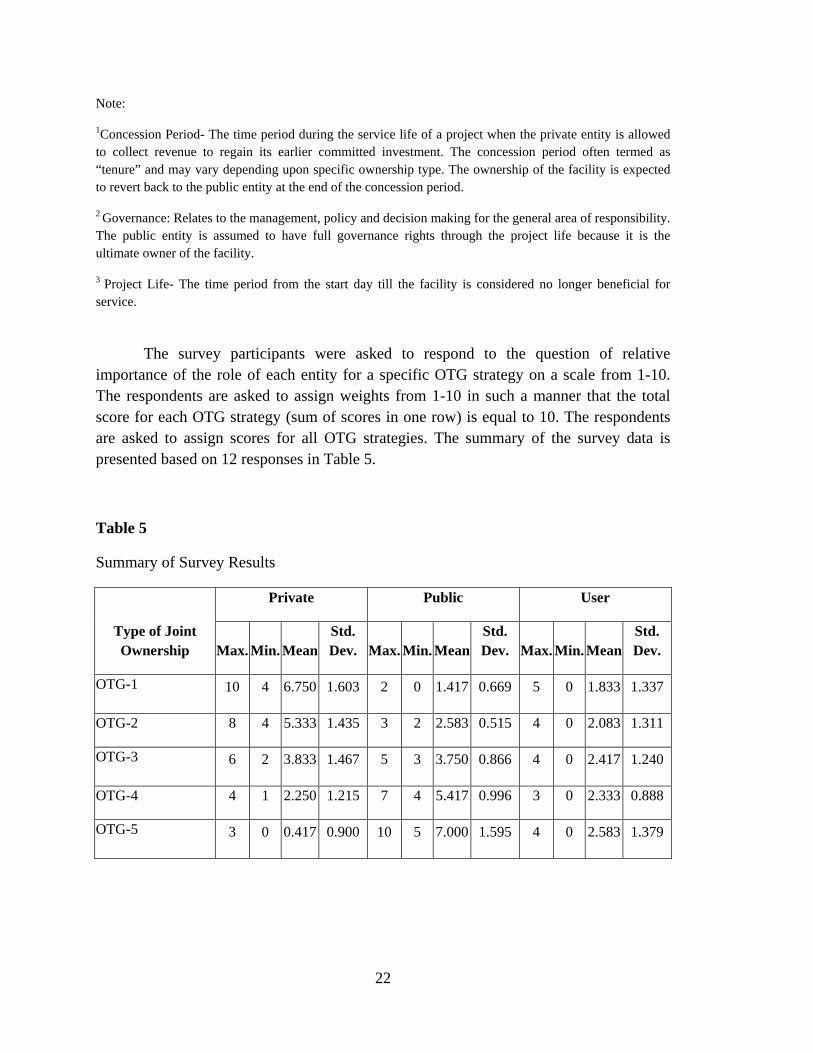
The survey participants were asked to respond to the question of relative importance of the role of each entity for a specific OTG strategy on a scale from 1-10. The respondents are asked to assign weights from 1-10 in such a manner that the total score for each OTG strategy (sum of scores in one row) is equal to 10. The respondents are asked to assign scores for all OTG strategies. The summary of the survey data is presented based on 12 responses in Table 5.
The survey responses are considered in AHP analysis. Analytical Hierarchy Process (AHP) is one of the widely used techniques for analyzing and supporting decisions with multiple and competing alternatives in a multi-objective decision making process. AHP allows the decision maker to model complex problems with defined goals, criteria, sub-criteria, and alternatives (Saaty 1980).
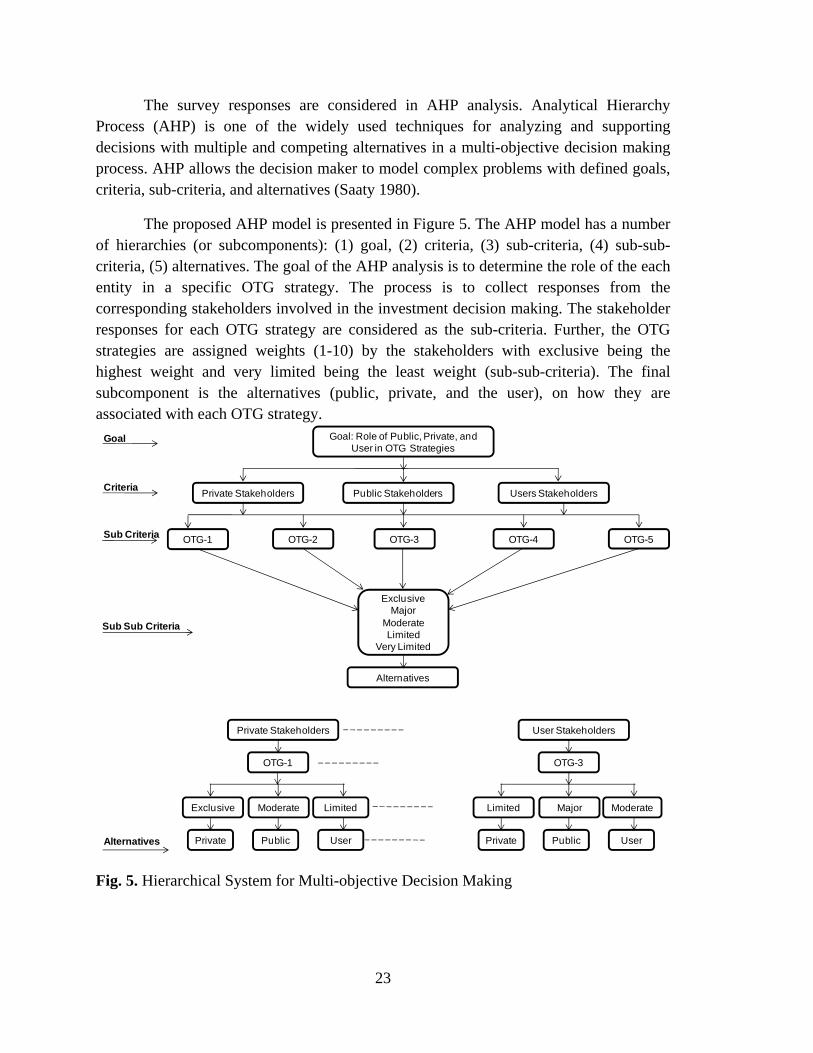
The proposed AHP model is presented in Figure 5. The AHP model has a number of hierarchies (or subcomponents): (1) goal, (2) criteria, (3) sub-criteria, (4) sub-sub-criteria, (5) alternatives. The goal of the AHP analysis is to determine the role of the each entity in a specific OTG strategy. The process is to collect responses from the corresponding stakeholders involved in the investment decision making. The stakeholder responses for each OTG strategy are considered as the sub-criteria. Further, the OTG strategies are assigned weights (1-10) by the stakeholders with exclusive being the highest weight and very limited being the least weight (sub-sub-criteria). The final subcomponent is the alternatives (public, private, and the user), on how they are associated with each OTG strategy.
Fig. 5. Hierarchical System for Multi-objective Decision Making
Goal: Role of Public, Private, and User in OTG Strategies
Private Stakeholders
ExclusiveMajor
ModerateLimited
Very Limited
Public Stakeholders Users Stakeholders
OTG-1 OTG-2 OTG-3 OTG-4 OTG-5
Exclusive Moderate Limited
Goal
Criteria
Sub Criteria
Sub Sub Criteria
Alternatives
Private Stakeholders
OTG-1
Private Public User
Limited Major Moderate
User Stakeholders
OTG-3
Private Public UserAlternatives
24
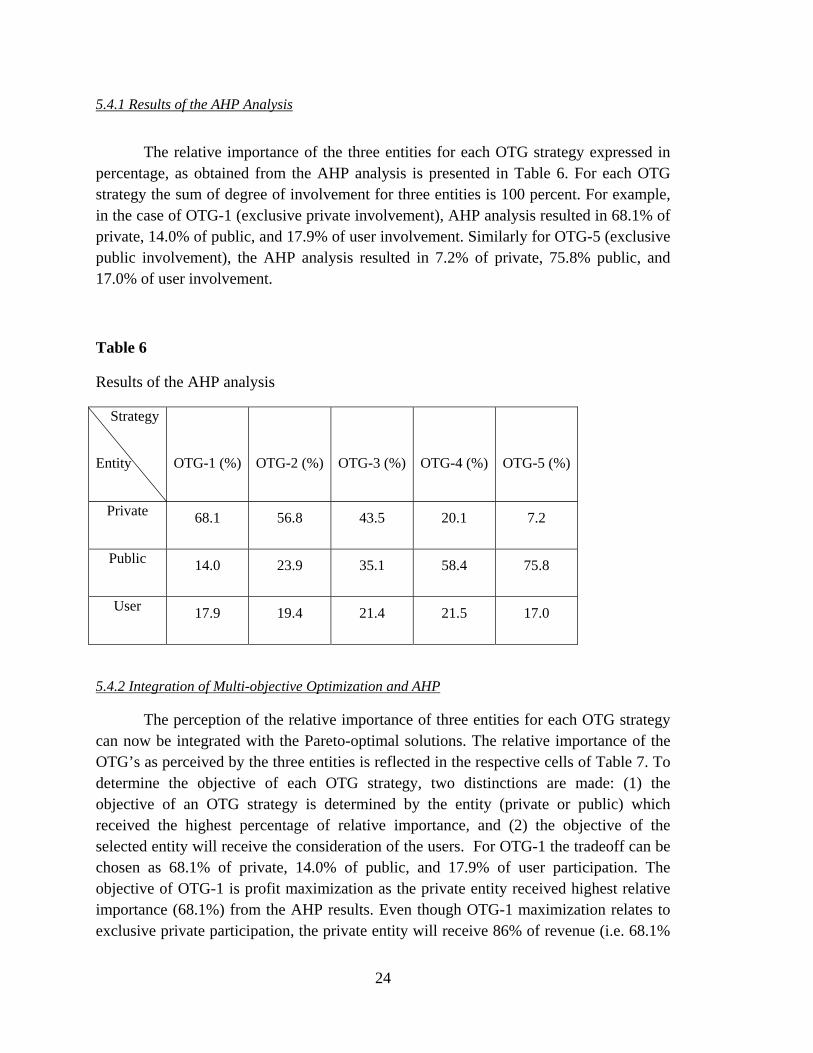
5.4.1 Results of the AHP Analysis
The relative importance of the three entities for each OTG strategy expressed in percentage, as obtained from the AHP analysis is presented in Table 6. For each OTG strategy the sum of degree of involvement for three entities is 100 percent. For example, in the case of OTG-1 (exclusive private involvement), AHP analysis resulted in 68.1% of private, 14.0% of public, and 17.9% of user involvement. Similarly for OTG-5 (exclusive public involvement), the AHP analysis resulted in 7.2% of private, 75.8% public, and 17.0% of user involvement.
5.4.2 Integration of Multi-objective Optimization and AHP
The perception of the relative importance of three entities for each OTG strategy can now be integrated with the Pareto-optimal solutions. The relative importance of the OTG’s as perceived by the three entities is reflected in the respective cells of Table 7. To determine the objective of each OTG strategy, two distinctions are made: (1) the objective of an OTG strategy is determined by the entity (private or public) which received the highest percentage of relative importance, and (2) the objective of the selected entity will receive the consideration of the users. For OTG-1 the tradeoff can be chosen as 68.1% of private, 14.0% of public, and 17.9% of user participation. The objective of OTG-1 is profit maximization as the private entity received highest relative importance (68.1%) from the AHP results. Even though OTG-1 maximization relates to exclusive private participation, the private entity will receive 86% of revenue (i.e. 68.1%
25
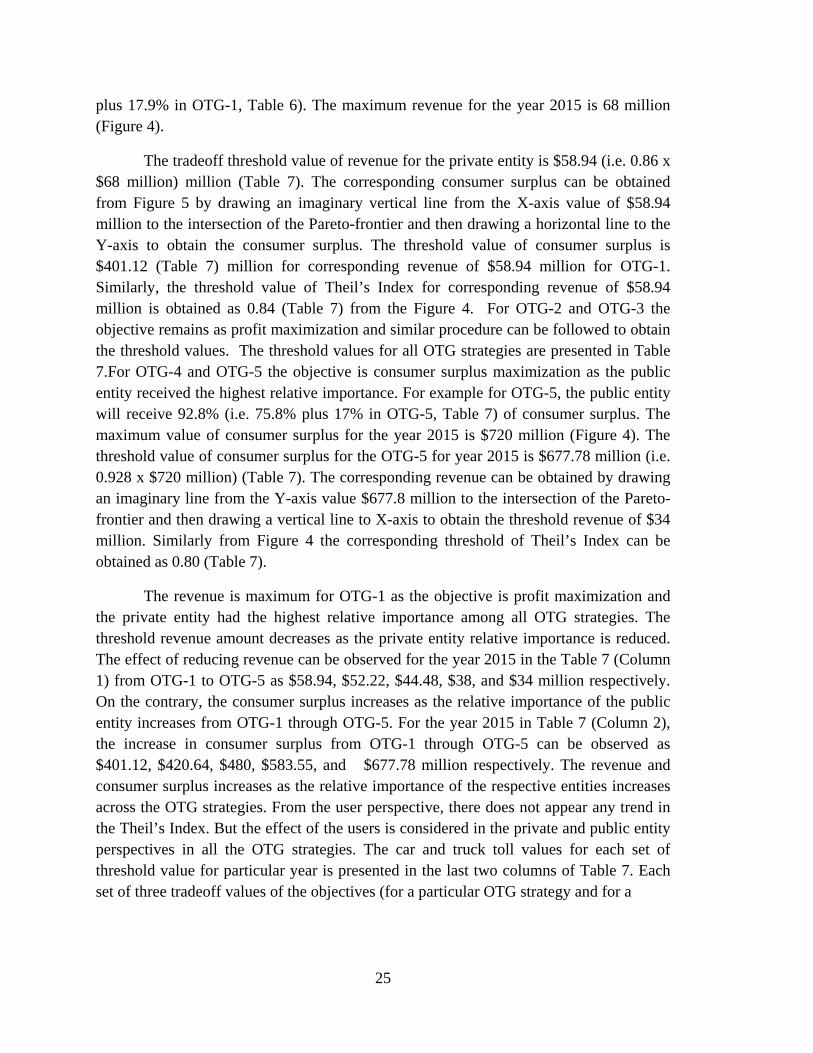
plus 17.9% in OTG-1, Table 6). The maximum revenue for the year 2015 is 68 million (Figure 4).
The tradeoff threshold value of revenue for the private entity is $58.94 (i.e. 0.86 x $68 million) million (Table 7). The corresponding consumer surplus can be obtained from Figure 5 by drawing an imaginary vertical line from the X-axis value of $58.94 million to the intersection of the Pareto-frontier and then drawing a horizontal line to the Y-axis to obtain the consumer surplus. The threshold value of consumer surplus is $401.12 (Table 7) million for corresponding revenue of $58.94 million for OTG-1. Similarly, the threshold value of Theil’s Index for corresponding revenue of $58.94 million is obtained as 0.84 (Table 7) from the Figure 4. For OTG-2 and OTG-3 the objective remains as profit maximization and similar procedure can be followed to obtain the threshold values. The threshold values for all OTG strategies are presented in Table 7.For OTG-4 and OTG-5 the objective is consumer surplus maximization as the public entity received the highest relative importance. For example for OTG-5, the public entity will receive 92.8% (i.e. 75.8% plus 17% in OTG-5, Table 7) of consumer surplus. The maximum value of consumer surplus for the year 2015 is $720 million (Figure 4). The threshold value of consumer surplus for the OTG-5 for year 2015 is $677.78 million (i.e. 0.928 x $720 million) (Table 7). The corresponding revenue can be obtained by drawing an imaginary line from the Y-axis value $677.8 million to the intersection of the Pareto-frontier and then drawing a vertical line to X-axis to obtain the threshold revenue of $34 million. Similarly from Figure 4 the corresponding threshold of Theil’s Index can be obtained as 0.80 (Table 7).
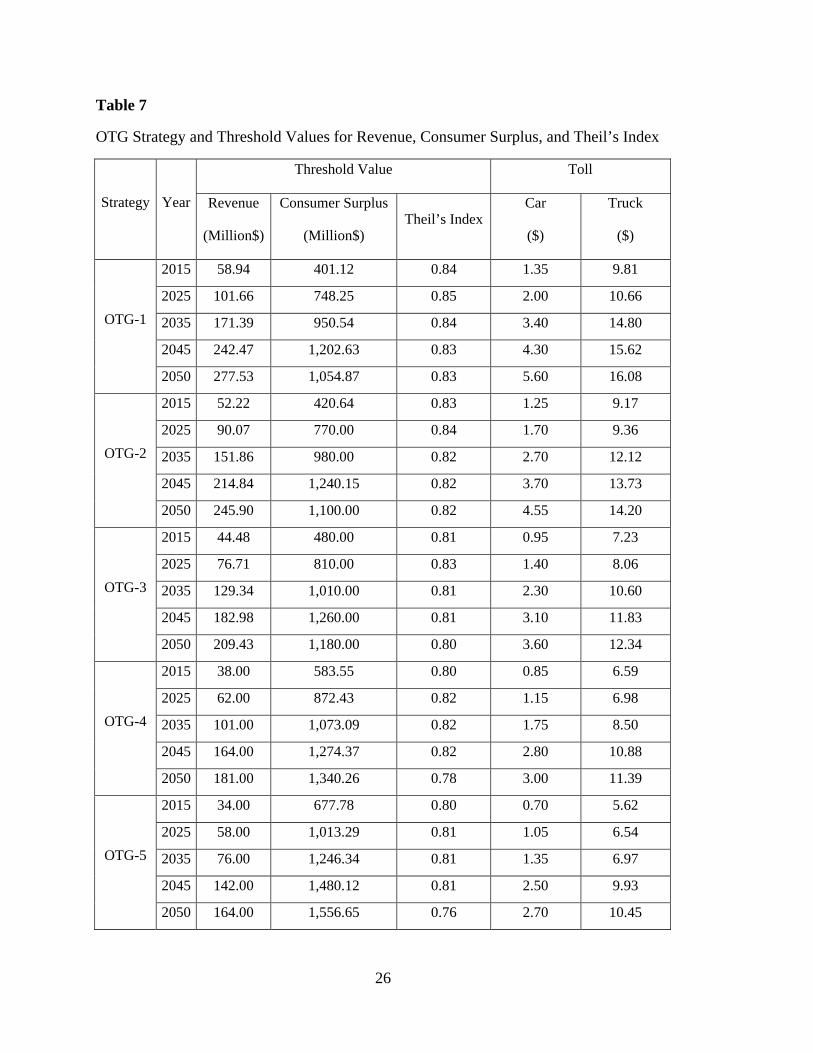
The revenue is maximum for OTG-1 as the objective is profit maximization and the private entity had the highest relative importance among all OTG strategies. The threshold revenue amount decreases as the private entity relative importance is reduced. The effect of reducing revenue can be observed for the year 2015 in the Table 7 (Column 1) from OTG-1 to OTG-5 as $58.94, $52.22, $44.48, $38, and $34 million respectively. On the contrary, the consumer surplus increases as the relative importance of the public entity increases from OTG-1 through OTG-5. For the year 2015 in Table 7 (Column 2), the increase in consumer surplus from OTG-1 through OTG-5 can be observed as $401.12, $420.64, $480, $583.55, and $677.78 million respectively. The revenue and consumer surplus increases as the relative importance of the respective entities increases across the OTG strategies. From the user perspective, there does not appear any trend in the Theil’s Index. But the effect of the users is considered in the private and public entity perspectives in all the OTG strategies. The car and truck toll values for each set of threshold value for particular year is presented in the last two columns of Table 7. Each set of three tradeoff values of the objectives (for a particular OTG strategy and for a
26
Table 7
OTG Strategy and Threshold Values for Revenue, Consumer Surplus, and Theil’s Index
Strategy Year
Threshold Value Toll
Revenue
(Million$)
Consumer Surplus
(Million$) Theil’s Index
Car
($)
Truck
($)
OTG-1
2015 58.94 401.12 0.84 1.35 9.81
2025 101.66 748.25 0.85 2.00 10.66
2035 171.39 950.54 0.84 3.40 14.80
2045 242.47 1,202.63 0.83 4.30 15.62
2050 277.53 1,054.87 0.83 5.60 16.08
OTG-2
2015 52.22 420.64 0.83 1.25 9.17
2025 90.07 770.00 0.84 1.70 9.36
2035 151.86 980.00 0.82 2.70 12.12
2045 214.84 1,240.15 0.82 3.70 13.73
2050 245.90 1,100.00 0.82 4.55 14.20
OTG-3
2015 44.48 480.00 0.81 0.95 7.23
2025 76.71 810.00 0.83 1.40 8.06
2035 129.34 1,010.00 0.81 2.30 10.60
2045 182.98 1,260.00 0.81 3.10 11.83
2050 209.43 1,180.00 0.80 3.60 12.34
OTG-4
2015 38.00 583.55 0.80 0.85 6.59
2025 62.00 872.43 0.82 1.15 6.98
2035 101.00 1,073.09 0.82 1.75 8.50
2045 164.00 1,274.37 0.82 2.80 10.88
2050 181.00 1,340.26 0.78 3.00 11.39
OTG-5
2015 34.00 677.78 0.80 0.70 5.62
2025 58.00 1,013.29 0.81 1.05 6.54
2035 76.00 1,246.34 0.81 1.35 6.97
2045 142.00 1,480.12 0.81 2.50 9.93
2050 164.00 1,556.65 0.76 2.70 10.45
27
particular year) obtained from MOO and AHP analysis, are functions of the car and truck toll values. Specific toll values are estimated once the tradeoff objectives were known.
5.4.3. Feasibility Analysis from AHP Results
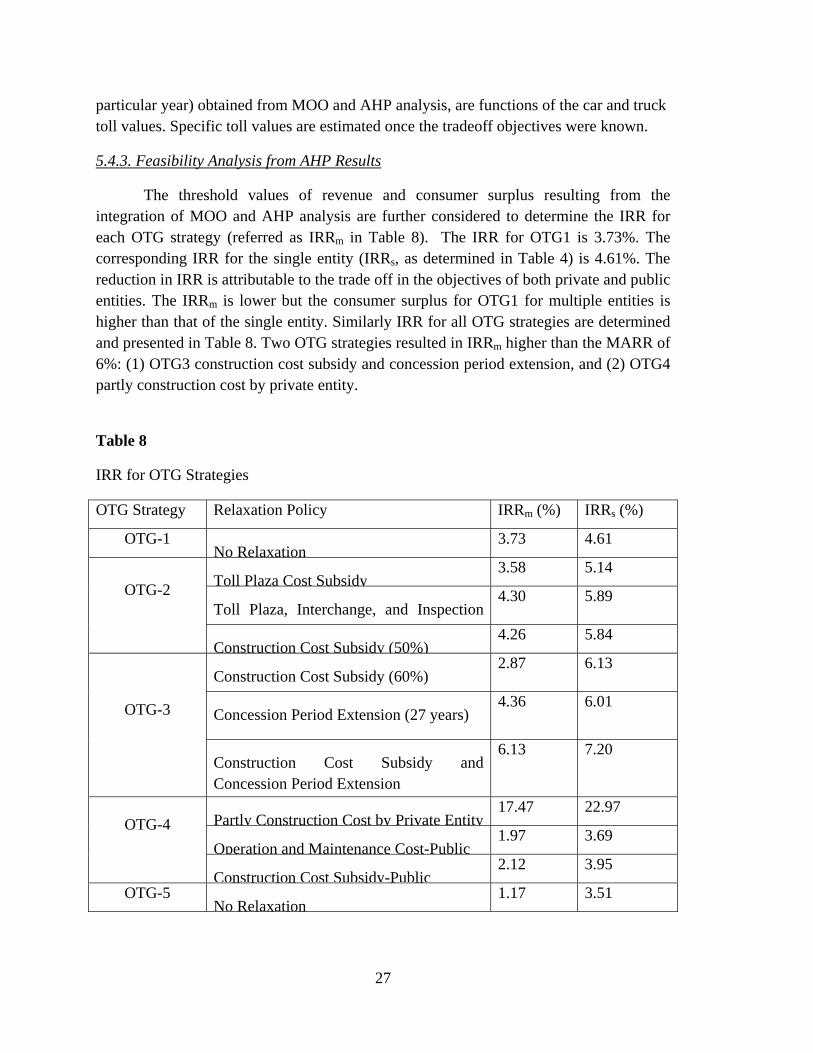
The threshold values of revenue and consumer surplus resulting from the integration of MOO and AHP analysis are further considered to determine the IRR for each OTG strategy (referred as IRRm in Table 8). The IRR for OTG1 is 3.73%. The corresponding IRR for the single entity (IRRs, as determined in Table 4) is 4.61%. The reduction in IRR is attributable to the trade off in the objectives of both private and public entities. The IRRm is lower but the consumer surplus for OTG1 for multiple entities is higher than that of the single entity. Similarly IRR for all OTG strategies are determined and presented in Table 8. Two OTG strategies resulted in IRRm higher than the MARR of 6%: (1) OTG3 construction cost subsidy and concession period extension, and (2) OTG4 partly construction cost by private entity.
Table 8
IRR for OTG Strategies
OTG Strategy Relaxation Policy IRRm (%) IRRs (%)
OTG-1 No Relaxation
3.73 4.61
OTG-2 Toll Plaza Cost Subsidy
3.58 5.14
Toll Plaza, Interchange, and Inspection 4.30 5.89
Construction Cost Subsidy (50%)4.26 5.84
OTG-3
Construction Cost Subsidy (60%) 2.87 6.13
Concession Period Extension (27 years) 4.36 6.01
Construction Cost Subsidy and Concession Period Extension
6.13 7.20
OTG-4 Partly Construction Cost by Private Entity17.47 22.97
Operation and Maintenance Cost-Public1.97 3.69
Construction Cost Subsidy-Public2.12 3.95
OTG-5 No Relaxation
1.17 3.51
28
6. Conclusion
The primary goal of this paper is to develop a framework for large scale transportation infrastructure investment that incorporates the following: (1) determine the entities involved in decision making and their individual objectives, and (2) combine the objective of all entities, and (3) apply the framework in a real world case study to augment the decision making process. The entities often involved in large-scale infrastructure investment decision can be the private, the public, and the user community, each with a different set of objectives and expectations such as profit maximization, consumer surplus maximization and inequality minimization, respectively. Often the objectives of these entities are analyzed separately, while all the entities involved in a project with defined roles. A MOO procedure is proposed, which attempts to incorporate the objective of all the entities involved in the decision making process.
The MOO process can be considered as a bi-level process. The upper level consists of the objective of the entities (decision-makers), while the lower level represents an elastic traffic assignment problem (user-behavior). A set of joint OTG scenarios are created considering the multi entity operation of the transportation facilities. For some OTG strategies, relaxation policies are proposed to ensure feasibility of the project. The IRR is considered as the measure of feasibility of analysis for OTG strategies.
The MOO process resulted in Pareto-optimal solutions as a tradeoff between multiple entities. As opposed to a single optimal solution, the MOO offers a number of non-dominated solutions represented in the Pareto-frontier to be considered by the multiple entities. The preferences of multiple entities are embedded in the form of OTG strategies and the relative importance of the entities is determined in the form of a multi objective decision making through a questionnaire survey. The survey was conducted among transportation professionals and stakeholders who were asked to respond to the questionnaire with relative importance of entities involved in each OTG strategy. The survey responses are analyzed in AHP and the relative importance was determined. The AHP results were integrated with the Pareto-optimal solutions obtained from MOO analysis and corresponding trade off optimal values were determined for each OTG strategy. The feasibility of each OTG strategy is determined from multi entity perspectives and the results were compared to that of the single entity.
The MOO framework may be used by transportation and financing professionals involved in infrastructure investment decisions. Such professionals include: engineers/planners/economists, investment and cost analysts involved both in private and public financing of infrastructure projects. Typically, economic analysis of infrastructure projects is based upon the assumption of single entities and in reality there are multiple entities involved each with different set of objectives. The framework is applied to study the investment decision making of DRIC connecting US, and Canada; a project in the planning stage for over ten years. Results of the case study indicate that the framework presented is viable; however additional research is needed to expand on the proposed
29
research to incorporate additional entities, and more uncertain variable in the multi-objective framework.
7. Acknowledgement This research was supported by the U.S. Department of Transportation (USDOT) through its University Transportation Center (UTC) program. The authors would like to thank the USDOT and the University of Toledo for supporting this research through the UTC program, and Wayne State University (WSU) for providing crucial matching support. The authors would like to acknowledge the assistance of Michigan Department of Transportation (MDOT) and Southeast Michigan Council of Governments (SEMCOG) for their assistance during the course of the study. The comments and opinions expressed in this report are entirely those of the authors, and do not necessarily reflect the programs and policies of any of the agencies mentioned above.
8. References
Abbas, M.M. & Sharma, A., 2006. Multiobjective Plan Selection Optimization for Traffic Responsive Control. Journal of Transportation Engineering, 132, p.376.
Doerner, K.F. et al., 2006. Pareto ant colony optimization with ILP preprocessing in multiobjective project portfolio selection. European Journal of Operational Research, 171(3), pp.830–841.
Ehrgott, M. & Gandibleux, X., 2000. A survey and annotated bibliography of multiobjective combinatorial optimization. OR Spectrum, 22(4), pp.425–460.
Fan, W. & Machemehl, R.B., 2006. Optimal transit route network design problem with variable transit demand: genetic algorithm approach. Journal of transportation engineering, 132, p.40.
30
Ghoseiri, K., Szidarovszky, F. & Asgharpour, M.J., 2004. A multi-objective train scheduling model and solution. Transportation Research Part B: Methodological, 38(10), pp.927–952.
Isermann, H., 1979. The enumeration of all efficient solutions for a linear multiple-objective transportation problem. Naval Research Logistics Quarterly, 26(1).
Johnson, C., Luby, M.J. & Kurbanov, S.., 2007. Toll Road Privatization Transactions: The Chicago Skyway and Indiana Toll Road.
Khasnabis, S., Mishra, S. & Swain, S., 2010. Developing and Testing a Framework for Alternative Ownership, Tenure, and Governance Strategies for the Proposed Detroit-Windsor River Crossing, Prepared for the University of Toledo University Transportation Center, U.S. Department of Transportation. Available at: http://www.utoledo.edu/re...UTUTC-IU-9_FinalReport.pdf.
Khasnabis, S., Mishra, S., Safi, S., and Brinkman, A. (2007). A Framework for Analyzing the Ownership, Tenure and Governance Issues for a Proposed International River Crossing. Presented in 11th World Conference in Transport Research, University of California, Berkeley, USA.
Knight, F.H., 1921. Risk, Uncertainty andProfit. New York: AM Kelley.
Lee, H. & Pulat, P.S., 1991. Bicriteria network flow problems: Continuous case. European Journal of Operational Research, 51(1), pp.119–126.
Lee, J.W. & Kim, S.H., 2001. An integrated approach for interdependent information system project selection. International Journal of Project Management, 19(2), pp.111–118.
MDOT, 2003. Canada-U.S.-Ontario-Michigan Transportation Partnership Planning/Need and Feasibility Study: feasible Transportation Alternatives Working Paper.
MDOT, 2008. Final Environmental Impact Statement and Final Section 4(f) Evaluation: The Detroit River International Crossing Study.
Meng, Q., Lee, D.H. & Cheu, R.L., 2005. Multiobjective vehicle routing and scheduling problem with time window constraints in hazardous material transportation. Journal of transportation engineering, 131, p.699.
Mishra, S., Khasnabis, S. & Swain, S., 2011. An Approach to Incorporate Uncertainty and Risk in Transportation Investment Decision Making: Detroit River International Crossing Case Study. In 90th Annual Meeting of Transportation Research Board. 90th Annual Meeting of Transportation Research Board. Washington DC.
Ringuest, J.L. & Graves, S.B., 1989. The linear multi-objective R&D project selection problem. IEEE Transactions on Engineering Management, 36(1), pp.54–57.
Roth, G., 1996. Roads in a market economy, Avebury Technical.
Saaty, T.L., 1995. Decision making for leaders, RWS publications Pittsburgh, PA.
Santhanam, R. & Kyparisis, J., 1995. A multiple criteria decision model for information system project selection. Computers and Operations Research, 22(8), pp.807–818.
Srinivasan, V. & Thompson, G.L., 1976. Algorithms for minimizing total cost, bottleneck time and bottleneck shipment in transportation problems. Naval Research Logistics Quarterly, 23(4).
Theil, H., 1967. Economics and Information Theory, Rand McNally.
USDOT, 2006. Manual for Using Public Private Partnerships on Highway Projects.
Wohl, M. & Hendrickson, C., 1984. Transportation Investment and Pricing Principles. John Wiley&Sons.
Yang, H. & Meng, Q., 2000. Highway pricing and capacity choice in a road network under a build–operate–transfer scheme. Transportation Research Part A, 34(3), pp.207–222.