Multi-performance seismic design through an enhanced first-storey isolation system Michele Palermo ⇑ , Ilaria Ricci, Stefano Gagliardi, Stefano Silvestri, Tomaso Trombetti, Giada Gasparini Department DICAM, University of Bologna, Viale Risorgimento 2, 40136 Bologna, Italy article info Article history: Received 18 July 2012 Revised 30 October 2013 Accepted 4 November 2013 Keywords: First-storey seismic isolation Performance based design Capacity spectrum method Crescent shaped braces abstract In this paper the idea of the ‘‘shock-absorbing soft storey concept’’, originally proposed at the end of 1960s by Fintel and Khan, is reviewed and developed within the framework of performance based seismic design. The purpose is to conceive a first-storey isolated building capable of satisfying selected seismic performance objectives. Among all the possible solutions, in this study the seismic story isolation is obtained through the insertion (only at the bottom level of the building) of special hysteretic devices, which are specifically designed in order to satisfy the prefixed seismic performance objectives. Without loss of generality, this design approach is fully detailed with reference to the specific case study of a five- storey steel frame building. The performances of the building under multiple earthquake design levels are finally verified through non-linear time-history analyses whose results confirm the effectiveness of the proposed approach. Ó 2013 Published by Elsevier Ltd. 1. Introduction The design of building structures capable of providing pre- scribed seismic performances is the fundamental objective of the Performance Based Seismic Design (PBSD) approach [1,2]. The bases of the PBSD lie in the capacity of defining and satisfying a plurality of performance objectives [2], i.e. in the capacity of pre- dicting that a given structural system will perform in a selected manner (i.e. performance level) under a given seismic intensity (i.e. earthquake design level). Typically, the traditional seismic design of the structures is car- ried out using a Force Based Design approach (FBD, borrowed from the common approach for static design). Moreover, the load-bear- ing system (designed for vertical loads) typically withstands also the horizontal loads (i.e. it accomplishes the function of the hori- zontal resisting system). In such a way, the same structural system acts for both vertical and horizontal actions and therefore cannot be designed in an ‘‘optimized way’’. Nonetheless, the dynamic re- sponse of the whole system is somehow passively evaluated and not ‘‘governed’’ by the designer. On the other hand, in the last decades, several contributions in the field of earthquake engineering introduced new design ap- proaches in order to provide the structural system able to behave in a prescribed way under an earthquake of a given intensity. Among others, the most remarkable are: (i) the PBSD approach [1,2] that, as mentioned before, formalized the need of satisfying a multiplicity of performance objectives, (ii) the Direct Displace- ment Based Design (DDBD) [3] that introduced the displacement analysis as a tool for seismic design of structures, (iii) the Capacity Spectrum Method (CSM) [4,5] that is a graphical design represen- tation which allows to compare the ‘‘capacity of a structure to re- sist lateral forces to the demands of earthquake response spectra in a graphical presentation that allows a visual evaluation of how the structure will perform when subjected to earthquake ground mo- tion’’ [5]; (iv) the use of dissipative devices (e.g. unbonded braces, dampers, ... [6]) or seismic isolators [7] adopted for the mitigation of the seismic effects upon the structure, that may lead to a more easy conceptual separation between the horizontal and vertical resisting systems; (v) the soft storey conceptual design for earth- quake-resistant structures can be achieved ‘‘by designing a shock-absorbing soft storey’’ upon which the structure will remain within the elastic range, so that high intensity earthquake motions are confined ‘‘to controlled areas in the lower part of the building’’ [8]. Even if all these contributions are well consolidated among the scientific community, in the scientific literature an overall design approach which combines the above-cited contributions is not present. This paper presents an approach for a full-con- trolled optimized seismic design of structures which applies the original idea of the soft storey seismic isolation within the framework of the performance based seismic design. In detail, for sake of clearness but without loss of generality, the seismic design approach will be fully developed with reference to a spe- cific case study. 0141-0296/$ - see front matter Ó 2013 Published by Elsevier Ltd. http://dx.doi.org/10.1016/j.engstruct.2013.11.002 ⇑ Corresponding author. Tel.: +39 0512093232; fax: +39 0512093236. E-mail address: [email protected](M. Palermo). Engineering Structures 59 (2014) 495–506 Contents lists available at ScienceDirect Engineering Structures journal homepage: www.elsevier.com/locate/engstruct
Article history:Received 18 July 2012Revised 30 October 2013Accepted 4 November 2013
Keywords:First-storey seismic isolationPerformance based designCapacity spectrum methodCrescent shaped braces
a b s t r a c t
In this paper the idea of the ‘‘shock-absorbing soft storey concept’’, originally proposed at the end of1960s by Fintel and Khan, is reviewed and developed within the framework of performance based seismicdesign. The purpose is to conceive a first-storey isolated building capable of satisfying selected seismicperformance objectives. Among all the possible solutions, in this study the seismic story isolation isobtained through the insertion (only at the bottom level of the building) of special hysteretic devices,which are specifically designed in order to satisfy the prefixed seismic performance objectives. Withoutloss of generality, this design approach is fully detailed with reference to the specific case study of a five-storey steel frame building. The performances of the building under multiple earthquake design levels arefinally verified through non-linear time-history analyses whose results confirm the effectiveness of theproposed approach.
� 2013 Published by Elsevier Ltd.
1. Introduction
The design of building structures capable of providing pre-scribed seismic performances is the fundamental objective of thePerformance Based Seismic Design (PBSD) approach [1,2]. Thebases of the PBSD lie in the capacity of defining and satisfying aplurality of performance objectives [2], i.e. in the capacity of pre-dicting that a given structural system will perform in a selectedmanner (i.e. performance level) under a given seismic intensity(i.e. earthquake design level).
Typically, the traditional seismic design of the structures is car-ried out using a Force Based Design approach (FBD, borrowed fromthe common approach for static design). Moreover, the load-bear-ing system (designed for vertical loads) typically withstands alsothe horizontal loads (i.e. it accomplishes the function of the hori-zontal resisting system). In such a way, the same structural systemacts for both vertical and horizontal actions and therefore cannotbe designed in an ‘‘optimized way’’. Nonetheless, the dynamic re-sponse of the whole system is somehow passively evaluated andnot ‘‘governed’’ by the designer.
On the other hand, in the last decades, several contributions inthe field of earthquake engineering introduced new design ap-proaches in order to provide the structural system able to behavein a prescribed way under an earthquake of a given intensity.Among others, the most remarkable are: (i) the PBSD approach
[1,2] that, as mentioned before, formalized the need of satisfyinga multiplicity of performance objectives, (ii) the Direct Displace-ment Based Design (DDBD) [3] that introduced the displacementanalysis as a tool for seismic design of structures, (iii) the CapacitySpectrum Method (CSM) [4,5] that is a graphical design represen-tation which allows to compare the ‘‘capacity of a structure to re-sist lateral forces to the demands of earthquake response spectra ina graphical presentation that allows a visual evaluation of how thestructure will perform when subjected to earthquake ground mo-tion’’ [5]; (iv) the use of dissipative devices (e.g. unbonded braces,dampers, . . . [6]) or seismic isolators [7] adopted for the mitigationof the seismic effects upon the structure, that may lead to a moreeasy conceptual separation between the horizontal and verticalresisting systems; (v) the soft storey conceptual design for earth-quake-resistant structures can be achieved ‘‘by designing ashock-absorbing soft storey’’ upon which the structure will remainwithin the elastic range, so that high intensity earthquake motionsare confined ‘‘to controlled areas in the lower part of the building’’[8].
Even if all these contributions are well consolidated amongthe scientific community, in the scientific literature an overalldesign approach which combines the above-cited contributionsis not present. This paper presents an approach for a full-con-trolled optimized seismic design of structures which applies theoriginal idea of the soft storey seismic isolation within theframework of the performance based seismic design. In detail,for sake of clearness but without loss of generality, the seismicdesign approach will be fully developed with reference to a spe-cific case study.
Fig. 1. Performance based seismic design objectives.
496 M. Palermo et al. / Engineering Structures 59 (2014) 495–506
2. Background
2.1. The concept of shock-absorbing soft storey
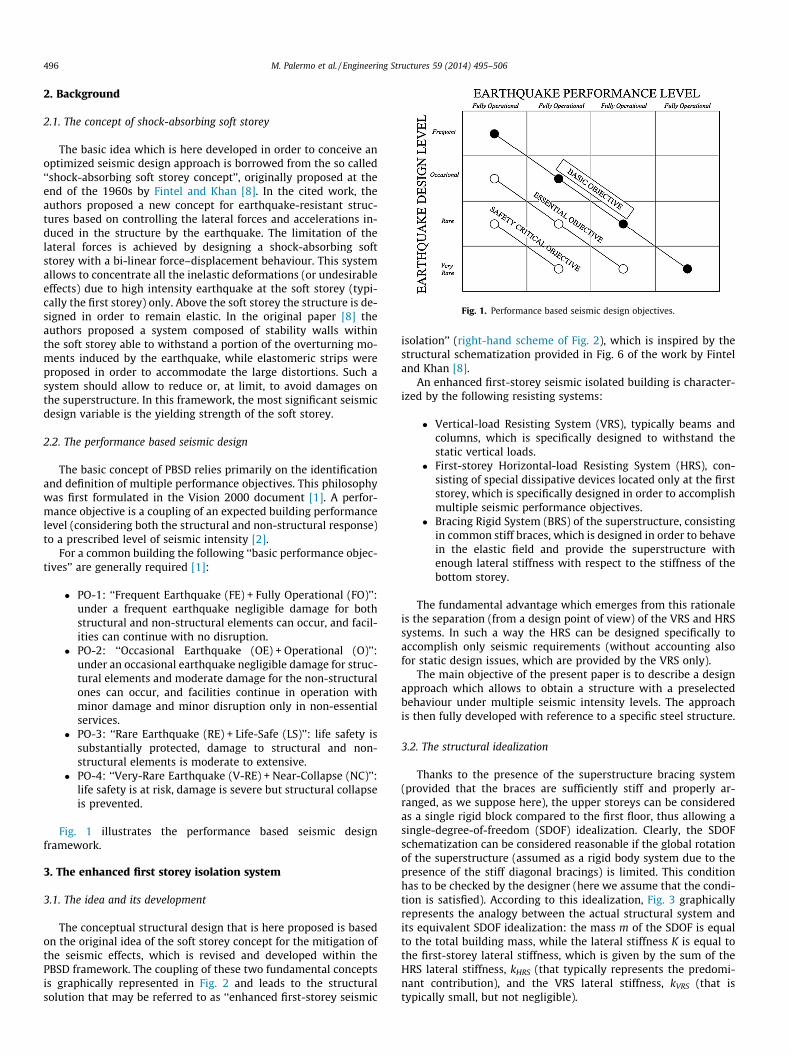
The basic idea which is here developed in order to conceive anoptimized seismic design approach is borrowed from the so called‘‘shock-absorbing soft storey concept’’, originally proposed at theend of the 1960s by Fintel and Khan [8]. In the cited work, theauthors proposed a new concept for earthquake-resistant struc-tures based on controlling the lateral forces and accelerations in-duced in the structure by the earthquake. The limitation of thelateral forces is achieved by designing a shock-absorbing softstorey with a bi-linear force–displacement behaviour. This systemallows to concentrate all the inelastic deformations (or undesirableeffects) due to high intensity earthquake at the soft storey (typi-cally the first storey) only. Above the soft storey the structure is de-signed in order to remain elastic. In the original paper [8] theauthors proposed a system composed of stability walls withinthe soft storey able to withstand a portion of the overturning mo-ments induced by the earthquake, while elastomeric strips wereproposed in order to accommodate the large distortions. Such asystem should allow to reduce or, at limit, to avoid damages onthe superstructure. In this framework, the most significant seismicdesign variable is the yielding strength of the soft storey.
2.2. The performance based seismic design
The basic concept of PBSD relies primarily on the identificationand definition of multiple performance objectives. This philosophywas first formulated in the Vision 2000 document [1]. A perfor-mance objective is a coupling of an expected building performancelevel (considering both the structural and non-structural response)to a prescribed level of seismic intensity [2].
For a common building the following ‘‘basic performance objec-tives’’ are generally required [1]:
� PO-1: ‘‘Frequent Earthquake (FE) + Fully Operational (FO)’’:under a frequent earthquake negligible damage for bothstructural and non-structural elements can occur, and facil-ities can continue with no disruption.
� PO-2: ‘‘Occasional Earthquake (OE) + Operational (O)’’:under an occasional earthquake negligible damage for struc-tural elements and moderate damage for the non-structuralones can occur, and facilities continue in operation withminor damage and minor disruption only in non-essentialservices.
� PO-3: ‘‘Rare Earthquake (RE) + Life-Safe (LS)’’: life safety issubstantially protected, damage to structural and non-structural elements is moderate to extensive.
� PO-4: ‘‘Very-Rare Earthquake (V-RE) + Near-Collapse (NC)’’:life safety is at risk, damage is severe but structural collapseis prevented.
Fig. 1 illustrates the performance based seismic designframework.
3. The enhanced first storey isolation system
3.1. The idea and its development
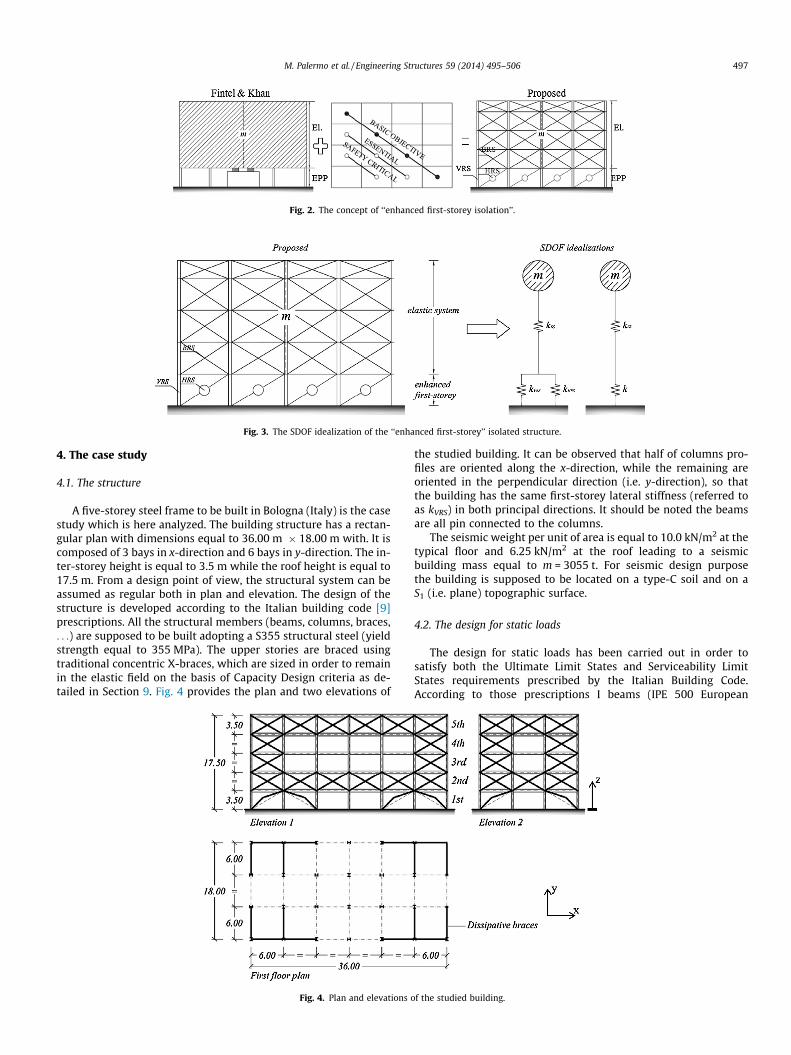
The conceptual structural design that is here proposed is basedon the original idea of the soft storey concept for the mitigation ofthe seismic effects, which is revised and developed within thePBSD framework. The coupling of these two fundamental conceptsis graphically represented in Fig. 2 and leads to the structuralsolution that may be referred to as ‘‘enhanced first-storey seismic
isolation’’ (right-hand scheme of Fig. 2), which is inspired by thestructural schematization provided in Fig. 6 of the work by Finteland Khan [8].
An enhanced first-storey seismic isolated building is character-ized by the following resisting systems:
� Vertical-load Resisting System (VRS), typically beams andcolumns, which is specifically designed to withstand thestatic vertical loads.
� First-storey Horizontal-load Resisting System (HRS), con-sisting of special dissipative devices located only at the firststorey, which is specifically designed in order to accomplishmultiple seismic performance objectives.
� Bracing Rigid System (BRS) of the superstructure, consistingin common stiff braces, which is designed in order to behavein the elastic field and provide the superstructure withenough lateral stiffness with respect to the stiffness of thebottom storey.
The fundamental advantage which emerges from this rationaleis the separation (from a design point of view) of the VRS and HRSsystems. In such a way the HRS can be designed specifically toaccomplish only seismic requirements (without accounting alsofor static design issues, which are provided by the VRS only).
The main objective of the present paper is to describe a designapproach which allows to obtain a structure with a preselectedbehaviour under multiple seismic intensity levels. The approachis then fully developed with reference to a specific steel structure.
3.2. The structural idealization
Thanks to the presence of the superstructure bracing system(provided that the braces are sufficiently stiff and properly ar-ranged, as we suppose here), the upper storeys can be consideredas a single rigid block compared to the first floor, thus allowing asingle-degree-of-freedom (SDOF) idealization. Clearly, the SDOFschematization can be considered reasonable if the global rotationof the superstructure (assumed as a rigid body system due to thepresence of the stiff diagonal bracings) is limited. This conditionhas to be checked by the designer (here we assume that the condi-tion is satisfied). According to this idealization, Fig. 3 graphicallyrepresents the analogy between the actual structural system andits equivalent SDOF idealization: the mass m of the SDOF is equalto the total building mass, while the lateral stiffness K is equal tothe first-storey lateral stiffness, which is given by the sum of theHRS lateral stiffness, kHRS (that typically represents the predomi-nant contribution), and the VRS lateral stiffness, kVRS (that istypically small, but not negligible).
Fig. 2. The concept of ‘‘enhanced first-storey isolation’’.
Fig. 3. The SDOF idealization of the ‘‘enhanced first-storey’’ isolated structure.
M. Palermo et al. / Engineering Structures 59 (2014) 495–506 497
4. The case study
4.1. The structure
A five-storey steel frame to be built in Bologna (Italy) is the casestudy which is here analyzed. The building structure has a rectan-gular plan with dimensions equal to 36.00 m � 18.00 m with. It iscomposed of 3 bays in x-direction and 6 bays in y-direction. The in-ter-storey height is equal to 3.5 m while the roof height is equal to17.5 m. From a design point of view, the structural system can beassumed as regular both in plan and elevation. The design of thestructure is developed according to the Italian building code [9]prescriptions. All the structural members (beams, columns, braces,. . .) are supposed to be built adopting a S355 structural steel (yieldstrength equal to 355 MPa). The upper stories are braced usingtraditional concentric X-braces, which are sized in order to remainin the elastic field on the basis of Capacity Design criteria as de-tailed in Section 9. Fig. 4 provides the plan and two elevations of
Fig. 4. Plan and elevations o
the studied building. It can be observed that half of columns pro-files are oriented along the x-direction, while the remaining areoriented in the perpendicular direction (i.e. y-direction), so thatthe building has the same first-storey lateral stiffness (referred toas kVRS) in both principal directions. It should be noted the beamsare all pin connected to the columns.
The seismic weight per unit of area is equal to 10.0 kN/m2 at thetypical floor and 6.25 kN/m2 at the roof leading to a seismicbuilding mass equal to m = 3055 t. For seismic design purposethe building is supposed to be located on a type-C soil and on aS1 (i.e. plane) topographic surface.
4.2. The design for static loads
The design for static loads has been carried out in order tosatisfy both the Ultimate Limit States and Serviceability LimitStates requirements prescribed by the Italian Building Code.According to those prescriptions I beams (IPE 500 European
f the studied building.
498 M. Palermo et al. / Engineering Structures 59 (2014) 495–506
profile) and double T columns (HE 400 B European profile) arerequired.
It should be noted that, even if the VRS is designed only for sta-tic loads, it is able to withstand also a portion of the horizontalloads. Therefore, the following expressions of the lateral stiffnessof the single column (in both the weak and strong direction) canbe derived (see [10] for additional details regarding the derivationof Eqs. (1) and (2)):
ki;VRS-strong ¼ 1:6 �EJstrong
h3 ¼ 4520 kN=m ð1Þ
ki;VRS-weak ¼ 1:6 � EJweak
h3 ¼ 808 kN=m ð2Þ
where E is the steel Young modulus, Jstrong and Jweak indicate the col-umn inertia along the strong and weak direction, respectively, h isthe column interstorey height.
If N indicates the number of columns placed at the first storey(in this specific case N = 28), the lateral stiffness of all columns atthe first storey (kVRS) is equal to:
kVRS ¼XN=2
i¼1
ki;VRS-strong þXN=2
i¼1
ki;VRS-weak ¼ 74592 kN=m ð3Þ
Fig. 5. The B–TC curve and its contributions.
5. The seismic design: overwiew
The main purpose of the seismic design approach here pre-sented lies in the definition of the so called ‘‘Building–TargetCapacity (B–TC) curve’’ and in its corresponding ‘‘Building–ActualCapacity (B–AC) curve’’. The B–TC curve is the graphical represen-tation of the idealized seismic behavior of the building that we ex-pect to achieve by imposing preselected multiple performanceobjectives, while the B–AC curve is the graphical representationof the effective seismic behavior of the building, once the structureis designed.
In the following sections the whole process of the seismic de-sign/verification approach is detailed. The steps of the processare as follows:
Step 1: Definition of the performance objectives and representa-tion of the B–TC curve.Step 2: Derivation of the ‘‘Horizontal Resisting System-TargetCapacity (HRS–TC) curve’’.Step 3: Design of the specific HRS system (i.e. representation of‘‘the Horizontal Resisting System-Actual Capacity (HRS–AC)curve’’).Step 4: Design of the Bracing Rigid System (BRS) of thesuperstructure.Step 5: Verification of the achievement of the selected perfor-mance objectives by means of non-linear time-history analyses.
6. Step 1: the building-target capacity curve
6.1. The global capacity curve of the building structure and itscontributions
The main objective of the proposed seismic design approach isto obtain the global capacity curve of the building structure onthe basis of the preselected seismic performance objectives. Aqualitative graphical representation of the capacity curve is pro-vided in Fig. 5. The bold curve represents the B–TC curve and isgiven by the following contributions:
� VRS–AC curve which represents the ‘‘actual’’ contribution (i.e.the lateral resisting contribution given by the members whichcompose the vertical resisting system, typically columns andbeams in the case of frame structures) provided by the verticalresisting system, which is designed for vertical loads but is alsoable to withstand a part of the lateral loads. This contribution(synthetically defined as V) is known once the VRS is designed.� HRS–TC curve which represent the ‘‘target’’ contribution pro-
vided by the horizontal resisting system. This contribution rep-resents the "design" variable (synthetically defined as D) of thedesign process.� P–D curve which represents the (negative) physical contribu-
tion (synthetically defined as P) due to P–D effects.
In symbols, the ordinates (indicated as O) of the B–TC curve areobtained as follows:
O ¼ Dþ V þ P ð4Þ
Note that in Eq. (4) the contribution given by P is negative.Clearly, once (i) the ordinates O are assigned from the perfor-
mance objectives, (ii) the vertical resisting system is designed,and (iii) the P-D effects are evaluated, then the HRS-TC curve canbe obtained as follows:
D ¼ O� V � P ð5Þ
It should be noted that, according to the proposed approach, from apractical point of view both VRS–AC and HRS–TC curves are ob-tained through a first order analyses. Moreover the importance ofthe P–D effects depend on the structural typology and is often ne-glected for the case of low-rise stiff structures. When P–D effectsare negligible Eq. (5) simplifies to:
D ¼ O� V ð6Þ
6.2. A simplified evaluation of P–D effects
Structural analysis under non-linear geometry requires, in con-trast to first order analysis, to evaluate the equilibrium in thedeformed configuration. The non-linear geometry of frame struc-tures is characterized by two effects: the non-linear intra elementgeometry effect, accounting for the displacement of the memberrelative to the chord, which is typically referred to as P–d (namelylittle P–delta), and the non-linear chord geometry effect, account-ing for the relative displacement at the end of the member. Anapproximation of the second effect is commonly referred to asP–D (namely big P–Delta).
Fig. 7. The I-order VRS–AC curve, the P–D curve and the effective VRS–AC curve.
M. Palermo et al. / Engineering Structures 59 (2014) 495–506 499
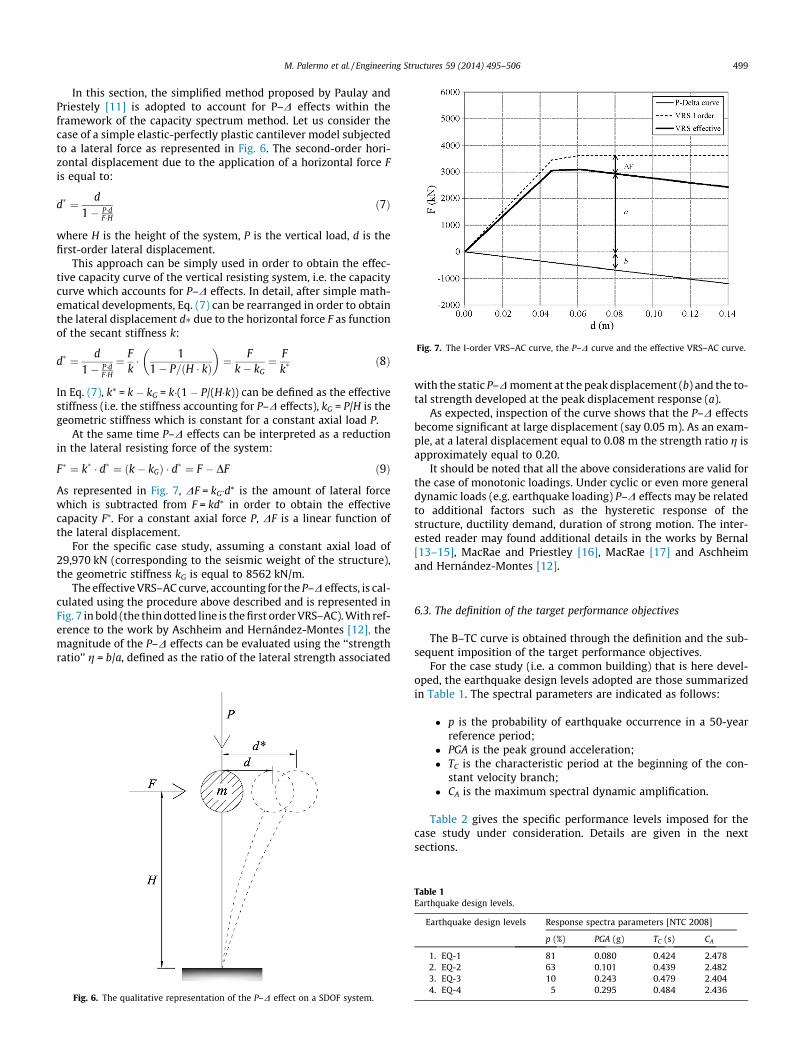
In this section, the simplified method proposed by Paulay andPriestely [11] is adopted to account for P–D effects within theframework of the capacity spectrum method. Let us consider thecase of a simple elastic-perfectly plastic cantilever model subjectedto a lateral force as represented in Fig. 6. The second-order hori-zontal displacement due to the application of a horizontal force Fis equal to:
d� ¼ d1� P�d
F�Hð7Þ
where H is the height of the system, P is the vertical load, d is thefirst-order lateral displacement.
This approach can be simply used in order to obtain the effec-tive capacity curve of the vertical resisting system, i.e. the capacitycurve which accounts for P–D effects. In detail, after simple math-ematical developments, Eq. (7) can be rearranged in order to obtainthe lateral displacement d� due to the horizontal force F as functionof the secant stiffness k:
d� ¼ d1� P�d
F�H¼ F
k� 1
1� P=ðH � kÞ
� �¼ F
k� kG¼ F
k�ð8Þ
In Eq. (7), k⁄ = k � kG = k�(1 � P/(H�k)) can be defined as the effectivestiffness (i.e. the stiffness accounting for P–D effects), kG = P/H is thegeometric stiffness which is constant for a constant axial load P.
At the same time P–D effects can be interpreted as a reductionin the lateral resisting force of the system:
F� ¼ k� � d� ¼ ðk� kGÞ � d� ¼ F � DF ð9Þ
As represented in Fig. 7, DF = kG�d⁄ is the amount of lateral forcewhich is subtracted from F = kd⁄ in order to obtain the effectivecapacity F⁄. For a constant axial force P, DF is a linear function ofthe lateral displacement.
For the specific case study, assuming a constant axial load of29,970 kN (corresponding to the seismic weight of the structure),the geometric stiffness kG is equal to 8562 kN/m.
The effective VRS–AC curve, accounting for the P–D effects, is cal-culated using the procedure above described and is represented inFig. 7 in bold (the thin dotted line is the first order VRS–AC). With ref-erence to the work by Aschheim and Hernández-Montes [12], themagnitude of the P–D effects can be evaluated using the ‘‘strengthratio’’ g = b/a, defined as the ratio of the lateral strength associated
Fig. 6. The qualitative representation of the P–D effect on a SDOF system.
with the static P–D moment at the peak displacement (b) and the to-tal strength developed at the peak displacement response (a).
As expected, inspection of the curve shows that the P–D effectsbecome significant at large displacement (say 0.05 m). As an exam-ple, at a lateral displacement equal to 0.08 m the strength ratio g isapproximately equal to 0.20.
It should be noted that all the above considerations are valid forthe case of monotonic loadings. Under cyclic or even more generaldynamic loads (e.g. earthquake loading) P–D effects may be relatedto additional factors such as the hysteretic response of thestructure, ductility demand, duration of strong motion. The inter-ested reader may found additional details in the works by Bernal[13–15], MacRae and Priestley [16], MacRae [17] and Aschheimand Hernández-Montes [12].
6.3. The definition of the target performance objectives
The B–TC curve is obtained through the definition and the sub-sequent imposition of the target performance objectives.
For the case study (i.e. a common building) that is here devel-oped, the earthquake design levels adopted are those summarizedin Table 1. The spectral parameters are indicated as follows:
� p is the probability of earthquake occurrence in a 50-yearreference period;
� PGA is the peak ground acceleration;� TC is the characteristic period at the beginning of the con-
stant velocity branch;� CA is the maximum spectral dynamic amplification.
Table 2 gives the specific performance levels imposed for thecase study under consideration. Details are given in the nextsections.
500 M. Palermo et al. / Engineering Structures 59 (2014) 495–506
6.4. Performance objective 1
The first performance objective can be obtained by limiting themaximum inter-storey drift under the earthquake design level 1:
d 6 d1 ð10Þ
For the specific case, assuming an inter-storey drift limitd1 ¼ 0:005, Eq. (9) leads to the following displacement limitation:
d 6 d1 � h ¼ d1 ¼ 0:017 m ð11Þ
where h is the height of the first-storey. Imposing Eq. (10) (i.e.d ¼ d1) allows to evaluate the initial effective lateral stiffness k�1 ofthe equivalent SDOF system. In detail, k�1 can be obtained by meansof the calculation of the ordinate of the displacement spectrumSd(T)1, according to the spectral shape defined by the Italian Build-ing Code, corresponding to the earthquake design level 1:
k�1 ¼m
4p2 �ðCA � PGA � TCÞ2
d21
¼ 172848 kN=m ð12Þ
which corresponds to the following initial effective natural periodT�:
T� ¼ 2p �ffiffiffiffiffimk�1
s¼ 0:83 s ð13Þ
The target initial lateral stiffness, k1 is equal to:
k1 ¼ k�1 þ kG ¼ 181410 kN=m ð14Þ
which corresponds to the following initial natural period T:
T ¼ 2p �ffiffiffiffiffimk1
r¼ 0:81 s ð15Þ
The effective lateral-resisting force at d1, referred to as F�1, isequal to 2938 kN, while the corresponding I-order lateral-resistingforce F1 is equal to 3084 kN. It should be noted that, for the initialtarget displacement, P–D effects could be neglected, provided theeffect in terms of stiffness and strength reduction is less than 5%.
6.5. Performance objective 2
The second performance objective can be obtained by imposingthat the structure reaches the elastic limit, Fy, under the earth-quake design level 2:
F 6 Fy ð16Þ
For the specific case study, Eq. (16) yields to:
F 6 Fy ¼ m � SaðTÞ2 ¼ 3960 kN ð17Þ
where Sa(T)2 indicates the ordinate of the spectral acceleration atthe natural period T of the equivalent SDOF system (Eq. (7)) corre-sponding to the earthquake design level 2. The corresponding dis-placement, i.e. the yielding displacement dy, is equal to 0.023 m.
Table 2Performance levels.
Description
Building performance level Mathematical condition
1. PO-1 No damage to non-structuralcomponents under EQ-1
d 6 d
1. PO-2 Negligible damage for structuralelements under EQ-2
F 6 Fy
3. PO-3 Significant structural damages,no collapse under EQ-3
l < l
4. PO-4 Incipient collapse under EQ-4 d < du
If the P–D effects are included, the effective yield strength, F�yresults to be equal to:
F�y ¼ Fy �k�
k¼ 3776 kN ð18Þ
6.6. Performance objective 3
The third performance objective can be obtained by imposing agiven excursion of the structure in the inelastic field, i.e. by impos-ing a certain target global structural ductility demand, l3 underthe earthquake design level 3. This condition corresponds to thefollowing displacement limitation:
d 6 dy � l3 ¼ d3 ð19Þ
For the specific case study, assuming a target ductility l3 ¼ 2:0(corresponding to a certain value of the equivalent damping ratio n,leading to a certain inelastic spectrum), the following lateral-resisting force F3, corresponding to the earthquake design level 3,is obtained:
d3 ¼ dy � l3 ¼ 0:049 m
F3 ¼ Fðd3; dyÞ ¼ m4p2 � ðCA �PGA�TC Þ2
ðcþ1Þ�d3�c�dy¼ 6331 kN
ð20Þ
where c is a constant which depend on the hysteretic rule appropri-ate for the structure to be designed and on the formulation adoptedfor the reduction due to viscous damping higher than the inherentdamping. All the details regarding the derivation of Eq. (20) are pro-vided in the Appendix A.
If the P–D effects are included, the effective lateral-resistingforce F�3 results to be equal to:
F�3 ¼ F�y þ ðF3 � F�yÞ �k�
k¼ 5937 kN ð21Þ
It should be noted that an alternative approach for the evaluation ofthe inelastic design spectra, based on the direct evaluation of non-linear spectra for different ductility, may be also used. Details mayfound in Bertero and Bertero [2] and in Chopra [18].
6.7. Performance objective 4
The last performance objective, which is aimed at limiting verylarge displacement that may lead to collapse due to P–D effects,can be formulated, formally, like the PO-3. The imposition of a gi-ven target ductility demand l4, under the earthquake design level4, leads to the following displacement limitation:
d 6 dy � l4 ¼ d4 ð22Þ
For the specific case study, assuming a target ductility l4 ¼ 2:5(corresponding to a certain value of the equivalent damping ration, leading to a certain inelastic spectrum) the following lateral forceF at the displacement d4 corresponding to the earthquake design le-vel 4, is obtained:
d4 ¼ dy � l4 ¼ 0:058 mFðd4;dyÞ ¼ m
4p2 � ðCA �PGA�TC Þ2ðcþ1Þ�d4�c�dy
¼ 6461 kNð23Þ
If the P–D effects are included, the effective lateral-resisting force F�4results to be equal to:
F�4 ¼ F�3 þ ðF4 � F�3Þ �k�
k¼ 5964 kN ð24Þ
It should be noted that the strength ratio g is equal to 0.08.
M. Palermo et al. / Engineering Structures 59 (2014) 495–506 501
6.8. The performance objectives via the Capacity Spectrum Method
A very effective tool which allows to graphically represent theseismic performances of a building under multiple intensity seis-mic levels is the spectral acceleration-displacement, Sa–d, format.The approach is known under the name of ‘‘Capacity SpectrumMethod’’ and it was first proposed and gradually developed byFreeman et al. [4,5]. The seismic demand spectra are plotted forthe values of the equivalent viscous damping corresponding toeach design level, i.e. damping ratio equal to only the inherentdamping ratio (0.05) for the first two design levels, as suggestedby the Italian Building Code (note that steel structures are typicallycharacterized by a lower damping ratio, around 0.02, at low seis-mic intensity levels, see Chopra [18]), and damping ratio equal tothe equivalent damping ratio leading to the target ductility l3
and l4 for the last two design levels. On the same graph, the seis-mic demand spectra are compared to the pushover capacity curveof the structure.
This framework allows to simply represent the target capacitycurve (previously referred to as B–TC curve) of the building, as de-picted in Fig. 8.
7. Step 2: the horizontal-resisting system target capacity curve
Fig. 9 displays the HRS–TC as obtained applying the generalmethodology introduced in Section 6 to the specific case studyhere analysed. In detail, according to Eq. (5) the HRS–TC curve isobtained subtracting from the B–TC curve the (positive) contribu-tions given by the VRS–AC curve and the (negative) contributiondue to the P–D curve.
8. Step 3: design of the horizontal-resisting system
8.1. The main features of the horizontal-resisting system
As highlighted in Section 6, the HRS–TC curve is the graphicalrepresentation of the idealized seismic behaviour of the systemwhich allows to accomplish the prescribed performance objectives.Nevertheless, from a practical point of view, a specific HRS systemcomposed of specific structural elements has to be conceived anddimensioned.
Fig. 8. The B–TC curve in the Sa–d format.
Careful inspection of the HRS–TC curve displayed in Fig. 9 al-lows to identify the fundamental properties which should be pro-vided by the components of the HRS:
� Initial elastic stiffness up to yielding.� Yielding force which allows for plastic excursion able to pro-
vide the structure with the target ductility.� Final hardening aimed at reducing the ultimate displace-
ment in order to prevent from collapse due to P–D effects.
8.2. The actual horizontal-resisting system
Among all the possibilities available in order to approximate theHRS–TC curve with an HRS–AC curve, the solution here proposed isbased on the adoption of an appropriate bracing system at the firststorey composed of special braces called ‘‘crescent shaped braces’’,CSBs [19].
Fig. 10 shows the schematic representation of the crescentshaped braces to be inserted into a generic frame. In Fig. 10 hf
and lf indicate the height and length of the frame, respectively; dindicates the length of the portal diagonal; d1 and d2 indicate thelength of the two segments of each single CSB; t indicates the dis-tance between the knee point (T) and the portal diagonal; h1 and h2
indicate the inclination of the two segment of the CSB with respectto the horizontal diagonal.
Simple consideration based on equilibrium and compatibilityallows to evaluate the lateral stiffness and yielding strength ofthe single CSB [19]:
kCSB ¼3EJ � cos2 h
t2 � dð25Þ
Fy;CSB ¼Wel � fy � cos h
dð26Þ
where J indicates the moment of inertia, Wel indicates the elasticsection modulus (Wel = 2J/hs with hs equal to the height cross sec-tion) and h indicates the inclination of the diagonal with respectto the horizontal.
The main feature of this bracing system is that the designer candefine the yielding strength independently from the lateral stiff-ness. This property derives from the peculiar shape of the braces.Furthermore, previous studies [10] demonstrated that (i) afteryielding (in tension) the CSB develop an hardening behaviour
-2000
0
2000
4000
6000
8000
10000
0.00 0.02 0.04 0.06 0.08 0.10
F (k
N)
d (m)
P-Delta curveHRS curveB-TC curveVRS curve
Fig. 9. The graphical representation of the HRS–TC curve (solid thick line) asobtained according to the procedure illustrated in Section 6.
Fig. 10. The geometry of the crescent shaped brace (CSB).
0
500
1000
1500
2000
2500
3000
3500
4000
F [k
N]
d [m]
-1500
-1000
-500
0
500
1000
1500
0 0.05 0.1 0.15 0.2 0.25 0.3
-0.15 -0.1 -0.05 0 0.05 0.1 0.15
F (k
N)
d (m)
(a)
(b)
Fig. 11. (a) Monotonic behaviour of the couple of the CSBs; (b) Hysteretic behaviourof the couple of the CSBs.
0
2000
4000
6000
8000
0.00 0.02 0.04 0.06 0.08 0.10
F (k
N)
d (m)
B-AC curve
B-TC curve
Fig. 12. The B–AC curve and B–TC curve.
502 M. Palermo et al. / Engineering Structures 59 (2014) 495–506
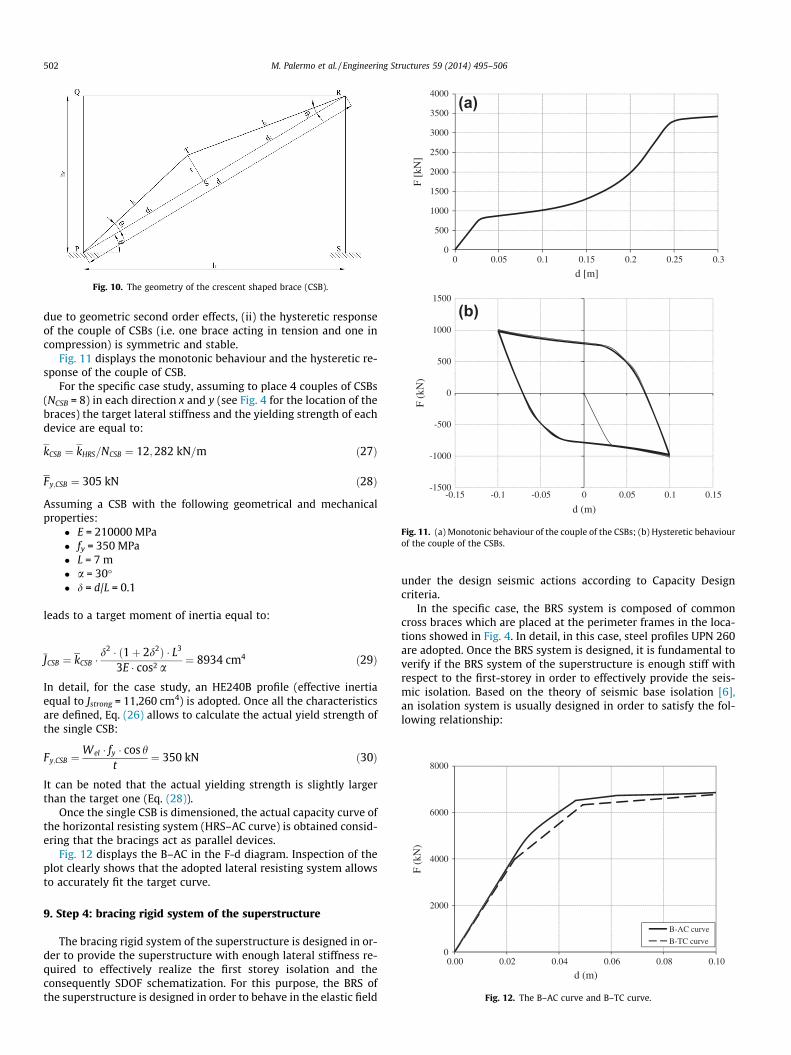
due to geometric second order effects, (ii) the hysteretic responseof the couple of CSBs (i.e. one brace acting in tension and one incompression) is symmetric and stable.
Fig. 11 displays the monotonic behaviour and the hysteretic re-sponse of the couple of CSB.
For the specific case study, assuming to place 4 couples of CSBs(NCSB = 8) in each direction x and y (see Fig. 4 for the location of thebraces) the target lateral stiffness and the yielding strength of eachdevice are equal to:
kCSB ¼ kHRS=NCSB ¼ 12;282 kN=m ð27Þ
Fy;CSB ¼ 305 kN ð28Þ
Assuming a CSB with the following geometrical and mechanicalproperties:� E = 210000 MPa� fy = 350 MPa� L = 7 m� a = 30�� d = d/L = 0.1
leads to a target moment of inertia equal to:
JCSB ¼ kCSB �d2 � ð1þ 2d2Þ � L3
3E � cos2 a¼ 8934 cm4 ð29Þ
In detail, for the case study, an HE240B profile (effective inertiaequal to Jstrong = 11,260 cm4) is adopted. Once all the characteristicsare defined, Eq. (26) allows to calculate the actual yield strength ofthe single CSB:
Fy;CSB ¼Wel � fy � cos h
t¼ 350 kN ð30Þ
It can be noted that the actual yielding strength is slightly largerthan the target one (Eq. (28)).
Once the single CSB is dimensioned, the actual capacity curve ofthe horizontal resisting system (HRS–AC curve) is obtained consid-ering that the bracings act as parallel devices.
Fig. 12 displays the B–AC in the F-d diagram. Inspection of theplot clearly shows that the adopted lateral resisting system allowsto accurately fit the target curve.
9. Step 4: bracing rigid system of the superstructure
The bracing rigid system of the superstructure is designed in or-der to provide the superstructure with enough lateral stiffness re-quired to effectively realize the first storey isolation and theconsequently SDOF schematization. For this purpose, the BRS ofthe superstructure is designed in order to behave in the elastic field
under the design seismic actions according to Capacity Designcriteria.
In the specific case, the BRS system is composed of commoncross braces which are placed at the perimeter frames in the loca-tions showed in Fig. 4. In detail, in this case, steel profiles UPN 260are adopted. Once the BRS system is designed, it is fundamental toverify if the BRS system of the superstructure is enough stiff withrespect to the first-storey in order to effectively provide the seis-mic isolation. Based on the theory of seismic base isolation [6],an isolation system is usually designed in order to satisfy the fol-lowing relationship:
Fig. 13. The qualitative comparison between the lateral response of the whole structure (a) and the superstructure (b).
Fig. 14. The finite element model of the studied building.
0
0.1
0.2
0.3
0.4
0.5
0.6
0.7
0.8
0 0.02 0.04 0.06 0.08 0.1 0.12
Sa (
g)
Sd (m)
EQ1 meanEQ2 meanEQ3 meanEQ4 mean
Fig. 15. The seismic response of the building in the Sa–d format.
M. Palermo et al. / Engineering Structures 59 (2014) 495–506 503
c ¼ TIS
TSS> 3:0 ð31Þ
where c represents a measure of the isolation and typically a valueof c > 3.0 ensures that the superstructure can be considered as a ri-gid body, TIS represents the secant period of the system under thedesign seismic loads, while TSS represents the elastic period of thesuperstructure. Fig. 13 qualitatively represents the lateral responseof the whole structure (K indicates the secant stiffness of the entirestructure) and of the superstructure (KSS indicates the elastic stiff-ness of the superstructure).
In the specific case, the secant period of the structure, TIS (eval-uated at a lateral displacement d = d3 = 0.049 m, corresponding tothe earthquake design level 3) is equal to 1.0 s, while the elasticperiod of the superstructure TSS is equal to 0.3 s, thus leading toan isolation ratio c equal to 3.33.
10. Step 5: the numerical verification
This final step aims at verifying the achievement of the pre-scribed multi-performance seismic objectives which have beengraphically represented through the building target curve. For thispurpose, a finite element model of the building has been developedusing the software MIDAS/GEN v 7.3.0. All the structural elements(beams, columns, CSBs and upper-storey braces) are modelled asfiber beam/column elements. The constitutive model adopted forthe steel is a bilinear model (i.e. elasto-plastic with isotropic hard-ening). Fig. 14 provides the 3-D representation of the structuralmodel of the studied building.
Non-linear time-history analyses have been conducted using agroup of seven natural ground motions scaled to the four designvalues of PGA as indicated in Table 1. The ground motions are se-lected using the software REXEL [20] in order to match the designspectra at the fundamental period of the building according to theprescription of the Italian Building Code.
The results of the time-history analyses are summarized inFig. 15 using the Sa–d format. From each time history analysis,the maximum spectral displacement and acceleration are plottedwith the corresponding mean values over the seven analyses.Inspection of the graph clearly shows that the mean seismic re-sponse well approximate the desired seismic behaviour.
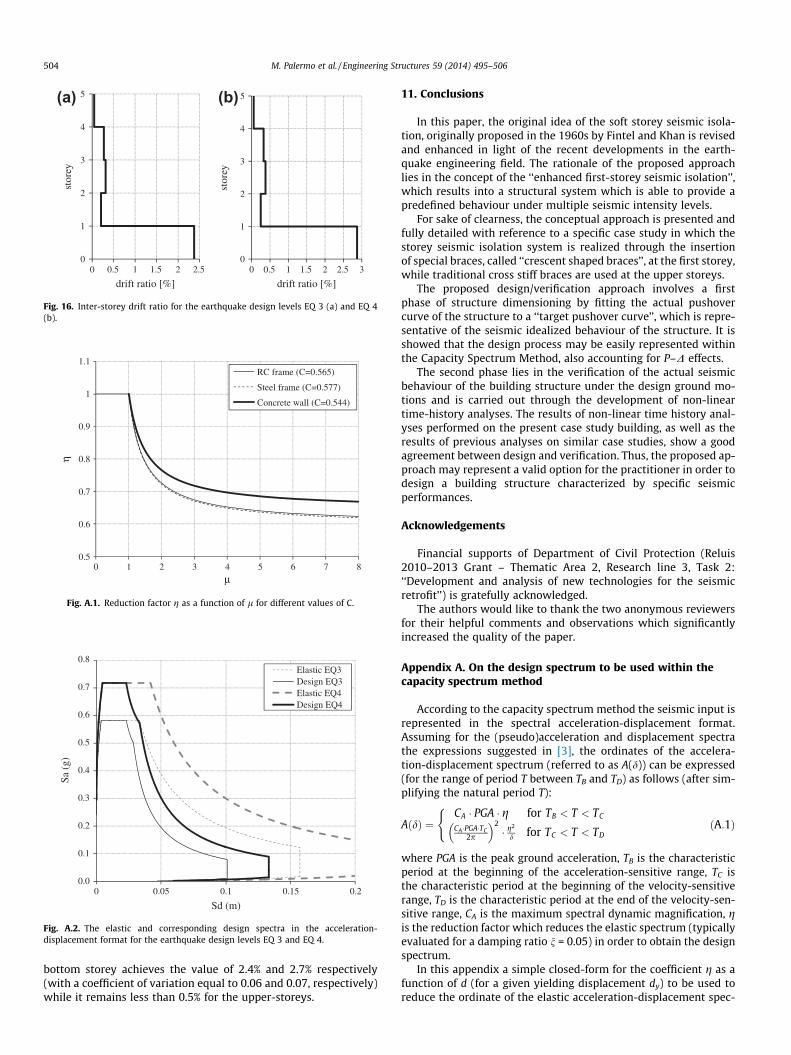
It is also interesting to verify the effectiveness of the first-storeyisolation system. In this respect, Fig. 16 provides the mean value ofthe maximum inter-storey drift ratio over the seven time history
analyses. It is clear that the drift demand is concentrated at thebottom storey, thus limiting the seismic demand to the superstruc-ture. In detail it can be observed that, under the most severe earth-quake levels (EQ3 and EQ4), the peak inter-storey drift at the
0
1
2
3
4
5
stor
ey
drift ratio [%]
0
1
2
3
4
5
0 0.5 1 1.5 2 2.5 0 0.5 1 1.5 2 2.5 3
stor
ey
drift ratio [%]
(a) (b)
Fig. 16. Inter-storey drift ratio for the earthquake design levels EQ 3 (a) and EQ 4(b).
0.5
0.6
0.7
0.8
0.9
1
1.1
0 1 2 3 4 5 6 7 8
η
μ
RC frame (C=0.565)
Steel frame (C=0.577)
Concrete wall (C=0.544)
Fig. A.1. Reduction factor g as a function of l for different values of C.
0.0
0.1
0.2
0.3
0.4
0.5
0.6
0.7
0.8
0 0.05 0.1 0.15 0.2
Sa (
g)
Sd (m)
Elastic EQ3Design EQ3Elastic EQ4Design EQ4
Fig. A.2. The elastic and corresponding design spectra in the acceleration-displacement format for the earthquake design levels EQ 3 and EQ 4.
504 M. Palermo et al. / Engineering Structures 59 (2014) 495–506
bottom storey achieves the value of 2.4% and 2.7% respectively(with a coefficient of variation equal to 0.06 and 0.07, respectively)while it remains less than 0.5% for the upper-storeys.
11. Conclusions
In this paper, the original idea of the soft storey seismic isola-tion, originally proposed in the 1960s by Fintel and Khan is revisedand enhanced in light of the recent developments in the earth-quake engineering field. The rationale of the proposed approachlies in the concept of the ‘‘enhanced first-storey seismic isolation’’,which results into a structural system which is able to provide apredefined behaviour under multiple seismic intensity levels.
For sake of clearness, the conceptual approach is presented andfully detailed with reference to a specific case study in which thestorey seismic isolation system is realized through the insertionof special braces, called ‘‘crescent shaped braces’’, at the first storey,while traditional cross stiff braces are used at the upper storeys.
The proposed design/verification approach involves a firstphase of structure dimensioning by fitting the actual pushovercurve of the structure to a ‘‘target pushover curve’’, which is repre-sentative of the seismic idealized behaviour of the structure. It isshowed that the design process may be easily represented withinthe Capacity Spectrum Method, also accounting for P–D effects.
The second phase lies in the verification of the actual seismicbehaviour of the building structure under the design ground mo-tions and is carried out through the development of non-lineartime-history analyses. The results of non-linear time history anal-yses performed on the present case study building, as well as theresults of previous analyses on similar case studies, show a goodagreement between design and verification. Thus, the proposed ap-proach may represent a valid option for the practitioner in order todesign a building structure characterized by specific seismicperformances.
Acknowledgements
Financial supports of Department of Civil Protection (Reluis2010–2013 Grant – Thematic Area 2, Research line 3, Task 2:‘‘Development and analysis of new technologies for the seismicretrofit’’) is gratefully acknowledged.
The authors would like to thank the two anonymous reviewersfor their helpful comments and observations which significantlyincreased the quality of the paper.
Appendix A. On the design spectrum to be used within thecapacity spectrum method
According to the capacity spectrum method the seismic input isrepresented in the spectral acceleration-displacement format.Assuming for the (pseudo)acceleration and displacement spectrathe expressions suggested in [3], the ordinates of the accelera-tion-displacement spectrum (referred to as A(d)) can be expressed(for the range of period T between TB and TD) as follows (after sim-plifying the natural period T):
AðdÞ ¼CA � PGA � g for TB < T < TC
CA �PGA�TC2p
� �2� g2
d for TC < T < TD
(ðA:1Þ
where PGA is the peak ground acceleration, TB is the characteristicperiod at the beginning of the acceleration-sensitive range, TC isthe characteristic period at the beginning of the velocity-sensitiverange, TD is the characteristic period at the end of the velocity-sen-sitive range, CA is the maximum spectral dynamic magnification, gis the reduction factor which reduces the elastic spectrum (typicallyevaluated for a damping ratio n = 0.05) in order to obtain the designspectrum.
In this appendix a simple closed-form for the coefficient g as afunction of d (for a given yielding displacement dy) to be used toreduce the ordinate of the elastic acceleration-displacement spec-
M. Palermo et al. / Engineering Structures 59 (2014) 495–506 505
trum is derived for the case of TB < T < TD. Nevertheless, the pro-posed approach is still valid for any T and the complete designspectrum over the entire period range can be easily obtainednumerically, as shown in Fig. A.2.
The reduction factor g is typically expressed as a function of theequivalent damping ratio:
g ¼ gðneqÞ ðA:2Þ
The equivalent damping ratio is given by:
neq ¼ nel þ nhyst ðA:3Þ
where nel is the elastic inherent damping, while nhyst is the hystereticdamping, i.e. the damping ratio equivalent to a certain excursion ofthe structure in the inelastic field. Typically values of nel are equal to0.05 for concrete structures and 0.02 for steel structures.
Assuming the formulation proposed by Dwairi et al. [21] andalso suggested by Priestley et al. [22] for a displacement based de-sign approach, the hysteretic damping ratio corresponding to a gi-ven displacement ductility demand l is equal to:
nhyst ¼Cp� 1� 1
l
� �ðA:4Þ
where C is a coefficient which depend on the hysteretic model [22].It is well known that the equivalent damping ratio due to a cer-
tain excursion of the structure in the inelastic field is expressed asthe sum of the elastic damping ratio and the hysteretic dampingratio:
neq ¼ nel þ nhyst ðA:5Þ
Substituting Eqs. (A.4) into (A.5) leads to the following expression ofthe equivalent damping ratio as a function of the displacement duc-tility demand l (which depend on d and dy):
neq ¼ nel þCp� 1� 1
l
� �ðA:6Þ
In the scientific literature it is possible to refer to several formu-lations [21–24] related to the evaluation of the reduction factor gas a function of the equivalent viscous damping. Nevertheless,most of those formulations can be expressed as follows:
Substituting Eqs. (A.8) and (A.6) in Eq. (A.7) leads to the follow-ing expression of the reduction coefficient g as a function of thedisplacement ductility demand l:
where c = C/(pa). Fig. A.1 displays the reduction coefficient g(l) forseveral values of C [21] assuming the formulation suggested byBommer et al. [23].
Finally substituting Eqs. (A.9) into (A.1) yields to the followingclosed-form expression of the acceleration-displacement spectrum:
As an illustrative example Fig. A.2 shows the elastic accelera-tion-displacement spectra and their corresponding design spectra(according to Eq. (A.10)) for the earthquake design levels EQ 3and EQ 4 adopted for the case study presented in this paper.
Appendix B. Notation
The following symbols are used in the paper:
PO-1
First performance objective PO-2 Second performance objective PO-3 Third performance objective PO-4 Forth performance objective VRS Vertical-resisting system HRS Horizontal-resisting system BRS Bracing-rigid system K (N/m) Lateral secant stiffness of the
structure
kHRS (N/m) Lateral secant stiffness of the
HRS
kVRS (N/m) Lateral secant stiffness of the
VRS
ki,VRS-strong (N/m) Lateral secant stiffness of the
i-th column in the strongdirection
ki,VRS-weak
(N/m) Lateral secant stiffness of thei-th column in the weakdirection
B–TC
Building target capacity B–AC Building actual capacity HRS–TC Target capacity of the HRS HRS–AC Actual capacity of the HRS VRS–AC Actual capacity of the VRS O Ordinate of the capacity curve
of the building
V VRS contribution to the
capacity curve of the building
D HRS contribution to the
capacity curve of the building
P P–D contribution to the
capacity curve of the building
kG (N/m) Geometric stiffness k� (N/m) Effective stiffness F� (N) Effective lateral resisting force d� (m) Second order lateral
displacement
EQ-1 First earthquake design level EQ-2 Second earthquake design
level
EQ-3 Third earthquake design level EQ-4 Forth earthquake design level d1 Target drift imposed to satisfy
the PO-1
d1 (m) Displacement corresponding
to d1
k1
(N/m) Lateral secant stiffness at d1
k�1
(N/m) Lateral effective stiffness at d1
T
(s) Initial natural period T� (s) Effective initial period F1 (N) Lateral resisting force at d1
F�1
(N) Effective lateral-resistingforce at d1
Fy
(N) Yield strength
(continued on next page)
506 M. Palermo et al. / Engineering Structures 59 (2014) 495–506
F�y
(N) Effective yield strength dy (m) Yield displacement l3 Target ductility imposed to
satisfy the PO-3
d3 (m) Target displacement imposed
to satisfy the PO-3
F3 (N) Lateral resisting force at d3
F�3
(N) Effective lateral resisting force
at d3
l4
Target ductility imposed tosatisfy the PO-4
d4
(m) Target displacement imposedto satisfy the PO-4
F4
(N) Lateral-resisting force at d4
F�4
(N) Effective lateral-resistingforce at d4
CSB
Crescent shaped brace
kCSB
(N/m) Target lateral stiffness of thesingle CSB
Fy;CSB
(N) Target yield strength of thesingle CSB
kCSB
(N/m) Lateral stiffness of the singleCSB
Fy,CSB
(N) Yield strength of the singleCSB
TIS
(s) Natural period of the isolatedbuilding
TSS
(s) Natural period of thesuperstructure
KSS
(N/m) Lateral elastic stiffness of thesuperstructure
References
[1] SEAOC Vision 2000 Committee. Performance-based seismic engineering forbuildings. Report prepared by structural engineers association of California,Sacramento, CA; 1995.
[2] Bertero RD, Bertero VV. Performance-based seismic engineering: the need for areliable conceptual comprehensive approach. Earthq Eng Struct Dynam2002;31(3):627–52.
[3] Priestley MJN, Calvi GM, Kowalsky MJ. Direct displacement-based seismicdesign of structures. Pavia: IUSS Press; 2007.
[4] Freeman SA. The capacity spectrum method as a tool for seismic design. In:Balkema AA, editor. 11th European conference on earthquake engineering,September 6–11th 1998. Paris, Rotterdam; 1998.
[5] Freeman SA. Review of the development of the capacity spectrum method.ISET J Earthq Technol 2004;41(1):1–13. Paper No. 438.
[6] Christopoulos C, Filiatrault A. Principles of passive supplemental damping andseismic isolation. Pavia, Italy: IUSS Press; 2006.
[7] Kelly JM. Base isolation: linear theory and design. Earthq Spectra1997;6(2):223–44.
[8] Fintel M, Khan FR. Shock-absorbing soft story concepts for multistoryearthquake structures. ACI J 1968;66:381–90.
[9] NTC: Norme Tecniche per le Costruzioni, Italian building code, adopted withD.M. 14/01/2008, published on S.O. no. 30 G.U. no. 29 04/02/2008; 2008.
[10] Gagliardi S. Utilizzo di dispositivi isteretici per l’isolamento di piano: strategie peruna progettazione sismica di tipo multi-prestazionale, Ph.D. Thesis, University ofBologna, Bologna, Italy; 2012. <http://amsdottorato.cib.unibo.it/3134/> [inItalian].
[11] Paulay T, Priestley MJN. Seismic design of reinforced concrete and masonrybuildings. New York: John Wiley & Sons; 1992.
[12] Aschheim M, Hernández-Montes E. The representation of P–D effects usingyield point spectra. Eng Struct 2003;25(11):1387–96.
[13] Bernal D. Amplification factors for inelastic dynamic P–D effects in earthquakeanalysis. Earthq Eng Struct Dyn 1987;15:635–51.
[14] Bernal D. Instability of buildings subjected to earthquakes. J Struct Eng ASCE1992;118(8):2239–60.
[15] Bernal D. Instability of buildings during seismic response. J Eng Struct1998;20(4–6):496–502.
[16] MacRae G, Priestley MJN. P–delta design for seismic areas. In: Proceedings,third workshop on bridge engineering research in progress; 1992. p. 215–8.
[17] MacRae G. P-effects on SDOF structures in earthquakes. Earthq Spectra EarthqEng Res Inst 1994;10(3):536–8.
[18] Chopra AK. Dynamics of structures. Theory and applications to earthquakeengineering. Upper Saddle River, NJ: Prentice-Hall; 1995.
[19] Trombetti T, Silvestri S, Gasparini G, Ricci I. Stiffness-strength-ductility designapproaches for crescent-shaped braces. Open Constr Build Technol J2009;3:127–40.
[20] REXEL v. 3.3. Iervolino I, Galasso C, Chioccarelli E; 2008–2011. <http://www.reluis.it>.
[21] Dwairi HM, Kowalsky MJ, Nau JM. Equivalent viscous damping in support ofdirect displacement-based design. J Earthq Eng 2007;11:512–30.
[22] Priestley MJN. Myths and fallacies in earthquake engineering. Italy: IUSS Press,University of Pavia; 2003. Revisited.
[23] Bommer JJ, Elnashai AS, Weir AG. Compatible acceleration and displacementspectra for seismic design codes. In: Proc of the 12th world conference onearthquake engineering. Auckland, New Zealand; 2000.