Gas Well Deliquification Workshop Sheraton Hotel, Denver, Colorado February 23 - 26, 2009 Multi-Phase Flow Modeling of Liquid Loading Kees Veeken (Shell E&P Europe, Assen) Bin Hu (SPT Group, Oslo) Wouter Schiferli (TNO Science and Industry, Delft)
Transcript
Gas Well Deliquification WorkshopSheraton Hotel, Denver, Colorado
February 23 - 26, 2009
Multi-Phase Flow Modeling of Liquid LoadingKees Veeken (Shell E&P Europe, Assen)Bin Hu (SPT Group, Oslo)Wouter Schiferli (TNO Science and Industry, Delft)
Feb. 23 - 26, 2009 2009 Gas Well Deliquification Workshop Denver, Colorado
2
Summary• Offshore liquid loading gas rate typically exceeds
Turner by 20% up to 100%• (Multi-phase) flow modeling provides various
explanations, linked to parameters such as temperature gradient, inflow performance and deviation
• Transient multi-phase flow modeling offers new insights into mechanism of liquid loading e.g. onset of liquid loading is triggered by film flow reversal rather than droplet flow reversal
• Multi-phase flow modeling increases insight into role of different parameters such as deviation, tubing size and inflow performance
Feb. 23 - 26, 2009 2009 Gas Well Deliquification Workshop Denver, Colorado
3
Offshore Field Data
Dunning, EGWDC2008
Turner is lower limitActual can be 2x higher
Feb. 23 - 26, 2009 2009 Gas Well Deliquification Workshop Denver, Colorado
4
Steady State Flow Modeling (1)
• Original Turner equation has been modified– Coleman et al. (SPE20280): -20%– Guo et al. (SPE94081): +10%
• Minimum kinetic energy
– Abbas et al. (EGWDC2008): +30%• Minimum kinetic energy
• Temperature gradient influences location and magnitude of Turner rate (Sutton et al., EGWDC2008)– Bottom hole Turner rate higher at
low FTHP and low temperature gradient: maximum +15% for offshore data set
Dry Gas Case(2.441 Tubing)
2.0 °F/100 Ft
1.5 °F/100 Ft
1.0 °F/100 Ft
0.6 °F/100 Ft
1.00
1.05
1.10
1.15
1.20
1.25
1.30
1.35
1.40
1.45
1.50
1 10 100 1000 10000
Wellhead Pressure, psia
Turn
er R
atio
Southern North Sea~1.5 ºF/100 FtFTHP>70 psia
In this presentation Turner refers to wellhead conditions!
FTHP = Flowing Tubing Head Pressu
Feb. 23 - 26, 2009 2009 Gas Well Deliquification Workshop Denver, Colorado
5
Steady State Flow Modeling (2)
• Inflow performance influences minimum stable rate (Veeken, Belfroid et al., Sutton et al.)– Qmin depends on interaction between outflow and inflow
relations, impact increases with tubing size: maximum +100%
• Outflow relation influences deviation dependency– Captured by correction factor based on laboratory test results
(0.05 m ID, air-water system)• Oudeman (SPE19103), modified Gray: maximum +31% at 45
degrees (1+0.31*sin(2*D))• Belfroid et al. (SPE115567), modified Turner: maximum +35% at 37
degrees Sin(1.7*(90-D))0.63/1.74
– Reflected as transition in flow pattern, Qmin depends on outflow relation, inflow relation and tubing size: maximum +400%
Feb. 23 - 26, 2009 2009 Gas Well Deliquification Workshop Denver, Colorado
6
Qmin Vs Deviation (A=0, THP=50 bara)
Flow pattern changes at 45
degrees
Straight & uniform wellbore
MG=Modified GrayFRM=Flow Regime Map
A = (Pres2-Pbh
2)/Q
Feb. 23 - 26, 2009 2009 Gas Well Deliquification Workshop Denver, Colorado
7
Transient Multi-Phase Flow Modeling• Apply software developed for modeling transient flow in
pipelines to model heavily inclined pipelines a.k.a. wells• Assume simple i.e. straight and uniform wellbore
configuration, constant FTHP and water of condensation• Slowly reduce reservoir pressure and record liquid
• Monitor flow regime, holdup, total water flow and film water flow along wellbore
• Vary deviation, tubing size and inflow performance
Feb. 23 - 26, 2009 2009 Gas Well Deliquification Workshop Denver, Colorado
8
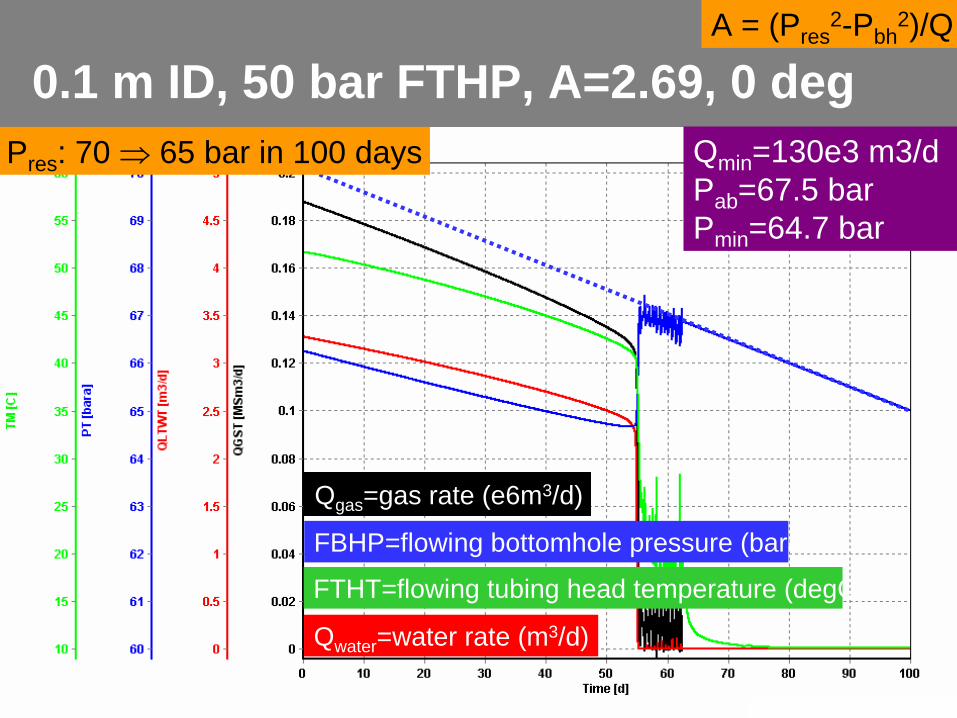
0.1 m ID, 50 bar FTHP, A=2.69, 0 degQmin =130e3 m3/dPab =67.5 barPmin =64.7 bar
A = (Pres2-Pbh
2)/Q
Qgas =gas rate (e6m3/d)
FTHT=flowing tubing head temperature (degC)
Qwater =water rate (m3/d)
FBHP=flowing bottomhole pressure (bara)
Pres : 70 65 bar in 100 days
Feb. 23 - 26, 2009 2009 Gas Well Deliquification Workshop Denver, Colorado
9
3 km deep, 10 deg deviation, 0.1 m tubing, 50 bar FTHP, annular flow, droplet flow and film flow both important
Holdup=0.007
Water film=1.7 m3/d
Total water=3.2 m3/d
Gas=0.184e6 m3/d
Flow regime=Annular
Near-Vertical
Feb. 23 - 26, 2009 2009 Gas Well Deliquification Workshop Denver, Colorado
10
Liquid loading starts when film flow “flips” i.e. changes from upward to downward, generally starts at wellhead
Near-Vertical
Flip
Holdup=0.015
Water film=0.0 m3/d
Total water=2.4 m3/d
Gas=0.129e6 m3/d
Flow regime=Annular
See e.g. van ‘t Westende et al. in Int. J. of Multiphase Flow 33 (2007) 595-615
Feb. 23 - 26, 2009 2009 Gas Well Deliquification Workshop Denver, Colorado
11
Downward film flow increases holdup and shifts holdup downward, increasing droplet flow upward partly compensates for film flow downward
Near-Vertical
Holdup=0.013
Water film=-0.2 m3/d
Total water=1.5 m3/d
Gas=0.117e6 m3/d
Flow regime=Annular
Feb. 23 - 26, 2009 2009 Gas Well Deliquification Workshop Denver, Colorado
12
At some point total water flow becomes downwardNear-Vertical
Holdup=0.019
Water film=0.0 m3/d
Total water=0.7 m3/d
Gas=0.104e6 m3/d
Flow regime=Annular
Feb. 23 - 26, 2009 2009 Gas Well Deliquification Workshop Denver, Colorado
13
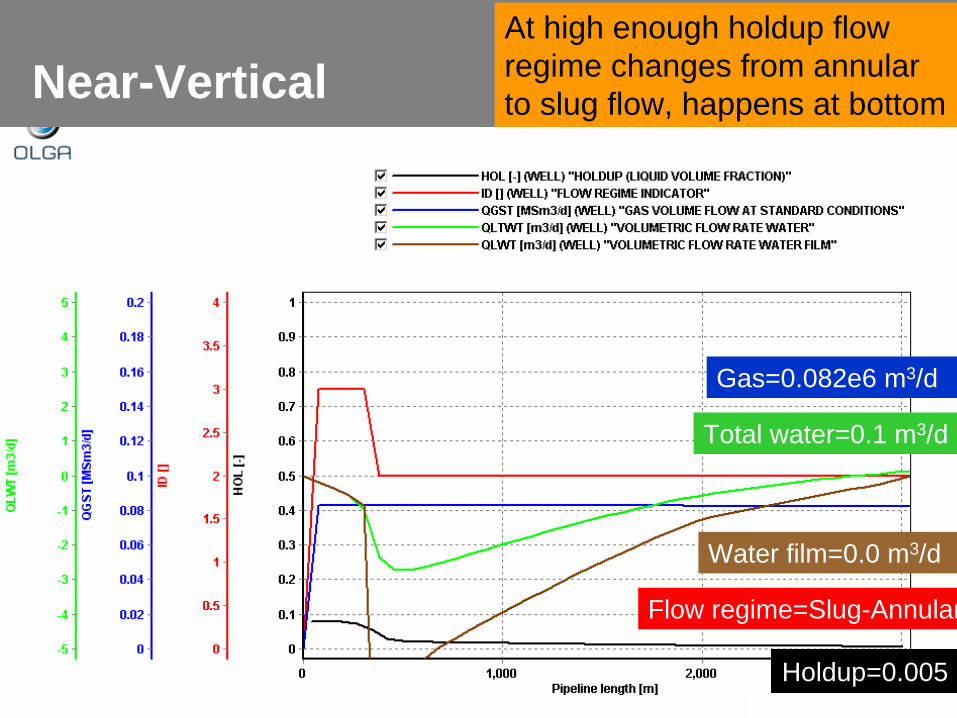
At high enough holdup flow regime changes from annular to slug flow, happens at bottomNear-Vertical
Holdup=0.005
Water film=0.0 m3/d
Total water=0.1 m3/d
Gas=0.082e6 m3/d
Flow regime=Slug-Annular
Feb. 23 - 26, 2009 2009 Gas Well Deliquification Workshop Denver, Colorado
14
Eventually gas flow virtually stops and water accumulates at bottom (100% holdup)
Near-Vertical
Holdup=0.000
Water film=0.0 m3/d
Total water=0.0 m3/d
Gas=0.005e6 m3/d
Flow regime=Slug-Annular
Feb. 23 - 26, 2009 2009 Gas Well Deliquification Workshop Denver, Colorado
15
Pres : 80 70 bar in 100 days
0.1 m ID, 50 bar FTHP, A=2.69, 45 degQmin =245e3 m3/dPab =76.4 barPmin =72.0 bar
A = (Pres2-Pbh
2)/Q
Qgas =gas rate (e6m3/d)
FTHT=flowing tubing head temperature (degC)
Qwater =water rate (m3/d)
FBHP=flowing bottomhole pressure (bara)
Feb. 23 - 26, 2009 2009 Gas Well Deliquification Workshop Denver, Colorado
16
Qmin Vs Deviation (0.1 m ID, 50 bara FTHP)
Stratified FlowAnnular Flow
Flow pattern changes at 30
degrees
In this presentation Turner refers to wellhead conditions!
Feb. 23 - 26, 2009 2009 Gas Well Deliquification Workshop Denver, Colorado
17
Tubing Size (50 bara FTHP)
Stratified FlowAnnular Flow
Large impact of tubing size and inflow performance
above 30 degrees
Feb. 23 - 26, 2009 2009 Gas Well Deliquification Workshop Denver, Colorado
18
Offshore Field Data (mostly 5” tubing)
Vertical wells: Qmin
Qolga
1.2*QTurner
Feb. 23 - 26, 2009 2009 Gas Well Deliquification Workshop Denver, Colorado
19
Mixed Trajectory (0.1 m ID, 50 bara FTHP)
Vertical at top, 45 degrees deviated at bottom Kick-off point impacts minimum stable rate
Feb. 23 - 26, 2009 2009 Gas Well Deliquification Workshop Denver, Colorado
20
Mixed Tubing Size (Vertical, 50 bara FTHP)
Mix of 0.10 m and 0.15 m
Section with larger tubing size impacts Qmin if it covers more than 5-10% of total length and governs Qmin if more than 50%
Feb. 23 - 26, 2009 2009 Gas Well Deliquification Workshop Denver, Colorado
21
Calculated Vs Actual Qmin
Compared to Turner the transient multi-phase flow model matches actual liquid loading better
Feb. 23 - 26, 2009 2009 Gas Well Deliquification Workshop Denver, Colorado
22
Conclusions• In offshore wells the onset of liquid loading occurs at significantly
higher rates than predicted by Turner• This can be explained qualitatively by the combined effect of well
deviation and/or tubing size• It is reasonable to assume that an outflow relation based on flow
patterns provides a more realistic description of liquid loading in deviated wells
• The onset of liquid loading appears to be related to flow reversal of the liquid film rather than the liquid droplets
• Compared to Turner the transient multi-phase flow model matches actual liquid loading better
• (Transient) multi-phase flow modeling based on flow patterns is expected to generate new and useful insights into liquid loading and deliquification, especially for larger and deviated wells
Feb. 23 - 26, 2009 2009 Gas Well Deliquification Workshop Denver, Colorado
23
CopyrightRights to this presentation are owned by the company(ies) and/or author(s) listed on the title page. By submitting this presentation to the Gas Well Deliquification Workshop, they grant to the Workshop, the Artificial Lift Research and Development Council (ALRDC), and the Southwestern Petroleum Short Course (SWPSC), rights to:
– Display the presentation at the Workshop.– Place it on the www.alrdc.com web site, with access to the site to be
as directed by the Workshop Steering Committee.– Place it on a CD for distribution and/or sale as directed by the
Workshop Steering Committee.Other uses of this presentation are prohibited without the expressed written permission of the company(ies) and/or author(s) who own it and the Workshop Steering Committee.
Feb. 23 - 26, 2009 2009 Gas Well Deliquification Workshop Denver, Colorado
24
DisclaimerThe following disclaimer shall be included as the last page of a Technical Presentation or Continuing Education Course. A similar disclaimer is included on the front page of the Gas Well Deliquification Web Site.The Artificial Lift Research and Development Council and its officers and trustees, and the Gas Well Deliquification Workshop Steering Committee members, and their supporting organizations and companies (here-in-after referred to as the Sponsoring Organizations), and the author(s) of this Technical Presentation or Continuing Education Training Course and their company(ies), provide this presentation and/or training material at the Gas Well Deliquification Workshop "as is" without any warranty of any kind, express or implied, as to the accuracy of the information or the products or services referred to by any presenter (in so far as such warranties may be excluded under any relevant law) and these members and their companies will not be liable for unlawful actions and any losses or damage that may result from use of any presentation as a consequence of any inaccuracies in, or any omission from, the information which therein may be contained.The views, opinions, and conclusions expressed in these presentations and/or training materials are those of the author and not necessarily those of the Sponsoring Organizations. The author is solely responsible for the content of the materials.The Sponsoring Organizations cannot and do not warrant the accuracy of these documents beyond the source documents, although we do make every attempt to work from authoritative sources. The Sponsoring Organizations provide these presentations and/or training materials as a service. The Sponsoring Organizations make no representations or warranties, express or implied, with respect to the presentations and/or training materials, or any part thereof, including any warrantees of title, non-infringement of copyright or patent rights of others, merchantability, or fitness or suitability for any purpose.