Delft University of Technology Multi-physics models for design basis accident analysis of sodium fast reactors. Part I Validation of three-dimensional TRACE thermal-hydraulics model using Phenix end-of-life experiments Silva Pinto Wahnon, Sara; Ammirabile, L.; Kloosterman, J. L.; Lathouwers, D. DOI 10.1016/j.nucengdes.2018.02.038 Publication date 2018 Document Version Final published version Published in Nuclear Engineering and Design Citation (APA) Silva Pinto Wahnon, S., Ammirabile, L., Kloosterman, J. L., & Lathouwers, D. (2018). Multi-physics models for design basis accident analysis of sodium fast reactors. Part I: Validation of three-dimensional TRACE thermal-hydraulics model using Phenix end-of-life experiments. Nuclear Engineering and Design, 331, 331- 341. https://doi.org/10.1016/j.nucengdes.2018.02.038 Important note To cite this publication, please use the final published version (if applicable). Please check the document version above. Copyright Other than for strictly personal use, it is not permitted to download, forward or distribute the text or part of it, without the consent of the author(s) and/or copyright holder(s), unless the work is under an open content license such as Creative Commons. Takedown policy Please contact us and provide details if you believe this document breaches copyrights. We will remove access to the work immediately and investigate your claim. This work is downloaded from Delft University of Technology. For technical reasons the number of authors shown on this cover page is limited to a maximum of 10.
Transcript
Delft University of Technology
Multi-physics models for design basis accident analysis of sodium fast reactors. Part IValidation of three-dimensional TRACE thermal-hydraulics model using Phenix end-of-lifeexperimentsSilva Pinto Wahnon, Sara; Ammirabile, L.; Kloosterman, J. L.; Lathouwers, D.
DOI10.1016/j.nucengdes.2018.02.038Publication date2018Document VersionFinal published versionPublished inNuclear Engineering and Design
Citation (APA)Silva Pinto Wahnon, S., Ammirabile, L., Kloosterman, J. L., & Lathouwers, D. (2018). Multi-physics modelsfor design basis accident analysis of sodium fast reactors. Part I: Validation of three-dimensional TRACEthermal-hydraulics model using Phenix end-of-life experiments. Nuclear Engineering and Design, 331, 331-341. https://doi.org/10.1016/j.nucengdes.2018.02.038Important noteTo cite this publication, please use the final published version (if applicable).Please check the document version above.
CopyrightOther than for strictly personal use, it is not permitted to download, forward or distribute the text or part of it, without the consentof the author(s) and/or copyright holder(s), unless the work is under an open content license such as Creative Commons.
Takedown policyPlease contact us and provide details if you believe this document breaches copyrights.We will remove access to the work immediately and investigate your claim.
This work is downloaded from Delft University of Technology.For technical reasons the number of authors shown on this cover page is limited to a maximum of 10.
Multi-physics models for design basis accident analysis of sodium fastreactors. Part I: Validation of three-dimensional TRACE thermal-hydraulicsmodel using Phenix end-of-life experiments
Sara Silva Pinto Wahnona,b,⁎, L. Ammirabilea, J.L. Kloostermanb, D. Lathouwersb
a European Commission, Joint Research Center, Nuclear Safety and Security, Nuclear Reactor Safety and Emergency Preparedness, Westerduinweg, PO Box-2, 1755 Petten,The NetherlandsbDelft University of Technology, Department of Radiation Science and Technology, Mekelweg 15, 2629JB Delft, The Netherlands
A R T I C L E I N F O
Keywords:Sodium fast reactorTRACEPhenix end-of-life natural circulation testModel validationThree-dimensional thermalHydraulics model
A B S T R A C T
The demonstrated technological feasibility of Sodium-cooled Fast Reactors (SFRs) makes them stand out amongthe other reactor concepts proposed by Generation IV International Forum (GIF) for short-term deployment. Theavailability of reliable computational tools in support of safety analyses and plant simulations under complextransient scenarios is essential to assure SFR’s compliance with the highest safety goals.
Answering this need, a multi-physics three-dimensional core and system model is being developed to enable amore detailed representation of the physics of the plant and to anticipate more accurately plant behaviour, evenunder wider three-dimensional scenarios, such as asymmetric transients. The coupling will be performed usingthe U.S.NRC system codes TRACE-PARCS, modified to simulate more accurately when using sodium as coolant.
The publicly available end-of-life tests conducted in the French SFR Phenix were chosen as baseline to per-form a first validation of the computational model. The development of the tool started with a three-dimensionalthermal-hydraulic nodal system of Phenix using the TRACE system code.
The system simulates the Phenix end-of-life natural circulation test and the result have been compared withpublished experimental and benchmark results. The main physical phenomena of the 3 phases of the transient(rise in temperature in the low part of the reactor vessel, establishment of natural convection and subsequentcooling of the lower and upper part of the vessel) are predicted by the developed nodal system. More specifically,the analysis of parameters such as Intermediate Heat Exchangers (IHX), primary pumps and core temperatures,shows that the developed system is able to predict and study natural convection phenomena in Phenix-typereactors.
The three-dimensional nodal system is able to clearly illustrate the existing thermal stratification in the hotpool, which is neglected by one-dimensional systems and enables the modelling of thermal hydraulic asymmetricbehaviour, as it is shown by the uneven flow distribution in Phenix’s primary IHXs as they are asymmetricallylocated in the reactor vessel.
1. Introduction
As an energy source and demonstrated value of more than 50 yearsof commercial power production, nuclear power may play an importantrole in the future low-carbon energy mix. Recognizing it, severalcountries are carrying out R&D programs to prepare the deployment ofa new generation (Generation-IV) of nuclear advanced systems, thatcould excel in terms of sustainability, safety and reliability, economicsand proliferation resistance and physical protection.
The Generation-IV International Forum (GIF) was launched in 2001focusing on collaborative R&D programs for selected innovative reactorsystems. GIF has selected six reactor concepts for near future large scaleimplementation, conceived to excel in their reliability, sustainability,safe operation, economic competitiveness and proliferation resistance(Generation-IV International Forum, 2014).
The Sodium-cooled Fast Reactor (SFR) design stands out among thereactor concepts selected by GIF based on its technological feasibilitydemonstrated in several countries during the last decades. In order to
https://doi.org/10.1016/j.nucengdes.2018.02.038Received 26 July 2017; Received in revised form 18 February 2018; Accepted 24 February 2018
⁎ Corresponding author at: European Commission, Joint Research Center, Nuclear Safety and Security, Nuclear Reactor Safety and Emergency Preparedness, Westerduinweg, PO Box-2,1755 Petten, The Netherlands.
assess the compliance of the SFR design with Generation IV safety goals,it is necessary to identify and analyze plant behavior against potentialaccident scenarios. In this respect, the development and validation ofcomputational tools able to perform reliable plant behavior simulationsis essential to the safety case.
To enable a more detailed representation of the physics of the plantand to simulate more accurately plant behavior, even under 3-dimen-sional scenarios such as asymmetric transients, a doctoral work isaiming at the development and validation of a multi-physics three-di-mensional core and system model of a SFR, combined features still notyet validated by current computational tools. This paper describes thefirst step of the tool development, specifically the development of athree-dimensional thermal-hydraulics nodal system of the French SFRPhenix and its validation against Phenix end-of-life (EOL) natural cir-culation test. The computational tool used in the present study is anadaptation of the U.S. Nuclear Regulatory Commission (NRC) thermal-hydraulics system code TRACE to simulate more accurately when usingsodium as coolant. The second step of the development features thecoupling of the U.S. NRC system codes TRACE-PARCS, matter that willbe described in a future paper.
1.1. Sodium fast reactors
As the name describes, the SFR operates with a fast neutron spec-trum, which not only allows energy production but also breeding, as theconversion rate of fertile material into fissile (238U into 239Pu) can begreater than the fissile consumption rate from the fission chain reaction.Additionally, it also features transmutation capabilities, contributingpositively to nuclear waste management. Typically, a SFR operates at anear to atmospheric pressure in the primary system and at temperatureof 550 °C, contrasting with the 15MPa and 350 °C of the PWR operationconditions. This results in producing a higher temperature steam, in-creasing the energy conversion efficiency.
Throughout the past 50 years, the development of Liquid Metal FastReactors (LMFRs) enabled to acquire more than 300 reactor-years ofoperating experience. The first SFR, the EBR-I, was built in the U.S. andreached criticality in 1951 (International Atomic Energy Agency,2006). Since then, several fast programs were launched in Asia andEurope (International Atomic Energy Agency, 2006). In Europe, Franceis the European country that invested the most in SFR development upto now. Its history with SFRs started with the experimental reactorRapsodie, which started operation in 1967 till 1983 (InternationalAtomic Energy Agency, 2012). This was continued by Phenix prototype,reaching criticality in 1973 and shutdown in 2009 (InternationalAtomic Energy Agency, 2013). Its 35 years of successful operation de-monstrated the viability of sodium-cooled fast breeder reactors. In July2009, Phenix was disconnected from the grid and was prepared for a setof final tests. These tests were projected and carried out as a uniqueopportunity to learn more about the prototype and contribute to thefuture development of SFRs. For this reason, Phenix prototype reactorwas chosen to be the reference reactor for the model development inthis study, validated against some of the Phenix end-of-life tests. Thesuccess of Rapsodie and Phenix led to the design and construction of thefirst large industrial fast breeder worldwide, the Superphenix, havingreached criticality in 1985 (International Atomic Energy Agency,2012). Technical incidents and public opposition dictated the fate ofSuperphenix that was shut down in 1997, 20 years before the end of theplant’s designed lifetime. Nonetheless, Superphenix was still able todemonstrate that large scale fast reactors are possible to operate neu-tronics wise, as the large thermal inertia limits greatly the reactivityfeedback effects. In addition, the European Fast Reactor (EFR) projectwas launched in 1988 by the European Fast Reactor Utilities Group(EFRUG) (Lefèvre et al., 1996), having the French electric utilitycompany EDF as leader. The EFR design aimed to gather the combinedexperience of France, Germany and the UK for liquid metal reactortechnology based on pool-type reactors. The developed design was
based on established technology and with realistic cost estimates(Lillington, 2004). Although its construction is not foreseen in the nearfuture, the project constituted an important step towards the road of thecommercial utilization of fast reactors. Presently, France is working onthe Advanced Sodium Technological Reactor for Industrial Demon-stration (ASTRID) Project (International Atomic Energy Agency, 2012).The project aims to develop a SFR industrial prototype (ASTRID) ex-pected to serve as a precursor of a first-of-its-kind commercial reactorthat can meet GIF’s criteria.
Joint European efforts have also been made towards SFR R&D. In2009 10 different countries engaged in a collaborative project withinEURATOM’s 7th Framework program for nuclear and research trainingfor the development of a Gen-IV European Sodium-cooled Fast Reactor(ESFR) (CEA, 2003–2011). The project targeted the deployment ofESFR technology by mid-century and finished successfully in 2013. Acontinuation of ESFR Project was launched in 2017 with the colla-borative Project ESFR-SMART (Mikityuk, 26-29 June 2017).
1.1.1. Calculation tools for sodium fast reactorsMany computational tools dedicated to SFR analysis have been
developed throughout the years of SFR R&D. Code developments havebeen focusing on different type of accident analysis, simulating dif-ferent relevant phenomena. Among the available computational tools,it is possible to distinguish purely thermal-hydraulic codes, purelyneutronic codes and coupled thermal-hydraulic/neutronics codes.Additionally, it is possible to distinguish codes of different types, e.g.deterministic versus statistic, the scale of each computational tool,steady state versus transient, etc., and if they are applicable to the fullcore or to the full reactor. The analysis of Generation-IV SFRs wouldbenefit by the use of multi-physics models, like the coupling betweenthermal-hydraulic and neutronics computation tools.
The most important experimental and theoretical findings related tosodium have been integrated to state-of-the-art codes, of which SAS4A/SASSYS-1 (Cahalan et al., 2000) and SIMMER-III/IV (Tobita et al.,2006) appear as reference tools. SAS4A and SASSYS-1 computer codeswere first developed at ANL for the transient analysis of LMFRs. SAS4Aanalysis has the objective to quantify severe accident consequences asmeasured by the generation of energy sufficient to challenge reactorvessel integrity; whereas SASSYS-1 analysis is to quantify accidentconsequences as measured by the transient behavior of system perfor-mance parameters, such as fuel and cladding temperatures, reactivityand cladding strain. In spatial terms, each SAS4A/SASSYS-1 channelmodels a fuel pin and its associated coolant. These two codes have beenadditionally coupled to nodal spatial kinetics computer codes (VAR-IANT-K and DIF3D-K) for accurate analysis of coupled spatial neutronkinetics and thermal hydraulic effects. For Core Disruptive Accidents(CDA), SIMMER has been developed continuously since its first release(Bohl and Luck, 1990). The current code version allows an evaluation ofthe transition phase of a CDA, through the simulation of the entire coreand the modelling of key thermodynamic and neutronics phenomenaoccurring during the accident progression.
The FAST (Fast-spectrum Advanced Systems for power productionand resource managemenT) code system is currently being developed atPSI for static and transient analysis of Design Basis Accidents (DBA) ofthe main Generation-IV fast-neutron spectrum reactor concepts: so-dium, gas and lead-cooled fast reactors. The main goal is to allow ananalysis of advanced fast spectrum systems including different coolantsand fuel types. The reactor modelling includes an integral representa-tion of the core neutronics, thermal- hydraulics and fuel behavior, andthe reactor primary and secondary systems. The code system has beenassembled from well-established existing codes, extended to the simu-lation of fast reactor features when necessary, namely: ERANOS, forstatic neutronics, PARCS, for reactor kinetics, TRACE, for systemthermal-hydraulics, and FRED, for thermal mechanics.
The procedure followed in this study has been based on the adap-tation of computational tools verified, validated and extensively used in
S. Silva Pinto Wahnon et al. Nuclear Engineering and Design 331 (2018) 331–341
332
Light Water Reactor (LWR) safety analysis to specific phenomena thattake place in LMFRs. The chosen tools were the pair TRACE-PARCS,adapted to reproduce more accurately LMFRs phenomena. In the scopeof first part of the model development presented in this paper, only thethermal-hydraulics (TRACE) adaptations will be described here.
1.2. Phenix reactor
The Phenix reactor was a sodium-cooled pool-type fast reactor of563MWth (250MWe) (International Atomic Energy Agency, 2013). Itstarted operation in 1973 and it was permanently shut down in 2009.From 1993, Phenix was operated at a reduced power of 350MWth(140MWe).
Phenix (Fig. 1) main vessel diameter is 11.8 m and holds around 800tons of primary sodium, providing the system a large thermal inertia.The core consists of an array of hexagonal assemblies, with a widthacross flats of 127mm and overall height of 4.3m, each assemblycontaining 217 wire-wrapped pins. In its 563MW regime, the primarysodium had inlet at the core at 400 °C and outlet at 560 °C. The coreitself was comprised in different regions:
• Central fissile zone – divided into two regions with different en-richment values;
• Surrounding fissile zone – divided into two regions with differentenrichment values;
• Surrounding steel reflectors and lateral neutron shielding rods.
Reactor control was initially ensured by 6 control rods, involvingtwo distinct drive systems. In 1996 another rod was added, positionedat the core centerline.
To remove the heat generated by the core, the system comprises 6Intermediate Heat Exchangers (IHX), connected in pairs to the threesecondary loops. Each secondary loop carries 140 tons of sodiumheating up from 350 to 550 °C, transferring heat from the intermediateheat exchangers to the Steam Generators (SGs).
1.2.1. Phenix end-of-life natural circulation testBefore the definite shutdown of Phenix, a final set of experimental
tests was carried out in order to gather data and additional knowledgeon relevant aspects of the operations of SFRs. Recognizing this uniqueopportunity, the International Atomic Energy Agency (IAEA) estab-lished a Coordinated Research Project (CRP) on ‘Control rod with-drawal and sodium natural circulation tests performed during thePhenix end-of-life experiments’ (International Atomic Energy Agency,2013).
The natural circulation test part of the CRP on Phenix end-of-lifeexperiments was the transient selected for the validation activity of thedeveloped thermal-hydraulic models described in this paper.
The experimental data of the test is openly-available in the IAEATECDOC 1703 (International Atomic Energy Agency, 2013). Thisdocument constitutes the most complete openly-available source ofinformation on experimental data on SFRs, making possible the con-duction of new SFR calculation studies. Examples of this is the studypresented in this paper and the published studies on multi-dimensionalpool analysis of Phenix end-of-life natural circulation test using MARS-LMR code (Jeong et al., 2014) and the computation of the test using theNETFLOW++ code (Mochizuki et al.,2013).
Phenix End-Of-Life (EOL) natural circulation test was performed onJune 22-23 of 2009. Before the test began, the reactor was operating atfull power (350 MWth). For the test, on 22nd of June 15:00, the reactorpower was manually decreased from 350MWth to 120MWth and only4 IHX and 2 secondary loops (n⁰ 1 and 3) were in function. The teststarted on the same day at 19:15 (local time).
The natural convection test in the primary circuit was divided intothree phases described in Table 1:
2. TRACE code adaptations and nodal system development
The natural circulation test has served as validation of the first partof the tool development: a three-dimensional thermal-hydraulics nodalsystem using the TRACE system code (modified to improve simulationcapabilities when using sodium as coolant).
The TRACE system code (TRAC/RELAP Advanced ComputationalEngine) was developed by the U.S.NRC to consolidate and extend thecapabilities of the three NRC safety codes – TRAC P, TRAC B andRELAP. TRACE is designed to perform best-estimate analyses of Loss-Of-Coolant Accidents (LOCAs), operational transients, and other acci-dent scenarios in light water reactors. Models used include multi-di-mensional two-phase flow, non-equilibrium thermodynamics, general-ized heat transfer, reflood, level tracking and reactor kinetics. Itcontains capability to model thermal-hydraulic phenomena in both one-dimensional (1D) and three-dimensional (3D) space. The modelling of areactor system is based on a component approach. The system’s phy-sical equipment is represented individually in a flow loop and can benodalized into a number of physical volumes (cells), over which the
Fig. 1. Schematic of Phenix reactor block (International Atomic Energy Agency, 2013).
Table 1Details of test phases of Phenix natural circulation test (International Atomic EnergyAgency, 2013).
Time (s) Action
Phase 1 0 » Dry out of steam generators 1 and 3» No change in pumps speed
458 » Scram» Secondary pumps 1 and 3 automatically reduced to110 rpm in 1min
Phase 2 466 » Stop of the 3 primary pumps4 080 » Secondary pumps speed reduced to 100 rpm (back-up
motors)
Phase 3 10 320 » Steam generators cooled by air24 000 » Closing of the SG casings and end of benchmark
» End of test
S. Silva Pinto Wahnon et al. Nuclear Engineering and Design 331 (2018) 331–341
333
fluid, conduction and kinetics equations are averaged. TRACE databaseincludes physical properties for several coolants, including liquid so-dium. However, some physical correlations/models had to be updatedand/or added in order to perform more accurate simulations.
Heat transfer modelsFor liquid metals heat transfer in pipes, TRACE yields for the cal-
culation of the Nusselt number the correlation (U.S.NRC, 2012):
= +Nu Pe Nu Pe4.8 0.025· , where and are the Nusselt and Peclet numbers0.25
(1)
The correlation (1) was considered valid for liquid metals’ pipeflow. However, following literature recommendations (Mikityuk,2009), it was implemented a more appropriate correlation for liquidmetals in bundle flow – the Ushakov correlation:
= − + +Nu xx x
Pe7.55 20 0.041 · ,x13 2
0.56 0.13(2)
where,
= = −x 1.1 1.95PD ,
= = −Pe Peclet number range (30 5000).
Liquid sodium internal energy calculationFrom previous applications of TRACE in liquid metal cooled fast
reactors modelling (Lazaro et al., 2013) it was noticed an over-estimation of the coolant’s temperature. After analysis, it was concludedthat this was due to a crude calculation of the fluid’s (sodium) internalenergy that lead to an underestimation of its internal energy.
Originally, TRACE calculates the liquid sodium internal energysimply as the integral of a reference specific heat:
= − +U c T T U·( ) (U. S. NRC,2012),lNa pR l R SR (3)
where,
UlNa is the liquid sodium internal energy,=c 1150.9452 J/(kg·K)pR is the reference specific heat,
Tl is the liquid temperature,=T 371 KR is the reference temperature,
USR is the saturation liquid energy at reference temperature.
The correlation (3) was improved by calculating the liquid sodiuminternal energy in means of TRACE’s sodium specific heat correlationanalytical integral:
∫ ∫′ = ⎡⎣ ⎤⎦ −⎡⎣ ⎤⎦ +U c c U ,lNa pT
pT
SRlNal
lNaR (4)
where,
UlNa is the liquid sodium internal energy,Tl is the liquid temperature,
=T 371 KR is the reference temperature,USR is the saturation liquid energy at reference temperature,cplNa is TRACE’s liquid sodium specific heat correlation:
= − + × −c T T1646.97 0.831587 4.31182 10 (U. S. NRC,2012).plNa l l4 2 (5)
Pressure correlationFrom literature review and previous benchmark calculations
(Lazaro et al., 2013), it was concluded that the pressure drop modelalong fuel elements (wire-wrapped) should be updated.
Given how TRACE calculates pressure losses along fuel elements(U.S.NRC, 2012), it was understood that the fault was due to an in-appropriate model of the friction factor, used for the calculation fric-tional pressure loss due to shear stress at the wall. The friction factor f jis originally calculated in TRACE using the Churchill correlation(U.S.NRC, 2012):
⎜ ⎟= ⎛⎝
⎛⎝
⎞⎠
++
⎞⎠
=⎛
⎝⎜⎜
⎛
⎝⎜ +
⎞
⎠⎟
⎞
⎠⎟⎟
= ⎛⎝
⎞⎠
fRe A B
A Ln BRe
2 8 1( )
;
2.457· 1( ) 0.27·
; 37530
Churchill
Reε
D
12
1.5
112
7 0.9
1616
h (6)
where,
Dh is the hydraulic diameter [m],Ɛ is the surface roughness [m],
⩾Re 5000 is the Reynolds number.
According to (Bubelis and Schikorr, 2008), it was verified throughexperimental data that the friction-factor for wire-wrapped fuel as-semblies having sodium as coolant is better modelled by Rehme cor-relation, that was then implemented in TRACE system code:
⎜ ⎟
⎜ ⎟ ⎜ ⎟
= ⎛⎝
+ ⎞⎠
⎛⎝
+ ⎞⎠
= ⎛⎝
⎞⎠
+ ⎡
⎣⎢
+ ⎛⎝
⎞⎠
⎤
⎦⎥
fRe
FRe
F N π D DS
F PD
D DH
PD
64 0.0816 · ( ) ,
7.6( ) ,
Rehmer r w
t
t
r
r w t
r
0.50.133
0.9335
0.5 2 2.16
(7)
where,
H Wire lead length (pitch) [m]St Total wetted perimeter [m]Nr Number of fuel pinsDr. Rod diameter [m]Dw Wire (spacer) diameter [m]
= +P D D1.0444·t r w Rod pitch wire-wrap configuration [m].
2.1. Phenix thermal-hydraulic nodal systems
Following Phenix benchmark specifications (International AtomicEnergy Agency, 2013), the Phenix thermal-hydraulics modelling startedwith a one-dimensional nodal system that, after its validation, wasexpanded to a three-dimensional representation. Below both one- andthree-dimensional thermal-hydraulics nodal systems are described.Transient calculation results of both systems will be later compared toeach other, to some of the CRP benchmark results and to the experi-ment.
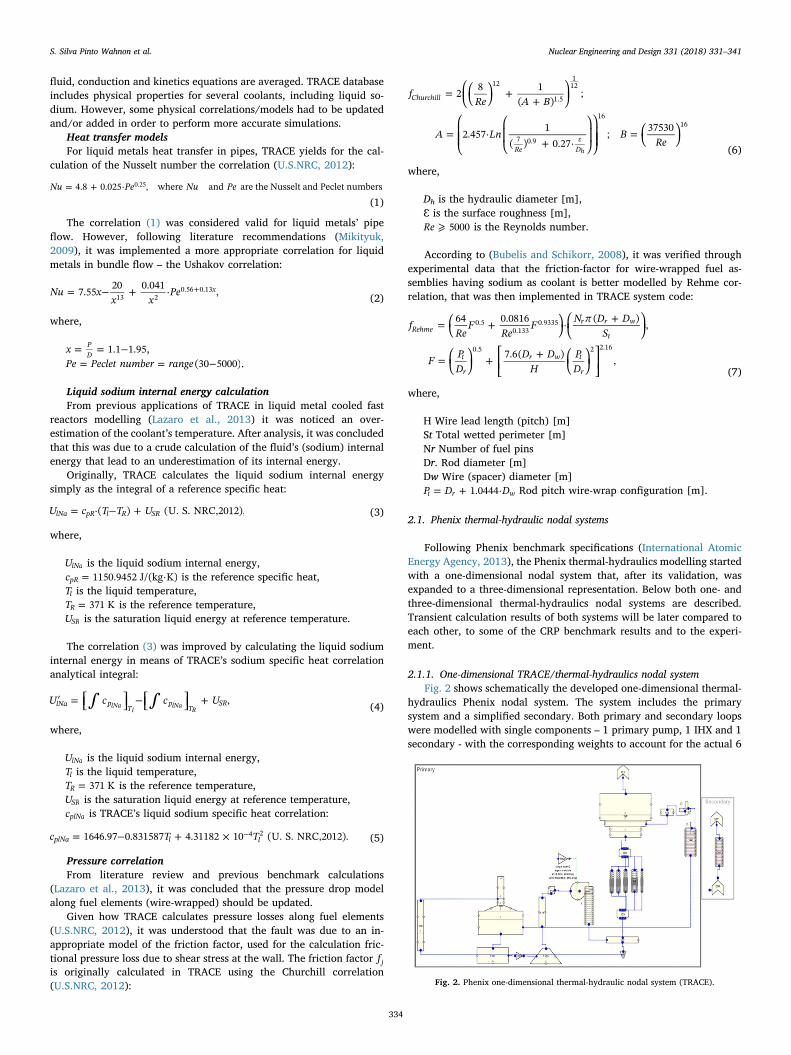
2.1.1. One-dimensional TRACE/thermal-hydraulics nodal systemFig. 2 shows schematically the developed one-dimensional thermal-
hydraulics Phenix nodal system. The system includes the primarysystem and a simplified secondary. Both primary and secondary loopswere modelled with single components – 1 primary pump, 1 IHX and 1secondary - with the corresponding weights to account for the actual 6
Fig. 2. Phenix one-dimensional thermal-hydraulic nodal system (TRACE).
S. Silva Pinto Wahnon et al. Nuclear Engineering and Design 331 (2018) 331–341
334
IHX, 3 primary pumps and 3 secondary loops.The Phenix core is modelled by a set of five parallel PIPE compo-
nents (one-dimensional channels), each one attached to an individualheat structure component, all powered by a single power component.Table 2 describes the 5 core channels. The core division was chosen byhaving one channel for each core zone to simplify the model as theinterest lies in the whole system behavior. The flow distribution amongthe core zones (International Atomic Energy Agency, 2013) wasachieved by the use of K loss coefficients at the bottom of each channelto simulate the gagging at the front edge of each channel (InternationalAtomic Energy Agency, 2013). The imposed power is distributed amongthe different channels as shown in Table 2.
The core components are connected to the hot (upper) and cold(lower) plena. The hot plenum is divided into 3 regions: one to modelthe volume of the pool over the core and other two that model thestructures that convey the coolant from the core to the primary side ofthe IHX where the heat is transferred to the secondary circuit. From theprimary side of the IHX, the coolant reaches the cold plenum, modelledby 8 channels, conveying it to the core inlet. The coolant flow pathconnects the end of the cold plenum to its top. The secondary systemsare represented by a single channel, with equivalent dimensions to the3 existing secondary loops. The boundary conditions for secondarymass flow and pressure are imposed. The primary pump was modelledby a TRACE pump component, with equivalent weight to the 3 Phenixprimary pumps following primary pump specifications (using thehomologous representation) (U.S.NRC, 2012).
2.1.2. Three-dimensional TRACE/thermal-hydraulics nodal systemThe methodology followed to build the three-dimensional thermal-
hydraulics nodal system was to expand the developed one-dimensionalsystem into a three-dimensional one. To achieve this, the TRACEcomponent VESSEL was used. The VESSEL component is three-dimen-sional and can be discretized axially, radially and azimuthally.Components like the core, diagrid, hot and cold plena were convertedinto VESSEL nodes with appropriate volumes and flow areas. The othercomponents – primary pumps, primary IHXs and simplified secondary –were left as one-dimensional components, connected to the corre-spondent VESSEL cells. Each Phenix primary pump was modelled in-dividually following the specifications and using TRACE’s PUMP com-ponent. Additionally, three primary IHXs were modelled, each with afactor of 2, and, consequently, three simple secondary circuits. It isimportant to highlight that, according to Phenix specifications(International Atomic Energy Agency, 2013), only two IHX pairs are infunction, thus, only two of the modelled IHX will be connected to theVESSEL.
All one-dimensional system characteristics mentioned in the sectionbefore were adapted to be consistent with the three-dimensional con-figuration. The three-dimensional TRACE nodal system is shown inFig. 3. The three primary IHXs and secondary systems are highlighted inred. The three primary pumps are highlighted in green and the VESSELcomponent in blue. The VESSEL was divided in 29 axial levels, 7
(radial) rings and 3 azimuths. Each modelled primary IHX and primarypump was connected to one VESSEL azimuth. VESSEL axial dis-cretization is shown and described in Fig. 4. The core is modelled be-tween VESSEL’s axial levels 3 and 23 and rings 1 to 5, across its threeazimuths. In this model, each third of ring across the core axial levelshas associated a heat structure component that models all pins in-dividually contained in that respective core zone, with their specificstructure (materials and geometry), similarly to what was done in theone-dimensional nodal system.
3. Model validation
To test the developed model and computational tool capabilities(under development), Phenix end-of-life natural circulation test wassimulated. Below, calculation results are compared to the experimentsand to some of the CRP benchmark results (International Atomic EnergyAgency, 2013).
3.1. Initial and boundary conditions
To simulate the natural circulation test with the developed models,the thermal power, secondary inlet temperature and mass flow ratewere given as input. These parameters were set according to the mea-sured test results (International Atomic Energy Agency, 2013). Figs. 5–7show their evolution from the beginning till the end of the test.
3.2. Results comparison
3.2.1. Steady state resultsTRACE three-dimensional nodal system steady state results of the
initial state of the natural circulation test are presented and comparedto Phenix nominal conditions in Table 3. The margins acceptable for theparameters are (International Atomic Energy Agency, 2013) (D’Auriaet al., 1999):
• Calculated temperatures ± 5 degrees from the nominal value;
• Mass flows with deviations smaller than 2% of the nominal value;
• Calculated core pressure drop with maximum 10% deviation ofnominal value.
The calculated steady state temperatures and mass flows shown inTable 3 are within the accuracy limits, demonstrating the reliability ofthe system predicting these parameters. However, the predicted corepressure drop falls out of the acceptable error margin. In fact, there isno information of where the core pressure should be taken from exactly,thus it is possible that the calculated value shown in Table 3 does notreflect the nominal core pressure drop given in the benchmark speci-fications (International Atomic Energy Agency, 2013). The core pres-sure drop drives the system, which needs to compensate the pressure toachieve the correct system mass flow due to the use of K loss coeffi-cients for core flow distribution that increase the core pressure drop.
Natural circulation simulationsThe transient’s main physical phenomena are described in this
section. Furthermore, simulation results of the developed models ofdifferent parameters relevant to reactor behavior are analyzed andcompared to experimental results and other institutions’ calculations ofthe CRP benchmark.
Transient’s main physical phenomenaDuring the first phase of the test, the dry-out of the SGs in function
causes a loss of heat sink, leading to heating of the lower part of thereactor vessel. Consequently, the increase of core inlet temperatureleads to a drastic decrease of core power, result of the neutronicsfeedback. Since the core power was given as input, the latter physicalphenomena cannot be confirmed by the developed TRACE models.However, it is possible to confirm the trend of rise in temperature in thelower part of the reactor vessel, as seen in Fig. 8. There, the extracted
Table 2Onedimensional model core channels description.
Channel FlowArea (m2)
HydraulicDiameter (m)
PowerFraction
Length (m)
Total Active
1 Fuel innercore
0.269 4.09× 10⁻³ 0.517 3.517 0.85
2 Fuel outercore
0.280 0.409
3 Fertile zone 0.319 4.97× 10⁻³ 0.0694 Reflector
zone0.926 1.399× 10⁻¹ 0.003
5 Control rods 0.031 0.002
S. Silva Pinto Wahnon et al. Nuclear Engineering and Design 331 (2018) 331–341
335
experimental results during the first phase of the transient are com-pared to the results of TRACE three-dimensional nodal system, ex-tracted from location 5 marked in Fig. 4. Nevertheless, it is expected adiscrepancy in results as it is not known the exact location where thetemperatures are measured.
The establishment of natural convection occurs in the test’s secondphase. Two thermal shocks take place in the beginning of this phase.The first, classified as cold shock, due to the manual activated scram isclosely followed by the second, a hot shock, due to the trip of thepumps. This behavior can be observed in Fig. 11, where TRACE cal-culations are compared to the experiments. In the long term, it isreached an equilibrium state, where the whole reactor vessel getsprogressively homogeneous, a behavior which can be observed also inFig. 9, by the plateau region up to 10 000 s of the transient.
The third (last) phase of the natural circulation test is initiated bythe opening of the SGs’ casings that leads to a recovery of an efficientheat sink. As consequence, the lower part of the vessel starts to coolfollowed by the cooling of the upper part of the vessel, observed Figs. 9
Fig. 5. Thermal power input throughout the natural circulation test (International AtomicEnergy Agency, 2013).
Fig. 6. Secondary inlet temperature evolution of both secondary loops in service duringthe natural circulation test (International Atomic Energy Agency, 2013).
S. Silva Pinto Wahnon et al. Nuclear Engineering and Design 331 (2018) 331–341
336
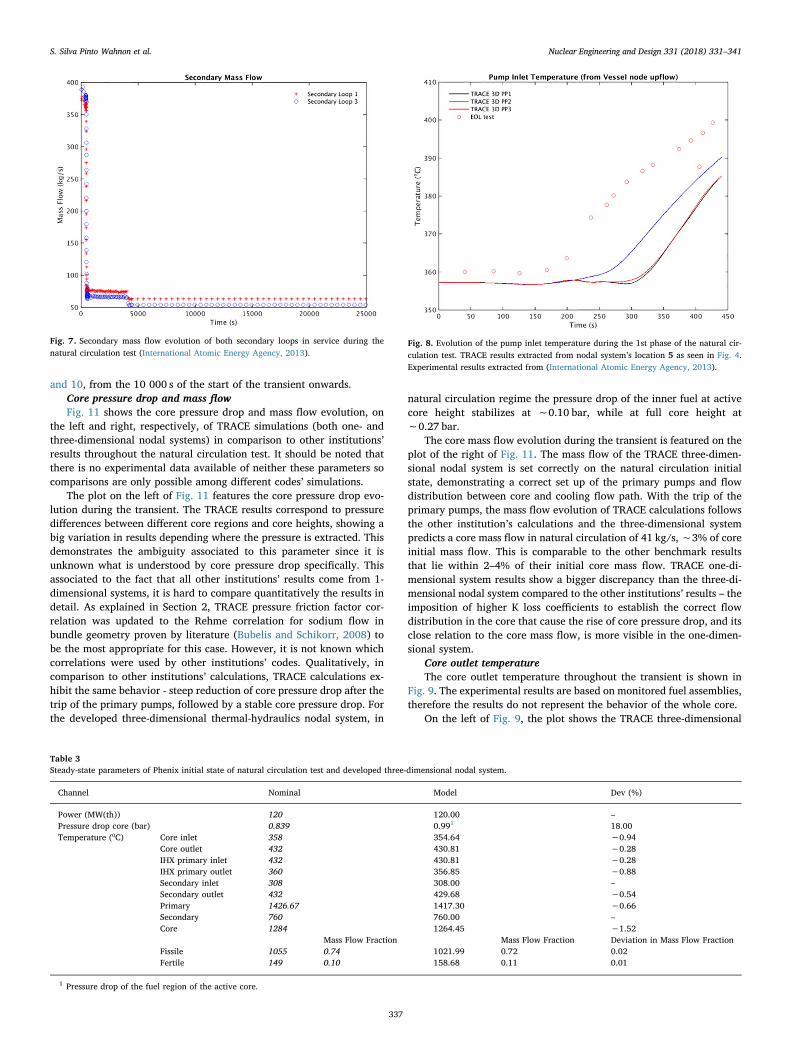
and 10, from the 10 000 s of the start of the transient onwards.Core pressure drop and mass flowFig. 11 shows the core pressure drop and mass flow evolution, on
the left and right, respectively, of TRACE simulations (both one- andthree-dimensional nodal systems) in comparison to other institutions’results throughout the natural circulation test. It should be noted thatthere is no experimental data available of neither these parameters socomparisons are only possible among different codes’ simulations.
The plot on the left of Fig. 11 features the core pressure drop evo-lution during the transient. The TRACE results correspond to pressuredifferences between different core regions and core heights, showing abig variation in results depending where the pressure is extracted. Thisdemonstrates the ambiguity associated to this parameter since it isunknown what is understood by core pressure drop specifically. Thisassociated to the fact that all other institutions’ results come from 1-dimensional systems, it is hard to compare quantitatively the results indetail. As explained in Section 2, TRACE pressure friction factor cor-relation was updated to the Rehme correlation for sodium flow inbundle geometry proven by literature (Bubelis and Schikorr, 2008) tobe the most appropriate for this case. However, it is not known whichcorrelations were used by other institutions’ codes. Qualitatively, incomparison to other institutions’ calculations, TRACE calculations ex-hibit the same behavior - steep reduction of core pressure drop after thetrip of the primary pumps, followed by a stable core pressure drop. Forthe developed three-dimensional thermal-hydraulics nodal system, in
natural circulation regime the pressure drop of the inner fuel at activecore height stabilizes at ∼0.10 bar, while at full core height at∼0.27 bar.
The core mass flow evolution during the transient is featured on theplot of the right of Fig. 11. The mass flow of the TRACE three-dimen-sional nodal system is set correctly on the natural circulation initialstate, demonstrating a correct set up of the primary pumps and flowdistribution between core and cooling flow path. With the trip of theprimary pumps, the mass flow evolution of TRACE calculations followsthe other institution’s calculations and the three-dimensional systempredicts a core mass flow in natural circulation of 41 kg/s, ∼3% of coreinitial mass flow. This is comparable to the other benchmark resultsthat lie within 2–4% of their initial core mass flow. TRACE one-di-mensional system results show a bigger discrepancy than the three-di-mensional nodal system compared to the other institutions’ results – theimposition of higher K loss coefficients to establish the correct flowdistribution in the core that cause the rise of core pressure drop, and itsclose relation to the core mass flow, is more visible in the one-dimen-sional system.
Core outlet temperatureThe core outlet temperature throughout the transient is shown in
Fig. 9. The experimental results are based on monitored fuel assemblies,therefore the results do not represent the behavior of the whole core.
On the left of Fig. 9, the plot shows the TRACE three-dimensional
Fig. 7. Secondary mass flow evolution of both secondary loops in service during thenatural circulation test (International Atomic Energy Agency, 2013).
Table 3Steady-state parameters of Phenix initial state of natural circulation test and developed three-dimensional nodal system.
Channel Nominal Model Dev (%)
Power (MW(th)) 120 120.00 –Pressure drop core (bar) 0.839 0.991 18.00Temperature (⁰C) Core inlet 358 354.64 −0.94
Mass Flow Fraction Mass Flow Fraction Deviation in Mass Flow FractionFissile 1055 0.74 1021.99 0.72 0.02Fertile 149 0.10 158.68 0.11 0.01
1 Pressure drop of the fuel region of the active core.
Fig. 8. Evolution of the pump inlet temperature during the 1st phase of the natural cir-culation test. TRACE results extracted from nodal system’s location 5 as seen in Fig. 4.Experimental results extracted from (International Atomic Energy Agency, 2013).
S. Silva Pinto Wahnon et al. Nuclear Engineering and Design 331 (2018) 331–341
337
nodal system core outlet temperature mass weighted average in eachcore region in different two different axial levels, the results of TRACEone-dimensional nodal system, the test’s experimental results and otherinstitutions’ simulation results. The plotted temperature for core axiallevel 23 is located just over the active core, while axial level 26 is lo-cated over the full core height. The discrepancy between the two sets ofresults show how important is the coolant mixing effect and howchallenging it is to compare results from a three-dimensional system toa one-dimensional one.
According to literature (International Atomic Energy Agency,2013), the experimental Phenix core outlet temperature is obtained bya simple arithmetic average over the core, not taking into account themass flow in each region. The plot on the right hand side of Fig. 9features then the TRACE three-dimensional nodal system core outlettemperature arithmetic average over the core of also axial levels 23 and26. In this plot, the temperatures are of comparable range of experi-mental results and results of the one-dimensional codes. In this case, themixing effects are also visible, as the results of axial level 23 and axiallevel 26 are reasonably different. It is understandable why the weightedaverage leads to higher temperatures: the regions that contain most ofthe mass flow are the ones with higher outlet temperature (inner andouter fuel).
Regarding the three-dimensional nodal system results behavior,
Fig. 12 features on the left the first 600 s of the transient and on the left,the first 10 000 s. It is possible to observe that in the first 350 s the coldshock is predicted although the temperatures are overall under-estimated. Additionally, the scram is well reproduced (prediction ofsharp drop in temperature and two thermal shocks). From the scram till∼300 s after the start of the transient, there is an increase of tem-perature caused by the reduction of the flow rate. The temperaturediscrepancies between calculation and experimental results may be dueto the fact that measurements only monitor certain fuel assemblies andthere is no information about their location.
Primary IHX inlet temperatureThe evolution of primary IHXs inlet temperature throughout natural
circulation transient is shown in Fig. 13.On the left plot of Fig. 13, experimental results, TRACE three-di-
mensional nodal system calculation’s results and other institution’scalculations results are showed against the calculated temperatures atthe inlet of the two operating IHXs by TRACE’s three-dimensional nodalsystem (location 1 marked in Fig. 4). The contrasting inlet temperaturesof the IHXs are due to an asymmetric mass flow distribution amongthem due to the inherent asymmetric geometry of the system. Takingthe average inlet temperature of the two primary IHXs, it is possible toverify that it follows the core outlet temperature, shown in Fig. 9. It isimportant to notice that according to the calculations, the cold shock
Fig. 9. Core outlet temperature evolution throughout the natural circulation transient. On the left, the TRACE three-dimensional results are weightily averaged over the different coreregions taking into consideration their mass flows. On the right, the average is done arithmetically. Other institutions’ results taken from (International Atomic Energy Agency, 2013).
Fig. 10. Primary pumps inlet temperature evolution during the natural circulation test. On the left, TRACE’s three dimensional nodal system results is the average temperature at thethree primary pumps inlet (location 4 marked in Fig. 4), while on the right, TRACE’s three-dimensional nodal system temperatures are extracted on the vessel nodes from where thecoolant is conveyed to the primary pumps (location 5 marked in Fig. 4). Other institutions’ results taken from (International Atomic Energy Agency, 2013).
S. Silva Pinto Wahnon et al. Nuclear Engineering and Design 331 (2018) 331–341
338
due to decrease of power at the beginning of the transient is propagatedfrom the core outlet to the IHXs inlet, a behavior that is not confirmedby the experimental results. This may be explained by the fact that thethermocouple measuring the IHX inlet temperature is located in theupper part of the IHX window where temperature and mass flow rateheterogeneities appear. As a consequence, the measurements are notnecessarily representative of the average temperature at the IHX inlet.
To demonstrate the coolant mixing effects in the hot pool theaveraged calculated temperature on the vessel nodes (of TRACE’s three-dimensional nodal system) from where the coolant is conveyed to theprimary IHXs (location 2 marked in Fig. 4) is shown on the right-handside of Fig. 13. It is possible to see how different the temperatureevolution is in the first 10 000 s of the transient, when compared to theaverage temperature calculation at the primary IHXs inlets.
Primary IHX outlet temperatureFig. 14 shows the averaged calculated temperature at the outlet of
the primary IHXs of TRACE’s three-dimensional nodal system (location3 marked in Fig. 4) compared to other calculations and experimentalresults. The evolution of this parameter, whose trend is confirmed byTRACE’s three-dimensional system results, follows closely the sec-ondary inlet temperature given as boundary condition (Fig. 6). How-ever, the exact location of the measurement is unknown, which
challenges where the calculations’ temperatures should be extracted.This is reflected in the first 5000 s of the transient, where TRACE’sthree-dimensional system results are 10 degrees lower than the mea-surements.This discrepancy may be due to the wrong temperature ex-traction location, as there is significant thermal stratification at theprimary IHXs outlet window.
Finally the decrease in temperature just in the beginning of thetransient observed in the experimental results is not predicted by anysimulation. This temperature decrease might be caused by coolingconducted from the cold pool, which is not modelled.
Primary pump inlet temperatureIn Fig. 10 it is shown the evolution of the primary pumps inlet
temperature during the natural circulation test. In this parameter, it isalso clear the importance of where the temperature is extracted due tomixing/thermal stratification effects of the cold pool. On the left ofFig. 10, the temperature of TRACE’s three dimensional nodal system isthe average temperature at the three primary pumps inlet (location 4marked in Fig. 4), while on the right, TRACE’s three-dimensionalsystem temperatures are extracted on the vessel nodes from where thecoolant is conveyed to the primary pumps (location 5 marked in Fig. 4).
The temperatures extracted from TRACE’s three-dimensional nodalsystem featured on the right plot of Fig. 10 predicts the coolant
Fig. 11. Core pressure drop, on the left, and core mass flow, on the right, evolutions during the natural circulation test simulation. Other institutions’ results taken from (InternationalAtomic Energy Agency, 2013).
Fig. 12. Evolution of core outlet temperature during the first 600 s and 10 000 s of the transient, respectively. Other institutions’ results taken from (International Atomic Energy Agency,2013).
S. Silva Pinto Wahnon et al. Nuclear Engineering and Design 331 (2018) 331–341
339
temperature drop from the measurements at ∼300 s of the transient,not predicted by any other model. However, this is followed by atemperature rise not seen in the experimental results. This result may beimproved if the mixing in the cold pool of fluid coming from the pri-mary IHXs could be better modelled. On average, there is an overprediction till ∼10 000 s of the transient, from where the primarypumps inlet temperature are well predicted.
Secondary outlet temperatureThe evolution throughout the transient of the secondary system
outlet temperature is shown in Fig. 15. The cold shock is overestimatedby TRACE, as the inlet temperature of the primary IHXs. After the coldshock overpredictions, the results of TRACE’s three-dimensional nodalsystem evolve towards the measurements, correcting the results fromthe one-dimensional system. Additionaly, the temperature trend afterthe scram is dependent on the primary IHXs inlet temperatures andprimary mass flows through the IHXs as the natural circulation buildsup, hence the asymmetry in temperatures of the two secondary systems.
4. Conclusions and recommendations
The study described in this paper aimed to assess the capability of athree-dimensional thermal-hydraulics nodal system using an adaptedversion of TRACE system code when using sodium as coolant, to si-mulate SFR’s normal operation and behavior under transient condi-tions, namely the natural convection scenario.
Giving as boundary conditions the core power, secondary inlettemperature and mass flow, the developed model was able to simulatePhenix steady state within the accepted margins. When simulating thetransient scenario, the developed model was able to predict the tran-sient’s main physical phenomena of its 3 phases: rise in temperature inthe lower part of the reactor vessel, establishment of natural convectionand subsequent cooling of the lower and upper part of the vessel.Additionally, the simulation results were in line with the CRP bench-mark results, as shown from Figs. 9–15 (CRP benchmark results re-presented by PSI and IRSN results). In natural circulation conditions,the developed three-dimensional nodal system core mass flow was 3%of the core mass flow, agreeing with the 2–4% from the CRP benchmarkresults. However, the core pressure drop has proven harder to compareto other CRP benchmark results as other institutions results come fromone-dimensional models and it is unknown which pressure frictionfactors other codes used and where the pressure should be extractedexactly. Nevertheless, TRACE results show similar qualitatively beha-vior in core pressure drop throughout the transient (steep reduction of
Fig. 13. Evolution of primary IHXs inlet temperature throughout natural circulation transient. Left: TRACE three-dimensional nodal system temperatures at the inlet of each primary IHXmodel (location 1marked in Fig. 4); Right: TRACE three-dimensional nodal system temperatures extracted at the vessel node the coolant is conveyed to the primary IHXs model (location2 marked in Fig. 4). Other institutions’ results taken from (International Atomic Energy Agency, 2013).
Fig. 14. Primary IHXs outlet temperature (average) throughout the transient. Other in-stitutions’ results taken from (International Atomic Energy Agency, 2013).
Fig. 15. Evolution of the outlet temperature of the secondary systems. Other institutions’results taken from (International Atomic Energy Agency, 2013).
S. Silva Pinto Wahnon et al. Nuclear Engineering and Design 331 (2018) 331–341
340
core pressure drop after the trip of the primary pumps, followed by astable core pressure drop). The developed model predicts the primaryIHX inlet temperature to follow the core outlet temperature as in theCRP benchmark analysis. Nonetheless, experiments show a differentbehavior of this parameter that can be explained by the fact that thethermocouple in question is located in the upper part of the IHXwindow (where temperature and mass flows heterogeneities appear)and so is not necessarily representative of the average temperature atthe IHX inlet. Also agreeing with the CRP benchmark results, the pri-mary IHX outlet temperature, secondary outlet temperature and pumpinlet temperature are strongly connected. Experimentally, the tem-peratures resulting from the heat exchange are matched by the calcu-lations however it is important to highlight that the location of theextraction of the calculation values is of extreme importance due to thethree-dimensional nature of the developed system.
The three-dimensional nodal system is able to clearly illustrate theexisting thermal stratification in the hot pool, which is neglected byone-dimensional nodal systems. Due to its inherent geometric cap-abilities, in the three-dimensional nodal system it is possible to extractvalues in more realistic and precise locations that, when compared toexperimental results, and show a better agreement than what one di-mensional models provide. Additionally, the three-dimensional featureenables the modelling of thermal hydraulic asymmetric behavior, asshown by the uneven flow distribution in Phenix’s primary IHXs as theyare asymmetrically located in the reactor vessel.
Given the calculation results analysis, it is possible to conclude thatthe developed three-dimensional thermal-hydraulics system is capableto predict and study natural convection phenomena in Sodium FastReactors. Nevertheless, it is important to refer that for a very detailedanalysis of the recirculation at the top of the core and cross flows withinthe fuel assemblies generated in a natural circulation scenario, it isnecessary the use more refined scale tools for the hot and cold collectorsand inter-assembly space (like CFD and sub-channel codes for the as-semblies).
Currently, a Phenix core neutronics model using PARCS system codeis being developed. This will be coupled to the presented three-di-mensional thermal-hydraulics system creating a three-dimensionalmulti-physics model and allowing the simulation of more complex
transient scenarios, subject of the second part of the article.
References
Generation-IV International Forum, 2014. Technology Roadmap Update for GenerationIV Nuclear Energy Systems. OECD Nuclear Energy Agency, n.p., ch. 1-2.
International Atomic Energy Agency, 2006. Fast Reactor Database 2006 Update.International Atomic Energy Agency, Vienna.
International Atomic Energy Agency, 2012. Status of Fast Reactor Research andTechnology Development. International Atomic Energy Agency, Vienna.
International Atomic Energy Agency, 2013. Benchmark Analyses on the NaturalCirculation Test Performed During the PHENIX End-of-life Experiments. InternationalAtomic Energy Agency, Vienna.
Lefèvre, J.C., Mitchell, C.H., Hubert, G., 1996. European Fast Reactor Design. Nucl. Eng.Des. 162, 133–143.
Lillington, J.N., 2004. The Future of Nuclear Power. Elsevier.CEA, 2003-2011. Collaborative Project for a European Sodium Fast Reactor. http://www.
cp-esfr.eu (accessed 06.03.2017).Mikityuk, K., 26-29 June 2017. ESFR-SMART: new Horizon-2020 project. Yekaterinburg
(conference proceedings).Cahalan, J.E., Ama, T., Palmiotti, G., Taiwo, T.A., Yang, W.S., 2000. Development of a
coupled dynamics code with transport theory capability and application to accel-erator-driven systems transients. PHYSOR ANS International Topical Meeting onAdvances in Reactor Physics and Mathematics and Computation into the NextMillennium. Pittsburg (conference proceedings).
Tobita, Y., Kondo, S.A., Yamano, H., Morita, K., Maschek, W., Coste, P., Cadiou, T., 2006.The development of SIMMER-III, an advanced computer porgram for LMFR safetyanalysis, and its applications to sodium experiments. Nucl. Technol. 153, 245–255.
Bohl, W.R., Luck, L.B., 1990. SIMMER-II: A Computer Program for LMFBR Disrupted CoreAnalysis. Los Alamos National Laboratory, Los Alamos.
Jeong, H.-Y., Ha, K.-S., Choi, C.-W., 2014. Multi-dimensional pool analysis of Phenix end-of-life natural circulation test with MARS-LMR code. Ann. Nucl. Energy 63, 309–316.
Mochizuki, H., Kikuchi, N., Li, S., 2013. Computation of natural convection test at Phenixreactor using the NETFLOW++ code. Nucl. Eng. Des. 262, 1–11.
U.S.NRC, 2012. TRACE V5.0 Theory Manual. USNRC, Washington D.C.Mikityuk, K., 2009. Heat transfer to liquid metal: review of data and correlations for tube
bundles. Nucl. Eng. Des. 239, 680–687.Lazaro, A., Ammirabile, L., Bandini, G., Darmet, G., Massara, S., Dufour, Ph., Tosello, A.,
Gallego, E., Jimenez, G., Mikityuk, K., Schikorr, M., Bubelis, E., Ponomarev, A.,Kruessmann, R., Stempniewicz, M., 2013. Code assessment and modeling for designbasis accident analysis of the European sodium fast reactor design. Part I: systemdescription, modelling and benchmarking. Nucl. Eng. Des. 266, 1–16.
Bubelis, E., Schikorr, M., 2008. Review and proposal for best fit of wire-wrapped fuelbundle friction factor and pressure drop predictions using various existing correla-tions. Nucl. Eng. Des. 238, 3299–3320.
D’Auria, F., Frogheri, M., Gianotti, W., 1999. RELAP/MOD3.2 Post Test Analysis andAccuracy Quantification of SPES TEST SP-SB-03. U.S.NRC, 30.
S. Silva Pinto Wahnon et al. Nuclear Engineering and Design 331 (2018) 331–341