ORIGINAL PAPER Multi-resolution clustering analysis and 3-D visualization of multitudinous synthetic earthquakes Received: 9 October 2002 / Revised: 22 January 2003/Accepted: 23 January 2003 / Published online: 27 February 2003 Ó Springer-Verlag 2003 Abstract We use modern and novel techniques to study the problems associated with detection and analysis of multitudinous seismic events, which form the back- ground for isolated great earthquakes. This new approach involves multivariate analysis of low and large magnitude events recorded in space over a couple of centuries in time. We propose here the deployment of the clustering scheme both for extracting small local structures and large-scale trends in synthetic data obtained from four numerically simulated models with: uniform properties (U), a Parkfield-type asperity (A), fractal brittle properties (F), and multi-size-heterogene- ity fault zone (M). The mutual nearest neighbor (mnn) clustering scheme allows for extraction of multi-resolu- tional seismic anomalies in both the spatio-temporal and multi-dimensional feature space. We demonstrate that the large earthquakes are correlated with a certain pathway of smaller events. Visualization of the anoma- lies by using a recently introduced visualization package Amira reveals clearly the spatio-temporal relationships between clusters of small, medium and large earth- quakes, indicating significant stress relaxation across the entire fault region. We demonstrate that this mnn scheme can extract distinct clusters of the smallest events, which precede and follow a singularly large magnitude earthquake. These clusters form larger spa- tio-temporal structures comprising a series of large earthquakes. The link between the large and medium magnitude events is not so clearly understood. Short- ranged correlations are dominated by strong spatio- temporal anomalies, thus reflecting the global seismic properties of the entire fault zone. Keywords Earthquakes Synthetic catalogs Clustering of events Agglomerative clustering Visualization Introduction Investigations on earthquake prediction have, up to now, focused principally on the precise detection of precursory anomalies and their relation to the occur- rence of large events (Shimazaki and Nakata 1980). Behind these investigations lies the intention of ex- tracting as large amount of relevant information as possible from original physical data such as: origin times, locations and magnitudes of seismic events. Assuming that the information is not evenly distributed among data coordinates, i.e., some of them are more relevant than the others, by combining these data we can produce new, synthetic parameters carrying the most of valuable information. For the statistical analysis of spatio-temporal patterns produced by seismic events both simple methods involving only one parameter and more sophisticated multi-parameter techniques were employed. In recent years, several groups (Keilis-Borok and Kossobokov 1990; Eneva and Ben-Zion 1997a, 1997b) have developed Vis Geosci (2003) 8: 12–25 DOI 10.1007/s10069-002-0006-2 Witold Dzwinel David Yuen Yoshihiro Kaneko Krzysztof Boryczko Yehuda Ben-Zion Reviewed by J.-L. Vigneresse and G. Erlebacher. Electronic Supplementary Material Supplementary material is available for this article if you access the article at http:// dx.doi.org/10.1007/s10069-002-0006-2. A link in the frame on the left on that page takes you directly to the supplementary material. W. Dzwinel (&) K. Boryczko AGH Institute of Computer Science, al. Mickiewicza 30, 30-059, Krako´w, Poland E-mail: [email protected]D. Yuen K. Boryczko Minnesota Supercomputing Institute, University of Minnesota, Minneapolis, MN, 55455, USA Y. Kaneko Dept. of Earth and Space Sciences, University of California Los Angeles, Los Angeles, CA, 90095, USA Y. Ben-Zion Department of Earth Sciences, University of Southern California, Los Angeles, CA, 98809, USA
Transcript
ORIGINAL PAPER
Multi-resolution clustering analysis and 3-D visualizationof multitudinous synthetic earthquakes
Received: 9 October 2002 / Revised: 22 January 2003/Accepted: 23 January 2003 / Published online: 27 February 2003� Springer-Verlag 2003
Abstract We use modern and novel techniques to studythe problems associated with detection and analysis ofmultitudinous seismic events, which form the back-ground for isolated great earthquakes. This newapproach involves multivariate analysis of low and largemagnitude events recorded in space over a couple ofcenturies in time. We propose here the deployment ofthe clustering scheme both for extracting small localstructures and large-scale trends in synthetic dataobtained from four numerically simulated models with:uniform properties (U), a Parkfield-type asperity (A),fractal brittle properties (F), and multi-size-heterogene-ity fault zone (M). The mutual nearest neighbor (mnn)clustering scheme allows for extraction of multi-resolu-tional seismic anomalies in both the spatio-temporal andmulti-dimensional feature space. We demonstrate thatthe large earthquakes are correlated with a certainpathway of smaller events. Visualization of the anoma-lies by using a recently introduced visualization package
Amira reveals clearly the spatio-temporal relationshipsbetween clusters of small, medium and large earth-quakes, indicating significant stress relaxation across theentire fault region. We demonstrate that this mnn
scheme can extract distinct clusters of the smallestevents, which precede and follow a singularly largemagnitude earthquake. These clusters form larger spa-tio-temporal structures comprising a series of largeearthquakes. The link between the large and mediummagnitude events is not so clearly understood. Short-ranged correlations are dominated by strong spatio-temporal anomalies, thus reflecting the global seismicproperties of the entire fault zone.
Investigations on earthquake prediction have, up tonow, focused principally on the precise detection ofprecursory anomalies and their relation to the occur-rence of large events (Shimazaki and Nakata 1980).Behind these investigations lies the intention of ex-tracting as large amount of relevant information aspossible from original physical data such as: origintimes, locations and magnitudes of seismic events.Assuming that the information is not evenly distributedamong data coordinates, i.e., some of them are morerelevant than the others, by combining these data we canproduce new, synthetic parameters carrying the most ofvaluable information.
For the statistical analysis of spatio-temporal patternsproduced by seismic events both simple methodsinvolving only one parameter and more sophisticatedmulti-parameter techniques were employed. In recentyears, several groups (Keilis-Borok and Kossobokov1990; Eneva and Ben-Zion 1997a, 1997b) have developed
Vis Geosci (2003) 8: 12–25DOI 10.1007/s10069-002-0006-2
Witold Dzwinel Æ David Yuen Yoshihiro Kaneko
Krzysztof Boryczko Æ Yehuda Ben-Zion
Reviewed by J.-L. Vigneresse and G. Erlebacher.
Electronic Supplementary Material Supplementary material isavailable for this article if you access the article at http://dx.doi.org/10.1007/s10069-002-0006-2. A link in the frame on theleft on that page takes you directly to the supplementary material.
W. Dzwinel (&) Æ K. BoryczkoAGH Institute of Computer Science, al. Mickiewicza 30,30-059, Krakow, PolandE-mail: [email protected]
D. Yuen Æ K. BoryczkoMinnesota Supercomputing Institute,University of Minnesota, Minneapolis,MN, 55455, USA
Y. KanekoDept. of Earth and Space Sciences,University of California Los Angeles,Los Angeles, CA, 90095, USA
Y. Ben-ZionDepartment of Earth Sciences,University of Southern California,Los Angeles, CA, 98809, USA
newer techniques, which include pattern recognitionalgorithms for analysis of cross-correlations betweentime-series of heuristically derived seismicity parameters.These feature extraction techniques consist in non-lineartransformation of a spatio-temporal feature space ofgreater dimensionality into a space with a smallerdimensionality, thus filtering out redundant information.This procedure is very reliable provided that it is possibleto extract the features carrying more than 80% of allinformation. However, in many cases relevant informa-tion can be evenly distributed among the all originalfeatures. Then, as is well known from pattern recognitionprinciples (Jain and Dubes 1988; Theodoris and Kou-troumbas 1998), not all complex structures in a multi-dimensional feature space can be extracted by anyprojection method. Therefore, after dimensionalityreduction, evenly distributed information will be mostlylost. For example, there is a spatial distribution of events,which is averaged out over certain distances and ne-glected in the pattern recognition process, as proposed inEneva and Ben-Zion (1997a, 1997b). As is often the case,clustering analysis comes to the rescue and unveils theseenigmatic, complex structures.
Clustering analysis is a well-known technique inmodern deterministic analysis and is a fundamentalconceptual tool in pattern recognition (Andenberg 1973).It is used for classifying similar (or dissimilar) N-di-mensional feature vectors. Clustering techniques can beutilized for classifying not only static multi-dimensionaldata, but also dynamic discrete events such as micro-structures created due to flow in complex fluids(Boryczko et al. 2003; Dzwinel et al. 2003), the micro-earthquakes induced by mining activities (Rundle et al.1997, 2000; Freed and Lin 2001), dissipation phenomenaoccurring in a dispersed stellar population (Barnes andHernquist 1996; Briceno et al. 2001) or dynamicallychanging Landsat data (Faber 1994) (terabytes per day–represented by up to 256-dimensional vectors). Theclustering and feature extraction software can also beapplied in large collaborative GRID computing projects(e.g., Foster and Kesselman 1998; Gannon 1998; Foxet al. 2002; Brezany et al. 2002; Dutka and Kitowski.2002) dealing with processing of large-scale data sets.
Depending on the data structure represented by atwo-dimensional matrix [xji]NxM, and the relationshipbetween dimensionality N of data vectors xi=1,...,M=[x1i,x2i,...,xNi] and the number M of vectors consideredfor classification, clustering can play a different role(Gowda and Krishna 1978; Faber 1994; Theodoris andKoutroumbas 1998). For large dimensionality N and Nof the same order as the value of M, clustering plays asecondary role in classification of data and can be usedrather for feature selection (Andenberg 1973). Con-versely, the number N of raw features xi describing ithearthquake events is low, and comprises the spatial co-ordinates (X,Z), origin time (t) and magnitude (m), thusN=4 and xi=[X,Z,t,m]. Because a long period of time isrequired for detection and analysis of anomalies, whichgo with isolated earthquakes, the number of vectors
representing seismic events is usually large, thusM>>N. This is a very appealing data property forclustering. By using a clustering scheme it is possible toretrieve spatio-temporal patterns created by events,which are averaged out by former approaches. Theanalysis of these patterns can answer at least a fewimportant questions: Can we observe any regular spatio-temporal structures of events? Can we extract commonfeatures from global trends in a spatio-temporal distri-bution of small, medium and large events? Is the spatialdistribution of small magnitude events correlated withthe largest earthquakes? The widespread clusters ofsimilar vectors can represent long-wavelength phenom-ena, which go with the SOC-like (self-organizedcriticality) (Bak et al. 1987; Bak 1996) earthquake oc-currence. The analysis of the behavior of distinct long-time trends can be used in modifying predictions ofearthquake occurrences on the basis of the previouslyused techniques (Eneva and Ben-Zion 1997a, 1997b;Keilis-Borok and Kossobokov 1990; Lyakhovsky et al.2001). Moreover, clustering analysis can help to putconstraints on the variations of the physical parameters,such as the shear modulus and friction coefficient of thecrustal fault zones under geophysical consideration.
In this age of data deluge one cannot emphasizestrongly enough the importance of advanced scientificvisualization in promoting understanding. This is espe-cially true in looking at clustering of earthquakes. Thereis a dire need for the researcher to interact instanta-neously in analyzing the earthquake events and toestablish and replay the spatial-temporal patternsobtained by clustering. Only by fast 3-D visualizationand volume rendering of multi-resolutional structurescan one detect precisely the boundaries between clustersand depict the spatial distribution of events and theirmagnitudes. Looking at a abundancy of static figureswould often stifle the urge for discovery.
In this paper, it is our goal to describe our clusteringanalysis procedures together with our visualizationtechniques using the Amira visualization package(http://www.amiravis.com). First, we present the dataand discuss the concept of agglomerative clustering(Andenberg 1973; Theodoris and Koutroumbas 1998).We employ the clustering scheme, which is based on themutual nearest neighbor (mnn) concept (Gowda andKrishna 1978; Dzwinel and Basiak 1999) and linked-listmethod (Hockney and Eastwood 1981) for the nearestneighbors search. Then we will describe briefly ouradaptation of Amira for this clustering research. Weclose with a report of our results on clustering and dis-cuss the geophysical implications based on this prelimi-nary study.
Synthetic earthquake data catalog
The usefulness of synthetic catalogs based on theoreticalmodels depends on the extent to which the models mimicrealistic fault activity, including earthquakes and aseismic
13
slip. In this work we use catalogs generated by a model(Ben-Zion 1996) for a two-dimensional (2-D), segmentedstrike-slip fault system in a three-dimensional (3-D) sur-rounding elastic matrix. Each fault segment is governedboth by a frictional threshold for brittle instability and bya power-law creep for aseismic slip. As shown in Ben-Zion (1996), the theory, parameters, as well as the resultsof modeling obtained from this model, are compatiblewith a large number of multi-disciplinary observations,including geologic and geodetic data, stress drops, hypo-central locations, frequency size and temporal statistics ofearthquakes, and stress profiles.
The use of synthetic data for the analysis of seismicevents and the development of methodology for predic-tion of earthquakes has many advantages, which are veryrelevant for revealing complex physical behavior. More-over, synthetic data have the advantage of retaining thestatistical reliability of the results. The data are free ofmeasurement errors, which occur in estimating earth-quake magnitudes and hypocentral locations, and do notsuffer from incomplete recording of small events, whichexist in natural catalogs. Synthetic data generated bycomputational models can comprise many events cover-ing large spatial areas and extremely long time spans.
These features are very attractive both for studyingnew methods for data analysis and understanding the-oretical aspects of earthquake dynamics. There are manynumerical models with different levels of complexity,which simulate earthquake dynamics (Shimazaki andNakata 1980; Ben-Zion 1996; Lyakhovsky et al. 2001).In this study, we employ the synthetic data catalog ob-tained from the numerical model of a discrete fault planesimulated with 3-D elastic dislocation theory and power-law creep for the central San Andreas Fault (Ben-Zion1996). The results cover the earthquake distribution inspace, time and magnitude size. An 1857-type event wasimposed at the south at the beginning of the simulationand a 1906-type event was imposed at the north 50 yearslater. We study four different model realizations repre-senting various levels of fault-zone disorder. These aremodels with uniform brittle properties (U), with aParkfield-type asperity (A), with fractal brittle properties(F), and with multi-size-heterogeneities (M). In all cases,the creep properties are the same and are chosen tosimulate a brittle-ductile transition at a depth of about12.5 km, and an overall transition from stick-slip be-havior to creep at horizontal distance of about 65 kmfrom the northern edge of the large 1857 event. Thesemodels and various statistical properties of the catalogshave been discussed in greater detail elsewhere (Ben-Zion 1996; Eneva and Ben-Zion 1997b). The propertiesof the models are described in Tables 1, 2, 3. We havedefined four dimensions: two spatial dimensions such asthe hypocenter location and the depth and two addi-tional: time interval and magnitude of the events. Thefault is divided onto square cells—called here points—550 m long and deep. The point of a given seismic ac-tivity is called event. The time interval covers all eventsthat have occurred in the last 150 years of simulated
fault activity. The sizes of data files are collected inTable 2. The raw data from the four models are depictedin Fig. 1.
From the visual inspection of the panels displayed inFig. 1, we can clearly discern that:
1. As shown in Eneva and Ben-Zion (1997a, 1997b),each model approximately follows the Gutenberg-Richter power law (the relationship between magni-tude and earthquake frequency), but each model hasthe characteristic distribution for large events, whichcan be discerned by using the histograms in Amira.
2. The data have periodical strip-like structure over timecoordinate. Large or moderately large magnitudeearthquakes in all models occur at rarefied stripregions. We can see that these rarefied regions are due
Table 1 Data models
Model Physical properties of each simulated model.Note that Qa=arrest stress, Qs=static stress,and 1 bar=105 Newton/m2
U Uniform distribution of stress drops: Qa=Qs)12 bar±6 bar. Similar to non-asperity region of model A
A Stress drop with Parkfield-type asperity: in asperityregion, Qa=Qs)54 bar ±6 bar, and the otherregion, Qa=Qs)12 bar±6 bar
F Fractal stress drop distribution: Qa=f*Qs,where Qs=60 bar and f is takenfrom fractal distribution characterized by afractal dimension 2.3, mean values 0.5 andstandard deviation 0.2
M Stress drop with multi-size-scale heterogeneities:the fault consists of low stress drop segments,Qa=Qs)10 bar and high stress drop boundaries,Qa=Qs)100
Table 3 Domains of physical parameters
Dimension Description Intervaland unit
Axis color
X Horizontaldistance
0<X<70 km Red
Z Depth 0<Z<17.5 km Greent Time 150<t<300 years Bluem Earthquake
magnitudeDifferent intervalswith the differentmodels (see Table 2)
to the relaxation of stress followed by the largemagnitude earthquakes.
3. The four different models have distinct features. Inthe model A, a Parkfield-type asperity can be easilyseen. The asperity region has fewer low magnitudeearthquakes and has many large magnitude (m>6)earthquakes. The model U is very similar to the non-asperity region of model A.
4. Around the x=70 km region, parallel to the z-axis inthe U, A, and F models, there are many large (m>6)earthquakes due to the combination of a seismiccreep just outside of the computational grid (andtaken as the boundary conditions in earthquakesimulation software) and the presence of the largeearthquake patches.
5. For M data set the largest events are distributedalmost evenly along the X coordinate.
6. The rarefied regions for M data set seem to be lessperiodic. They apparently do not form fully devel-oped strips, as shown in other data sets in Fig. 1.
We do not find any correlation between the magni-tudes and the locations. For all data sets this is purelyrandom. No stationary clustering of earthquakes isobserved except in the case of the large influence wieldedby the imposed great earthquake patches. Therefore, amere visualization of raw data sets does not answerimportant questions about spatio-temporal structures ofsmall and large patches of events. To extract thesestructures we use clustering procedures based on simi-larity of events in the feature space, which consists oftwo spatial coordinates, one time coordinate and mag-nitude of events. In such a feature space, a single eventwill be characterized by feature vector [Xi, Zi, ti, mi]where i represents an index of the event.
Clustering procedure
Clustering is a mathematical concept, which has beenused for a long time in pattern recognition (Andenberg1973; Jain and Dubes 1988; Theodoris and Koutroum-bas 1998) and has many applications. Nowadays theclustering is an important tool for revealing features indata mining process (Xiaowei et al. 1999; Grossman et al.2001; Hand et. al. 2001; Hastie et al. 2001). Clustering isused for classifying N-dimensional vectors, with thesimilarity (or dissimilarity) measure defined betweenthe vectors. The number of vectors is M. Depending onthe data structures, different clustering schemes must beapplied (Gowda and Krishna 1978; Keilis-Borok andKossobokov 1990; Faber 1994; Su and Chou 2001;Nesvorny et al. 2002). There are two main approachesfor classifying the data.
The first method calls for a non-hierarchical extrac-tion of clusters. This approach is used mainly forextracting compact clusters by using global knowledgeabout the data structure. The most well-known and
simplest techniques are based on the K-means algorithm(Theodoris and Koutroumbas 1998; Faber 1994; Su andChou 2001). The basic problem with K-means is that thefinal classification, such as the one shown in Fig. 2, re-presents the local minimum of a criterion function. Thusfor multi-modal functions, starting from different initialiterations, one can obtain different cluster structures.Because global information about the data is required forthe non-hierarchical schemes, the non-hierarchical algo-rithms suffer also from a high computational complexityand most of them require a priori knowledge about thenumber of clusters. These techniques fail for elongated,bridged clusters (Dzwinel and Basiak 1999) and clusterswith a different density appearing in simulations withparticles (Boryczko et al. 2003).
Agglomerative clustering schemes (Andenberg 1973;Theodoris and Koutroumbas, 1998) consist in the sub-sequent merging of smaller clusters into the larger clus-ters (see Fig. 3), based on a proximity criterion.Depending on the definition of the proximity measure,many agglomerative schemes exist such as: average link,complete link, centroid, median and minimum variancealgorithm. The hierarchical schemes are very fast forextracting localized clusters with non-spherical shapesand clusters emerging in time-evolving processes(Dzwinel and Basiak 1999). All of them suffer from theproblem of wrong classification at the early stage ofclustering, which may yield erroneous results. Thistrouble can be partly overcome by controlling the processof clustering by using threshold parameters and inter-rupting the process before a wrong classification is made.
Fig. 2a, b Initial conditions and final result of clustering obtainedby using the K-means algorithm. The data vectors represented bysmall circles are classified to the clusters, the centers of which areshown as black dots. The number of centers is equal to the numberof expected clusters. At first, the centers are generated randomly.The data points closest to the respective centers produce transientclusters. New centers are computed for these clusters and theprocedure is repeated, until the centers become stable
Fig. 3 Conceptual scheme of agglomerative clustering. The datapoints are agglomerated successively according to the nearestneighbor rule in metric space defined in the feature space
16
Most agglomerative clustering schemes cannotextract neighboring clusters of different density, bridgedclusters or clusters of complicated shapes. Therefore, forprocessing of earthquake data, we have used theagglomerative mutual nearest neighborhood (mnn)algorithm proposed by Gowda and Krishna (1978).
The advantage of the mnn scheme over otheragglomerative procedures lies in the hierarchical defi-nition of the proximity measure. The proximity mea-sure responsible for merging vectors into clusters isconstructed on the basis of two types of distances: mnn
distance and local proximity conditions. The mnn
distance concept can be outlined as follows:
1. Let us consider an ensemble R0 consisting of MN-dimensional data vectors xi and i=1,2,...,M.
2. Compute distances d(xi, xj) between vectors xi andthe rest of vectors xj.
3. Find the lists Li of Ncut nearest neighbors j of vectorxi such that d(xi, xj)<Rcut for each vector i.
4. Sort out the neighbors j in the lists in ascending orderaccording to the d(xi, xj) values for i and j datapoints. Thus Li(k)=j, where k is the position of thedata point j in the i’th list and Lj(m)=i, where m isthe position of the data point i in the j’th list.
5. Because Li(k)=j and Lj(m)=i, compute mnn(i,j)distances defined as: mnn(i,j)=m+k. The maximummnn distance is less than 2 Ncut.
In contrast to the original scheme, we have intro-duced an additional threshold value, Rcut, apart fromthe maximal number of nearest neighbors Ncut. Thevalues of Ncut and Rcut support a mechanism forextracting clusters of different density. Ncut decides theresolution level of clustering. The smaller Ncut, thefiner cluster structure can be revealed. The value ofRcut decides the density of extracted clusters. LargerRcut makes it possible to extract clusters of variousdensities. Both parameters are data-dependent and arechosen heuristically. The mnn(i,j) distances are sortedout in ascending order. The data pairs (i,j) having thesame mnn(i,j) distance are also sorted out in the sameway, but according to the d(,) measure between thevectors. A serial agglomerative clustering algorithm isgiven as follows:
1. initiate—neighbors search
a. Choose R0={Ci={xi}, i=1,...,M}b. Create the list W(t), of particle pairs (i,j), where
t=0,1,2,...,MN and MN is the number of pairs,sorted out in increasing mnn and the Euclideandistances between i and j
c. t=0
2. repeat—merge clusters
a. Check if the data points (i,j) from W(t) belong todifferent clusters Ci and Cj, respectively.
b. If not: t=t+1 and go to 2c. If yes: merge clusters, i.e., Ci=Ci[Cj
d. Rt=Rt-1){Cj}e. t=t+1
3. finish if t=MN
Finding the nearest neighbors consumes most of thecomputational time of the mnn scheme, as in the case alsofor particle-based algorithms. For searching neighbors in3-D space, however, an efficient O(M) algorithm exists,which employs the linked-list concept (Hockney andEastwood 1981). The proximity conditions will be definedon the basis of the data structure to be analyzed. Largerdata sets may require the parallel algorithm (Faber 1994;Xiaowei et al. 1999) for more rapid analysis.
Visualization of the cluster data
Data visualization alone is no longer sufficient forelucidating great amounts of data. Instead, what isrequired is the use of current scientific visualizationpackages which can truly integrate modern 3-Dgraphic techniques, such as arbitrarily oriented planarcuts, isosurfaces, volume rendering, and segmentation,with data analysis and data mining techniques. Thesemodern techniques are needed to extract relevant fea-tures from the data and allows their rapid interpreta-tion. The Amira package fills the bill for thesechallenging visualization tasks for researchers (http://www.amiravis.com). Its very broad field includes, e.g.,geophysical data and results from large-scale simula-tions involving both scalar and vector fields. It canquickly analyze and visualize large 3-D data setsthrough a wide variety of reduced representations andemploys scripts for efficient operation. Geophysicalapplications of Amira can be found in Erlebacher et al.(2001). The package recognizes several mesh types,such as structured curvilinear grids, tetrahedral meshesand scattered data. Moreover, Amira allows the userto implement new algorithms without recompilation.The developer version enables the users to constructtheir own modules for developing a complex, inte-grated visualization environment. Erlebacher and Yuen(2003) describe an Amira module to perform wavelettransforms of input data using Amiradev, a tool inAmira that allows users to write their own extensions.Amira can be used both locally by standard computingresources, such as on a laptop, or large-display visu-alization hardware (such as the Power Wall http://www.lcse.umn.edu) and can represent one of theremote services available via GRID structures (Erleb-acher and Yuen 2003), enabling extensive visualizationbandwidth across the network.
In the following section, we will demonstrate howclustering analysis and 3-D visualization work in con-cert in extracting seismic structures from earthquake
17
data. Clustering is a powerful filter for quantizationand extraction of patterns from the raw and noisyseismic data. On the other hand, visualization usingAmira allows one not only to clarify cluster structuresbut also to control the clustering parameters, which areusually chosen heuristically.
Clustering of earthquake events basedon the similarity measure
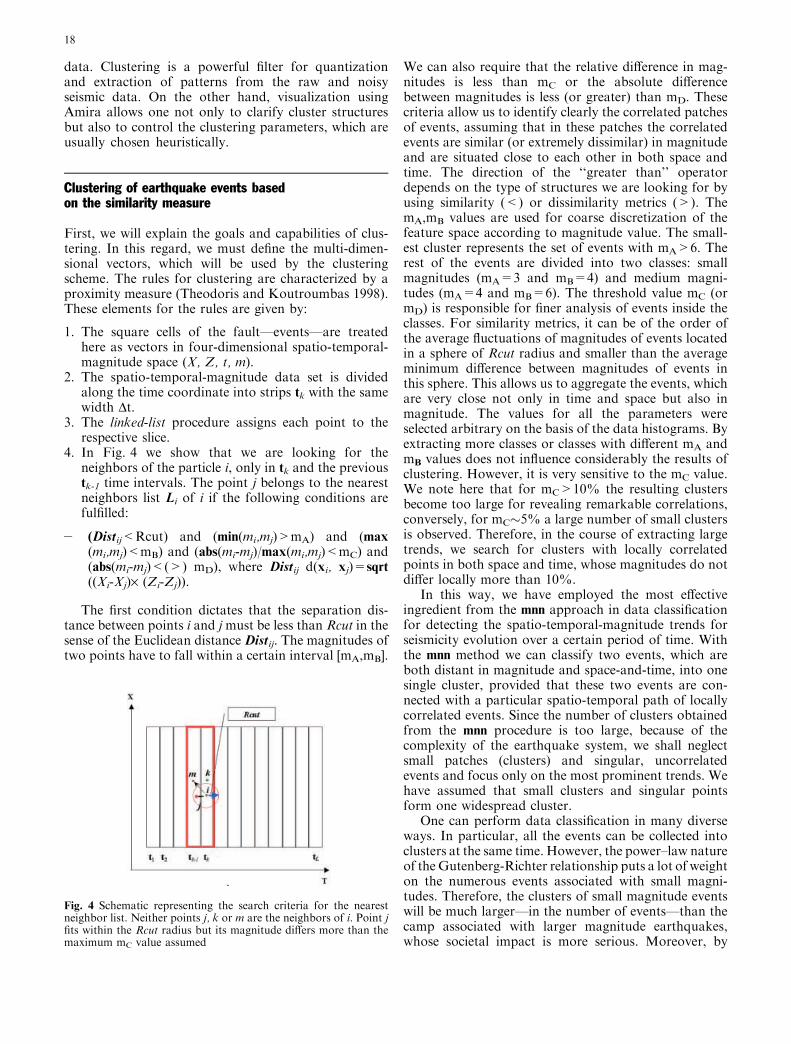
First, we will explain the goals and capabilities of clus-tering. In this regard, we must define the multi-dimen-sional vectors, which will be used by the clusteringscheme. The rules for clustering are characterized by aproximity measure (Theodoris and Koutroumbas 1998).These elements for the rules are given by:
1. The square cells of the fault—events—are treatedhere as vectors in four-dimensional spatio-temporal-magnitude space (X, Z, t, m).
2. The spatio-temporal-magnitude data set is dividedalong the time coordinate into strips tk with the samewidth Dt.
3. The linked-list procedure assigns each point to therespective slice.
4. In Fig. 4 we show that we are looking for theneighbors of the particle i, only in tk and the previoustk-1 time intervals. The point j belongs to the nearestneighbors list Li of i if the following conditions arefulfilled:
– (Distij<Rcut) and (min(mi,mj)>mA) and (max
(mi,mj)<mB) and (abs(mi-mj)/max(mi,mj)<mC) and(abs(mi-mj)<(>) mD), where Distij d(xi, xj)=sqrt
((Xi-Xj)· (Zi-Zj)).
The first condition dictates that the separation dis-tance between points i and j must be less than Rcut in thesense of the Euclidean distance Distij. The magnitudes oftwo points have to fall within a certain interval [mA,mB].
We can also require that the relative difference in mag-nitudes is less than mC or the absolute differencebetween magnitudes is less (or greater) than mD. Thesecriteria allow us to identify clearly the correlated patchesof events, assuming that in these patches the correlatedevents are similar (or extremely dissimilar) in magnitudeand are situated close to each other in both space andtime. The direction of the ‘‘greater than’’ operatordepends on the type of structures we are looking for byusing similarity (<) or dissimilarity metrics (>). ThemA,mB values are used for coarse discretization of thefeature space according to magnitude value. The small-est cluster represents the set of events with mA>6. Therest of the events are divided into two classes: smallmagnitudes (mA=3 and mB=4) and medium magni-tudes (mA=4 and mB=6). The threshold value mC (ormD) is responsible for finer analysis of events inside theclasses. For similarity metrics, it can be of the order ofthe average fluctuations of magnitudes of events locatedin a sphere of Rcut radius and smaller than the averageminimum difference between magnitudes of events inthis sphere. This allows us to aggregate the events, whichare very close not only in time and space but also inmagnitude. The values for all the parameters wereselected arbitrary on the basis of the data histograms. Byextracting more classes or classes with different mA andmB values does not influence considerably the results ofclustering. However, it is very sensitive to the mC value.We note here that for mC>10% the resulting clustersbecome too large for revealing remarkable correlations,conversely, for mC�5% a large number of small clustersis observed. Therefore, in the course of extracting largetrends, we search for clusters with locally correlatedpoints in both space and time, whose magnitudes do notdiffer locally more than 10%.
In this way, we have employed the most effectiveingredient from the mnn approach in data classificationfor detecting the spatio-temporal-magnitude trends forseismicity evolution over a certain period of time. Withthe mnn method we can classify two events, which areboth distant in magnitude and space-and-time, into onesingle cluster, provided that these two events are con-nected with a particular spatio-temporal path of locallycorrelated events. Since the number of clusters obtainedfrom the mnn procedure is too large, because of thecomplexity of the earthquake system, we shall neglectsmall patches (clusters) and singular, uncorrelatedevents and focus only on the most prominent trends. Wehave assumed that small clusters and singular pointsform one widespread cluster.
One can perform data classification in many diverseways. In particular, all the events can be collected intoclusters at the same time. However, the power–law natureof the Gutenberg-Richter relationship puts a lot of weighton the numerous events associated with small magni-tudes. Therefore, the clusters of small magnitude eventswill be much larger—in the number of events—than thecamp associated with larger magnitude earthquakes,whose societal impact is more serious. Moreover, by
Fig. 4 Schematic representing the search criteria for the nearestneighbor list. Neither points j, k or m are the neighbors of i. Point jfits within the Rcut radius but its magnitude differs more than themaximum mC value assumed
18
assuming thin time-strips (small Dt value), the largestevents cannot form any clusters. Conversely, for widerstrips in time, we can lose valuable information aboutshort time scale earthquake phenomena. In this vein, wewill follow the same philosophy as in wavelets (Strang andNguyen 1996) and classify the data in a multi-resolutionalmanner with different levels of resolution. In this way, wecan hope to have a better understanding of these intrin-sically multi-scale phenomena.
We perform clustering for each data set (A, U, M, F)in three, arbitrarily chosen magnitude intervals:
1. small events—3<m<4,2. medium events—4<m<6,3. large events—m>6.
Because each model approximately follows theGutenberg-Richter power-law relationship for small andmedium events, the interval of time slices and Rcutvalues increases with decreasing frequency of occurrenceof small, medium and large amplitude events. In Table 4we collected the input parameters used for clustering ofdata for these three cases. We report below the resultsbased on clustering. We neglect the singular events ofmagnitude m<6, i.e., the events which do not belong toany cluster, and the clusters one order of magnitudesmaller in number of events than the largest clusters.They are eliminated from further analysis by comparingthe number of events in each cluster to a threshold value.
In Figs. 5, 6, 7, 8, small events are depicted as coloredpoints. The largest events with m>6 are shown as largerballs. The events belonging to the same cluster have thesame color. Singularly large magnitude events are white.We visualize only those clusters, which are stable, i.e., donot change considerably for clustering parameters whichdiffer about 20% from those collected in Table 4. Ag-glomerative clustering of random data sets with a uni-form statistical distribution of each data component canproduce vastly different clustering patterns for two
Table 4 Basic clustering parameters for the similarity measure
Smallevents
Mediumevents
Largeevents
Number of time slices 450 100–150 30Rcut 1.5–2.0 5–6 �20Nclust 5 5 5mA 3 4 6mB 4 6 10mC 0.1 0.1 0.1–0.3mD 0 0 0
Fig. 5 The clusters of a medium and b small magnitude events(represented by small dots in feature space) for data set A. Theclusters are depicted in color and are numbered 1, 2, 3 and 4. Theborders between clusters are drawn manually. The clusters of largemagnitude events shown as large colored dots are depicted in a andb. The large events belonging to the same clusters are colored anddenoted as a, b, c, d. The white dots represent singular events
Fig. 6 The clusters of a medium and b small magnitude events(represented by small dots in feature space) for data set U. Theclusters are depicted in color and are numbered 1, 2, 3, 4 and 5. Theborders between clusters are drawn manually. The clusters of largemagnitude events shown as large colored dots are depicted in a andb. The large events belonging to the same clusters are colored anddenoted as a, b, c, d. The white dots represent singular events
19
slightly different sets of data. The final large-scale clusterstructure will be then be very sensitive on the ‘‘micro-scopic’’ cluster configuration (‘‘condensation grains’’)emerging at the initial stages of aggregation. Existenceof stable and large cluster structures for various sets ofthe input parameters (such as a slightly distorted datastructure simulated by changing the scopes of magnitudem taken for clustering of small, medium and largeevents) means that the data reproduce a non-uniformstatistical distribution, that is, the data set is not randomand has inscribed spatio-temporal patterns.
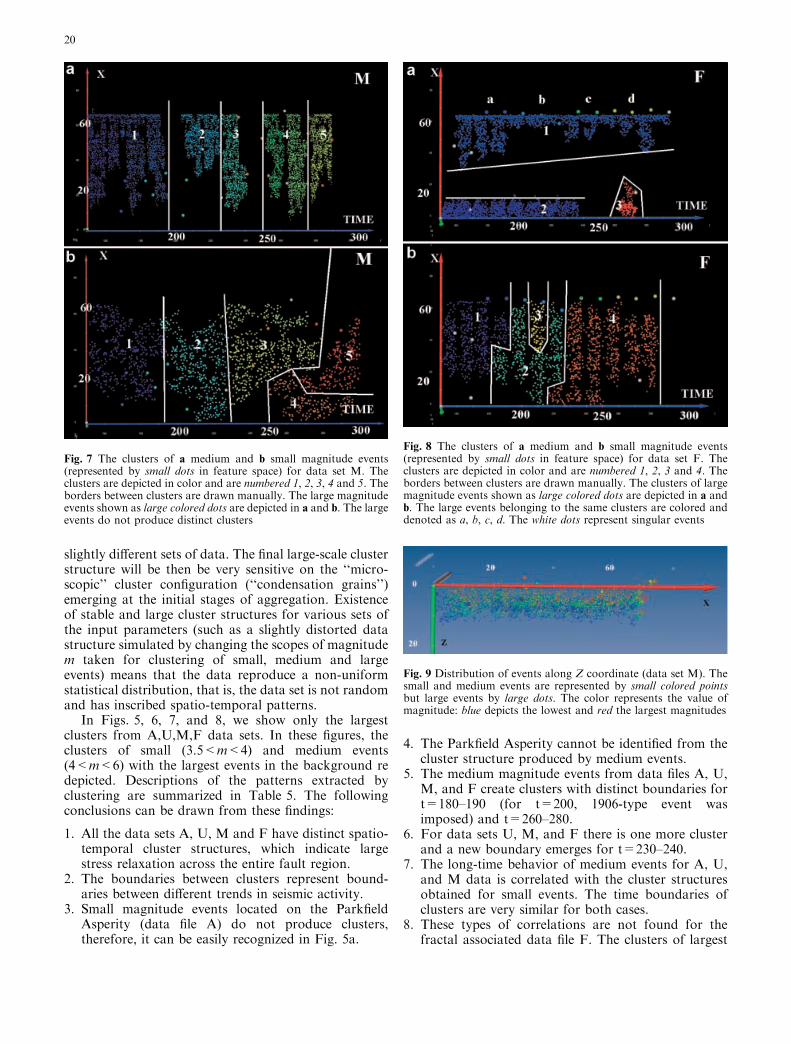
In Figs. 5, 6, 7, and 8, we show only the largestclusters from A,U,M,F data sets. In these figures, theclusters of small (3.5<m<4) and medium events(4<m<6) with the largest events in the background redepicted. Descriptions of the patterns extracted byclustering are summarized in Table 5. The followingconclusions can be drawn from these findings:
1. All the data sets A, U, M and F have distinct spatio-temporal cluster structures, which indicate largestress relaxation across the entire fault region.
2. The boundaries between clusters represent bound-aries between different trends in seismic activity.
3. Small magnitude events located on the ParkfieldAsperity (data file A) do not produce clusters,therefore, it can be easily recognized in Fig. 5a.
4. The Parkfield Asperity cannot be identified from thecluster structure produced by medium events.
5. The medium magnitude events from data files A, U,M, and F create clusters with distinct boundaries fort=180–190 (for t=200, 1906-type event wasimposed) and t=260–280.
6. For data sets U, M, and F there is one more clusterand a new boundary emerges for t=230–240.
7. The long-time behavior of medium events for A, U,and M data is correlated with the cluster structuresobtained for small events. The time boundaries ofclusters are very similar for both cases.
8. These types of correlations are not found for thefractal associated data file F. The clusters of largest
Fig. 9 Distribution of events along Z coordinate (data set M). Thesmall and medium events are represented by small colored pointsbut large events by large dots. The color represents the value ofmagnitude: blue depicts the lowest and red the largest magnitudes
Fig. 7 The clusters of a medium and b small magnitude events(represented by small dots in feature space) for data set M. Theclusters are depicted in color and are numbered 1, 2, 3, 4 and 5. Theborders between clusters are drawn manually. The large magnitudeevents shown as large colored dots are depicted in a and b. The largeevents do not produce distinct clusters
Fig. 8 The clusters of a medium and b small magnitude events(represented by small dots in feature space) for data set F. Theclusters are depicted in color and are numbered 1, 2, 3 and 4. Theborders between clusters are drawn manually. The clusters of largemagnitude events shown as large colored dots are depicted in a andb. The large events belonging to the same clusters are colored anddenoted as a, b, c, d. The white dots represent singular events
20
events are weakly correlated with the cluster bound-aries of small and medium events. From Figs. 5b, 6b,and 7b, we can discern that some boundaries betweenclusters of medium events match the boundariesbetween different patches of the largest events.This impacts the cases where the distribution of largerevents along the X-axis changes rapidly with time.For example, the largest events represented by thecluster of blue balls in Fig. 5b are more scatteredalong X-axis than in other clusters. At this time point,the boundary between medium and small magnitudeevents emerges. This time point is close to the1906-type event, which was imposed into the model.
The same can be observed for U and F data.However, for the M data set, the picture is not soclearly depicted.
In Fig. 9, we can observe that the events are distrib-uted heterogeneously along the Z (depth)-axis. They areconcentrated mainly in the center of the depth interval.At the same time, the smallest magnitude events (darkblue) are situated farther away than the events withmedium and the largest magnitudes (red). By applyingthe functional modules from Amira for 3-D spline in-terpolation to the raw earthquake data, we carried outvolume rendering of the interpolated results and pro-
Table 5 Cross-correlation features between clusters of data
D Properties Cross-correlations
Small events Medium events
A Small events 4 Clusters Clusters 2 and 4 (small events)correlate with the borders betweenclusters (medium events) 1–2 and3–4, respectively
2 Large—border t=230–2402 Small—expanding from [180–200]and [260–280]
Parkfield asperity can be seenMedium events 3 Clusters
1–2 Border t=180–2002–3 Border t=270–280
Large events 3 Larger clusters No correlations Cluster 1 corresponds to cluster a,and 3 to ca–b Border t=170–200
c–2 border t=270–280U Small events 5 Clusters Two small clusters correlate in time
with the borders between clustersfor medium events
3 Large 1–2–51–2 Border t=1702–5 Border t=2702 Small—expanding from [190–200] (3)and [230–240] (4)
Medium events 5 Clusters1–2 Border t=140–2003–4 Border t=230–2404–5 Border t=260–270
Large events 4 Clusters Same correlation seen Same correlation seenM Small events 5 Clusters Good correlation between cluster
borders for small and mediumevents
Gaps between 1 and 2, 3 and 4, 5 clusters1–2 Border t=1702–3 Border t=2303–4 Border t=2504–5 Border t=280
Medium events 5 ClustersGaps between 1 and 2, 3 and 4, 5clusters
Large events No meaningful clusters No correlations No correlationsF Small events 3 Clusters No correlations
2 Large placed on the opposite sidesof X coordinate
1 Small close to the large event m>6Medium events 4 Clusters
Fine structure of clusters gaps1–2 Border t=160–1802–4 Border t=220–2304- Border t=280
Large events 4 Small clusters No correlations Some correlations between bordersof medium-events clusters can beseen
21
duced on-screen pictures similar to those shown inFig. 10. We can observe red spots representing the vol-umes of spatio-temporal space of the highest seismicactivity. The spots are located mainly close to the bor-ders of the depth interval, i.e., close to the surface andthe depth limit of the model. Combining the results fromclustering with the map of seismic activity produced byAmira, we can conclude from Fig. 11 that the occur-rence of the highest seismic activity zones is well corre-lated with the borders of clusters. This comparisonconfirms our assumption that changes of trends repre-sented by clusters are captured by the presence of sin-gularities and rapid transitions in the seismic activitiesinside the zone.
Clustering of earthquake events basedon the dissimilarity measure
From the previous analysis we have noted that theclustering method, which uses mathematically theproximity measure and relies heavily on the similaritybetween the magnitudes of locally distributed events,fails utterly in finding the correlations between thelargest events and the cluster structures obtained forsmall and medium events. Therefore, as a different re-sort, we turned our attention to searching for the clusterstructures with the greatest dissimilarity between thelargest and the smallest magnitude events. In Table 6 we
collected the input parameters for the clustering code.Our goal is to find the low magnitude data structuresassociated with the largest events or some series con-sisting of them. As shown in Fig. 9, the largest magni-tude events and the small ones, which are placed insidehigh-density data regions, are highly correlated. Clustersof small events precede and follow the largest events.The largest events, in turn, are clustered in short patches.In most cases, the large events are singular in time andare not accompanied by any clusters of small events.
Figure 12 exhibits this behavior very clearly. Incomparison to the raw data (see Fig. 3), the stochasticnoise has been filtered out. It is obvious that only afraction of small events corresponds to the largest event.However, from Fig. 12 and movies from Fig. 2Sa,b (seeelectronic supplementary material), it appears that thereare certain clusters with small events, which generate asingularly large event. In Fig. 12Sa,b (electronic sup-plementary material), we demonstrate the possibilities ofthe Amira package in the inspection of cluster patterns.By zooming into the interesting fragments of the data,we are able to go through the data, searching for thestructure of multi-resolutional patterns. Unlike the uni-form data (A in Fig. 12a), for data sets M (Fig. 12b), wecannot find any dense data region, which is disconnectedfrom one of the largest events. The clusters obtainedreflect also the long-time behavior similar to that ob-served in Table 5 and Figs. 5, 6, 7, and 8. We can easilyrecognize similar boundaries along the time axis betweenthe clusters, such as those portrayed by the measure ofsimilarity shown in the figures.
Concluding remarks
In this work we have set out explicitly to extract salientinformation from the gargantuan heap of syntheticearthquake data. We propose here clustering methods asa means of alleviating this difficult data-mining problem.Thus we have employed synergetically both the mnn
agglomerative clustering scheme and the Amira 3-D vi-sualization package. The classification of events intoclusters is performed by clustering algorithms. Theclusters can be visualized over the network by Amira,which allows one to controll simultaneously theparameters of clustering.
We demonstrate that detection of complex trends inseismic activity, which are portrayed by clusters, is the
Table 6 Input parameters for the dissimilarity measure
All events
Number of time slices 30–70Rcut 70Nclust 128mA 3mB 10mC 100mD 2.55
Fig. 11 Combined Z-t cross section employing clustering resultsand isolines of magnitude. The largest magnitude events producingelongated and singular bunches of isolines (red) correlate with theborder of clusters (dark blue, light blue, yellow and red clusters) ofmedium magnitude events from data set M
Fig. 10 3-D distribution of magnitude m averaged out by usingAmira volume rendering module (data set U). Red denotes highmagnitude, blue is the lowest m
22
most valuable contribution of the mutual nearestneighborhood clustering scheme. Because our clusteringscheme is relatively fast—for M�104 the scheme re-quires 20 s of CPU time of an R14000 500-MHz pro-cessor—visualization with the Amira package allows notonly the clear elucidation of the 3-D cluster structures,but also the control of clustering parameters, which areusually defined heuristically. This methodology is com-plementary to the short-time techniques presented inEneva and Ben-Zion (1997a, 1997b). We show that un-like the approaches presented in Eneva and Ben-Zion(1997a, 1997b), where the analysis involves one-dimen-sional time series of averaged out seismic parameters,our approach involves four-dimensional raw datadefined by principal coordinates of earthquake events:localization in space and time and magnitude. Wedemonstrate convincingly that the raw synthetic earth-quake data generated by computational model presented
in Ben-Zion (1996) reveal well-defined, spatio-temporalcluster structures. These clusters reflect clearly the long-term trends in overall seismic activity initiated by rapidchanges in local activity generated by strong singularevents or clusters involving the largest magnitude events.
The cluster structure is very sensitive to the variationsin mechanical properties of the fault zone, such as as-perities. Conversely, we can derive valuable informationabout the mechanical and rheological properties of thefault zone from a detailed analysis of the seismic eventclusters. However, in spite of the apparent differencesbetween cluster structures obtained for four differentmodels considered here, model with uniform properties(U), with a Parkfield-type asperity (A), with fractalbrittle properties (F), and with multi-size-heterogeneities(M), they have some commonly shared characteristics.The clusters obtained for these models expose similartime boundaries of trends in seismic activity resulting
Fig. 12 The clusters formed indata sets A and M for a largedissimilarity in magnitudebetween events (see Fig. 12Sa,Sb in the electronicsupplementary material and themovies provided therein). Themovies demonstrate very clearlythe great potential for datainvestigation with the Amirapackage. This proves to beespecially advantageous formuch larger data sets, forexample, data sets ten timeslarger than A or M
23
from similar initial conditions imposed in all the models.We show also that by combining both the Amira inter-polation and rendering modules with clustering, we areable to correlate better the singular events with trendsrepresented by spatio-temporal cluster structures.
We demonstrate that the analysis of clusters for dif-ferent magnitude intervals can play a role similar to themulti-resolution capabilities of discrete wavelet trans-form (Strang and Nguyen 1996). As an example, we showthat the clusters of small magnitude events reveal finerspatio-temporal structures of seismic trends than thoseobtained from clustering of medium and large magnitudeevents. Likewise, we can carry out multi-resolutionanalysis of data not only for magnitudes, but also inspace and time. We show that by employing differentrules of clustering—for example, looking for dissimilar-ities between events, instead of similarities—we can studyshort-time changes in seismic activity. The foreshock andaftershock of each large earthquake can be very clearlyseen as a cluster of small magnitude earthquakes.
In the near future we intend to incorporate into themodel some elements of short-time analysis, developedon the basis of seismicity parameters (Eneva and Ben-Zion 1997a, 1997b). For example, a time event, i.e., anaggregated event averaged in space and magnitude, canbe represented by seven seismic parameters defined inEneva and Ben-Zion (1997a, 1997b). After clustering andmapping, e.g., by using the Sammon’s mapping proce-dure (Dzwinel 1994; Dzwinel and Basiak 1999), trans-forming 7-D space into 3-D space, thus conserving themulti-dimensional cluster structure, these seven-dimen-sional clusters of events can be visualized by the Amiravisualization package. We expect that the simultaneousanalysis of multi-dimensional structures can reveal cross-correlations, which were missed in the one-dimensionalanalysis presented in Eneva and Ben-Zion (1997a,1997b). Thus, we conclude that multi-resolution andmulti-dimensional analysis of earthquakes, using patternrecognition schemes and modern visualization tools, willrepresent a new and very appealing approach forstudying long-time seismic activity in earthquake-pronezones, e.g., the San Andreas Fault. However, for study-ing long-time correlations in seismic activity, e.g., theirperiodicity or other types of regularity in spatio-temporalspace, much longer time intervals must be analyzed, anddifferent models and many pattern recognition tech-niques examined. We anticipate that in the near future,the clustering analysis of huge data sets produced fromlarge-scale and multi-parametric simulations of earth-quakes will require the integration of various simulationengines with pattern recognition techniques within theGRID environment (Foster and Kesselman 1998; Gan-non 1998; Fox et al. 2002; Brezany et al. 2002; Dutka andKitowski 2002).
Acknowledgements We are grateful for discussions with ProfessorMathias Holschneider, Professor Gordon Erlebacher, Dr. TomoK.B. Yanagawa, Zack A.O. Garbow, and Erik O.D. Sevre. Thisresearch was supported by the NSF geophysics program and the
Complex Fluids Program of the Department of Energy and AGHinternal fund 10.10.120.421.
References
Andenberg MR (1973) Clusters analysis for applications. AcademicPress, New York
Bak PC (1996) How Nature works: the science of self-organizedcriticality. Copernicus Springer Verlag, New York
Bak PC, Tang K, Wiesenfeld K (1987) Self-organized criticality: anexplanation of 1/f noise. Phys Rev Lett 59:381
Barnes JE, Hernquist L (1996) Transformation of galaxies. II. Gas-odynamics in merging disk galaxies. Astrophys J 471:115–142
Ben-Zion Y (1996) Stress, slip, and earthquakes in models ofcomplex single-fault systems incorporating brittle and creepdeformations. J Geophys Res 101(B3):5677–5706
Boryczko K, Dzwinel W, Yuen DA (2003) Clustering revealed inhigh-resolution simulations and visualization of multi-resolu-tion features in fluid-particle models. Concurrency and com-putation: practice and experience (in press)
Brezany P, Bubak M, Malawski M, Zajac K (2002) Large-scalescientific irregular computing on clusters and grids. In: SlootPMA, Tan KCJ, Dongara JJ, Hoekstra AG (eds) Proc Int ConfComputational Science (ICCS), Amsterdam, 21–24 April, vol I,Lecture Notes Comput Sci 2330:484–493
Briceno C, Vivas AK, Calvet N, Hartmann L, Pacheco R, HerreraD, Romero L, Berlind P, Sanchez G, Snyder JA, Andrews P(2001) The CIDA-QUEST large-scale survey of Orion OB1:evidence for rapid disk dissipation in a dispersed stellar popu-lation. Science 29:93–96
Dutka Ł, Kitowski J (2002) Application of component-experttechnology for selection of data-handlers in CrossGrid. In:Kranzlmuller D, Kascuk P, Dongarra JJ, Volkert J (eds) Recentadvances in parallel virtual machine and message passing in-terface. 9th European PVM/MPI Users’ Group Meeting, Linz,Austria, 29 September–2 October 2002, Proceedings, no 2474.Lecture Notes Comput Sci 2474:25–32
Dzwinel W (1994) How to make Sammon’s mapping useful formulti-dimensional data structures analysis. Pattern Recognition27/7:949–959
Dzwinel W, Blasiak J (1999) Method of particles in visual clus-tering of multi-dimensional and large data sets. Future GenerComput Syst15:365–379
Dzwinel W, Boryczko K, Yuen DA (2003) A discrete-particlemodel of blood dynamics in capillary vessels. J Colloid Inter-face Sci (in press)
Eneva M, Ben-Zion Y (1997a) Techniques and parameters to an-alyze seismicity patterns associated with large earthquakes.J Geophys Res 102(B8):785–795
Eneva M, Ben-Zion Y (1997b) Application of pattern recognitiontechniques to earthquake catalogs generated by model of seg-mented fault systems in three-dimensional elastic solids. J Geo-phys Res 102(B11):513–528
Erlebacher G, Yuen DA (2003) A wavelet toolkit for visualizationand analysis of large data sets In earthquake research. PureAppl Geophys 2003 (in press)
Erlebacher G, Yuen DA, Dubuffet F (2001) Current trends anddemands in visualization in the geosciences. Electronic Geosci 4http://link.springer-ny.com/link/service/journals/10069/technic/erlebach/index.htm
Faber V (1994) Clustering and the continuous k-means algorithm.Los Alamos Sci 22:138–149
Foster I, Kesselman C (eds) (1998) Building a computational grid:state-of-the art and future directions in high-performancedistributed computing. Morgan-Kaufmann, San Francisco
Fox G, Sung-Hoon Ko, Pierce M, Balsoy O, Kim J, Lee S, Kim K,Oh S, Rao X, Varank M, Bulut H, Gunduz G, Qiu X, Pallic-kara S, Uyar A, Youn Ch (2002) Grid services for earthquakescience. Concurrency Computation Practice Experience 14(6–7):371–393
24
Freed AM, Lin J (2001) Delayed triggering of the 1999 HectorMine earthquake by viscoelastic stress transfer. Nature411:180–183
Gannon D (1998) Developing component architectures for dis-tributed scientific problem solving. IEEE Comput Sci Eng5(2):50–63
Gowda CK, Krishna G (1978) Agglomerative clustering using theconcept of nearest neighborhood. Pattern Recogn 10:105
Grossman RL, Karnath Ch, Kegelmeyer P, Kumar V, NamburuRR (2001) Data mining for scientific and engineering applica-tions. Kluwer, Dordrecht
Hand D, Mannila H, Smyth P (2001) Principles of data mining.MIT Press, Cambridge, MA
Hastie T, Tibshirani R, Friedman J (2001) The elements of statisticallearning: data mining. Inference and prediction. Springer,BerlinHeidelberg New York
Hockney RW, Eastwood JW (1981) Computer simulation usingparticles. McGraw-Hill, New York
Lyakhovsky VY, Ben-Zion Y, Agnon A (2001) Earthquake cycle,fault zones, and seismicity patterns in a rheologically layeredlithosphere. J Geophys Res 106:4103–4120
Nesvorny D, Bottke WF Jr, Dones L, Levinson HF (2002) Therecent breakup of an asteroid in the main-belt region. Nature417:720–722
Rundle JB, Gross S, Klein W, Fergusen C, Turcotte DL (1997) Thestatistical mechanics of earthquakes. Tectonophysics 277:147–164
Rundle JB, Klein W, Tiampo K, Gross S (2000) Linear patterndynamics in nonlinear threshold systems. Phys Rev E61(3):2418–2143
Shimazaki K, Nakata T (1980) Time-predictable recurrence modelfor large earthquakes. Geophys Res Lett 7:279–282
Strang G, Nguyen T (1996) Wavelets and filter banks. Wellesley-Cambridge Press, Wellesley, MA
Su MS, Chou Ch (2001) A modified version of the K-means al-gorithm with a distance based on cluster symmetry. IEEE TPattern Anal 23:674–680
Theodoris S, Koutroumbas K (1998) Pattern recognition. Aca-demic Press, San Diego
Xiaowei Xu, Jager J, Kriegel H-P (1999) A fast parallel clusteringalgorithm for large spatial databases. Data Mining KnowledgeDiscovery 3(3):263–290