15

• Multi-thematic and longitudinal database
• National, urban-rural and regional representation
• The approximate sampling size is 8,440 households with approximately 35,000 individual interviews
Panel 2002 2005 2009

MXFLS
Household Community
Household Individual
Book C: Control
Book I: Consumption
Book II: Household Economy
Book IIIA:Adult Household Members
Book IIIB: Adult Household Members
BookIV: Reproductive Health
Book V: Characteristics of Children
Book EA: Edo. Adult Cognitive Ability
Book EN: Edo. Child Cognitive Ability
Medidas antropométricas de salud
Libro D: Dieta
Schools Questionnair
Health Services InfraestructureCommunity
Characteristics
Prices
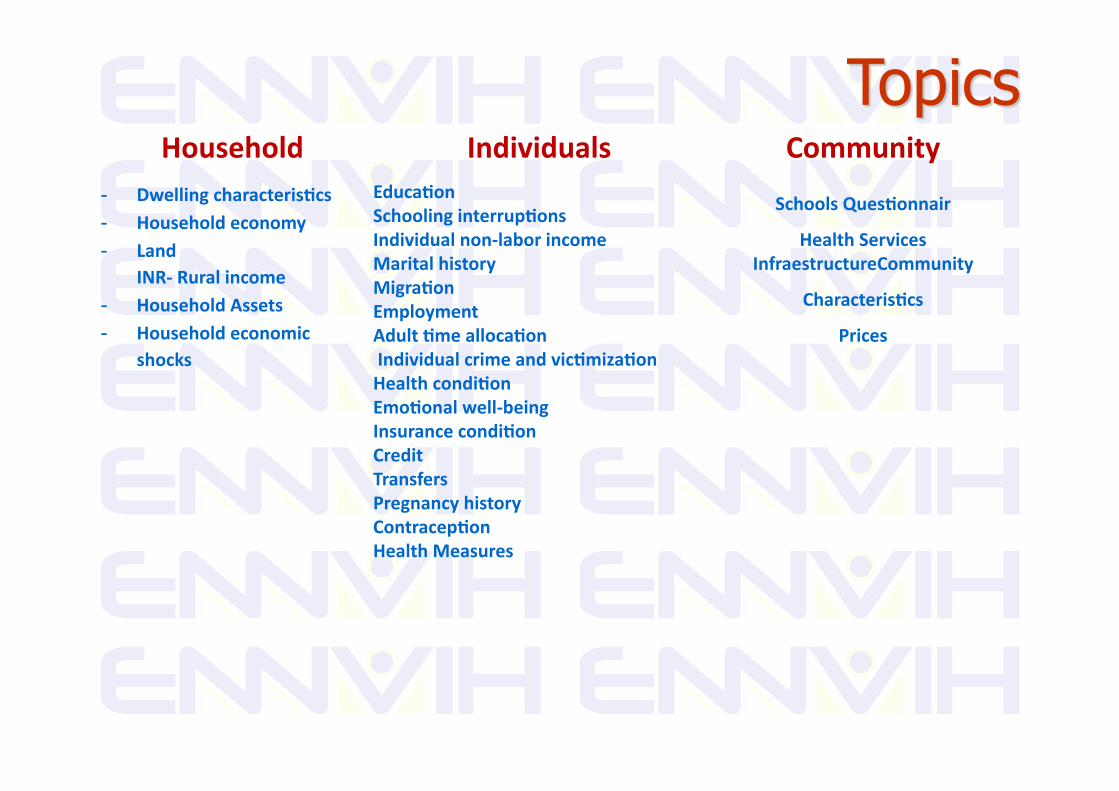
Household- Dwellingcharacteris3cs- Householdeconomy- Land
INR‐Ruralincome- HouseholdAssets- Householdeconomic
shocks
IndividualsEduca3onSchoolinginterrup3onsIndividualnon‐laborincomeMaritalhistoryMigra3onEmploymentAdult3mealloca3onIndividualcrimeandvic3miza3onHealthcondi3onEmo3onalwell‐beingInsurancecondi3onCreditTransfersPregnancyhistoryContracep3onHealthMeasures
Community
SchoolsQues3onnair
HealthServicesInfraestructureCommunity
Characteris3cs
Prices

http://www.ennvih-mxfls.org/
Objective: The purpose of MxFLS-2 is to re-interview all individuals and households who were interviewed during the base line (MxFLS-1) and all individuals and households who, due to the growth and family developments from our original sample size, were added on.
Attritions: For MXFLS it was decided refresh our sample size naturally. In this way, a home or individual is defined as panel if they belong to the original sample size and if they were interviewed during 2002. If on the other hand, new individuals who were integrated into the home and were not interviewed in 2002, but are now considered family members, they would be classified as new members and interviewed for the first time.

Suppose your objective is to analyze a file containing information about different books, you need organize each of the two or more files by order of folio and Ls and subsequently we merge by folio and Ls
Combining MxFLS-1 information with MxFLS-2
Panel Households folio is the same for MxFLS1 and MXFLS2, and the last two digits will be 00.

New Home Folio: If an MxFLS-1 original member has departed from the home and forms his/her own household, that individual’s folio will be made up of the first six digits stemming from the original home and the last two digits will be made up of the individual identifier in MxFLS-1.
pid_link: In order to have an individual identifier in both databases, the identifier pid_link was created, allowing individual identification in both survey rounds. The pid_link is comprised of the individuals’ original folio and ls identifiers, that is to say, the folio and Ls corresponding to MxFLS-1, regardless if the individual is in the original or new household during MxFLS-2. The pid_link is made up of 10 digits, the first 8 digits are the folio digits and the last two correspond to the LS.
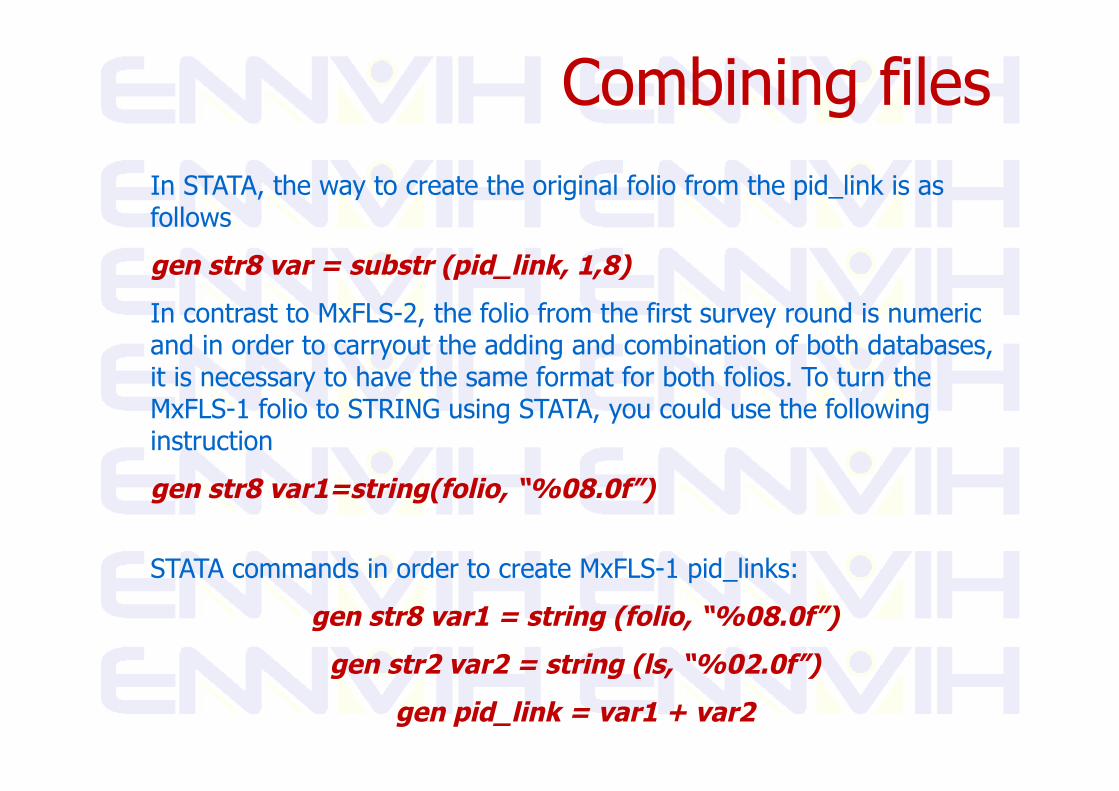
COMUNITARIO In STATA, the way to create the original folio from the pid_link is as follows
gen str8 var = substr (pid_link, 1,8)
In contrast to MxFLS-2, the folio from the first survey round is numeric and in order to carryout the adding and combination of both databases, it is necessary to have the same format for both folios. To turn the MxFLS-1 folio to STRING using STATA, you could use the following instruction
gen str8 var1=string(folio, “%08.0f”)
STATA commands in order to create MxFLS-1 pid_links:
gen str8 var1 = string (folio, “%08.0f”)
gen str2 var2 = string (ls, “%02.0f”)
gen pid_link = var1 + var2

The weight is the value used to adjust the information of the variables captured through a sample in order to multiply the observations to better represent the whole population.
In order to adjust the basic weights, we had to consider the non-response rate of each book independently, such is the reason why each book has a different set of weights
2005 Weights:
a) Continue to expand through 2002, so you must use the 2002 weights, adjusting for nonresponse and adjusting for demographic factor to expand the population. These weights are called longitudinal weights.
b) Expand the population of 2005. To do this we use the weights of 2002, adjusted for nonresponse and adjust for the demographic factor that makes the survey representative of 2005.

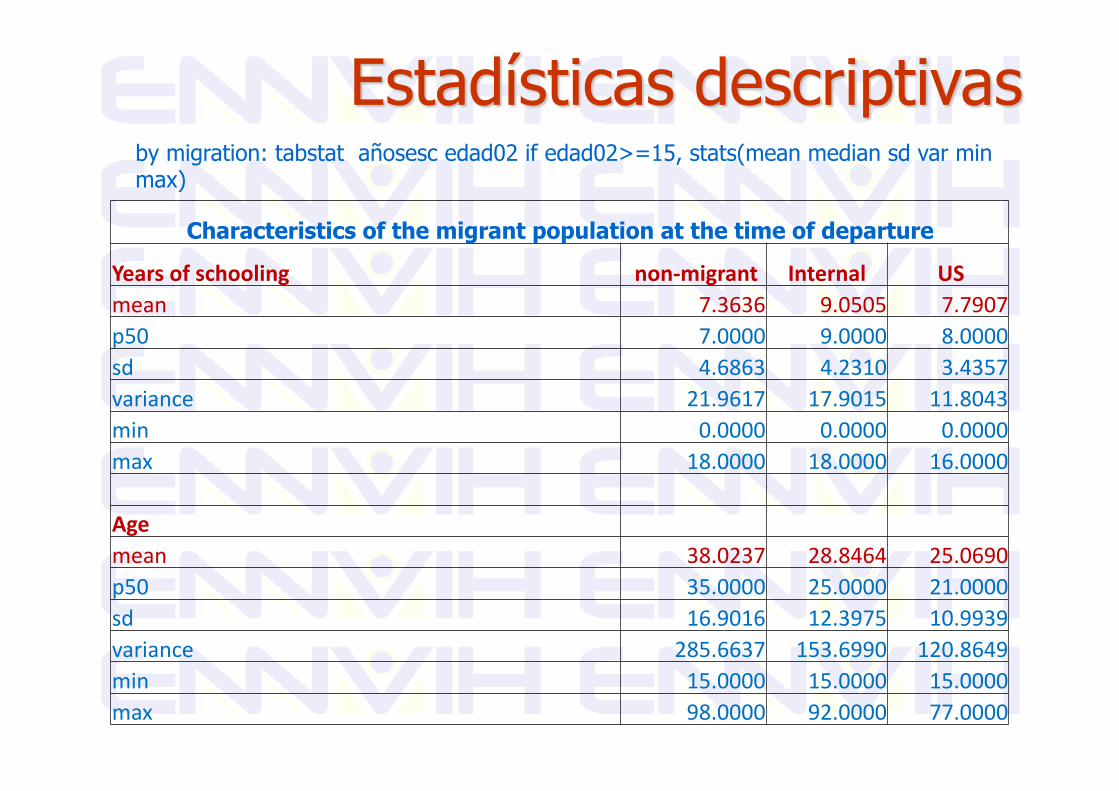
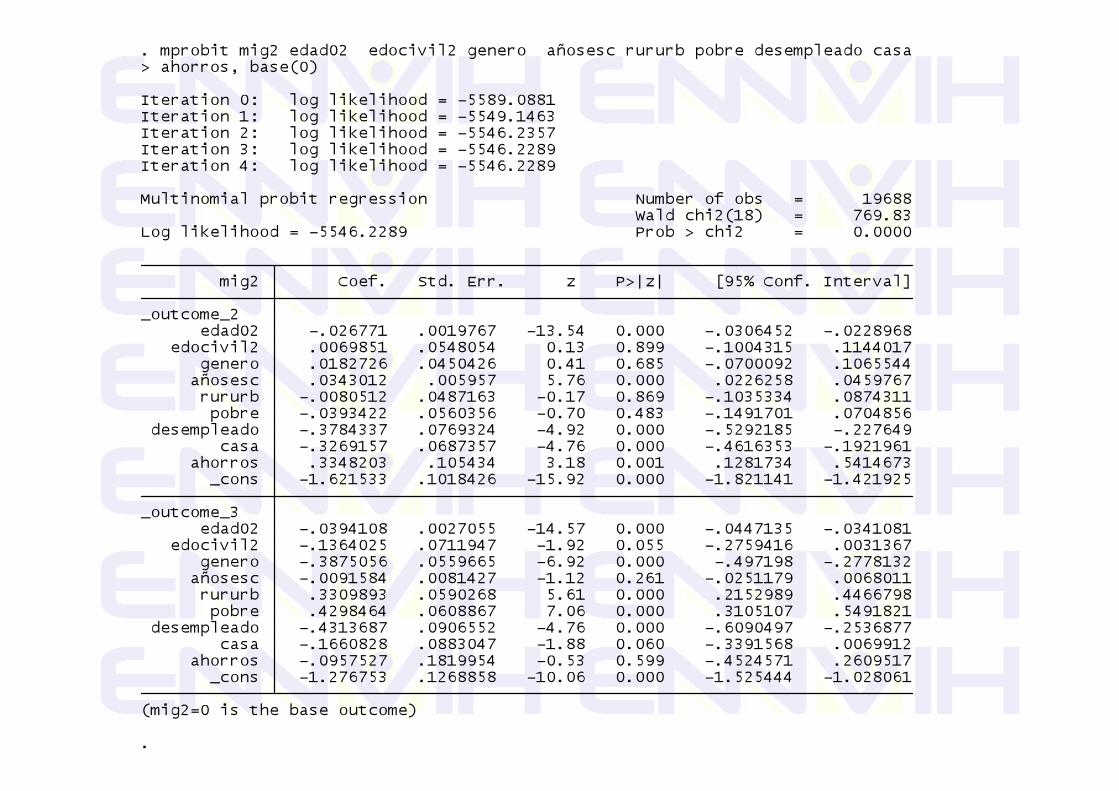
by migration: tabstat añosesc edad02 if edad02>=15, stats(mean median sd var min max)
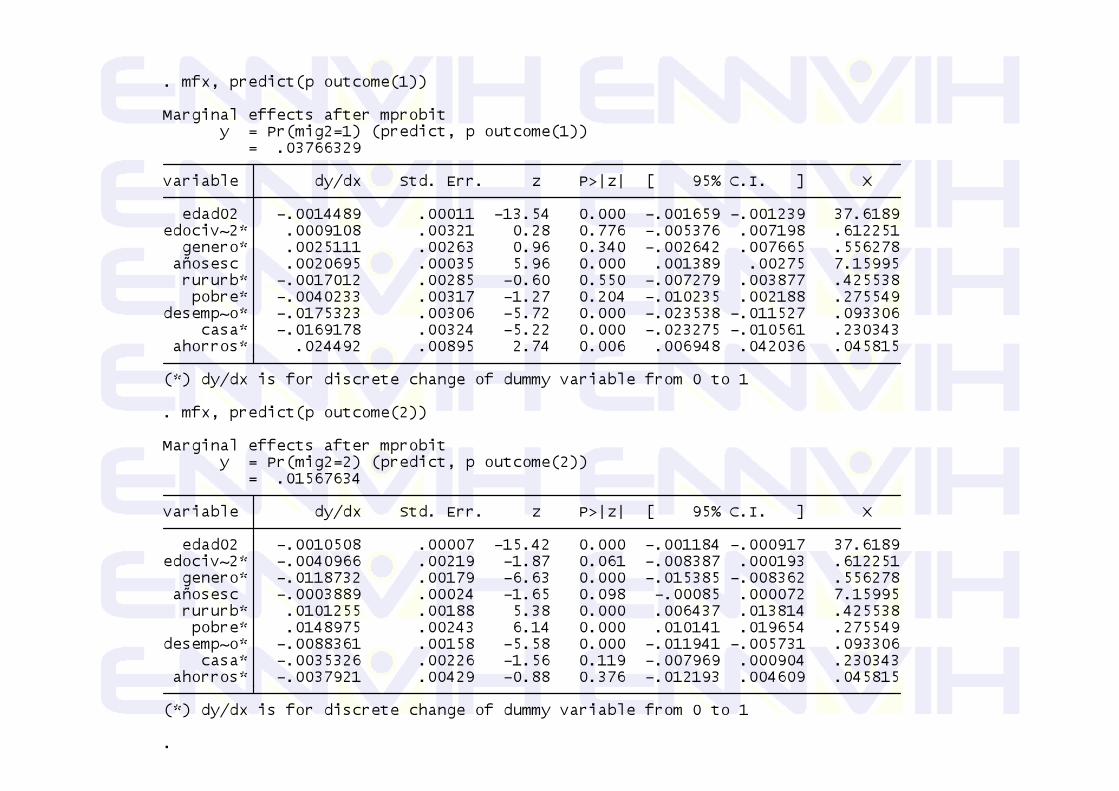
Characteristics of the migrant population at the time of departure
Yearsofschooling non‐migrant Internal USmean 7.3636 9.0505 7.7907p50 7.0000 9.0000 8.0000sd 4.6863 4.2310 3.4357variance 21.9617 17.9015 11.8043min 0.0000 0.0000 0.0000max 18.0000 18.0000 16.0000
Agemean 38.0237 28.8464 25.0690p50 35.0000 25.0000 21.0000sd 16.9016 12.3975 10.9939variance 285.6637 153.6990 120.8649min 15.0000 15.0000 15.0000max 98.0000 92.0000 77.0000