19
Multi-Tier Framework Survey Kenya Preliminary Results for 14 underserved counties in Kenya May 9, 2017 1 Ministry of Energy & Petroleum, Kenya

Multi-Tier Framework Survey Kenya
Preliminary Results for 14 underserved counties in Kenya
May 9, 2017
1
Ministry of Energy &
Petroleum, Kenya

2
Part 1 – Overview of the Approach

Introduction: Profile of Kenya
3
• Unitary state under a Presidential system with some functions devolved to 47 counties led by Governors
• Population: 46 million, GDP: US$ 63.4 Billion, GDP per capita US$ 1,377 (Source: World Bank, 2015)
• About 4.8 million HH (FY 2015/6) connected up from 2.3 million (FY 2012/3) (Source: Kenya Power, 2016)
• 64% of the population have access to grid electricity (MoEP, 2017 estimates)
• Installed capacity at 2,341 MW (Source: Kenya Power 2016)

Key Aspects of the MTF Survey
4
- Moving from a binary approach of measuring electricity access (electrified vs non-electrified) to evaluating this based on MTF’s six attributes of (i) peak capacity, (ii) availability, (iii) reliability, (iv) quality, (v) legality and (vi) safety
- Target including oversampling:

Key Outputs of the MTF Survey
5
• 7,331 interviews were completed (6,025 households, 477 education facilities, 150 health facilities, 133 government offices, 246 worship centers and 305 focus group discussions).
• Extensive dataset covering various aspects including (1647 possible Qs):
- basic demographics, occupation,
- access to finance,
- grid based electricity and non-grid based electricity,
- energy for cooking and other thermal applications
- energy consumption and costs,
- total household consumptions
- exposure to indoor air pollution,
- attitudes towards modern energy, among others.
• 1591 interviews were completed in the 14 underserved counties. This is the focus of this presentation.

Lessons from the MTF
6
• Backend automation: Minimize opportunities for human errors (CAPI, ODK, GIS tools etc.)
• Training approaches: All questions are equal but some are more equal than others
• Layers of verification: GIS maps, use independent verifiers, random calls to respondents, duration of the interviews etc.
• Standardize but consider the local context: For example, (i) Types of questions “do you own land”, “how much rent would you receive”; (ii) Use local enumerators and entities; (iii) Train locally; (iv) Data collection team should also be the data cleaning team (the case of US$ 1.5 connections)
• Limit interview duration to 1 hour: Validate through pre-testing

7
Part 2 – Summary of Findings (14 Counties ONLY)

Power Sector: Vision
• Grid connectivity is limited to the Mombasa-Nairobi-Kisumu corridor and remains nascent and uneconomical for the project area
• Historical focus on centralized grid extension
• National electrification rate of Kenya is 64% -aiming for universal electrification by 2020
• Last Mile Connectivity Program plans to achieve 70% electrification
• The presentation features results only from the 14 underserved counties and not the entire county
Transform Kenya into a newly
industrializing, middle-income
country providing a high quality of
life to all its citizens.
Access to competitively-priced,
reliable, quality, safe, and
sustainable energy is essential
for achievement of the vision.
8

The 14 Underserved Counties
• Higher incidence of poverty and low income levels• Highly dispersed population (including pastoralist communities)• About 20% of Kenya’s population live in the underserved counties• Total population estimated to be 1.2 million households, off-grid population
is 650,000 households

Findings: Binary vs MTF Survey
Traditional Binary Approach (Grid Only)
57%
10%
3%
14%10%
7%
0%
10%
20%
30%
40%
50%
60%
Tier 0 Tier 1 Tier 2 Tier 3 Tier 4 Tier 5
61%
39%
0%
10%
20%
30%
40%
50%
60%
70%
No Electricity Access Electricity Access
Multi-tier Framework Approach
A few grid connected HH are
in Tier 0

Findings: Binary vs MTF Survey (Rural vs Urban)
68%
13%
2%
7%5% 5%
39%
7%4%
23%
16%
10%
0%
10%
20%
30%
40%
50%
60%
70%
80%
Tier 0 Tier 1 Tier 2 Tier 3 Tier 4 Tier 5
Rural Urban
Over 50% of urban HH are in tier 3+

Findings: Grid Alternatives (Solar Devices)
1
2
1
2
0%
5%
10%
15%
20%
25%
30%
Urban Rural Urban Rural
Grid access No grid access All HHs
SL users SLS users
SHS users HH with multiple systems
Solar Lanterns (SL)
Solar Lighting Systems (SLS)
Solar Home Systems (SHS)
% HH with SL comparable in rural grid connected & non-
connected HH
33% of HH have at least solar device
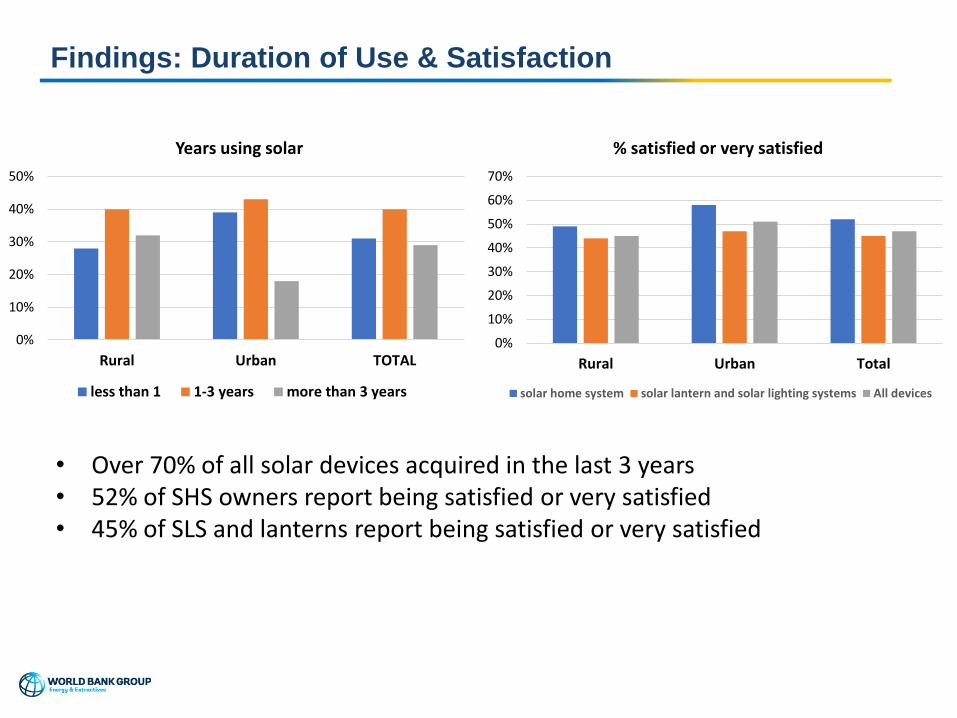
Findings: Duration of Use & Satisfaction
1
3
• Over 70% of all solar devices acquired in the last 3 years• 52% of SHS owners report being satisfied or very satisfied• 45% of SLS and lanterns report being satisfied or very satisfied
0%
10%
20%
30%
40%
50%
Rural Urban TOTAL
Years using solar
less than 1 1-3 years more than 3 years
0%
10%
20%
30%
40%
50%
60%
70%
Rural Urban Total
% satisfied or very satisfied
solar home system solar lantern and solar lighting systems All devices

Findings: Appliance Ownership
1
4
0%
25%
50%
75%
100%
at least one mobile phone
tv
radio
refrigerator
fan
High mobile phone ownership linked to high demand for solar devices

Findings: Use of Mobile Money
1
5
More households have an mobile money account than own a mobile phone
1
5
• 89% of HHs use mobile money
for multiple applications:
• Sending and/or receiving
money to/from family &
friends
• Topping up credit
• Transferring credit to family
or friends
• Paying bills

Findings: Solar PV Acquisition
1
6
The rest acquired through cash sales
1
6
Solar Lanterns (SL)
Solar Lighting Systems (SLS)
Solar Home Systems (SHS)
7%
1%5%
32%34%
4%
0%
20%
40%
SL SLS SHS

Findings: Lighting for off-grid (Non-Solar)
1
7
1
71
7
0%
20%
40%
60%
80%
Urban rural TOTAL
not grid/mini-grid connected and not solar
kerosene dry cells w/torches
candles generators
rechargable batteries no lighting source
Unelectrified households still rely mostly on kerosene, followed by dry cells/torches

Findings: Cost of Replaceable Energy Services
1
8
1
81
8
1
8
0%
10%
20%
30%
40%
50%
Urban
0%
10%
20%
30%
40%
50%
Rural
0%
10%
20%
30%
40%
50%
Total
• Over 30% of unelectrified households already pay over $5 a month for lighting, cell phone charging and dry cell batteries
• But 50% pay less than $2 a month - affordability is an issue

19
Consultants:
• EED Advisory Limited (www.eedadvisory.com)
• Stockholm Environment Institute (www.sei-international.org)


