Multi-year variability or unidirectional trends? Mapping long-term precipitation and temperature changes in continental Southeast Asia using PRECIS regional climate model Guillaume Lacombe & Chu Thai Hoanh & Vladimir Smakhtin Received: 24 February 2010 / Accepted: 2 October 2011 / Published online: 3 January 2012 # Springer Science+Business Media B.V. 2011 Abstract The subject of change detection in climate time series has recently received greater interest as the perception of a human-induced change in the climate is now widely accepted. However, changes in regional precipitation and temperature remain uncertain. This study characterizes projected fine-scale changes in precipitation and temperature in continental Southeast Asia over the period 1960–2049. Twenty four annual variables were derived from grid-based daily precipitation and temperature produced by the PRECIS regional climate model under A2 and B2 scenarios. These time series, capturing precipitation intensities (classified as low, medium and high), seasonality and extremes in precipitation and temperature, were subjected to the modified Mann-Kendall trend detection test accounting for long-term persistence. The results indicate that temperature increases over the whole region with steeper trends in higher latitudes. Increases in annual precipitation, mainly restricted to Myanmar and the Gulf of Thailand, result from increases in high precipitation during the wet season. Decreases are observed mainly over the sea and caused by a reduction of low precipitation. Changes in the occurrence of the monsoon affect the low-latitude sea areas only. By showing that significant precipitation change are minor over land areas, these results challenge most of the previous studies that suggested significant precipitation changes over Southeast Asia, often mixing up multi-decadal variability and long-term unidirectional trends. Significant changes in precipitation and temperature may induce higher agricultural yields as steepest temperature and precipitation increases will predominantly affect the coldest and driest land areas of the region. Climatic Change (2012) 113:285–299 DOI 10.1007/s10584-011-0359-3 Electronic supplementary material The online version of this article (doi:10.1007/s10584-011-0359-3) contains supplementary material, which is available to authorized users. G. Lacombe (*) : C. T. Hoanh International Water Management Institute, Southeast Asia Office, P.O.Box 4199, Vientiane, Lao P.D.R. e-mail: [email protected]V. Smakhtin International Water Management Institute, Headquarters. 127, Sunil Mawatha, Pelawatte, Battaramulla, Sri Lanka
Transcript
Multi-year variability or unidirectional trends?Mapping long-term precipitation and temperaturechanges in continental Southeast Asia using PRECISregional climate model
Guillaume Lacombe & Chu Thai Hoanh &
Vladimir Smakhtin
Received: 24 February 2010 /Accepted: 2 October 2011 /Published online: 3 January 2012# Springer Science+Business Media B.V. 2011
Abstract The subject of change detection in climate time series has recently receivedgreater interest as the perception of a human-induced change in the climate is now widelyaccepted. However, changes in regional precipitation and temperature remain uncertain.This study characterizes projected fine-scale changes in precipitation and temperature incontinental Southeast Asia over the period 1960–2049. Twenty four annual variableswere derived from grid-based daily precipitation and temperature produced by thePRECIS regional climate model under A2 and B2 scenarios. These time series,capturing precipitation intensities (classified as low, medium and high), seasonality andextremes in precipitation and temperature, were subjected to the modified Mann-Kendalltrend detection test accounting for long-term persistence. The results indicate thattemperature increases over the whole region with steeper trends in higher latitudes.Increases in annual precipitation, mainly restricted to Myanmar and the Gulf ofThailand, result from increases in high precipitation during the wet season. Decreasesare observed mainly over the sea and caused by a reduction of low precipitation.Changes in the occurrence of the monsoon affect the low-latitude sea areas only. Byshowing that significant precipitation change are minor over land areas, these resultschallenge most of the previous studies that suggested significant precipitation changesover Southeast Asia, often mixing up multi-decadal variability and long-termunidirectional trends. Significant changes in precipitation and temperature may inducehigher agricultural yields as steepest temperature and precipitation increases willpredominantly affect the coldest and driest land areas of the region.
Electronic supplementary material The online version of this article (doi:10.1007/s10584-011-0359-3)contains supplementary material, which is available to authorized users.
G. Lacombe (*) : C. T. HoanhInternational Water Management Institute, Southeast Asia Office, P.O.Box 4199, Vientiane, Lao P.D.R.e-mail: [email protected]
V. SmakhtinInternational Water Management Institute, Headquarters. 127, Sunil Mawatha, Pelawatte,Battaramulla, Sri Lanka
It is now widely accepted that recent global warming is influenced by the human-inducedincrease in greenhouse gas emissions to the atmosphere (Lashof and Ahuja 1990; IPCC2007). Its impact on precipitation and temperature is of critical importance, especially in thedeveloping world where livelihoods are inextricably linked to rainfed agriculture (Barkerand Molle 2004). However, expected changes in precipitation and temperature remainuncertain in many regions. Time series of rainfall either observed (Manton et al. 2001; Frichet al. 2002; Dore 2005) or projected (Ruosteenoja et al. 2003) indicate that climate changemay manifest itself through more complex and spatially variable impacts on precipitationthan on temperature. Characterising future precipitation and temperature changes usuallyincludes the simulation of these two variables’ space-time variations using climate models,either global or regional, and the quantification of observed long-term changes. Manyglobal climate models (GCM) were developed since the early 1990s, including ECHAM4(Roeckner et al. 1996), HADCM3 (Johns et al. 2003), CSIRO-MK3 (Gordon et al. 2002),CGCM3.1 (Flato et al. 2000). Several studies related to climate change have beenundertaken in Southeast Asia with different objectives: characterizing and quantifyingclimatic changes (Hoanh et al. 2003; Ruosteenoja et al. 2003; Snidvongs et al. 2003; MacSweeney et al. 2008), predicting future river discharge and lake water levels (Eastham et al.2008; TKK and SEA START RC 2009), assessing vulnerability to climate change(Anshory-Yusuf and Francisco 2009), formulating recommendations for mitigation of- andadaptation to climate change (Eastham et al. 2008; Salim 2009; TKK and SEA START RC2009). A detailed review of these climate change studies is available in the ElectronicSupplementary Material. Table 1 summarizes their results and indicates that projectedchanges in annual precipitation are either positive or negative depending on the models, thescenarios and the periods considered. In some cases, the direction of change remainsuncertain. Changes in seasonal precipitation and temperature are more consistent: pastanalyses generally conclude that the wet season and the dry season will become wetterand drier, respectively and that temperature will increase at rates ranging from +0.01 to+0.05°/year. Most of these studies compared mean values of climate variables averagedover successive 10- to 30-year periods, thus capturing the multi-decadal variability ofthe climate and explaining the diversity of the results. The coarse resolution and theinability of each climate model to accurately simulate actual climate dynamics alsoexplain the discrepancies between climate variables projected by different models,especially precipitation whose variability is controlled locally. In contrast, theconsistency of the different projected temperature changes, all showing a temperaturerise, is due to the lower multi-annual natural variability of temperature, overwhelmedby the regional influence of global warming.
PRECIS (Providing Regional Climates for Impacts Studies) appears to have been one ofthe most frequently used regional climate models (RCM) in Southeast Asia over the last5 years. It was developed by the Hadley Center (Jones et al. 2004) with a spatial resolutionof 0.22°×0.22°, more appropriate for regional studies, compared to an order of magnitudecoarser resolutions of GCMs. PRECIS has been used to generate climate projections inIndia (Kumar et al. 2006), Pakistan (Islam et al. 2009), China (Zhang et al. 2006), southernAfrica (Tadross et al. 2005) and South America (Marengo et al. 2009). It has beendownscaled for Southeast Asia (Fig. 1) by the “Southeast Asia SysTem for Analysis,Research and Training” (SEA-START) Regional Center, using the atmospheric generalcirculation model ECHAM4 to force its lateral boundaries under the SRES emissionscenarios A2 and B2 (Nakicenovic et al. 2000). Compared to observed data from 130
286 Climatic Change (2012) 113:285–299
Tab
le1
Sum
maryof
projectio
nsof
annual
andseason
alprecipitatio
nandannu
altemperature
inSoutheastAsiafrom
previous
stud
ies
Authors
Location
Models
Scenarios
Period
AnnualRainchange
Changein
seasonal
rainfallpattern
Temperature
change
Snidvongs
etal.(2003)
Low
erMekong
catchm
ent
CCAM
Doublingof
CO2concentration
Drier
dryseason.Longer,
1-month
delayedwet
season
From+0.01
to+0.03°c/y
Ruosteenoja
etal.(2003)
SoutheastAsia
7GCMs
A1F
1,A2,
B1,
B2
1961–2095
Eith
er>0or
<0,
depend
onmodels
andscenarios.Alm
ostalways
unsignificant
From
+0.01
to+0.05°c
/y
Hoanh
etal.(2003)
Mekongcatchm
ent
HADCM3
A2,
B2
1960–2099
1961–2039:
from
−3.24to
+2.06
mm/y
1961–2099:
from
−4.28to
3.83
mm/y
1961–2039:
+0.02°c
/y1961–2099:
from
0.026
to0.036°c/y
Mac
Sweeney
etal.(2008)
Cam
bodia(Ca),
Vietnam
(Vi)
15GCMs
A2,
A1B
,B1
1970–2090
From
+0.3to
+0.6mm/year
Wetterwet
season
(+0.8to
+1.5mm/y
(Ca)
and+0.4to
+1.5mm/y
(Vi))and
drierdryseason
(−0.7to
−0.1
mm/y
(Ca)
and−0
.3to
−0.1
mm/y
(Vi))
From
+0.014to
+0.045°c/y
Eastham
etal.(2008)
Low
erMekong
catchm
ent
11GCMs
A1B
1976–2030
From
+0.1to
9.9mm/y
Wetterwet
season
(+1.7to
+6.1mm/y)
anddrierdryseason
(−0.3mm/y
unsignificant)
From
+0.012to
+0.014°c/y
Salim
(2009)
Thailand,Vietnam
MAGICC
A1F
1,B2
1990–2100
1990–2050:
-1.62to
+1.26
mm/y
(B2)
and-0.66
to−1
.14mm/y
(A1F
1);
1990–2100:
+3.27
to+4.91
mm/y
(A1F
1)and−1
.63to
−2.45mm/y
(B2)
From
+0.03
to+0.06°c
/y
Climatic Change (2012) 113:285–299 287
weather stations during the 1980s throughout Southeast Asia, precipitation and temperatureoutput from PRECIS were found to be biased in some areas, with temperatureoverestimated by 1 to 2° and annual precipitations underestimated by over 100 mm(Vastila et al. 2010). Chinvanno (2009) adjusted the data, using correction coefficients,calculated from simulated and observed values at specific grid cells over the 1980s, andinterpolated to the whole grid applying kriging techniques. Bias-corrected dailyprecipitation and temperature data were found to differ from observed data by less than50 mm/year and 1°/year, respectively.
Quantification of human-induced changes in precipitation and temperature first requiresdiscriminating them from natural climate variability. It is generally accepted that naturalvariability alters the climate pattern on time scales shorter than 30 years (WorldMeteorological Organization 1996). However, the analysis of multi-centennial time seriesof observed (Beran 1994) or proxy (Sano et al. 2009) hydro-climatic data reveals theexistence of wet or dry periods exceeding 50 years, although there are no long term trends.This natural behavior, named long-term persistence or Hurst phenomenon was firstidentified by Hurst (1951). It was recently demonstrated that this phenomenon can beexplained by the multi-scale variability of hydro-meteorological time series also calledscaling effect (Koutsoyiannis 2002). The scaling effect, which denotes the invarianceproperties of a time series aggregated on different time scales, can be formulated as follow:σk=k
Hσ where σ is the standard deviation of the original annual time series Xi (i=1, 2…),σk is the standard deviation of Zi
(k), Zi(k) being an aggregated time series of Xi at the k-year
time step (k=1, 2,…): Z1(k)=X1+…+Xk, Zi
(k)=X(i-1)k+1+…+Xik. H is the scalingcoefficient, generally varying between 0.5 (no scaling effect) and 1. By assuming thatdata are independent and identically distributed, previous statistical analyses aimed atdetecting unidirectional trends in climate time series have not accounted for this form ofauto-correlation which inflates the variance of the test statistic and increases the chance of asignificant answer, even in the absence of a trend (Cox and Stuart 1955). Recently, Hamed(2008) modified the Mann–Kendall test (Mann 1945; Kendall 1975) to account for thescaling effect, thus enhancing the ability of the test to discriminate multi-scale variabilityfrom unidirectional trends.
In this paper, the Mann-Kendall test modified by Hamed (2008) is applied totemperature and precipitation variables capturing the intensity, seasonality and extremesin precipitation and temperature over the period 1960–2049. These variables were derivedfrom daily precipitation and temperature grid-based time series produced by the RCMPRECIS using boundary conditions from the ECHAM4 GCM under the SRES scenariosA2 and B2 in continental Southeast Asia.
2 Methods
The domain of the PRECIS atmospheric and land surface regional climate model,forced by ECHAM4, extends from 90°E to 112°E and from 0°N to 35°N. In addition tobias-corrections performed by Chinvanno (2009), PRECIS rainfall and temperature datawere tested to detect outliers. About 20 rainfall values exceeding 90,000 mm/day andmore than 300 values exceeding 2,200 mm/days were identified among the 1.2 billiondaily rainfall values of the model domain. Those outliers were found to have negligibleeffects on the study results, because of their relative scarcity and the low sensitivity of theMann-Kendall test to outliers. No outliers were found in temperature values. Twenty fourannual variables, capturing the intensity, seasonality and extremes in precipitation and
288 Climatic Change (2012) 113:285–299
temperature, were derived from the PRECIS grid-based daily precipitation andtemperature time series and gathered in five categories:
& Occurrence of the wet season (variables 1 to 3): these 3 variables include the number ofdays since the 1st of January to the beginning / end of the wet season and to the first dayof the wettest 5-day period. The beginning of the wet season was defined as the firstday of the first 10-day period of the year that satisfies two conditions: i) the cumulativeprecipitation depth of this 10-day period exceeds the mean 10-day precipitation depthaveraged over the period 1961–1990 and ii) at least two of the next three 10-day periodssatisfy the first condition. Due to the extreme temporal variability of precipitation, the10-day precipitation depths were first smoothed by a 3-time-step moving average. Theend of the wet season was defined by symmetrical conditions, starting from the end ofthe calendar year and moving backward through the 10-day periods (Fig. 2a).
& Cumulative precipitation depths per season and per range of daily precipitation(variables 4 to 15): these 12 variables correspond to the sums of daily precipitation forspecific pairwise combinations of three periods (full year, wet and dry seasons) and fourranges of daily precipitation (whole range, low, medium and high precipitation). Low,medium and high precipitation were defined by two thresholds determined as follows:for each of the four precipitation ranges, the sorted cumulative distribution of dailyprecipitation over the period 1961–1990 was split into three identical depths, thusdefining two values corresponding to one third and two thirds of the total depth of thisdistribution. The daily precipitation thresholds were defined as the antecedents of thesetwo values using the sorted cumulative distribution function (Fig. 2b).
Fig. 1 Continental SoutheastAsia and the Mekong River Basin(shaded area)
Climatic Change (2012) 113:285–299 289
& Extreme events (variables 16 to 18): these variables are related to precipitation depth(cumulative depth of the wettest 5-day period), frequency (number of rainy days whoseprecipitation depth exceeds the 90th heaviest daily precipitation of the period 1961–1990,i.e. there are 3 extreme events per year on average) and length (longest drought defined asthe number of consecutive ‘dry’ days, with precipitation<1mm/day, during the wet season.These events are particularly harmful for farmers who grow rainfed rice as it can drasticallyreduce crop yields).
& Precipitation intensity index (variable 19): this variable captures the combined effect ofprecipitation frequency and intensity, calculated as the number of heaviest rainy daysthat constitutes two thirds of the total annual precipitation as recommended by Sun et al.(2006).
& Temperature (variables 20 to 24): these variables include mean annual temperature,mean temperatures of the coldest and warmest 10-day periods and the numbers of daysbetween the first of January and the first day of these 10-day periods.
At each cell of the PRECIS grid, the 24 time series of the above variables were analyzedwith the Mann-Kendall (Mann 1945; Kendall 1975) statistical test, recently modified byHamed (2008) to account for long-term persistence. The main steps of calculations are
Fig. 2 Graphical illustration of methods used to determine the occurrence of the beginning (variable 1)and end (variable 2) of the wet season (a) and to generate the threshold values used in variables 4 to 15(b) at example grid cell
290 Climatic Change (2012) 113:285–299
summarized below. Further details can be found in Hamed (2008). Given a time seriesXi (i=1, …n), the test statistic S of the original Mann-Kendall test is given by:
S ¼Xn�1
i¼1
Xnj¼iþ1
sgnðXj � XiÞ where sgn qð Þ ¼1 if q > 00 if q ¼ 0
�1 if q < 0
8<:
Under the assumption that the data are independent and identically distributed, thevariance V0(S) of the test statistic S is calculated as follows:
V0ðSÞ ¼ n n� 1ð Þ 2nþ 5ð Þ=18�Pmi¼1
ti ti � 1ð Þð2ti þ 5Þ=18 where m is the number of tied
ranks, each with ti tied observations. The standardized variable Z, obtained from S andV0(S), is given by:
Z ¼
S�1ffiffiffiffiffiffiffiffiV0ðSÞ
p if S > 0
0 if S ¼ 0
Sþ1ffiffiffiffiffiffiffiffiV0ðSÞ
p if S < 0
8>>>><>>>>:
The significance of trends is tested by comparing Z with the standard normal variateat the desired significance level α. In our analysis, we selected α=95%. Under the scalinghypothesis, the modified Mann-Kendall test proposed by Hamed (2008) includes threesteps. Step 1: the original Mann-Kendall test is applied to the data. If Z is not significant,it can be concluded that the time series does not show any significant trend. If Z issignificant, the effect of scaling is checked in step 2. Step 2: the original time series isdetrended using the non parametric trend estimator proposed by Sen (1968). Theequivalent Normal variates Zt are obtained from the detrended data, using thetransformation introduced by Hogg and Tanis (1988) where Rt is the rank of detrendedobservations, n is the number of observations, and Φ−1() is the inverse standard Normaldistribution function:
Zt ¼ Φ�1ð Rt
nþ 1Þ
The scaling coefficient of the equivalent Normal variates is estimated by maximizingthe log-likelihood function (logL()) proposed by MacLeod and Hipel (1978) where γ0is the variance of matrix Zt and Cn(H) is the correlation matrix for a given scalingcoefficient H:
logLðHÞ ¼ � 1
2log CnðHÞj j � ZtT CnðHÞ½ ��1Zt
2g0
The existence of the scaling effect (H≠0.5) is tested using the mean and standarddeviation of H for the uncorrelated case, estimated by Hamed (2008). If there is noscaling effect, it is concluded that the time series shows a significant trend whoseslope is estimated using the Sen’s slope estimator (Sen 1968). If there is a scalingeffect, the variance of the modified test statistic is calculated in step 3. Step 3: the
Climatic Change (2012) 113:285–299 291
modified variance V(S) of the test statistic is derived from the work of Kendall and Stuart(1976) and given by:
where ρij is the autocorrelation coefficient at lag i-j. The modified variance is finallycorrected for bias with the factor B established by Hamed (2008) as a function of n and H.The modified test statistic Z* is calculated using the unbiased modified variance:
Z» ¼
S�1ffiffiffiffiffiffiffiffiffiV ðSÞB
p if S > 0
0 if S ¼ 0
Sþ1ffiffiffiffiffiffiffiffiffiV ðSÞB
p if S < 0
8>>>><>>>>:
If Z* is not significant at the 95% desired significance level, it is concluded that theobserved trend is not significant. If Z* is significant, there is a significant trend whose slopeis estimated using the Sen’s slope estimator (Sen 1968).
3 Results
The distribution of significant trends in precipitation and temperature over the period1960–2049 is illustrated in Figs. 3, 4, 5, 6, using color scales representing the values ofthe Sen’s slope. Uncolored areas correspond to the absence of significant changes.
Figure 3 displays the spatial distribution of significant trends in the occurrence of the wetseason and of its peak. Changes in the beginning of the rainy season are minor. In total,they affect between 15% (scenario A2) and 21% (scenario B2) of the study area’s surface area,mainly in the Andaman and South China Seas. On average, the beginning of the wet season willbe delayed by about 0.16 day/year (scenario A2) and 0.29 day/year (scenario B2) in these areas,
Fig. 3 Significant trends in the occurrence of the wet season (beginning, end and peak) (variables 1 to 3)
292 Climatic Change (2012) 113:285–299
while the end of the wet season remains mostly unchanged. Significant trends in the occurrenceof the wettest 5-day period result in delays of about 0.32 day/year for both scenarios, over 18%and 16% of the study area’s surface area for scenarios A2 and B2 respectively.
Figure 4 illustrates the distribution of significant trends in precipitation depths.Significant upward and downward trends in annual precipitation, considering the wholerange of daily precipitation, cover 20% (Central and Northern Myanmar and the Gulf ofThailand) and 10% (South China Sea, Andaman Sea and the Gulf of Tonkin) of the totalstudy area’s surface area, respectively. Increased precipitation mainly occurs during the wetseason and affects high precipitation, while precipitation decreases occur during both dryand wet seasons and especially affect low precipitation. Areas subject to annual lowprecipitation decreases and to annual high precipitation increases represent about one halfand one third of the study area’s surface area respectively. Except for the Gulf of Thailandwhich receives higher precipitation, most of the precipitation increases are observed on landareas whereas precipitation decreases dominate over the sea. Mean rate of high precipitationincrease during the wet season ranges from +2.7 mm/year to+3.1 mm/year for scenarios B2and A2 respectively. Mean rate of low precipitation decrease ranges from −1.4 mm/yearto −1.3 mm/year for scenarios B2 and A2 respectively. On average, surface areas withincreasing precipitation are similar in both scenarios (10% and 12% of the study area’ssurface area for scenarios B2 and A2 respectively). In contrast, areas with decreasing
Fig. 4 Significant trends in annual cumulative precipitation depth per range of daily precipitation and perseason (variables 4 to 15)
Climatic Change (2012) 113:285–299 293
precipitation are narrower in scenario A2 (16% of surface area) than in scenario B2(19% of surface area). Thus, scenario A2, which projects more greenhouse gasemissions than B2, is wetter than scenario B2.
Figure 5 displays the spatial distribution of significant trends in extreme rainfall events.Significant trends in the length of the longest drought during the wet season affect less than10% of the study area’s surface area, mostly over the sea. The geographical pattern ofchanges in the frequency of extreme events is similar to that of change in high precipitationoccurring during the wet season (cf. Fig. 4). It consists mainly of increases covering about10% of the study area’s surface area, over the Gulf of Thailand and in Central and NorthernMyanmar. Changes in the number of heaviest rainy days whose cumulative depth representstwo thirds of total annual precipitation are mostly negative, meaning that the distribution ofprecipitation throughout the year will become more contrasted. According to Fig. 4,significant trends in this variable are mainly caused by a reduction of annual lowprecipitation rather than by an increase of high precipitation. These changes areconcentrated in the Andaman Sea, in Cambodia, in Southern Vietnam and in the SouthChina Sea, covering more than one third of the study area’s surface area. Mean change ratesare about −0.1 day/year. Changes in the cumulative precipitation depth of the wettest 5-dayperiod are mostly positive, ranging from 0.61 mm/year (scenario B2) to 0.64 mm/year(scenario A2). Their spatial distribution is similar to that of changes in high precipitation(Fig. 4) and in the frequency of extreme events.
Fig. 5 Significant trends in extreme rainfall events (variables 16 to 19)
294 Climatic Change (2012) 113:285–299
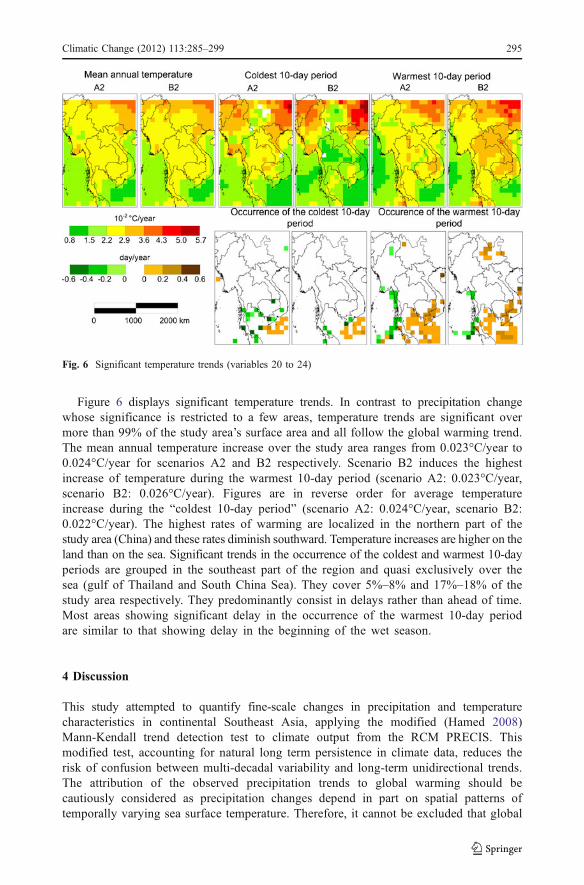
Figure 6 displays significant temperature trends. In contrast to precipitation changewhose significance is restricted to a few areas, temperature trends are significant overmore than 99% of the study area’s surface area and all follow the global warming trend.The mean annual temperature increase over the study area ranges from 0.023°C/year to0.024°C/year for scenarios A2 and B2 respectively. Scenario B2 induces the highestincrease of temperature during the warmest 10-day period (scenario A2: 0.023°C/year,scenario B2: 0.026°C/year). Figures are in reverse order for average temperatureincrease during the “coldest 10-day period” (scenario A2: 0.024°C/year, scenario B2:0.022°C/year). The highest rates of warming are localized in the northern part of thestudy area (China) and these rates diminish southward. Temperature increases are higher on theland than on the sea. Significant trends in the occurrence of the coldest and warmest 10-dayperiods are grouped in the southeast part of the region and quasi exclusively over thesea (gulf of Thailand and South China Sea). They cover 5%–8% and 17%–18% of thestudy area respectively. They predominantly consist in delays rather than ahead of time.Most areas showing significant delay in the occurrence of the warmest 10-day periodare similar to that showing delay in the beginning of the wet season.
4 Discussion
This study attempted to quantify fine-scale changes in precipitation and temperaturecharacteristics in continental Southeast Asia, applying the modified (Hamed 2008)Mann-Kendall trend detection test to climate output from the RCM PRECIS. Thismodified test, accounting for natural long term persistence in climate data, reduces therisk of confusion between multi-decadal variability and long-term unidirectional trends.The attribution of the observed precipitation trends to global warming should becautiously considered as precipitation changes depend in part on spatial patterns oftemporally varying sea surface temperature. Therefore, it cannot be excluded that global
Fig. 6 Significant temperature trends (variables 20 to 24)
Climatic Change (2012) 113:285–299 295
warming results in non-unidirectional changes in precipitation. Reversely, long-termunidirectional trends could theoretically reflect a natural cycle un-related to globalwarming. However, natural cycles exceeding 90 years are unlikely to exist in ECHAM4simulated time series and downscaled PRECIS output data (Koutsoyiannis et al. 2008),thus strengthening the causal effect between the SRES emission scenarios and the longterm unidirectional trends detected in the present study.
Our analyses indicate that, except for annual low precipitation whose significant trendscover nearly half of the region’s surface area, all other precipitation variables showsignificant trends over less than one third of the study area’s surface area. In contrast,temperature significantly increases over more than 99% of the surface area. Decreasingprecipitation trends are generally found in areas where temperature rises at lower rates,mainly over the sea, whereas regions becoming wetter correspond to areas with hightemperature rises, in land areas. This illustrates the land-sea contrast typical of themonsoon climate (Webster et al. 1998). Higher temperature over lands induces higherevapotranspiration rates, thus increasing air humidity and precipitation (Trenberth 2005).These warmer conditions could also increase the strength of the thermal low, therebyinducing more moisture inflow from the ocean, contributing to the precipitation increase.Such causal links between temperature rise and precipitation increase was recentlyevidenced at the global scale (Previdi and Liepert 2008).
For each climate variable, the total number of significant trends was compared to thatobtained from the original Mann-Kendall test. Trends found significant and insignificant bythe original and the modified test, respectively, are attributed to the scaling effect only.According to the original Mann-Kendall test, about 10% of significant trends in thefrequency of extreme events and in the occurrence of the wettest 5-day period, and about16% of significant trends in the length of the longest wet season drought were found to becaused by the scaling effect only. This ratio rises up to 33% and 65% for the variablescorresponding to the beginning and the end of the rainy season, respectively. Therefore, forthese two variables, in average, about half of the significant trends detected by the originalMann-Kendall test are likely to be caused by multi-year cycles occurring during the studyperiod rather than by a long term and unidirectional climatic change. Although the cyclicphenomenon ENSO seems i/ to be captured by ECHAM4 (Cherchi and Navarra 2003), andii/ to control the length of the summer monsoon (Zhou and Chan 2007; Goswami andXavier 2005), no evidences explain why the occurrence of the wet season, in particular, issubject to the scaling effect. For other variables, less than 6% of significant trends estimatedby the original Mann-Kendall test were found to be caused by the scaling effect.
Although it is not possible to accurately compare our results with those from previousanalyses (cf. Table 1 and Electronic Supplementary Material) because of the differences inSRES scenarios and time periods specific to each analysis, some consistencies are worthmentioning. The annual precipitation increases in Vietnam and Cambodia estimated by MacSweeney et al. (2008) are extremely low (from 0.3 to 0.6 mm/year) and would probablyhave been considered insignificant, in agreement with this study’s findings, if the authorshad applied a statistical test to assess precipitation changes. In order to compare our resultswith those from Ruosteenoja et al. (2003) who worked at the sub-continental regional scale,the modified Mann-Kendall test was applied to annual precipitation time series averagedover the whole study area. Consistently, no significant change was observed for scenariosA2 and B2. Trends in seasonal precipitation, indicating wetter wet seasons and drier dryseasons (Snidvongs et al. 2003; Eastham et al. 2008; Mac Sweeney et al. 2008) are alsoconsistent with the present findings, although the spatial extent of such changes are muchmore limited in the present study, especially over land areas.
296 Climatic Change (2012) 113:285–299
All reviewed studies concluded that annual temperature will increase in Southeast Asia witha mean rate ranging from +0.018 ±0.008°C/year to 0.037 ±0.015°C/year. This rangeencompasses that from the current analysis (0.023 to 0.024°C/year). The wider range obtainedby previous studies originates from the use of more extreme scenarios (B1 and A1F1) overperiods extending beyond 2050, including higher rates of temperature rise (IPCC 2007).
Possible implications of observed trends on agriculture can be inferred from seasonalprecipitation and temperature trends displayed in Figs. 4 and 6. Total precipitation depth ofthe wet season does not show any significant trends in Thailand, Vietnam, Cambodia, Laosand Yunnan province of China. Most of the changes are located in central and northernMyanmar and result in precipitation increase. This should be beneficial for agriculture asthis region is the driest (mean wet season precipitation in central/northern Myanmar and atthe regional scale are equal to 670 mm/year and 1460 mm/year respectively over the period1961–1990 according to PRECIS). Changes in dry season precipitation are concentrated inCambodia and Southern Vietnam and result in precipitation decrease with minorconsequences on food production as cropping periods are concentrated during the wetseason. Higher temperatures observed over the whole region should slightly increaseevapotranspiration, increasing water demand of crops and pastures in both rain-fed andirrigated systems. This may lead to enhanced biomass production as water is not a limitingfactor during the wet season. In contrast, temperature increase can reduce crop yields bypreventing pollination and inducing dehydration and floret sterility (Matsui and Omasa 2002;Peng et al. 2004). This could be offset by promoting the adoption of high temperature-tolerant cultivars. In mountainous areas where cold temperatures limit agricultural production(Northern Myanmar, northern Thailand, Northern Laos and Yunnan), rising temperature willfavor agricultural production by extending the cropping period.
5 Conclusions
Most previous climate change analyses based on the PRECIS model downscaled forSoutheast Asia either compared its mean climate output variables averaged over successivemulti-year periods, or used the model’s output as input to run hydrological models.Projected changes in intensity, seasonal distribution and extremes in precipitation andtemperature remained unknown. By attempting to discriminate natural long-termpersistence from long-term unidirectional trends, possibly associated to human-inducedclimate change, this study suggests that, except for central and northern Myanmar that willbecome wetter, precipitation will remain stable in most of the region’s land areas. Thisstudy challenges most of the past analyses which generally captured and quantified themulti-decadal natural precipitation variability to conclude that climate is changing.Moreover, it questions the validity of the results obtained with similar methods in otherparts of the world. In contrast, temperature will indeed follow the global warming trendover the entire study area. At the regional scale, precipitation and temperature changesshould benefit agricultural production as significant precipitation increase will occur in thedrier areas whereas steepest temperature rises will affect the coldest parts. Further analysesshould focus on how these climate trends will interact with other environmental changescaused by the demographic and economic development occurring in the region.
Acknowledgements The study was supported by the Swedish International Development Agency and bythe International Water Management Institute. The authors are grateful to Suppakorn Chinvanno from theSEA-START Regional Center in Bangkok, Thailand, for the provision of the PRECIS data sets.
Climatic Change (2012) 113:285–299 297
References
Anshory-Yusuf A, Francisco H (2009) Climate change vulnerability mapping for Southeast Asia. Economyand Environment Program for Southeast Asia, Singapore
Barker R, Molle F (2004) Evolution of irrigation in South and Southeast Asia. International WaterManagement Institute, Colombo
Beran J (1994) Statistics for long-memory processes. Monographs on statistics and applied probability.Chapman & Hall, New York
Cherchi A, Navarra A (2003) Reproducibility and predictability of the Asian summer monsoon in theECHAM4-GCM. Clim Dyn 20(4):365–379
Chinvanno S (2009) Future climate projection for Thailand and surrounding countries: climate change scenario of21st century. The first China-Thailand joint seminar on climate change, 23–24 March 2009, Bangkok
Cox DR, Stuart A (1955) Some quick sign tests for trend in location and dispersion. Biometrika 42:80–95Dore MHI (2005) Climate change and changes in global precipitation patterns: what do we know? Environ
Int 31:1167–1181Eastham J, Mpelasoka F, Mainuddin M, Ticehurst C, Dyce P, Hodgson G, Ali R, Kirby M (2008) Mekong
River basin water resources assessment: impacts of climate change. CSIRO: Water for a Healthy CountryNational Research Flagship
Flato GM, Boer GJ, Lee WG, Mac Farlane NA, Ramsden D, Reader MC, Weaver AJ (2000) The Canadiancentre for climate modelling and analysis global coupled model and its climate. Clim Dyn 16:451–467
Frich P, Alexander LV, Della-Marta PM, Gleason B, Haylock MR, Klein Tank AMG, Peterson T (2002)Observed coherent changes in climatic extremes during the second half of the twentieth century. ClimRes 19:193–212
Gordon HB, Rotstayn LD, Mac Gregor JL, Dix MR, Kowalczyk EA, O’Farrel SP, Waterman LJ, Hirst AC,Wilson SG, Collier MA, Watterson IG, Elliott TI (2002) The CSIRO Mk3 Climate System Model.CSIRO Atmospheric Research, Victoria
Goswami BN, Xavier PK (2005) ENSO control on the south Asian monsoon through the length of the rainyseason. Geophys Res Lett 32:L18717
Hamed KH (2008) Trend detection in hydrologic data: the Mann-Kendall trend test under the scalinghypothesis. J Hydrol 349:350–363
Hoanh CT, Guttman H, Droogers P, Aerts J (2003) ADAPT: water, climate, food and environment underclimate change. The Mekong basin in Southeast Asia. International Water Management Institute,Mekong River Commission, Future Water, Institute of Environmental Studies. Colombo, Phnom-Penh,Wageningen
Hogg RV, Tanis EA (1988) Probability and statistical inference. Macmillan Publishing Company, New YorkHurst HE (1951) Long term storage capacities of reservoirs. Trans Am Soc Civ Eng 116:776–808IPCC (2007) Climate change 2007: synthesis report. Contribution of working groups I, II and III to the fourth
assessment report of the Intergovernmental Panel on Climate Change. Pachauri RK Reisinger A (eds)Geneva
Islam SU, Rehman N, Sheikh MM (2009) Future change in the frequency of warm and cold spells overPakistan simulated by the PRECIS regional climate model. Clim Chang 94:35–45
Johns TC, Gregory JM, Ingram WJ, Johnson CE, Jones A, Lowe JA, Mitchell JFB, Roberts DL, SextonDMH, Stevenson DS, Tett SFB, Woodage MJ (2003) Anthropogenic climate change for 1860 to 2100simulated with the HadCM3 model under updated emissions scenarios. Clim Dyn 20:583–612
Jones RG, Noguer M, Hassell DC, Hudson D, Wilson SS, Jenkins GJ, Mitchell JFB (2004) Generating highresolution climate change scenarios using PRECIS. Met Office Hadley Centre, Exeter
Kendall MG (1975) Rank correlation methods. Griffin, LondonKendall MG, Stuart A (1976) The advanced theory of statistics. Distribution theory (1). Griffin, LondonKoutsoyiannis D (2002) The Hurst phenomenon and fractional Gaussian noise made easy. Hydrol Sci J 47
(4):573–596Koutsoyiannis D, Efstratiadis A, Mamassis N, Christofides A (2008) On the credibility of climate
High-resolution climate change scenarios for India for the 21st century. Curr Sci 90(3):334–345Lashof DA, Ahuja DR (1990) Relative contributions of greenhouse gas emissions to global warming. Nature
344:529–531Mac Sweeney C, New M, Lizcano G (2008) UNDP climate change country profiles: documentation. School
of Geography and the Environment of the University of Oxford, OxfordMacLeod AI, Hipel KW (1978) Preservation of the rescaled adjusted range, 1. A reassessment of the Hurst
phenomenon. Water Resour Res 14(3):491–508
298 Climatic Change (2012) 113:285–299
Mann HB (1945) Nonparametric tests against trend. Econometrica 13:245–259Manton MJ, Della-Marta PM, Haylock MR, Hennessy KJ, Nicholls N, Chambers LE, Collins DA, Daw G,
Finet A, Gunawan D, Inape K, Isobe H, Kestin TS, Lefale P, Leyu CH, Lwin T, Maitrepierre L,Ouprasitwong N, Page CM, Pahalad J, Plummer N, Salinger MJ, Suppiah R, Tran VL, Trewin B,Tibig I, Yee D (2001) Trends in extreme daily rainfall and temperature in southeast Asia and thesouth Pacific: 1961–1998. Int J Climatol 21:269–284
Marengo JA, Jones R, Alves LM, Valverde MC (2009) Future change of temperature and precipitationextremes in South America as derived from the PRECIS regional climate modeling system. Int JClimatol 29(15):2241–2255
Matsui T, Omasa K (2002) Rice (Oryza sativa L.) cultivars tolerant to a high temperature at flowering: anthercharacteristics. Ann Bot 89:683–687
Nakicenovic N, Alcamo J, Davis G, de Vries B, Fenhann J, Gaffin S, Gregory K, Grübler A, Jung TY,Kram T, La Rovere EL, Michaelis L, Mori S, Morita T, Pepper W, Pitcher H, Price L, Raihi K,Roehrl A, Rogner HH, Sankovski A, Schlesinger M, Shukla P, Smith S, Swart R, van Rooijen S,Victor N, Dadi Z (2000) Emissions scenarios. A special report of working group III of theIntergovernmental Panel on Climate Change. Cambridge University Press, Cambridge
Peng S, Huang J, Sheehy JE, Laza RC, Visperas RM, Zhong X, Centeno GS, Khush GS, Cassman KG(2004) Rice yields decline with higher night temperature from global warming. Proc National Acad Sci101:9971–75
Previdi M, Liepert BG (2008) Interdecadal variability of rainfall on a warming planet. Eos Trans. AGU 89(21)
Roeckner E, Arpe K, Bengtsson L, Christoph M, Claussen M, Dumenil L, Esch M, Giorgetta M, Schlese U,Schulzweida U (1996) The atmospheric general circulation model ECHAM4: model description andsimulation of present-day climate. Max Planck Inst. Meteorol, Hamburg
Ruosteenoja K, Carter TR, Jylhä K, Tuomenvirta H (2003) Future climate in world regions: anintercomparison of model-based projections for the new IPCC emissions scenarios. Finnish EnvironmentInstitute, Helsinki
Salim E (2009) The economics of climate change in Southeast Asia: a regional review. Asian DevelopmentBank, Jakarta
Sano M, Buckley BM, Sweda T (2009) Tree-ring based hydroclimate reconstruction over northern Vietnamfrom Fokienia hodginsii: eighteenth century mega-drought and tropical Pacific influence. Clim Dyn33:331–340
Sen PK (1968) Estimates of the regression coefficient based on Kendall’s tau. J Am Stat Assoc 63:1379–1389Snidvongs A, Choowaew S, Chinvanno S (2003) Impact of climate change on water and wetland resources
in Mekong river basin: directions for preparedness and action. IUCN and Southeast Asia STARTRegional Center, Bangkok
Sun Y, Solomon S, Dai A, Portmann RW (2006) How often does it rain? J Clim 19:916–934Tadross M, Jack C, Hewitson B (2005) On RCM-based projections of change in southern African summer
climate. Geophys Res Lett 32:LXXXXXTKK and SEA START RC (2009) Water and climate change in the lower Mekong Basin: diagnosis and
recommendations for adaptation. Water and Development Research Group, Helsinki University ofTechnology (TKK), Southeast Asia START Regional Center (SEA START RC). Water andDevelopment Publications, Espoo
Trenberth KE (2005) The impact of climate change and variability on heavy precipitation, floods, anddroughts. Encyclopedia of hydrological sciences. Anderson MG (ed), John Wiley and Sons
Vastila K, Kummu M, Sangmanee C, Chinvanno S (2010) Modelling climate change impacts on the floodpulse in the Lower Mekong floodplains. J Water Clim Chang 1(1):67–86
Webster PJ, Magana VO, Palmer TN, Shukla J, Tomas RA, Yanagi M, Yasunari T (1998) Monsoons:process, predictability and the prospects for prediction. J Geogr Res 103(C7):14451–14510
World Meteorological Organization (1996) Climatological normal (CLINO) for the period 1961–1990.WMO Publication 847
Zhang Y, Xu Y, Dong W, Cao L, Sparrow M (2006) A future climate scenario of regional changes in extremeclimate events over China using the PRECIS climate model. Geophys Res Lett 33:L24702
Zhou W, Chan JCL (2007) ENSO and the South China Sea summer monsoon onset. Int J Climatol 27:157–167