27
Multidimensional Poverty Index For Iraq Iraq Central Statics Office Kurdistan Region Statistics Office Inter-Agency Information and Analysis Unit

Multidimensional Poverty Index
For Iraq
Iraq Central Statics Office
Kurdistan Region Statistics Office
Inter-Agency Information and Analysis Unit

Education Nutrition
& Health
Standard
of LivingEmployment
Basic
Services
Deprivation Dimensions

Illiteracy Male:An individual is derived if no adult
male member in the household can
read and write.
Illiteracy Female:A individual is derived if no adult female
member in the household can read and
write.
Education &
Knowledge
7.6%
18.5%
0%
5%
10%
15%
20%
Illiteracy Male Illiteracy Female

Educational Attainment Male:An individual is deprived if no adult
male member in the household has
completed primary education, which in
this case translates to 6 years of basic
education.
Educational Attainment Male:An individual is deprived if no adult
male member in the household has
completed primary education, which in
this case translates to 6 years of basic
education.
Education &
Knowledge
19.9%
34.5%
0%
10%
20%
30%
40%
Primary Education
Males
Primary Education
Female

Drinking water:The household is deprived in
drinking water if the source of
drinking water is not General
Network and close well-spring
(MDG definition).
Sanitation:
The household is deprived if the
sanitation facility is not public
network, septic tank or covered
canal (Outside), or the toilet is
shared.
Basic
Services 1
32%
10%
0%
5%
10%
15%
20%
25%
30%
35%
Water Sanitation

Electricity:
The individual is deprived if the total
connection of electricity to the
household from public network,
community generator and private
generator is less than 12 hours per
day.
Garbage Collection:The individual is deprived if the
garbage is burnt out / buried,
thrown in open areas, and others
(this indicator is calculated only for
urban areas).
Basic
Services 2
20%
24%
0%
5%
10%
15%
20%
25%
30%
Garbage Collection Electricity

Standard
of Living 1
Monetary Poverty:An individual is deprived if the real
per-capita expenditure (PCE) of the
household is less than lowest
expenditure quintile at the national
level (equivalent to 91116 ID per
person per month)
Housing unit:An individual is deprived if the type of
housing unit is clay house, tent,
caravan, and others, or if the exterior
walls are made of blocks from the
turnkey construction, clay/stone and
clay, metal plates, wooden plates, and
others
20.0%
9.3%
0%
5%
10%
15%
20%
25%
Income Housing

Standard
of Living 2
Crowding:An individual is deprived if more
than three persons live per room
in the household or the bedroom
is shared with members from
other households.
18%
0%
5%
10%
15%
20%
Crowding

Balanced Diet:An individual is considered as
deprived in nutritional intake if
he/she does not consume enough of
one of the three macro nutrients
(protein, carbohydrate, fat) and one
of the three micro nutrients (iron,
folic acid, and vitamin A) (FAO
Method).
Calories intake: The individual is deprived if the
calorie intake is less than a
particular required level (2330
cals/day).
Nutrition
& Health
20%
17%
15%
16%
17%
18%
19%
20%
Balanced Diet Calories Intake
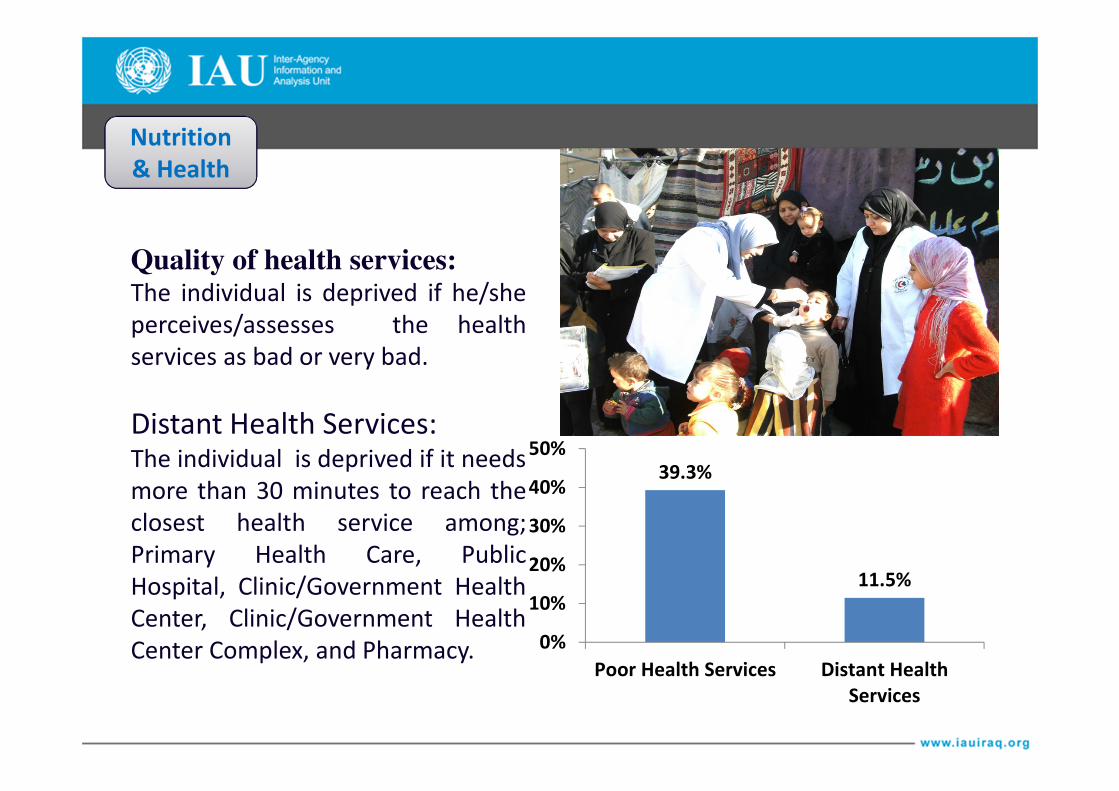
Quality of health services:The individual is deprived if he/she
perceives/assesses the health
services as bad or very bad.
Distant Health Services:The individual is deprived if it needs
more than 30 minutes to reach the
closest health service among;
Primary Health Care, Public
Hospital, Clinic/Government Health
Center, Clinic/Government Health
Center Complex, and Pharmacy.
26%
Food security
Nutrition
& Health
39.3%
11.5%
0%
10%
20%
30%
40%
50%
Poor Health Services Distant Health
Services

Unemployment Male:An individual is deprived if any male
member of his/her household in the
labour force is unemployed.
Unemployment
Female:An individual is deprived if any
female member of his/her
household in the labour force is
unemployed.
Employment
10%
3%
0%
2%
4%
6%
8%
10%
12%
Unemployed Male Unemployed Female

Underemployment Male:An individual is deprived if any
working male member of his/her
household is underemployed.
Underemployment Female:An individual is deprived if any working
female member of his/her is
underemployed.
Employment
20%
1%
0%
5%
10%
15%
20%
25%
Underemployed Male Underemployed
Female

Job Security Male:An individual is deprived if no
employed male member of his/her
household works for the
government/public sector, or has a
secure job in the private sector
(work contract and job benefits).
Job Security Female:An individual is deprived if no employed
female member of his/her household
works for the government/public sector,
or has a secure job in the private sector
(work contract and job benefits).
Employment
40.3%
7.6%
0%
10%
20%
30%
40%
50%
Unprotected Job Male Unprotected Job
Female
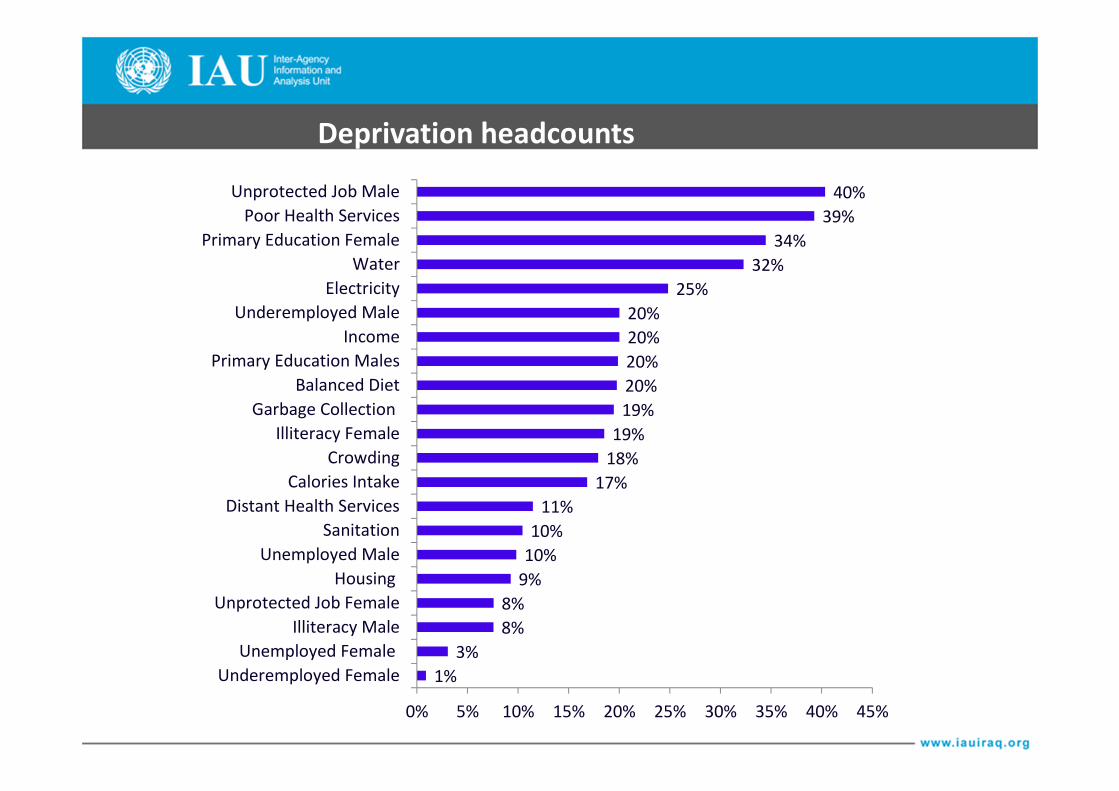
Deprivation headcounts
1%
3%
8%
8%
9%
10%
10%
11%
17%
18%
19%
19%
20%
20%
20%
20%
25%
32%
34%
39%
40%
0% 5% 10% 15% 20% 25% 30% 35% 40% 45%
Underemployed Female
Unemployed Female
Illiteracy Male
Unprotected Job Female
Housing
Unemployed Male
Sanitation
Distant Health Services
Calories Intake
Crowding
Illiteracy Female
Garbage Collection
Balanced Diet
Primary Education Males
Income
Underemployed Male
Electricity
Water
Primary Education Female
Poor Health Services
Unprotected Job Male

Households Facing Multiple Deprivations
4.7%
12.7%
18.2%17.2%
13.8%
10.8%
7.8%
5.2%
3.5%2.6%
1.3% 1.2% 1.0%
0%
2%
4%
6%
8%
10%
12%
14%
16%
18%
20%
0 1 2 3 4 5 6 7 8 9 10 11 12 +
Number of Deprivations
Iraq
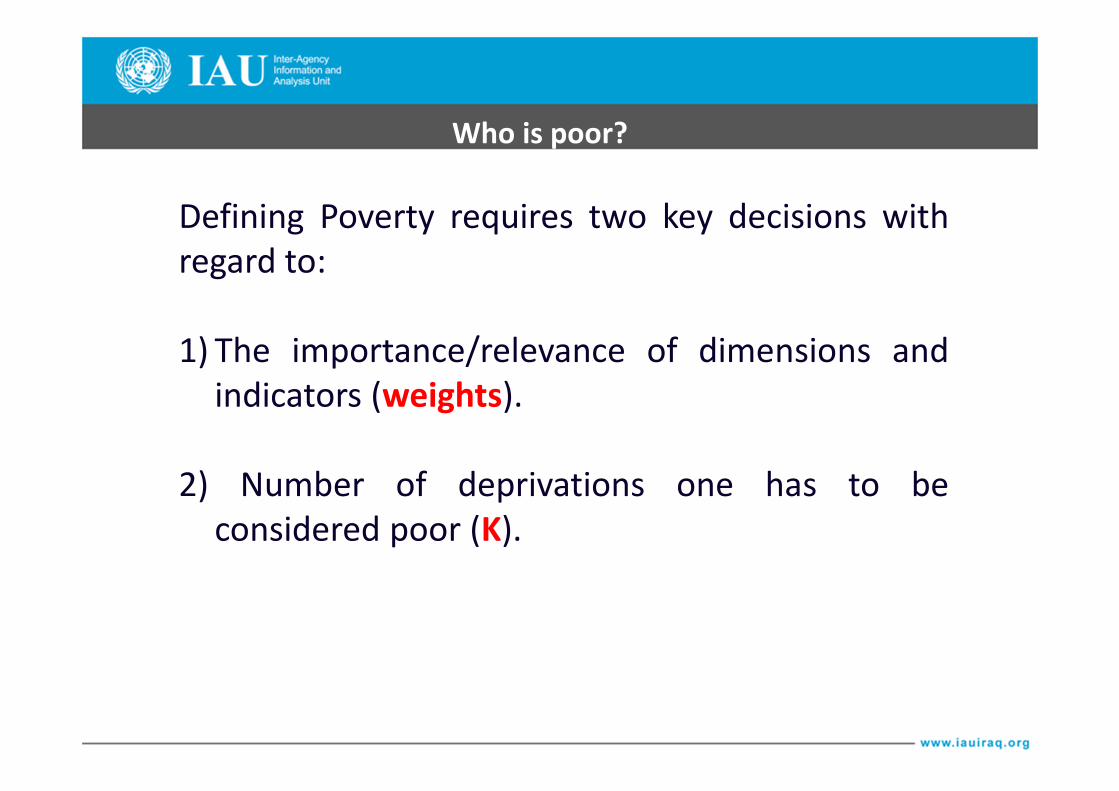
Defining Poverty requires two key decisions with
regard to:
1) The importance/relevance of dimensions and
indicators (weights).
2) Number of deprivations one has to be
considered poor (K).
Who is poor?

Dimensions and Indicators WEIGHTS
Education 20%
Primary Education Males 5%
Primary Education Female 5%
Illiteracy Male 5%
Illiteracy Female 5%
Standard of Living 20%
Income 10%
Housing 5%
Crowding 5%
Basic Services 20%
Water 5%
Sanitation 5%
Garbage Collection 5%
Electricity 5%
Nutrition and Health 20%
Balanced Diet 5%
Calories Intake 5%
Poor Health Services 5%
Distant Health Services 5%
Employment 20%
Unemployed Male 5%
Unemployed Female 5%
Underemployed Male 2.5%
Underemployed Female 2.5%
Unprotected Job Male 2.5%
Unprotected Job Female 2.5%
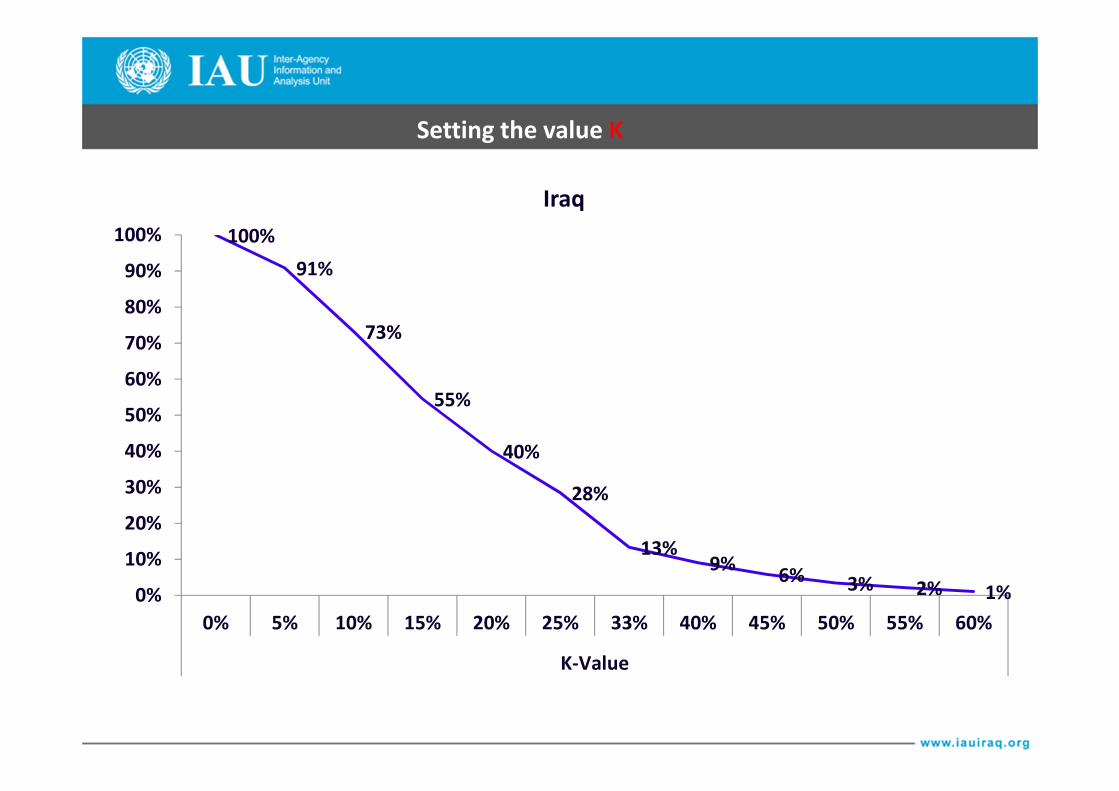
Setting the value K
100%
91%
73%
55%
40%
28%
13%9%
6% 3% 2% 1%0%
10%
20%
30%
40%
50%
60%
70%
80%
90%
100%
0% 5% 10% 15% 20% 25% 33% 40% 45% 50% 55% 60%
K-Value
Iraq
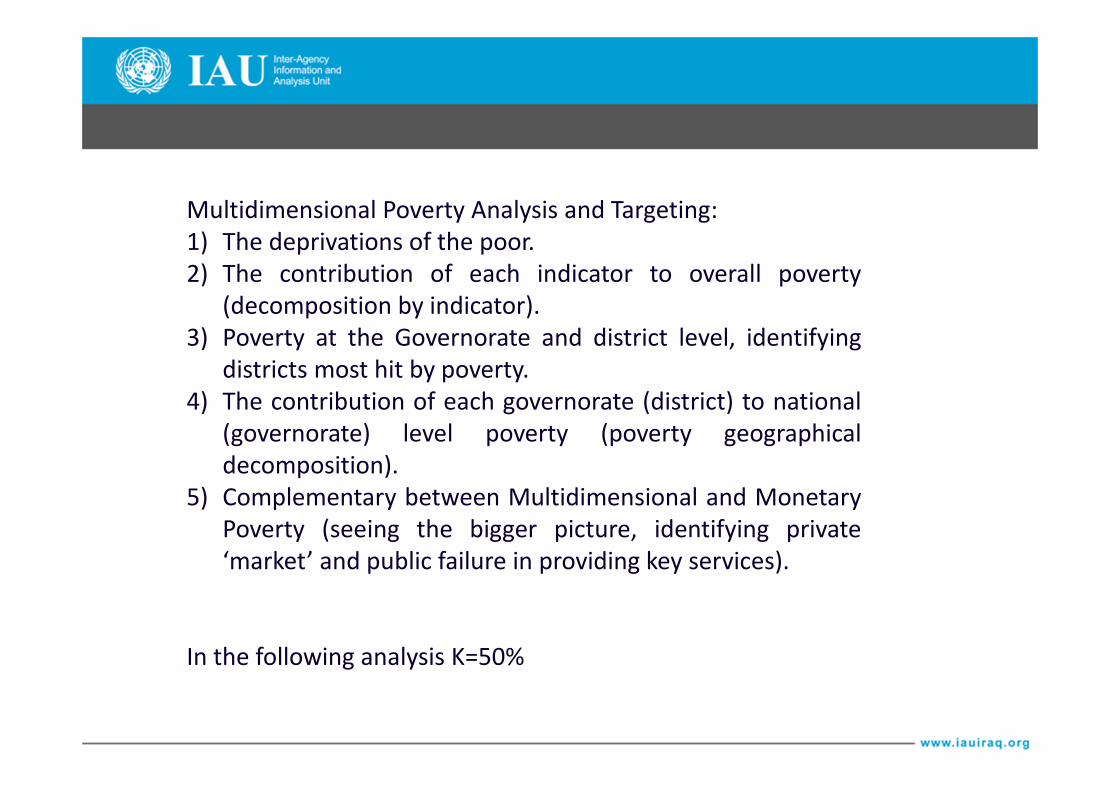
Multidimensional Poverty Analysis and Targeting:
1) The deprivations of the poor.
2) The contribution of each indicator to overall poverty
(decomposition by indicator).
3) Poverty at the Governorate and district level, identifying
districts most hit by poverty.
4) The contribution of each governorate (district) to national
(governorate) level poverty (poverty geographical
decomposition).
5) Complementary between Multidimensional and Monetary
Poverty (seeing the bigger picture, identifying private
‘market’ and public failure in providing key services).
In the following analysis K=50%

MPI results (K=33%)Multidimensional Poverty Low income
(Lowest
quintile)H Headcount
A Average Deprivation
Share
M0 Adjusted Headcount
Measure
Iraq 13.3% 44.8% 0.0596 20.0%
SULAIMAN
IYA 1.4% 40.8% 0.0055 2.5%
ERBIL 3.3% 39.3% 0.0128 4.6%
BAGHDAD 4.3% 43.4% 0.0185 6.9%
KIRKUK 6.2% 42.6% 0.0263 9.4%
DUHOK 8.4% 41.4% 0.0347 15.2%
BABYLON 9.9% 43.6% 0.0434 18.5%
DIYALA 11.2% 40.7% 0.0457 23.6%
KERBELA 12.9% 46.2% 0.0598 17.4%
ANBAR 14.2% 43.0% 0.0610 23.6%
SALAH AL-
DEEN 14.5% 43.3% 0.0628 15.6%
NAJAF 14.0% 46.3% 0.0650 15.2%
BASRAH 17.9% 45.0% 0.0808 29.3%
MUTHANN
A 19.2% 43.0% 0.0825 42.4%
MOSUL 23.2% 45.3% 0.1053 37.0%
QADISIYA 22.6% 47.9% 0.1082 32.6%
THI-QAR 29.8% 44.8% 0.1337 51.1%
WASIT 29.8% 45.1% 0.1344 29.1%
MAYSAN 30.4% 48.9% 0.1486 24.6%

MP Headcount “H” at the Governorate level

0.1%
0.2%
1.0%
1.6%
1.9%
2.4%
2.5%
2.8%
3.4%
3.8%
4.5%
4.6%
5.1%
5.3%
6.2%
6.6%
6.9%
7.3%
7.6%
9.1%
17.2%
0.0% 5.0% 10.0% 15.0% 20.0%
Underemployed Female
Unemployed Female
Unprotected Job Female
Underemployed Male
Unemployed Male
Sanitation
Garbage Collection
Unprotected Job Male
Illiteracy Male
Calories Intake
Distant Health Services
Housing
Crowding
Balanced Diet
Primary Education Males
Illiteracy Female
Water
Electricity
Poor Health Services
Primary Education Female
Income
Iraq
Percentage contribution of
indicators to the deprivations
of the Multidimensional Poor
individuals

Geographical Distribution of the MP poor
0.5%
1.1%
1.8%
2.2%
3.2%
3.3%
3.5%
4.1%
4.4%
4.6%
5.0%
6.1%
6.4%
7.6%
8.5%
9.9%
12.9%
14.9%
0% 2% 4% 6% 8% 10% 12% 14% 16%
SULAIMANIYA
ERBIL
KIRKUK
DUHOK
MUTHANNA
KERBELA
DIYALA
BABYLON
NAJAF
SALAH AL- DEEN
ANBAR
BAGHDAD
QADISIYA
MAYSAN
WASIT
BASRAH
THI-QAR
MOSUL

0.1%
0.2%
1.0%
1.6%
1.9%
2.4%
2.5%
2.8%
3.4%
3.8%
4.5%
4.6%
5.1%
5.3%
6.2%
6.6%
6.9%
7.3%
7.6%
9.1%
17.2%
0.0% 2.0% 4.0% 6.0% 8.0% 10.0% 12.0% 14.0% 16.0% 18.0% 20.0%
Underemployed Female
Unemployed Female
Unprotected Job Female
Underemployed Male
Unemployed Male
Sanitation
Garbage Collection
Unprotected Job Male
Illiteracy Male
Calories Intake
Distant Health Services
Housing
Crowding
Balanced Diet
Primary Education Males
Illiteracy Female
Water
Electricity
Poor Health Services
Primary Education Female
Income
Percentage contribution of
indicators to the deprivations
of the Multidimensional Poor
individuals
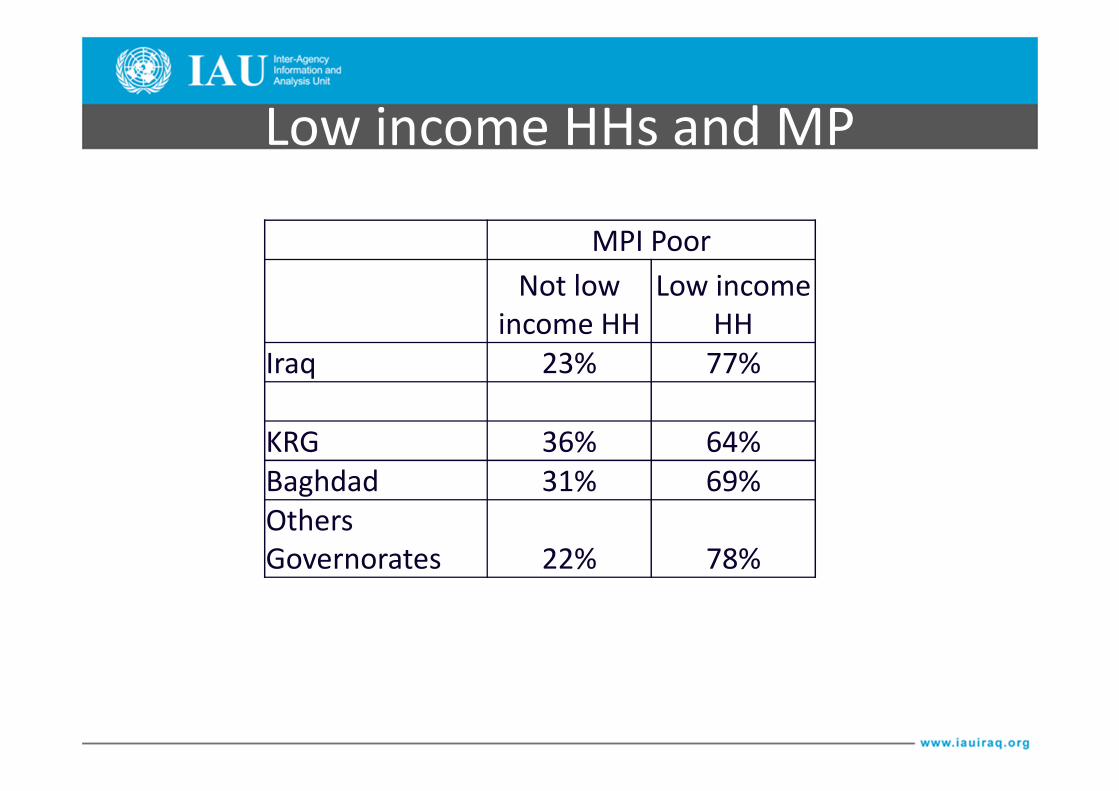
Low income HHs and MP
MPI Poor
Not low
income HH
Low income
HH
Iraq 23% 77%
KRG 36% 64%
Baghdad 31% 69%
Others
Governorates 22% 78%

Low income HHs and MP
77%
10%
3% 10% Niether MP poor nor a
low income HH
Low income HH but not
MP poor
MP poor but not a low
income HH
Both MP poor and low
income HH

Thank you


