20
Multilevel Linear Models Field, Chapter 19
| Date post: | 02-Jan-2016 |
| Category: |
Documents |
| Upload: | erick-norton |
| View: | 240 times |
| Download: | 0 times |
Multilevel Linear Models
Field, Chapter 19
Why use multilevel models?
• Meeting the assumptions of the linear model– Homogeneity of regression coefficients– Independence of observations–Missing data
• More power (sort of)
Random intercepts
• Yi=(b0 + u0i) + b1X1i + εi
• What are the coefficients?– b0: overall intercept
– u0: individual deviation
– b1: slope coefficient
• What does this look like?– To the board!
Random intercepts, continued
• What does u0 represent, substantively?– Individual differences in signal rate change
Changes in -2LogLikelihood
• Why do this?– Test if random coefficients “improve” the model
• Generally applicable technique for a range of models
• Caveats– Need to use ML, not REML– New model needs to be nested within old
Writing the population model
• What’s the population model for the data we used last week?
• Fixed effects:– Yi=b0 + b1Coili + b2Accelerationx2 +
b3Accelerationx3 + b4Resolution3+ εi
• Random intercept:Yi=(b0 + u0i) + b1X1i + b2Accelerationx2 +
b3Accelerationx3 + b3Resolution3+ εi
Setting up the dataset
• Currently in wide format – multiple outcome variables per subject
• Need to go to long – multiple cases per subject
• (What’s the difference?)• Before we start, take a snapshot of your data:
you’ll need it later!
In SPSS
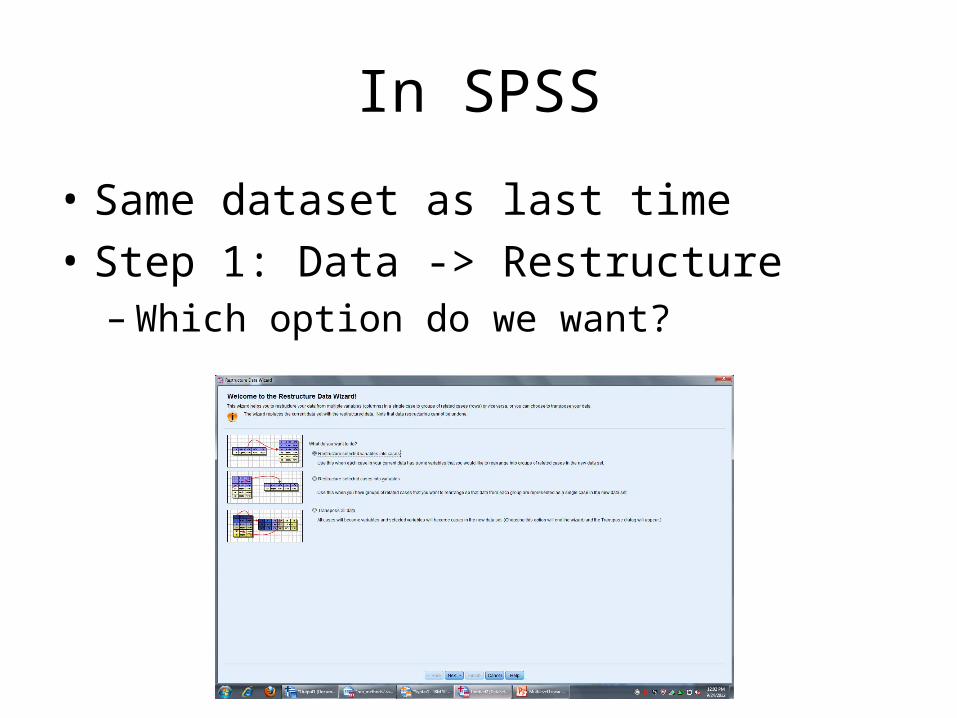
• Same dataset as last time• Step 1: Data -> Restructure–Which option do we want?
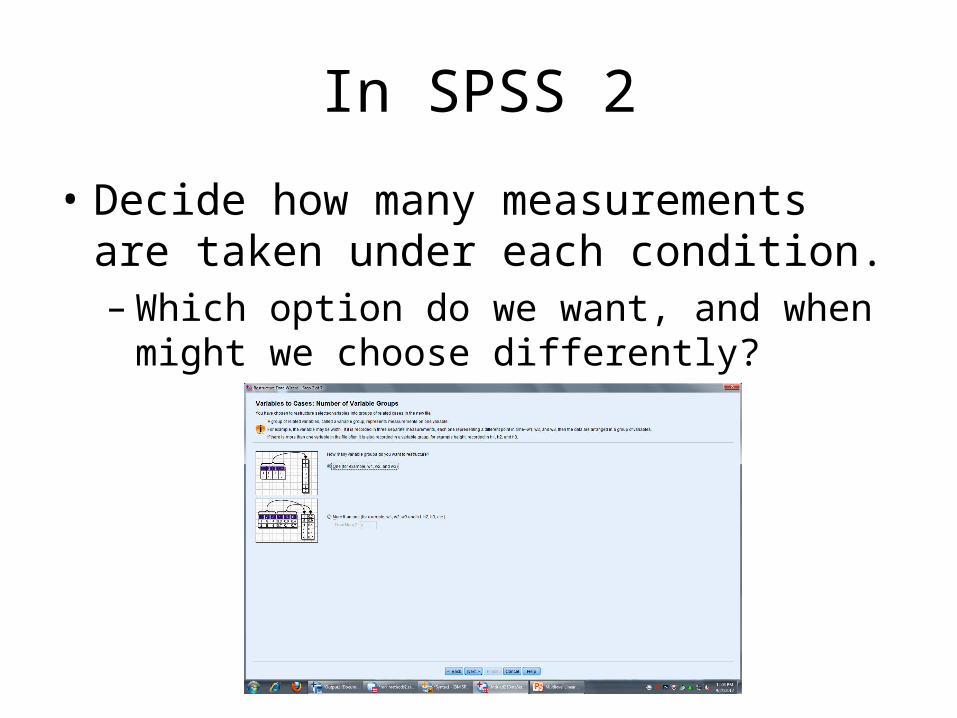
In SPSS 2
• Decide how many measurements are taken under each condition.–Which option do we want, and when might we
choose differently?
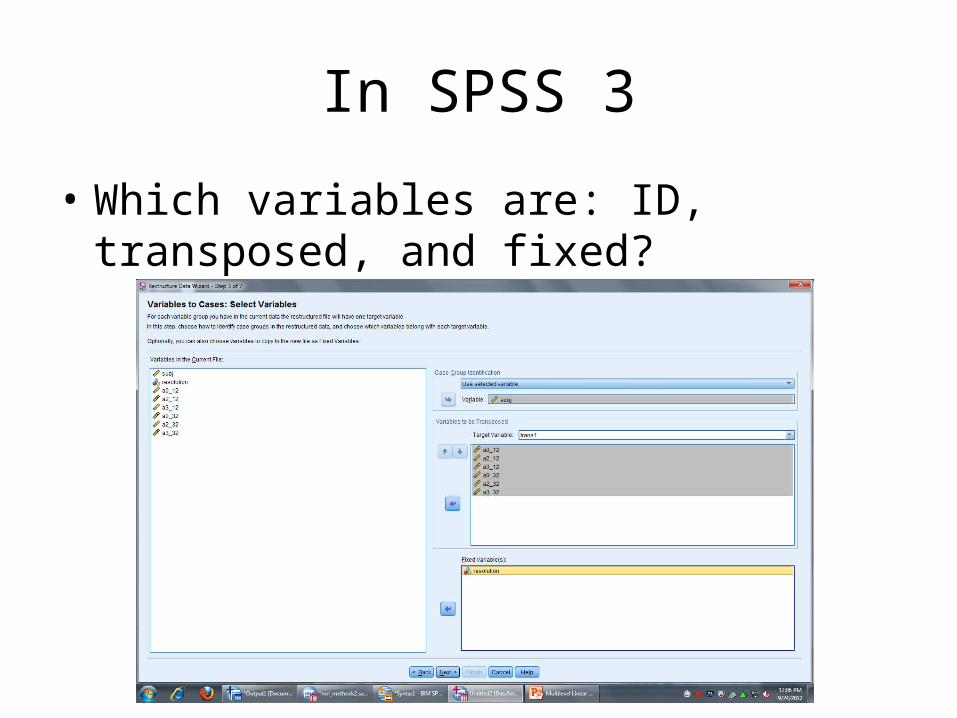
In SPSS 3
• Which variables are: ID, transposed, and fixed?
In SPSS 4
• What are the conditions under which the outcome was measured in each subject?– coil and acceleration– choose two indices
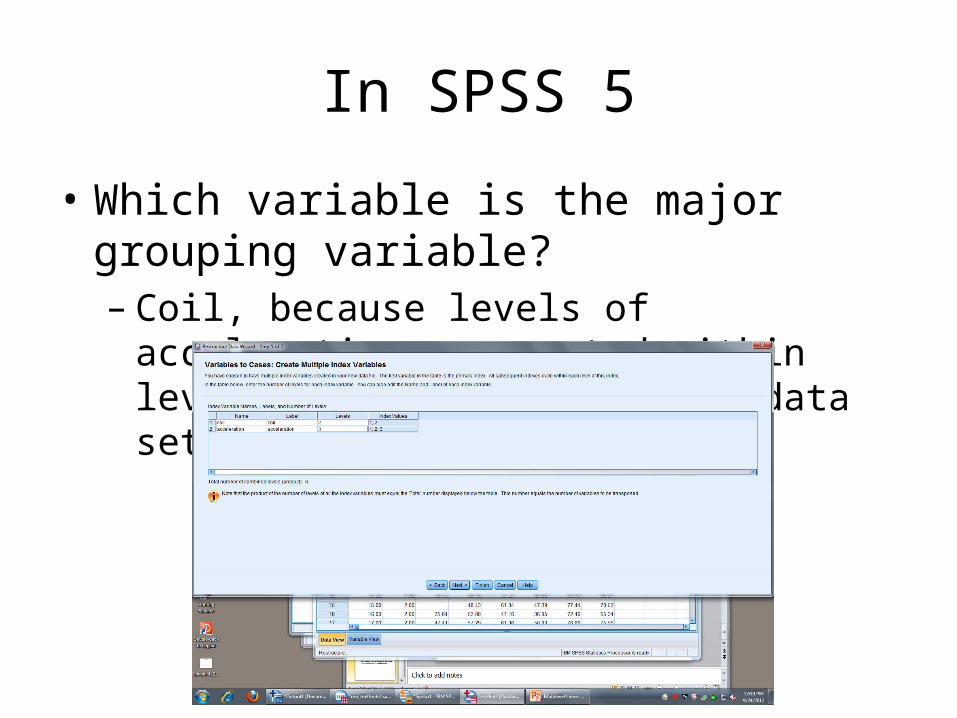
In SPSS 5
• Which variable is the major grouping variable?– Coil, because levels of acceleration are nested
within levels of coil (only in the data set-up!)
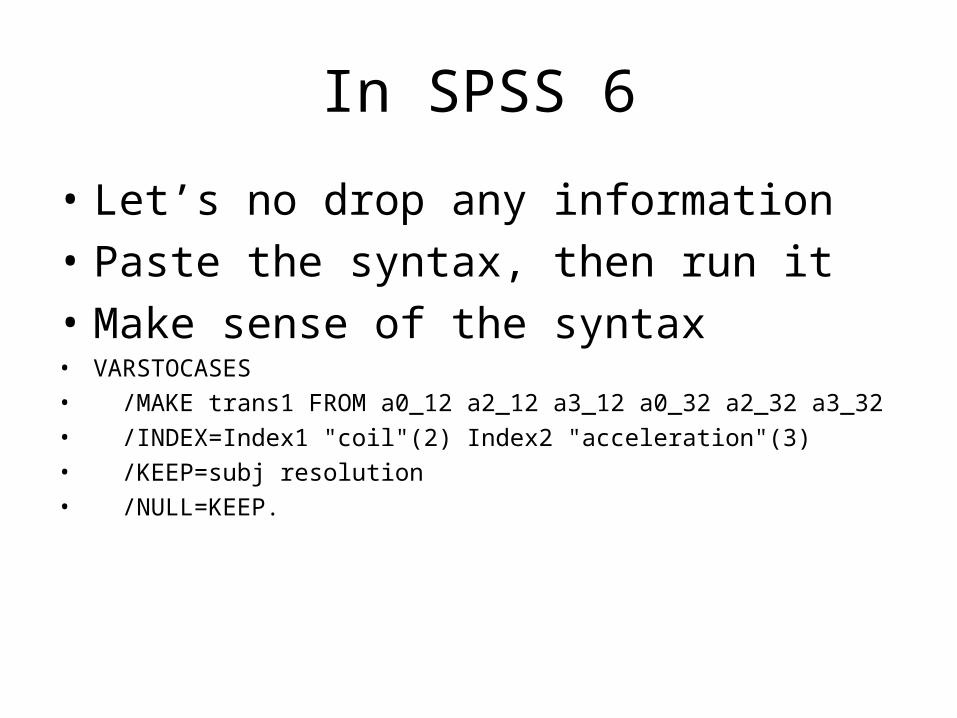
In SPSS 6
• Let’s no drop any information• Paste the syntax, then run it• Make sense of the syntax• VARSTOCASES• /MAKE trans1 FROM a0_12 a2_12 a3_12 a0_32 a2_32 a3_32• /INDEX=Index1 "coil"(2) Index2 "acceleration"(3) • /KEEP=subj resolution • /NULL=KEEP.
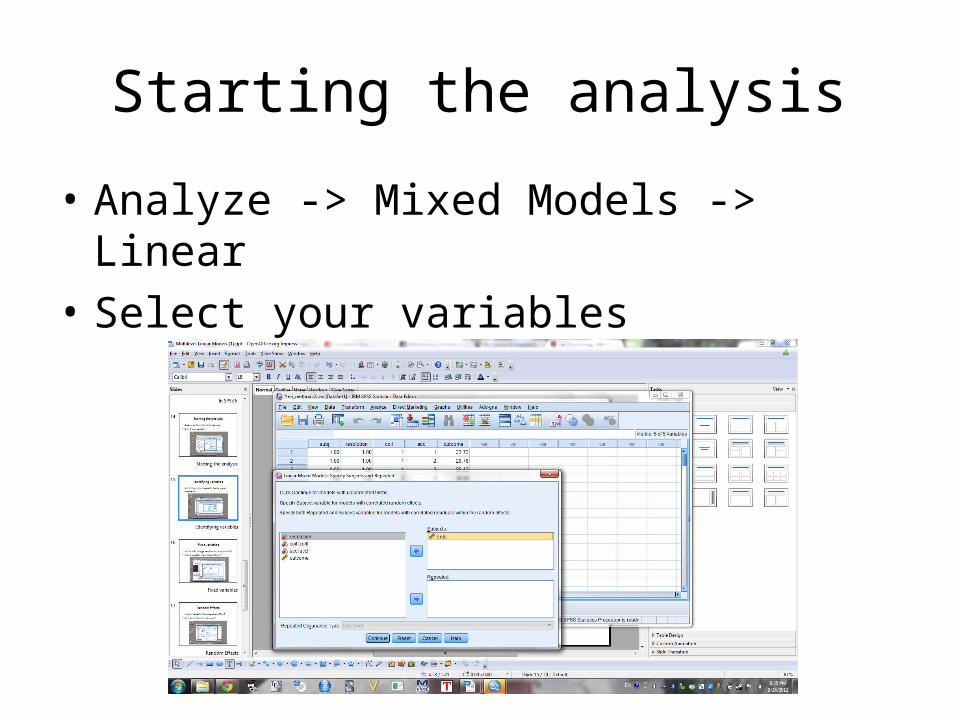
Starting the analysis
• Analyze -> Mixed Models -> Linear• Select your variables
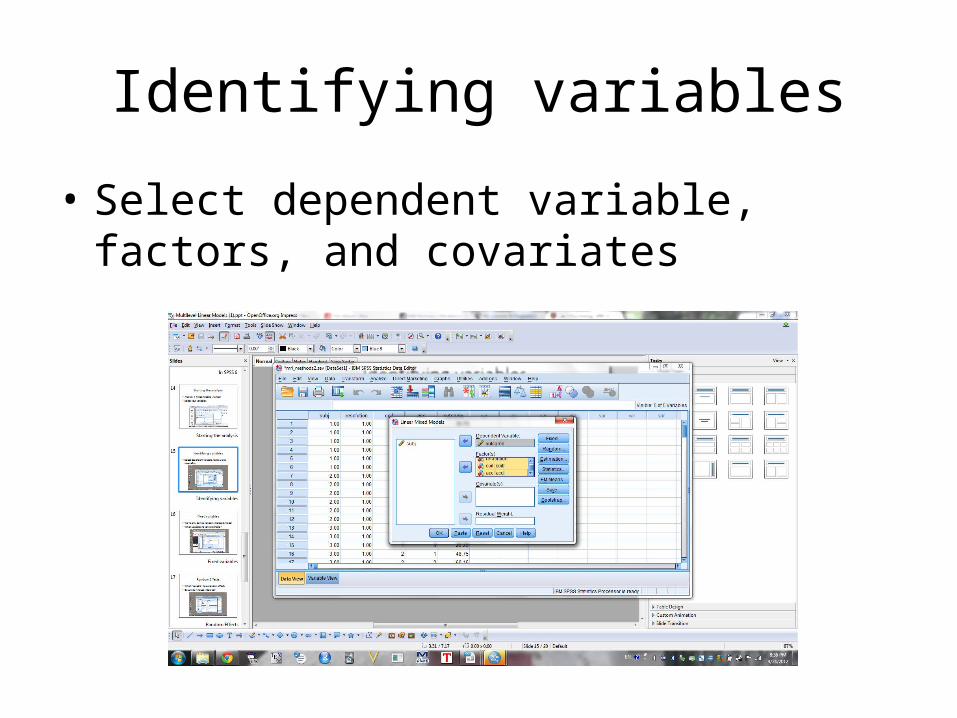
Identifying variables
• Select dependent variable, factors, and covariates
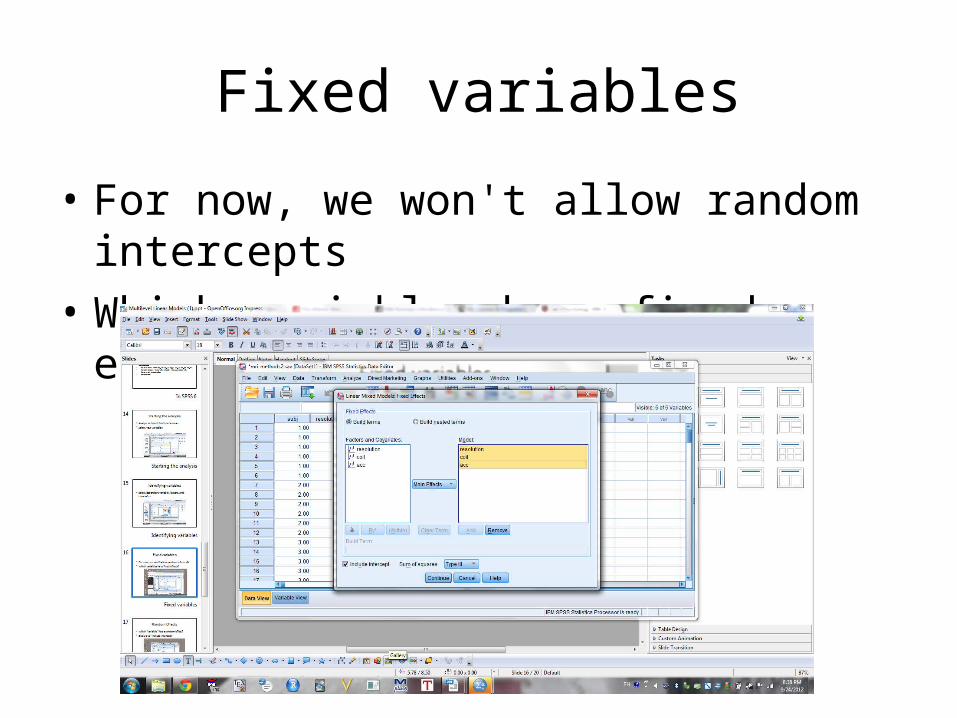
Fixed variables
• For now, we won't allow random intercepts• Which variables have fixed effects?
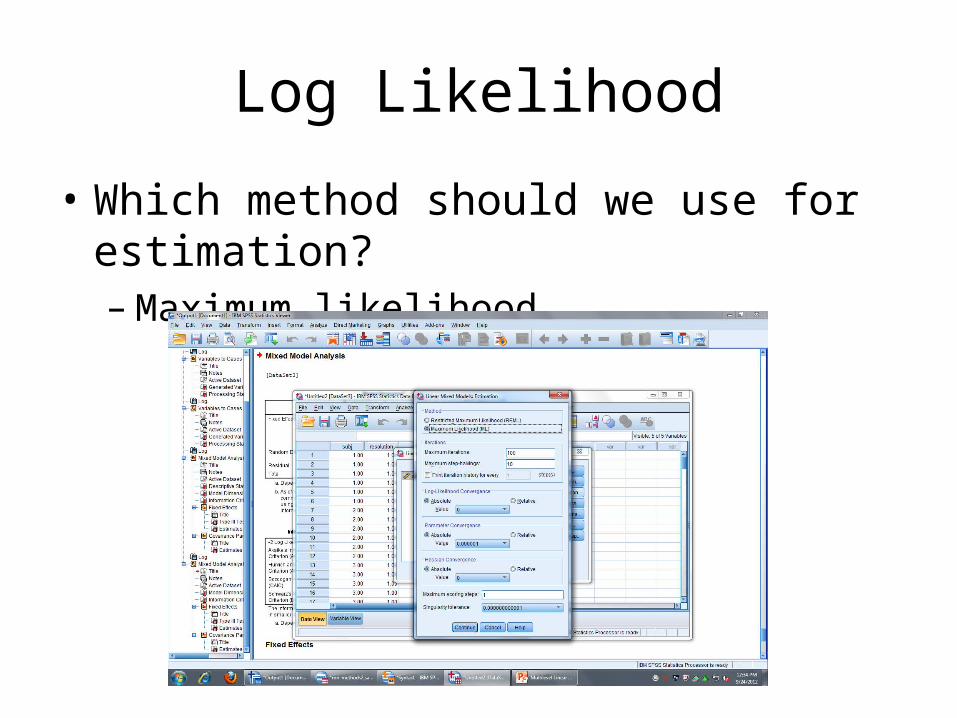
Log Likelihood
• Which method should we use for estimation?–Maximum likelihood
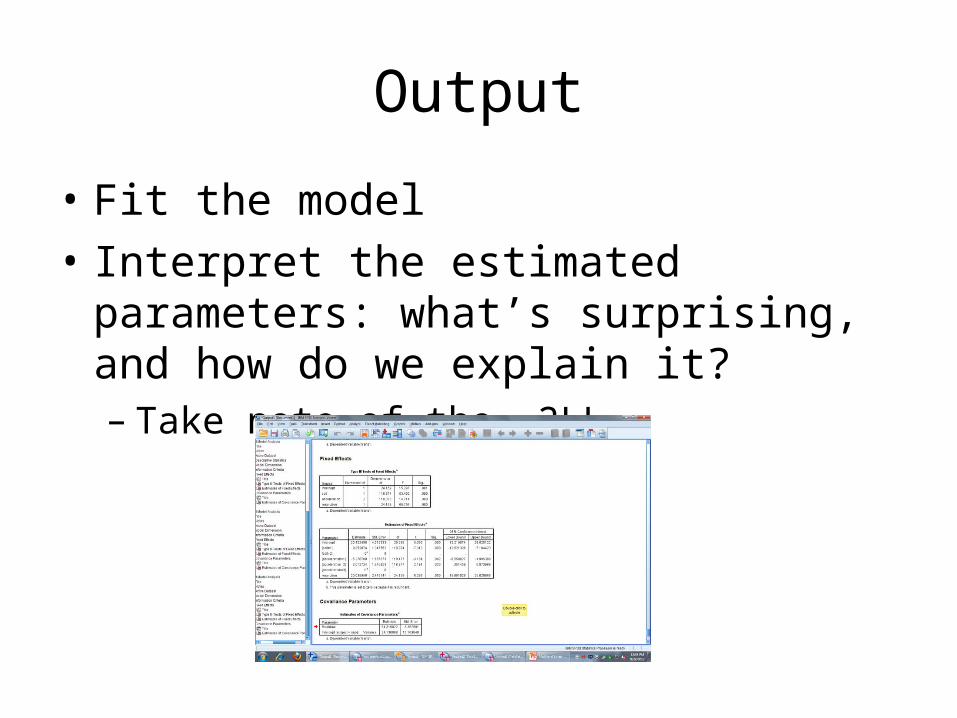
Output
• Fit the model• Interpret the estimated parameters: what’s
surprising, and how do we explain it?– Take note of the -2LL
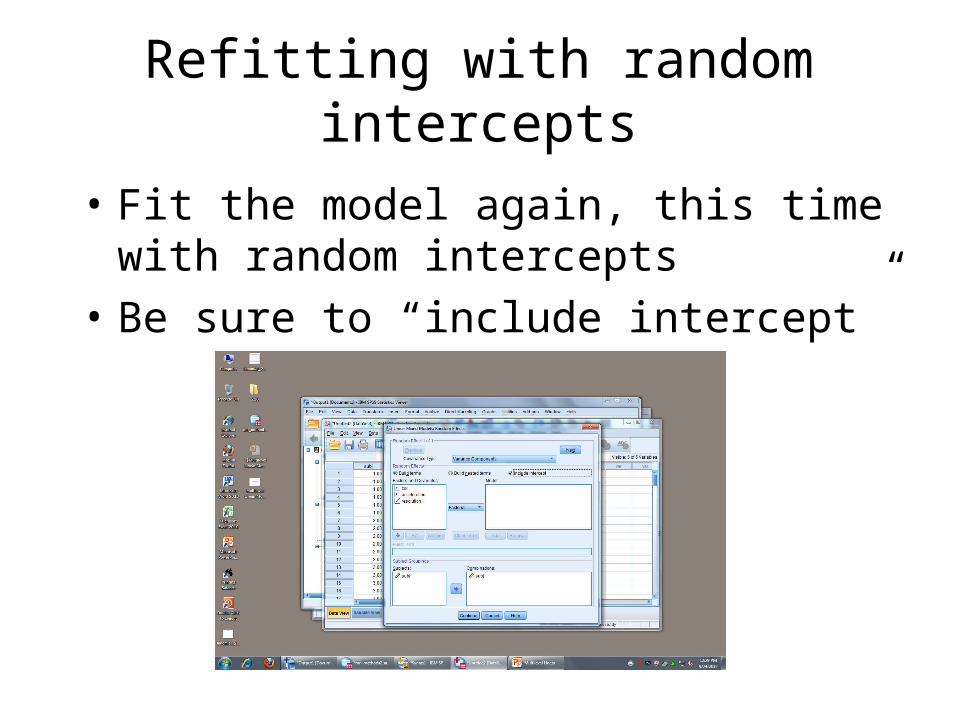
Refitting with random intercepts
• Fit the model again, this time with random intercepts
• Be sure to “include intercept”
Testing random intercepts
• Determine the change in -2LL, and the change in degrees of freedom
• Test to see if this is statistically significant– Change in -2LL near 17.5, change in df of 1 is
highly significant (use Chi-Squared calculator or table)
• If there's time, try splitting the sample on coil and repeating the analysis


