MULTILEVEL MODELING OF MELANOMA INCIDENCE USING COMBINED NPCR AND SEER DATA NAACCR 2010 Conference Quebec City, QC Canada Concurrent Session 5, Section F June 24, 2010 Chris Johnson, MPH Cancer Data Registry of Idaho
Transcript
MULTILEVEL MODELING OF MELANOMA INCIDENCE USING COMBINED NPCR
AND SEER DATA NAACCR 2010 ConferenceQuebec City, QC Canada
Concurrent Session 5, Section FJune 24, 2010
Chris Johnson, MPHCancer Data Registry of Idaho
The SES Paper
• Association of Cutaneous Malignant Melanoma Incidence with Area-based Socioeconomic Indicators —United States, 2004–2006
• Authors:– Simple D. Singh, Umed A. Ajani, Christopher
J. Johnson, Katherine B. Roland, Melody Eide, Ahmedin Jemal, Serban Negoita, Rana Bayakly, Donatus U. Ekwueme
The SES Paper
• An individual’s socioeconomic status (SES) is known to be one of the most powerful predictors of health.
• Measures / proxy indicators of SES include income, education, occupation, place of residence, and race.
Research Goal
• To provide a detailed description of cutaneous melanoma incidence and stage of disease in relationship to area-based socioeconomic measures including poverty level, education, income, and unemployment in the United States.
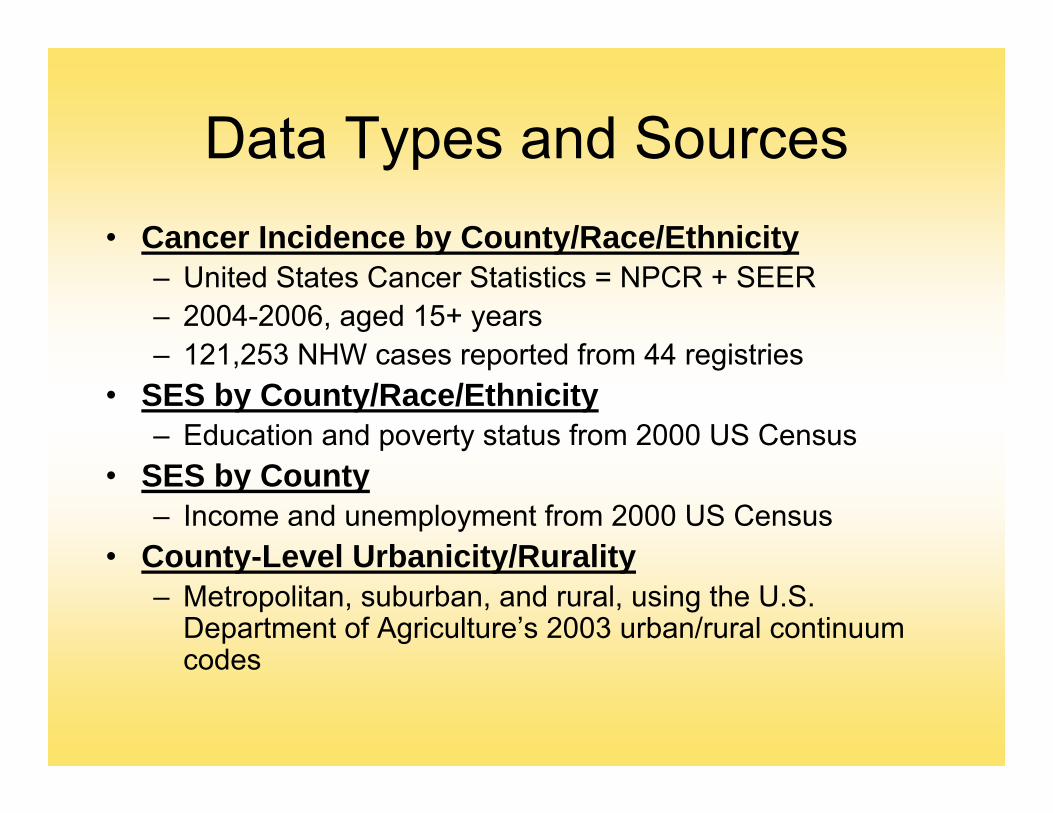
Data Types and Sources• Cancer Incidence by County/Race/Ethnicity
– United States Cancer Statistics = NPCR + SEER– 2004-2006, aged 15+ years – 121,253 NHW cases reported from 44 registries
• SES by County/Race/Ethnicity– Education and poverty status from 2000 US Census
• SES by County– Income and unemployment from 2000 US Census
• County-Level Urbanicity/Rurality– Metropolitan, suburban, and rural, using the U.S.
Department of Agriculture’s 2003 urban/rural continuum codes
County-Level SES by Race/Ethnicity
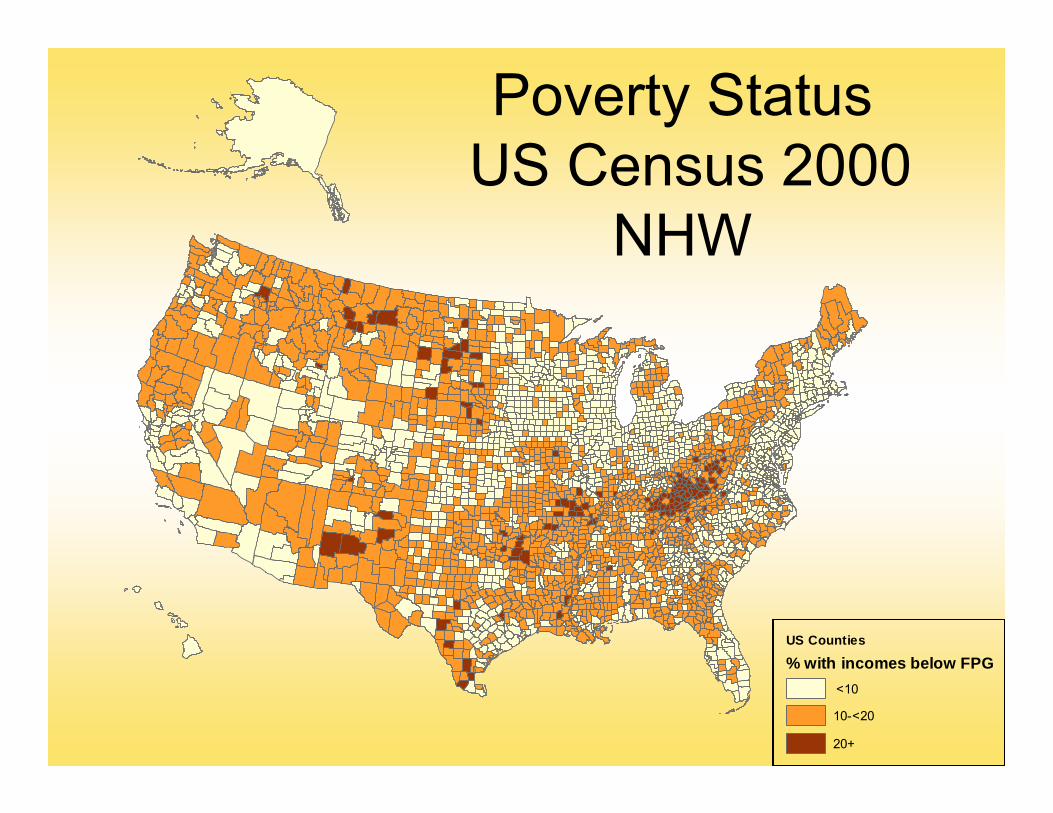
• Poverty status• % of the county population below the
federal poverty level:< 10%10-19.9% ≥ 20%
Poverty StatusUS Census 2000
NHW
US Counties
% with incomes below FPG <10
10-<20
20+
County-Level SES by Race/Ethnicity
• High school education• % of the county population who reported a
high school education (among persons aged 25+)
< 75%75-<85% 85% +
High School EducationUS Census 2000Ages 25+, NHW
US Counties
% with HS Education85+
75-<85
<75
County-Level SES
• Median household income< $35,000$35,000-49,999$50,000 +
Median HH IncomeUS Census 2000
US CountiesMedian Household Income
<35,000
35,000-49,999
50,000+
County-Level SES
• Unemployment< 5%5-10%>10%
UnemploymentUS Census 2000
US Counties% Unemployed
<5
5-10
>10
County-Level Measures of Rural-Urban Status
• U.S. Department of Agriculture’s urban/rural continuum codes (2003):
Metropolitan: (RUCC 1-3) Urban: non-metropolitan counties with
urban populations (RUCC 4-7)Rural (RUCC 8-9)
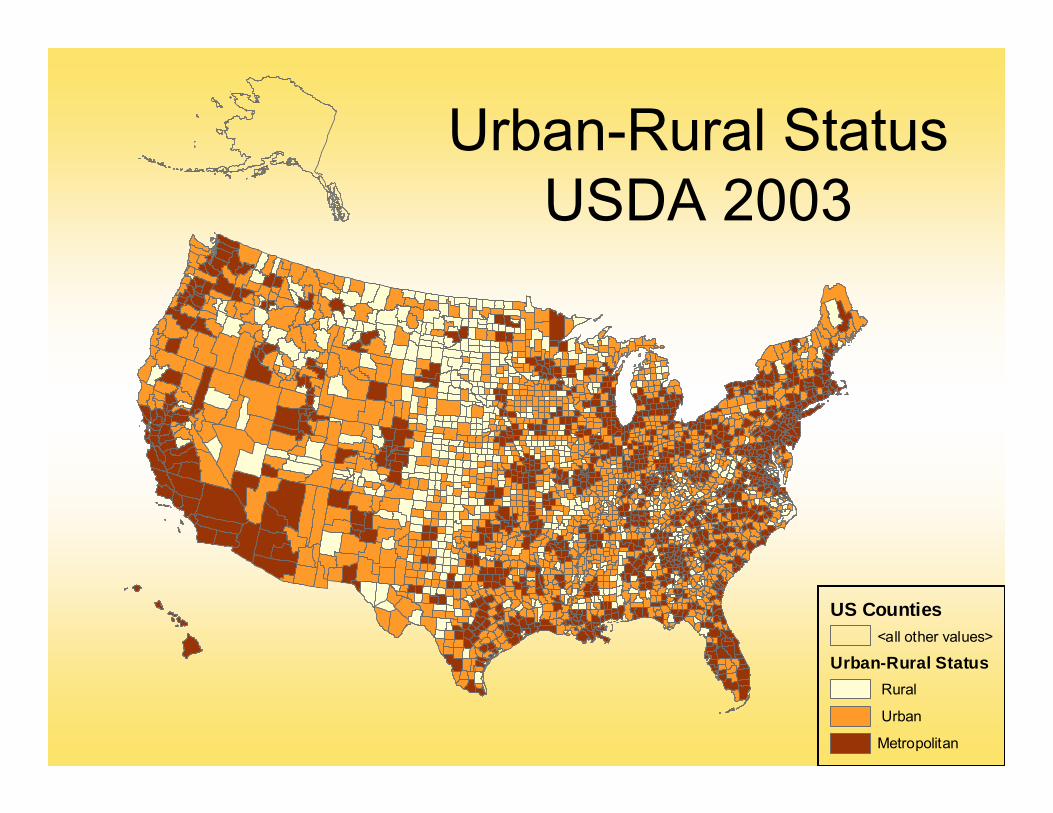
Urban-Rural StatusUSDA 2003
US Counties<all other values>
Urban-Rural Status Rural
Urban
Metropolitan
Statistical Methods• Multilevel Modeling• Poisson multilevel mixed models using SAS
PROC GLIMMIX (V9.2) were fitted to model the incidence of cutaneous melanoma
• Separate models for early and late stage– CS derived SEER Summary Stage 2000 variable
• Localized• Regional / Distant
• Data had a hierarchical multilevel structure:– Sex by age group by county “analysis cells”
• Age groups 15-34, 35-64, 65+– Analysis cells were nested within counties– Counties were nested within states.
Statistical Methods• Multilevel Modeling• State of residence at the time of diagnosis was
included as a random effect in the models• Conditional on the state random effect rates and
the fixed effects at the county and cell levels, the observed cancer case counts were assumed to be independent Poisson variables
• Offset was log of expected cases, which was calculated using age- and sex- specific rates for all states combined – this accounts for potential confounding by age and sex.
• Covariance parameter was included to address spatial autocorrelation
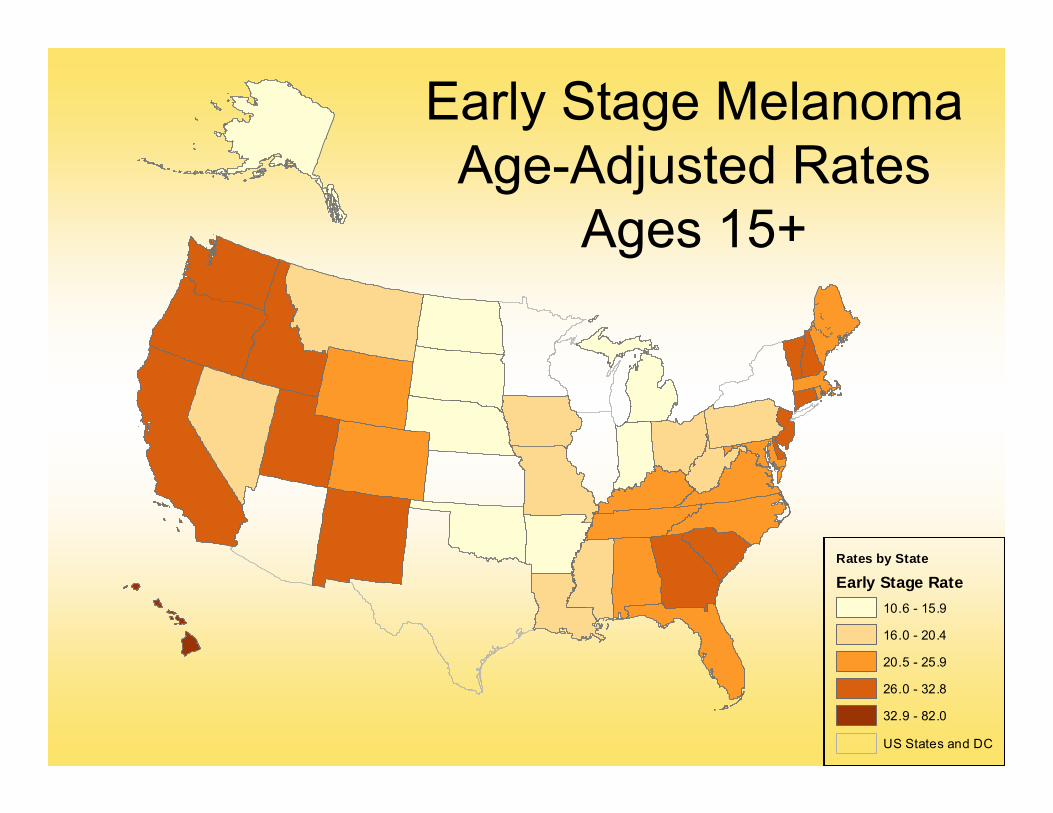
Early Stage Melanoma Age-Adjusted Rates
Ages 15+
Rates by State
Early Stage Rate10.6 - 15.9
16.0 - 20.4
20.5 - 25.9
26.0 - 32.8
32.9 - 82.0
US States and DC
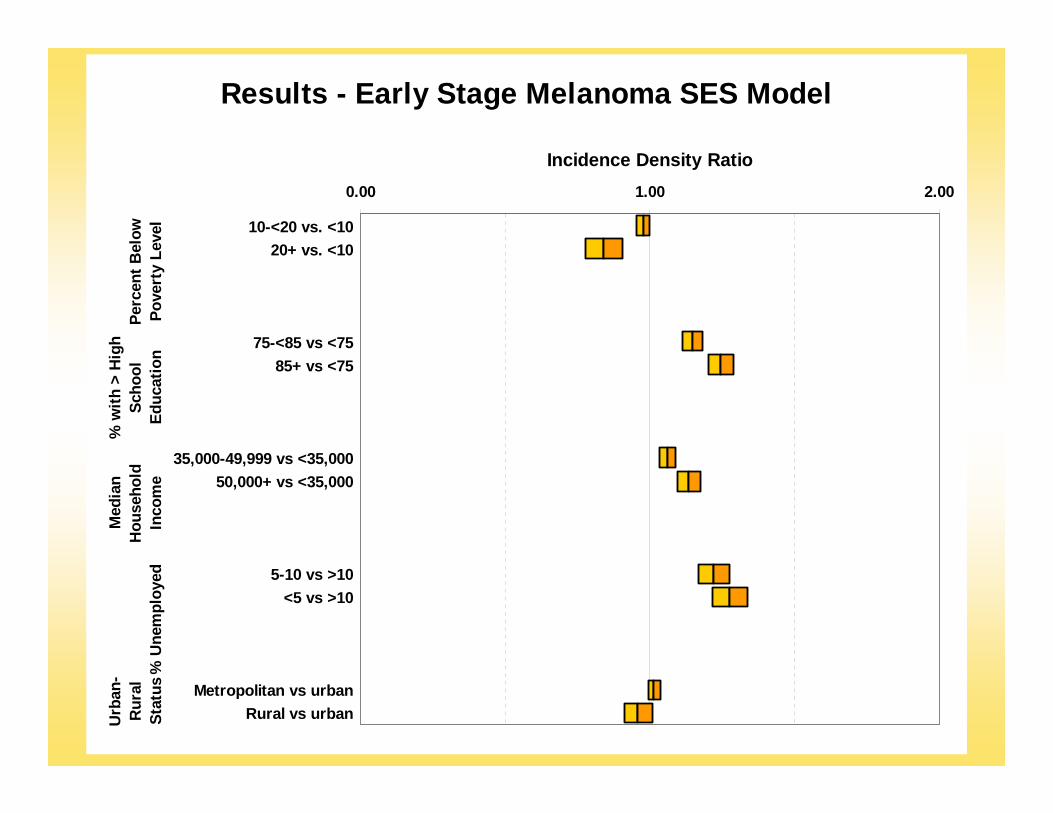
Results - Early Stage Melanoma SES Model
0.00 1.00 2.00
10-<20 vs. <1020+ vs. <10
75-<85 vs <7585+ vs <75
35,000-49,999 vs <35,00050,000+ vs <35,000
5-10 vs >10<5 vs >10
Metropolitan vs urbanRural vs urban
Perc
ent B
elow
Pove
rty
Leve
l
% w
ith >
Hig
hSc
hool
Educ
atio
n
Med
ian
Hou
seho
ldIn
com
e%
Une
mpl
oyed
Urb
an-
Rur
alSt
atus
Incidence Density Ratio
Early Stage Melanoma BLUP Rates
Ages 15+, SES Model
Rates by StateBLUP Rates
9.3 - 21.8
21.9 - 23.0
23.1 - 25.4
25.5 - 26.7
26.8 - 39.4
p<0.05
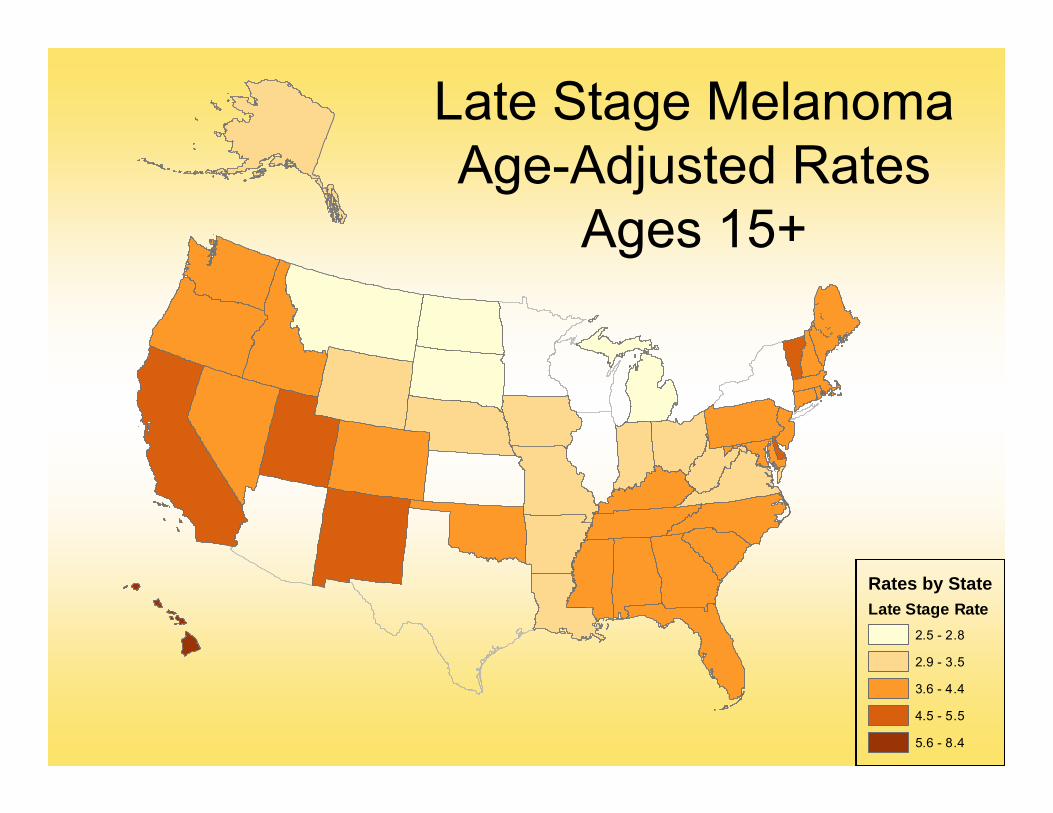
Late Stage Melanoma Age-Adjusted Rates
Ages 15+
Rates by StateLate Stage Rate
2.5 - 2.8
2.9 - 3.5
3.6 - 4.4
4.5 - 5.5
5.6 - 8.4
Results - Late Stage Melanoma SES Model
0.00 1.00 2.00
10-<20 vs. <1020+ vs. <10
75-<85 vs <7585+ vs <75
35,000-49,999 vs <35,00050,000+ vs <35,000
5-10 vs >10<5 vs >10
Metropolitan vs urbanRural vs urban
Perc
ent B
elow
Pove
rty
Leve
l
% w
ith >
Hig
hSc
hool
Educ
atio
n
Med
ian
Hou
seho
ldIn
com
e%
Une
mpl
oyed
Urb
an-
Rur
alSt
atus
Incidence Density Ratio
Late Stage Melanoma BLUP Rates
Ages 15+, SES Model
Rates by StateBLUP Rates
3.4
3.5 - 3.6
3.7 - 4.0
4.1 - 4.2
4.3 - 4.5
p<0.05
The UV Paper
• Association of Cutaneous Melanoma Incidence with Ultraviolet Exposure
• Authors:– Thomas B Richards, Christopher J Johnson,
Zaria Tatalovich, Myles Cockburn, Melody J. Eide, Kevin A Henry, Sue-Min Lai, Sai S Cherala, Youjie Huang, Umed A Ajani
Research Goal
• To quantify the association of solar UV exposure with melanoma incidence in U.S. non-Hispanic whites.
Data Types and Sources• Cancer Incidence by County
– United States Cancer Statistics = NPCR + SEER
– 2004-2006, aged 15+ years – 120,037 NHW cases reported from 42 registries
• SES by County• County-Level Urbanicity/Rurality• AVGLO as Proxy for UV• Health Insurance – SAHIE• Physician Density
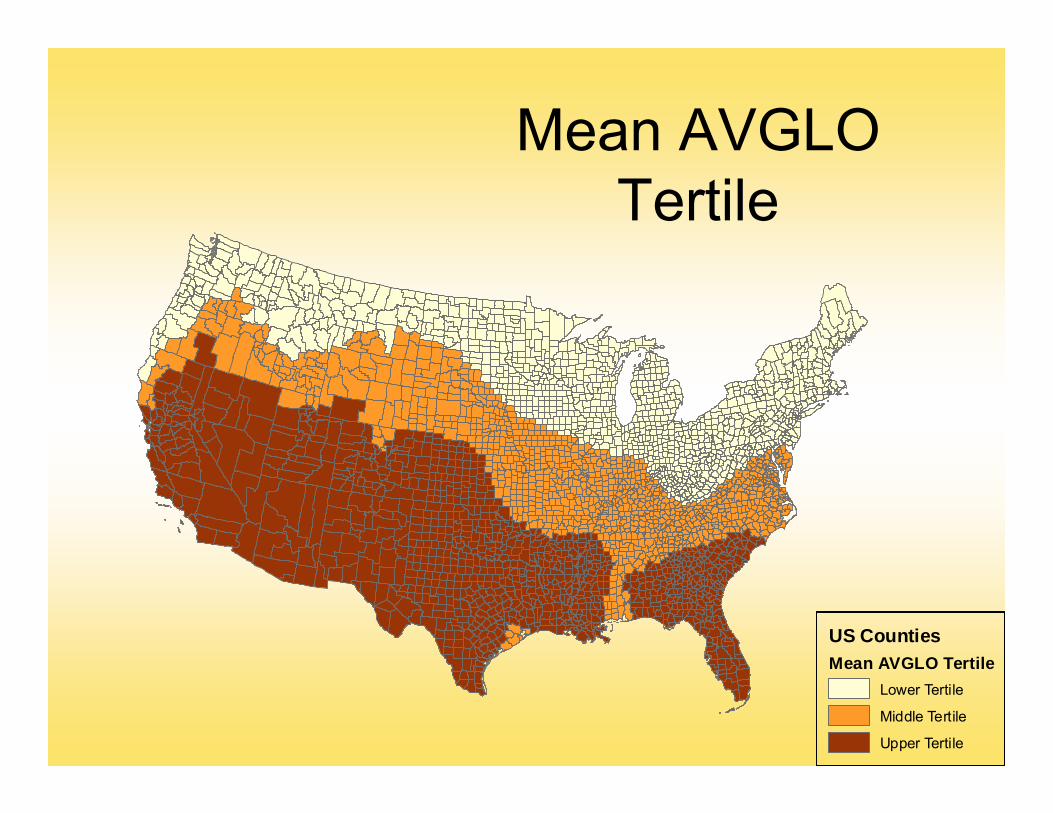
AVGLO as Proxy for UV• AVerage daily total GLObal solar radiation
– Data from 200+ measurement stations, part of the National Solar Radiation Database (NSRAD)
– Modeled using data from 1961-1990– Zaria Tatalovich, John P. Wilson, and Myles Cockburn
• “A Comparison of Thiessen Polygon, Kriging, and Spline Models of Potential UV Exposure”
– Mean county measure for contiguous US– Unit = watt hours per square meter (Wh/m2)– Categories:
• “Lower UV Counties” 3011.7 to 4079.8 Wh/m2 (779 counties)• “Middle UV Counties” 4079.9 to 4492.2 Wh/m2 (920 counties)• “Higher UV Counties” 4492.3 to 5722.5 Wh/m2 (713 counties)
Mean AVGLO Tertile
US CountiesMean AVGLO Tertile
Lower Tertile
Middle Tertile
Upper Tertile
Results - Early Stage Melanoma UV Model
0.00 1.00 2.00
Middle vs. Lower Upper vs. Lower
Middle vs. Lower Upper vs. Lower
Middle vs. Lower Upper vs. Lower
Middle vs. Lower Upper vs. Lower
Middle vs. Lower Upper vs. Lower
Middle vs. Lower Upper vs. Lower
Fem
ale
15-3
4Fe
mal
e35
-64
Fem
ale
65+
Mal
e
15-3
4M
ale
35
-64
Mal
e65
+
Incidence Density Ratio
Early Stage Melanoma BLUP Rates
Ages 15+, UV Model
Rates by StateBLUP Rates
13.6 - 21.9
22.0 - 23.1
23.2 - 25.5
25.6 - 26.7
26.8 - 44.1
<0.05
Results - Late Stage Melanoma UV Model
0.00 1.00 2.00
Middle vs. Lower
Upper vs. Lower
Middle vs. Lower
Upper vs. Lower
Fem
ale
Mal
e
Incidence Density Ratio
Late Stage Melanoma BLUP Rates
Ages 15+, UV Model
Rates by StateBLUP Rates
3.5 - 3.4
3.5 - 3.6
3.7 - 4.0
4.1 - 4.2
4.3 - 4.5
<0.05
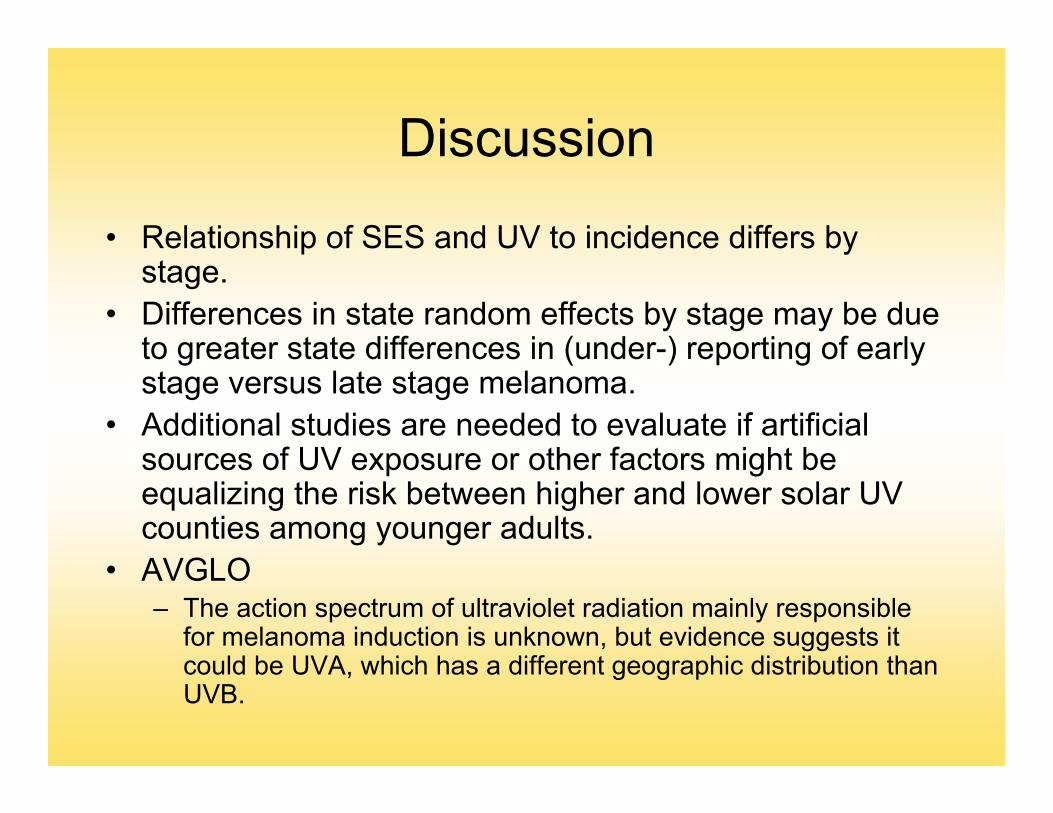
Discussion
• Relationship of SES and UV to incidence differs by stage.
• Differences in state random effects by stage may be due to greater state differences in (under-) reporting of early stage versus late stage melanoma.
• Additional studies are needed to evaluate if artificial sources of UV exposure or other factors might be equalizing the risk between higher and lower solar UV counties among younger adults.
• AVGLO– The action spectrum of ultraviolet radiation mainly responsible
for melanoma induction is unknown, but evidence suggests it could be UVA, which has a different geographic distribution thanUVB.
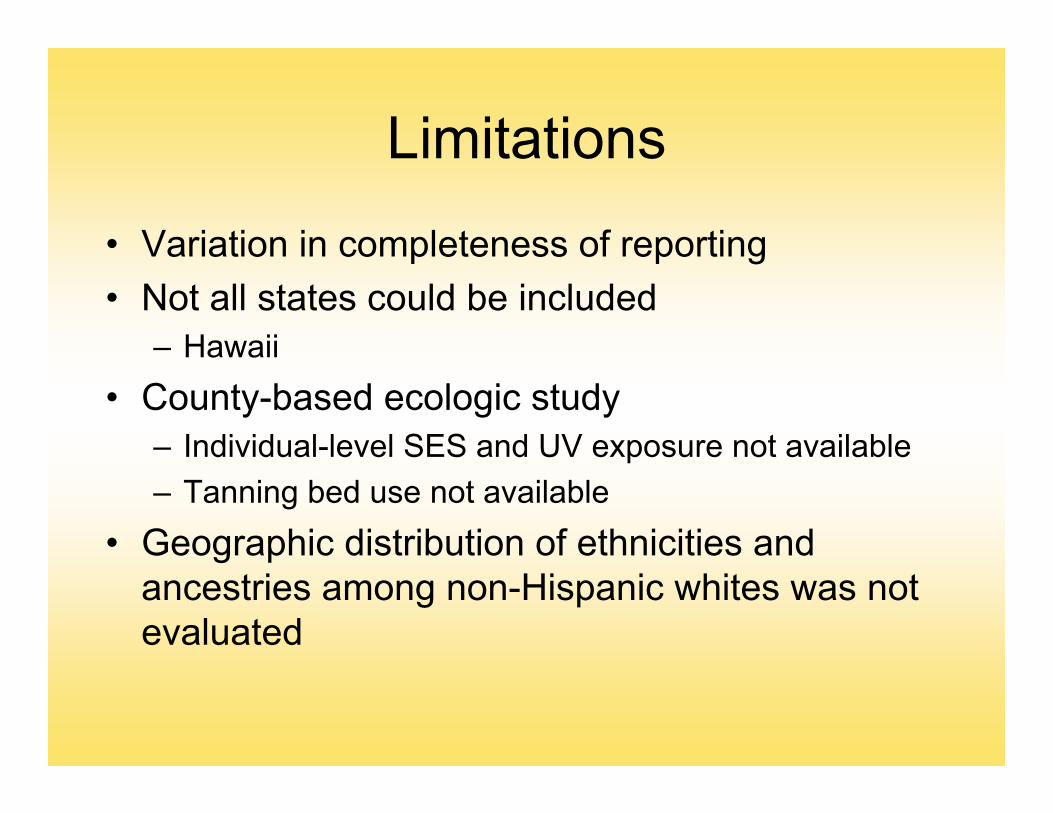
Limitations
• Variation in completeness of reporting• Not all states could be included
– Hawaii • County-based ecologic study
– Individual-level SES and UV exposure not available– Tanning bed use not available
• Geographic distribution of ethnicities and ancestries among non-Hispanic whites was not evaluated
Collaborators• Thomas Richards, MD, Division of Cancer Prevention
and Control, CDC• Simple Singh, MD, MPH, Division of Cancer Prevention
and Control, CDC• Meg Watson, MPH, Division of Cancer Prevention and
Control, CDC• Myles Cockburn, PhD, USC/Keck School of Medicine• Zaria Tatalovich, PhD, Division of Cancer Control and
Population Sciences, NCI• Melody J. Eide, MD, MPH, Henry Ford Health System• Kevin Henry, PhD, MA, New Jersey State Cancer Registry
The findings and conclusions in this report are those of the authors and do not necessarily represent the official position of the Centers for Disease Control and Prevention or the National Cancer Institute.


![Ophthalmology Update - Cleveland Clinicchoroidal nevi prevalence and choroidal melanoma incidence. The results, published in Ophthalmol-ogy [Singh AD, et al. Ophthalmology 2005;112:1784-89],](https://static.documents.pub/doc/80x56/5ed991a01b54311e7967ce4b/ophthalmology-update-cleveland-clinic-choroidal-nevi-prevalence-and-choroidal.jpg)


