53
Multilingual Interpretation in Science Centers and Museums A landscape study performed by the Association of Science-Technology Centers, Inc. and the Exploratorium.

Multilingual Interpretation in Science Centers and Museums A landscape study performed by the Association of Science-Technology Centers, Inc. and the Exploratorium.

Table of Contents Rationale ....................................................................................................................................... 3
Goals and Methods ...................................................................................................................... 4
Researchers .................................................................................................................................. 5
Operational Definitions ............................................................................................................. 6
Highlights ...................................................................................................................................... 7
Practices and Motivations ......................................................................................................... 9
Pervasiveness of Multilingual Support in Science Centers and Museums ................. 10
Motivations for Multilingual Support ................................................................................11
Experience with Multilingual Support .............................................................................. 13
Types of Multilingual Interpretation Offered .................................................................. 14
Opportunities to Interact with Multilingual Staff or Speakers .................................... 15
Research and Evaluation of Multilingual Interpretation Strategies ........................... 17
Development of Materials ................................................................................................... 18
Multilingual Exhibit Labels ..................................................................................................... 19
Representation of Multiple Languages in Multilingual Exhibit Labels ...................... 20
Formatting Multilingual Exhibit Labels ............................................................................ 21
Information Used on Exhibit Labels .................................................................................. 23
Top Challenges in Developing and Translating Multilingual Labels ........................... 24
Institutional Practices .............................................................................................................. 25
Departments that Develop and Implement Multilingual Strategies ........................... 26
Budget Devotion to Multilingual Information ................................................................. 27
Feedback from Local Community Members .................................................................... 28
Institutional Strategic Planning ......................................................................................... 29
Hiring and Recruiting Multilingual Staff .......................................................................... 30
Benefits to Offering Multilingual Information ................................................................ 31
Challenges in Offering Multilingual Information............................................................ 32
APPENDICES ............................................................................................................................... 33
APPENDIX A- Participating Institutions (U.S. & International) ................................... 34
APPENDIX B – Survey Instrument, U.S. Version ............................................................... 37
APPENDIX C – Survey Instrument, International Version ............................................. 45
List of Figures ......................................................................................................................... 53

3
Rationale Science centers and museums have a greater urgency now more than ever to understand and respond to the needs of diverse communities, as society becomes more ethnically and linguistically intricate. As public institutions of learning and engagement we must continue to garner attention and respect from all citizens to remain active in, and relevant to, the community. In order for these institutions to become more inclusive, additional studies aimed to enhance the understanding and advance the capacity to better serve a multitude of audiences must be conducted. Based on previous studies, the availability of multilingual offerings in museums and science centers is an area with little information, and one that needs further investigation. In fact, when conducting a literature review on this topic, the Exploratorium quickly learned that nothing comprehensive existed on the subject matter, reaffirming the great need for this information and research. With the Association of Science-Technology Centers (ASTC) as a collaborative partner, researchers co-developed a survey to learn more about multilingual offerings in museums and science centers in hopes to begin advancing the knowledge and awareness surrounding multilingual inclusiveness in these institutions.

4
Goals and Methods
The Multilingualism in Science Centers and Museums survey was developed jointly by the Exploratorium and ASTC in order to gain a baseline understanding of multilingual offerings in science centers and museums around the world. The survey focused on four areas of inquiry:
What are the most prevalent languages and interpretive formats used when providing multilingual interpretation?
What are the primary motivations for providing multilingual interpretation? What are the challenges in implementing multilingual approaches? What are the trends in implementing multilingual discourse across institutions with
respect to budget size and feasibility?
The Multilingualism in Science Centers and Museums report is based on responses to two online surveys: a version tailored for institutions in the United States, and one tailored for international institutions. Each survey consisted of 21 questions for both U.S. and international museums. There were slight differences in the wording of questions in the international survey based on the variance of primary languages, where the U.S. survey’s default language was English. In recognition of the complex nature of the survey questions, invitations to complete the survey were sent to multiple individuals within each institution, including; directors of education, marketing, outreach, exhibits, and public programs. Survey invitations were both sent and collected in October 2009. The U.S. version of the survey was disseminated to 701 individuals at 361 ASTC-member museums. The international version of the survey was disseminated to 167 individuals at 105 museums. Surveys were completed by 143 individuals representing 111 museums in the United States, and 38 individuals representing 33 museums internationally. The institutional response rate for both U.S. and international institutions was 31%. Individual response rates for U.S. and international respondents were 20% and 23%, respectively. The numbers reported reflect the museums that completed the survey and not necessarily the field as a whole. The data represented in this report is based on individual responses, not institutional responses, and does reflect responses from multiple individuals from a single institution in some cases. Overall, institutional demographics of respondents to this survey generally align with responses reported in the 2009 ASTC Sourcebook of Science Center Statistics with respect to budget size and type of institution. Where significant differences existed, responses from U.S.-based respondents and international respondents are listed separately.

5
Researchers The Multilingualism in Science Centers and Museums survey was developed jointly by staff members Veronica Garcia-Luis and Hugh McDonald from The Exploratorium, and by Laura Huerta Migus from ASTC. Migus administered the survey to U.S. and international ASTC-member institutions. Garcia-Luis analyzed and edited the data, with the assistance of Elizabeth Alexander and Debbie Siegel . Alexandra Chili of ASTC also edited the report and the narratives.

6
Operational Definitions
“Average” refers to the mean, where appropriate. The number of respondents to a particular question is indicated by “n”; “nr” means not reported or no response; and “na” means not applicable. “Interpretation” and “Interpretive Materials” refer to exhibit labels, informational signage, websites, public programs and events, and other methods of presenting content or interacting with visitors and audiences. “Exhibit Labels” refer to printed and/or digital signage that is designed as part of an exhibition or exhibition component. Budget categories used in this report are based on ASTC membership budget categories.

7
Highlights
Languages Offered In U.S.-based institutions, the most prevalent language offered is English at 87%. Only 10% of U.S.-based institutions offer most or all visitor information in more than one language. Of this 10%, the second most prevalent language is Spanish at 92%. In comparison, 55% of international institutions offer most or all of their visitor information in more than one language. The most commonly offered language in international institutions is English (97%), with French (38%), and Chinese (22%), as the second and third most popular languages offered. Interpretive Formats Used Responding U.S. institutions offer multilingual interpretation primarily through multilingual exhibit labels (78%). Other common multilingual resources include marketing materials (47%), public programs (42%), and docents or volunteers (42%). All responding international institutions provide multilingual exhibit labels. About three-quarters of international institutions also provide multilingual marketing materials (73%), and orientation materials (73%). Motivation for Multilingual Offerings For both U.S. and international respondents, an institutional mandate to make most or all exhibits or programs accessible to a range of audiences is the most common reason they offer visitor information in more than one language (56% and 77%, respectively). U.S.-based respondents cite targeted outreach to underserved audiences by specific departments (40%), and creation of exhibits or programs for specific groups (29%), as the next most common motivators. International respondents cite government or legal mandates (50%), preservation of the heritage or culture of local peoples (20%), and targeted outreach to underserved audiences by specific departments (20%), as the next most common motivators. Challenges in Implementing Multilingual Strategies Finding and identifying sufficient monetary and staff resources is the biggest challenge in developing and implementing multilingual labels for both U.S. and international respondents (70% and 71%, respectively). Creating effective and appropriate translations is the second biggest challenge for both U.S. and international respondents (33% and 54%, respectively).

8
Making multilingual labels a priority, or establishing buy-in from the rest of the institution or department is the third biggest challenge for U.S. respondents (25%), while ensuring effective label design is the third biggest challenge for international respondents (43%).

9
Practices and Motivations

10
Pervasiveness of Multilingual Support in Science Centers and Museums
Most U.S. science center and museum respondents (87%) indicated that their institutions present visitor information mainly in English, though approximately half of these respondents indicate the presence of some level of multilingual support. In comparison, the majority of international respondents (55%) indicated that their institutions provide most or all visitor information in more than one language. Only 10% of U.S. respondents indicated a similar level of multilingual support for visitors.
Figure 1a: Level of Multilingual Support by Budget Size – U.S. Respondents, n= 143
<$1 million $1-3 million $3-5 million > $5 million N=
Information in English only 18 20 8 14 61
Information mostly in English, some information in other languages
17 6 12 28 63
Most or all visitor information in more than one language.
3 1 3 8 15
No Response 0 0 0 1 1
Other 1 0 0 2 3
Figure 1b: Level of Multilingual Support by Budget Size – International Respondents, n= 38
<$1 million $1-3 million $3-5 million > $5 million N=
Information in one language only
2 1 0 3 6
Information mostly in primary language, some information in other languages
5 3 1 2 11
Most or all visitor information in more than one language.
4 0 5 12 21
No Response 0 0 0 0 0
Other 0 0 0 0 0

11
Motivations for Multilingual Support For US institutions, an institutional mandate to make most or all exhibits or programs accessible to a range of audiences is the most common reason they offer visitor information in more than one language (56%). Specific departments targeting outreach to underserved audiences is the next most common reason for US institutions (40%), and creation of exhibits or programs for specific groups is the third most common reason (29%).
For international institutions, an institutional mandate to make exhibits or programs accessible is also the most common reason they offer information in more than one language (77%). Government or legal mandates are the next most common reason for international institutions (50%), and preservation of the heritage or culture of local peoples and departments targeting outreach to underserved audiences are tied for the third most common reason (20%).
Figure 2: Motivations for Multilingual Support, n= 78 U.S. and 30 International
44
31
5
23
13
19
33
6
15
5 6 6
0
5
10
15
20
25
30
35
40
45
50
U.S.
International

12
Languages Offered
Science centers and museums offer visitors various forms of interpretation, including exhibit labels, programs and events, informational signage, and much more. Respondents were asked to list up to eight languages offered in exhibit labels, programs, signage, or other interpretive devices. Nearly all respondents indicated that information in English is available to visitors in their institutions, regardless of geography. Of the U.S. institutions that provide information in languages other than English, the most common second language offered is Spanish. Information in English is readily available according to international respondents (97%), with French (38%) and Chinese (22%) as the second and third most popular languages.
Other languages less frequently cited, but also offered by responding institutions include: Korean, Japanese, Hmong, Russian, Polish, Finnish, and Navajo.
Figure 3a: Most Common Languages Offered, n=114 U.S.
Respondents International Respondents
N=
English 82 31 113
Spanish 76 2 78
French 6 12 18
Braille 14 0 14
Chinese 5 7 12
Italian 4 1 5
German 3 1 4
ASL 3 0 3
Other 13 18 34

13
Experience with Multilingual Support
Overall, international institutions indicate longer experience in offering multilingual interpretation than U.S. institutions, with the majority of international respondents reporting more than a decade of experience in this area compared with less than one-third of U.S. respondents.
Figure 4c: Length of Time Multilingual Interpretation Offered by Budget Size, n=108
<$1 million $1-3 million $3-5 million > $5 million N=
0-2 years 6 0 2 12 14
3-5 years 10 6 9 9 34
6-9 years 4 0 4 10 18
10+ years 8 4 5 22 39
NR
14
29
12
23
0
5
10
15
20
25
30
35
Number of U.S. Respondents
0-2 Years
3-5 years
6-9 Years
10+ Years
Figure 4a: Experience Offering Multilingual Support- U.S. Respondents, n=78
3
5 6
16
0
2
4
6
8
10
12
14
16
18
Number of International Respondents
0-2 Years
3-5 Years
6-9 Years
10+ Years
Figure 4b: Experience Offering Multilingual Support- International Respondents, n=30
14
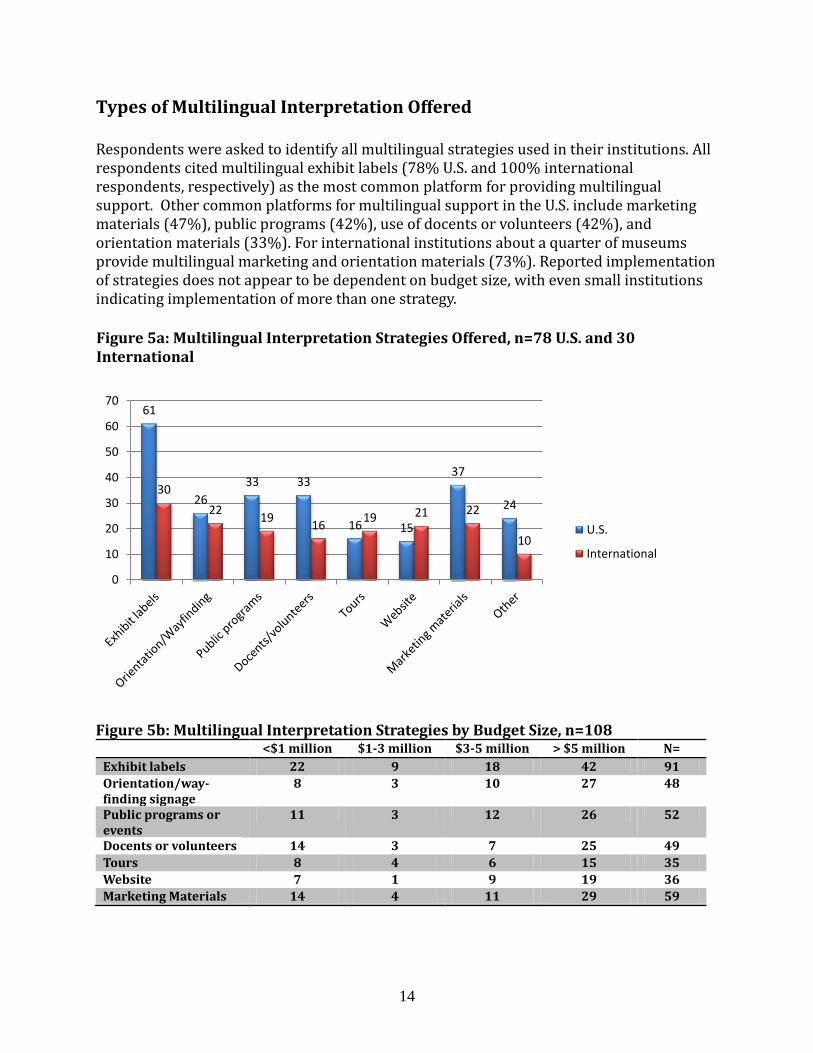
Types of Multilingual Interpretation Offered
Respondents were asked to identify all multilingual strategies used in their institutions. All respondents cited multilingual exhibit labels (78% U.S. and 100% international respondents, respectively) as the most common platform for providing multilingual support. Other common platforms for multilingual support in the U.S. include marketing materials (47%), public programs (42%), use of docents or volunteers (42%), and orientation materials (33%). For international institutions about a quarter of museums provide multilingual marketing and orientation materials (73%). Reported implementation of strategies does not appear to be dependent on budget size, with even small institutions indicating implementation of more than one strategy.
Figure 5b: Multilingual Interpretation Strategies by Budget Size, n=108 <$1 million $1-3 million $3-5 million > $5 million N=
Exhibit labels 22 9 18 42 91
Orientation/way-finding signage
8 3 10 27 48
Public programs or events
11 3 12 26 52
Docents or volunteers 14 3 7 25 49
Tours 8 4 6 15 35
Website 7 1 9 19 36
Marketing Materials 14 4 11 29 59
61
26
33 33
16 15
37
24 30
22 19
16 19 21 22
10
0
10
20
30
40
50
60
70
U.S.
International
Figure 5a: Multilingual Interpretation Strategies Offered, n=78 U.S. and 30 International

15
Opportunities to Interact with Multilingual Staff or Speakers
U.S. and international institutions offer various opportunities to interact with multilingual staff or speakers. Both U.S. and international respondents indicated that they mostly offer multilingual docents, volunteers, explainers, or demonstrators for visitors to interact with multilingual speakers (74% and 83%, respectively). The next most common opportunities offered by U.S. institutions are multilingual speakers or special events (28%), followed by multilingual lectures or classes (25%). For international institutions, multilingual speakers or special events and multilingual lectures or classes tied for second most offered interaction with multilingual staff or speakers (52%).
Figure 6a: Multilingual Staff Opportunities n=69 U.S. and 29 International
Despite prior predictions, budget size did not appear to drastically affect the number of types of opportunities offered by U.S. and international institutions. The most offered opportunity by U.S. and international institutions is bi- or multilingual docents, volunteers, explainers, or demonstrators.
51
19 17
10 11 14
24
15 15 12 12
2
0
10
20
30
40
50
60
Multilingual docents
Multilingual speakers or
special events
Multilingual lectures or
classes
Multilingual programs
Do not offer Other
U.S.
International

16
Figure 6b: Interactions with Multilingual Staff or Speakers by Budget Size- U.S. Respondents
<$1 million $1-3 million $3-5 million > $5 million N=
Bi- or multilingual docents, volunteers, explainers, or demonstrators
13 4 7 27 51
Bi- or multilingual speakers or special events
7 1 3 8 19
Bi- or multilingual lectures or classes
4 1 7 5 17
Bi- or multilingual ongoing or repeating programs
4 0 3 3 10
Other 3 0 1 10 14
Do not offer bi- or multilingual opportunities
4 1 4 2 11
Figure 6c: Interactions with Multilingual Staff or Speakers by Budget Size- International Respondents
<$1 million $1-3 million $3-5 million > $5 million N=
Bi- or multilingual docents, volunteers, explainers, or demonstrators
5 1 6 11 23
Bi- or multilingual speakers or special events
4 2 5 4 15
Bi- or multilingual lectures or classes
5 0 5 5 15
Bi- or multilingual ongoing or repeating programs
4 0 4 4 12
Other 0 1 1 0 2
Do not offer bi- or multilingual opportunities
0 0 0 3 3

17
Research and Evaluation of Multilingual Interpretation Strategies
Among institutions that do implement multilingual interpretation strategies, most (73%) do not formally evaluate or perform research on these strategies. Of strategies that are evaluated, the most commonly evaluated strategies are exhibit labels (18%), public programs (11%), and marketing materials (8%). Similarly, a large portion of international institutions (67%) do not evaluate their multilingual offerings. Of the international institutions that do evaluate their multilingual strategies, most evaluate exhibit labels (27%), public programs (23%), and marketing materials (23%). It is notable that budget does seem to affect whether or not institutions evaluate or research multilingual interpretation in their institutions, but budget is not a certain predictor of evaluation ability.
Figure 7a: Evaluation of Multilingual Interpretation Strategies, n=101 <$1 million $1-3 million $3-5 million > $5 million N=
No evaluation 25 6 14 27 72
Exhibit labels 2 2 1 16 21
Orientation/wayfinding signage
1 0 1 8 10
Public programs or events 2 0 3 10 15
Docents or volunteers 0 0 0 5 5
Tours 0 1 1 3 5
Website 1 1 2 2 6
Marketing Materials 2 2 2 7 13
52
13
4 8
2 1 0
6 8
20
8 6 7
3 4 6 7
3
0
10
20
30
40
50
60
U.S.
International
Figure 7b: Research or Evaluation Conducted by Strategy, n=71 U.S. and 30 International

18
Development of Materials
When discussing the development of materials, about two thirds of U.S. institutions (67%), report that they develop multilingual information by translating materials from English (in a variety of ways). A smaller percentage of institutions (22%) reported developing materials in English and a second language concurrently.
U.S. institutions use a variety of methods and individuals to develop and/or translate multilingual materials. Often, U.S. institutions utilize multiple methods in their development process. The most commonly used strategies include in-house paid staff members; outside translation services or agencies; and public figures and groups, including community leaders, professors, and language or cultural groups.
Figure 8a: Development of Multilingual Materials by Budget- U.S. Institutions
<$1 million $1-3 million $3-5 million > $5 million N=
In-house paid staff members
8 1 8 11 28
Outside translation services or agencies
4 5 1 12 22
Public figures and groups 4 2 1 4 11
Unpaid institution volunteers
4 0 1 1 6
Materials come translated 0 0 0 2 2
Advisory groups or task forces made of native speakers
2 0 0 4 6
Other 0 0 1 0 1
A larger percent of international institutions (90%) develop multilingual information by translating materials from a primary language than U.S. institutions. Additionally, a smaller percent of international institutions develop materials in two (or more) languages concurrently (14%). International institutions also report using fewer types of individuals to develop and/or translate materials. The primary strategies identified by international respondents are use of outside translation services or agencies, or in-house paid staff.
Figure 8b: Development of Multilingual Materials by Budget Size- International Institutions
<$1 million $1-3 million $3-5 million > $5 million N=
Outside translation service or agencies
2 2 4 9 17
In-house paid staff members
5 1 2 6 14
Materials come translated 1 0 0 1 2

19
Multilingual Exhibit Labels

20
Representation of Multiple Languages in Multilingual Exhibit Labels Of respondents that offer multilingual labels, the majority indicate that the most common exhibit label format used provides complete text in all languages on identical mounted labels, in both U.S. (50%) and international institutions (77%).
33
11
5 6
3
7
0
5
10
15
20
25
30
35
Number of Institutions
Complete text in all languages on identical labels
Primary language and shortened non-primary language on labels
Primary language on label, other languages in other format
Some or all text in handouts or booklets
Some or all text on computers or monitors
Other
22
2 1
0
3
1
0
5
10
15
20
25
Number of Institutions
Complete text in all languages on identical labels
Primary language and shortened non-primary language on labels
Primary language on label, other languages in other format
Some or all text in handouts or booklets
Some or all text on computers or monitors
Other
Figure 9a: Multilingual Exhibit Labels- U.S. Institutions, n=65
Figure 9b: Multilingual Exhibit Labels-International Institutions, n=29
21
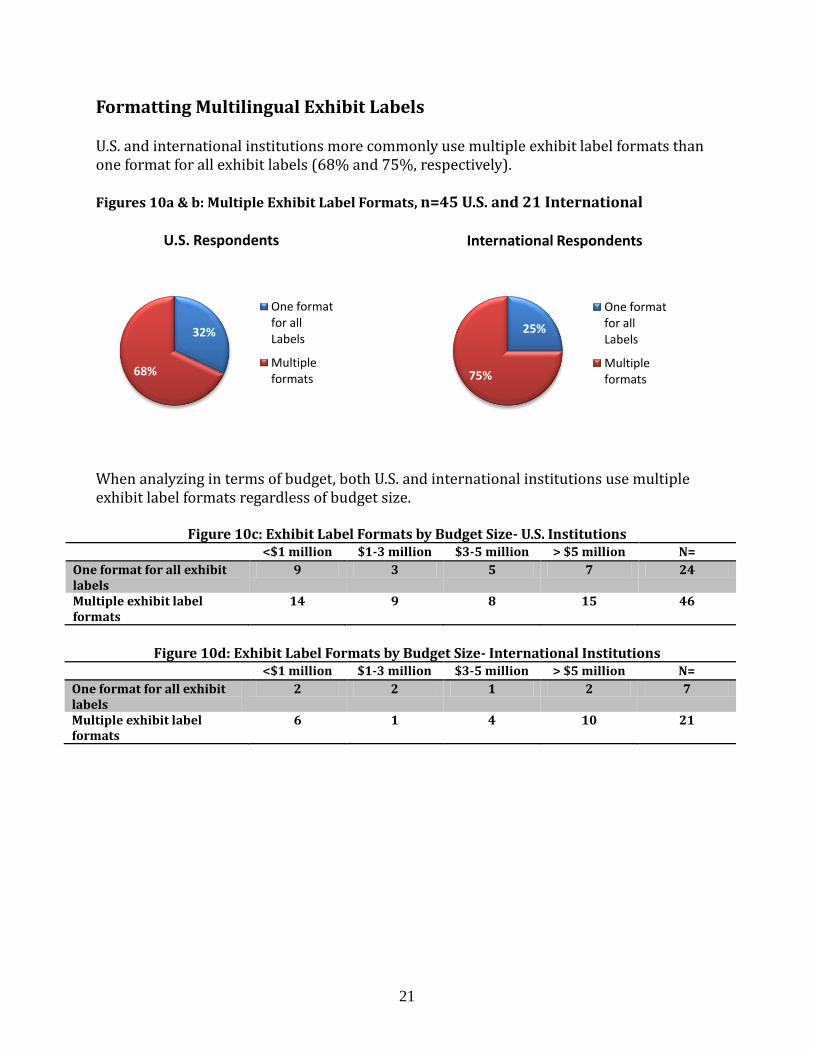
Formatting Multilingual Exhibit Labels U.S. and international institutions more commonly use multiple exhibit label formats than one format for all exhibit labels (68% and 75%, respectively). Figures 10a & b: Multiple Exhibit Label Formats, n=45 U.S. and 21 International
When analyzing in terms of budget, both U.S. and international institutions use multiple exhibit label formats regardless of budget size.
Figure 10c: Exhibit Label Formats by Budget Size- U.S. Institutions <$1 million $1-3 million $3-5 million > $5 million N=
One format for all exhibit labels
9 3 5 7 24
Multiple exhibit label formats
14 9 8 15 46
Figure 10d: Exhibit Label Formats by Budget Size- International Institutions <$1 million $1-3 million $3-5 million > $5 million N=
One format for all exhibit labels
2 2 1 2 7
Multiple exhibit label formats
6 1 4 10 21
32%
68%
U.S. Respondents
One format for all Labels
Multiple formats
25%
75%
International Respondents
One format for all Labels
Multiple formats

22
For respondents indicating use of multiple exhibit label formats, a variety of formats are used across budget size.
Figure 11a: Multiple Exhibit Label Formats by Budget Size- U.S. Institutions <$1 million $1-3 million $3-5 million > $5 million N=
Complete text in all languages on identical mounts
7 2 6 16 31
Primary language text and shortened non-primary text on mounted labels
5 3 3 6 17
Primary language text on mounted label, other languages in another format (laminated card, handout, etc.)
3 3 0 2 8
Some or all text on computer screens or monitors
0 1 3 6 10
Audio exhibit labels 1 1 1 5 8
Some or all text in handouts or booklets
5 3 2 9 19
Use only one format 1 0 0 1 2
Other 3 0 2 4 9
Figure 11b: Multiple Exhibit Label Formats by Budget Size- International Institutions
<$1 million $1-3 million $3-5 million > $5 million N=
Complete text in all languages on identical mounts
0 1 1 3 5
Primary language text and shortened non-primary text on mounted labels
0 1 1 3 5
Primary language text on mounted label, other languages in another format (laminated card, handout, etc.)
0 0 1 2 3
Some or all text on computer screens or monitors
1 0 1 6 8
Audio exhibit labels 2 0 1 1 4
Some or all text in handouts or booklets
1 0 1 3 5
Use only one format 0 0 0 1 1
Other 0 0 0 0 0
23
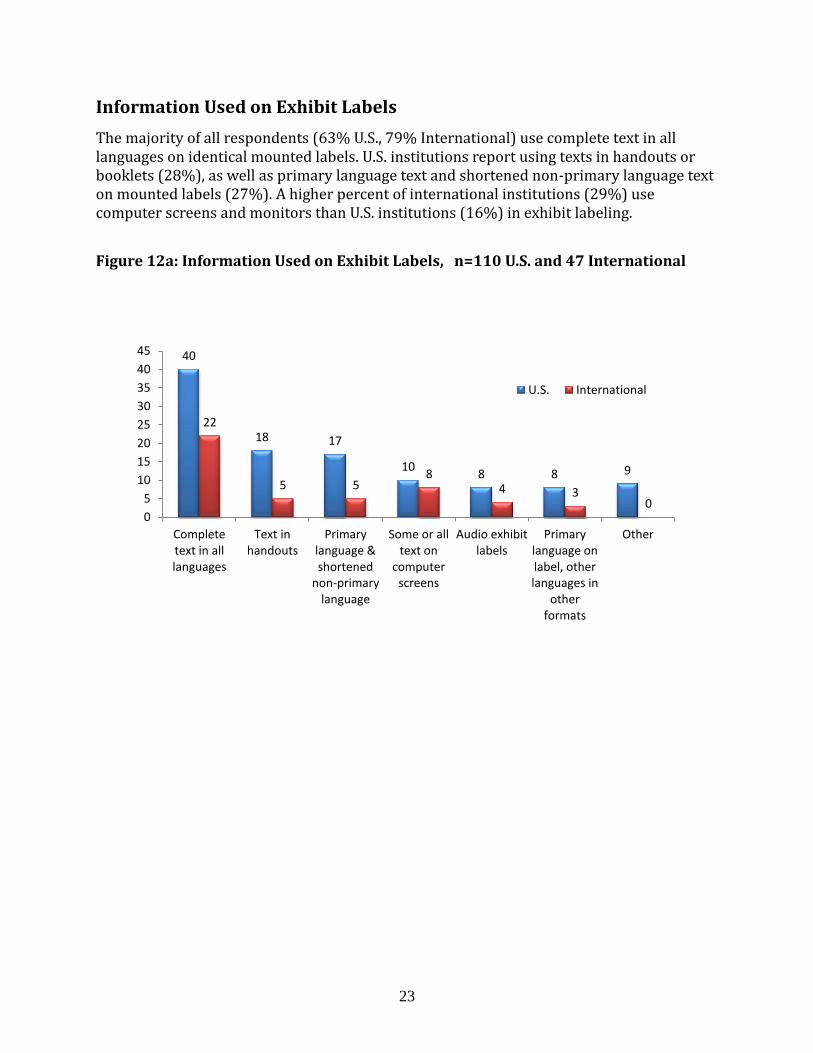
Information Used on Exhibit Labels
The majority of all respondents (63% U.S., 79% International) use complete text in all languages on identical mounted labels. U.S. institutions report using texts in handouts or booklets (28%), as well as primary language text and shortened non-primary language text on mounted labels (27%). A higher percent of international institutions (29%) use computer screens and monitors than U.S. institutions (16%) in exhibit labeling.
Figure 12a: Information Used on Exhibit Labels, n=110 U.S. and 47 International
40
18 17
10 8 8 9
22
5 5 8
4 3 0
0
5
10
15
20
25
30
35
40
45
Complete text in all languages
Text in handouts
Primary language & shortened
non-primary language
Some or all text on
computer screens
Audio exhibit labels
Primary language on label, other languages in
other formats
Other
U.S. International

24
Top Challenges in Developing and Translating Multilingual Labels
The most common challenge identified by respondents in developing and translating exhibit labels is finding and identifying sufficient monetary and staff resources for developing and implementing multilingual labels (70%). Creating effective and appropriate translations is the second biggest challenge for both U.S. and international respondents (33% and 54%, respectively). For U.S. respondents, making multilingual labels a priority, or establishing buy-in from the rest of the institution or department, is the third biggest challenge (25%), while ensuring effective label design is the third biggest challenge for international respondents (43%).
Figure 13a: Top Challenges in Developing and Translating Multilingual Labels, n= 109 U.S. and 50 International
43
20
14 15
8 5 4
20
15 12
0 1 0 2
0
5
10
15
20
25
30
35
40
45
50
U.S.
International

25
Institutional Practices

26
Departments that Develop and Implement Multilingual Strategies
Education and exhibits departments play a pivotal role in the development and implementation of multilingual information in both U.S. and international institutions, with the education department (71%) being most generally used by U.S. institutions and the exhibits department (76%) being most often used by international institutions for multilingual information creation. However, both departments are highly involved in both U.S. and international institutions. Following in third for U.S. institutions is the public programs department (41%), while international institutions' third most involved department is the marketing department (65%). Figure 14a: Departments Involved in Multilingual Interpretation
48 46
28 26
14
7
21 22
16 19
9
5
0
10
20
30
40
50
60
Education Exhibits Public Programs
Marketing Outreach Other
U.S.
International

27
Budget Devotion to Multilingual Information U.S. and international institutions generally spend less than 10% of their department’s budget on developing multilingual information for visitors. A larger portion of U.S. institutions (29%) do not devote any of their budget towards multilingual information than international institutions (7%). More international institutions (18%) set aside at least 10%-20% of their budget towards the development of multilingual information than U.S. institutions (3%).
Figure 15c: Percent of Annual Budget Devoted to Multilingual Information by Budget Size- U.S. Respondents
<$1 million $1-3 million $3-5 million > $5 million N=
Less than 10% 10 4 9 21 44
10% - 20% 1 0 0 1 2
20% - 30% 0 0 0 1 1
None 6 3 2 8 19
Figure 15d: Percent of Annual Budget Devoted to Multilingual Information by Budget Size- International Respondents
<$1 million $1-3 million $3-5 million > $5 million N=
Less than 10% 3 3 5 10 21
30% - 40% 1 0 0 0 1
40% - 50% 0 0 0 1 1
None 1 0 0 1 2
67% 3%
1%
29%
U.S.
< 10%
10-20%
20-30%
NA
Figures 15a & b: Percentage of Annual Budget Devoted to Multilingual Interpretation
75%
18%
0% 7%
International
< 10%
10-20%
20-30%
NA

28
Feedback from Local Community Members
Half of international institutions surveyed obtain feedback from members of the community (50%), but less than half of U.S. institutions obtain feedback (42%). Of these institutions that obtain feedback from members of their local communities, they obtain it in various ways: o Surveys o Focus groups o Visitor feedback through cards or comments o Advisory groups o Members of the public

29
Institutional Strategic Planning Developing bi- or multilingual interpretation is part of institutional thinking for the large majority of U.S. institutions (73%). A larger percentage of international institutions focus on having multilingual interpretation as part of their institutional thinking (93%), than U.S. institutions.
30
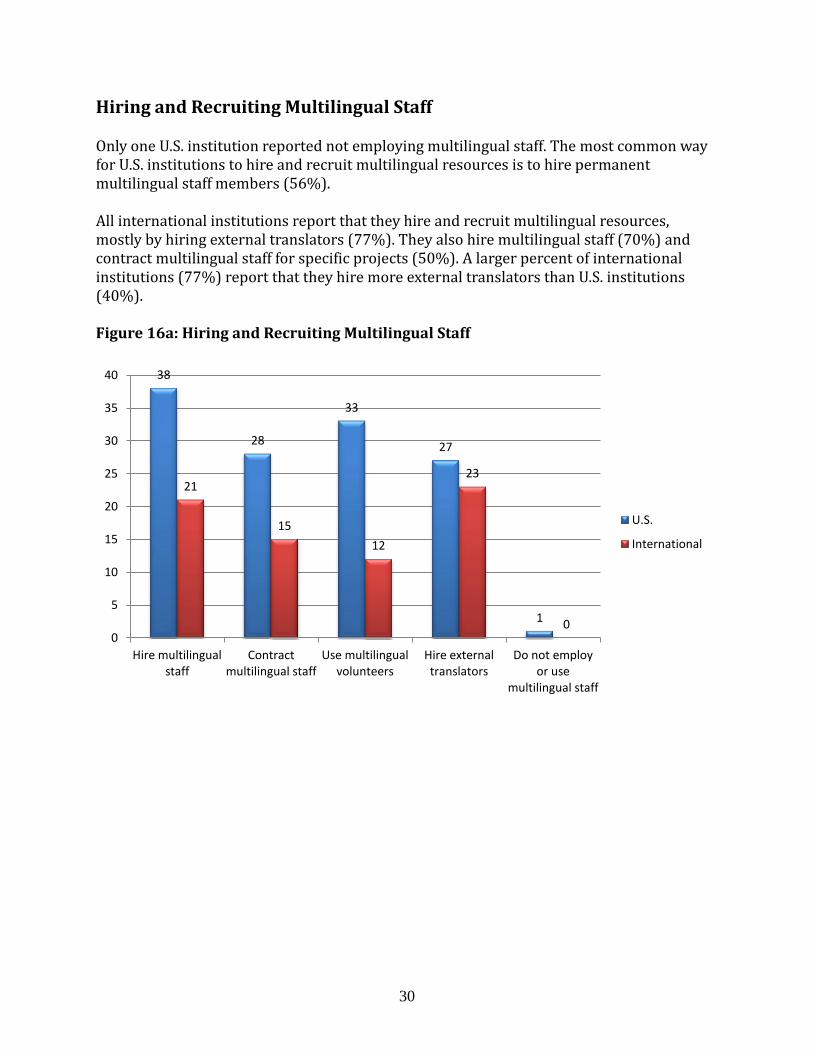
Hiring and Recruiting Multilingual Staff Only one U.S. institution reported not employing multilingual staff. The most common way for U.S. institutions to hire and recruit multilingual resources is to hire permanent multilingual staff members (56%). All international institutions report that they hire and recruit multilingual resources, mostly by hiring external translators (77%). They also hire multilingual staff (70%) and contract multilingual staff for specific projects (50%). A larger percent of international institutions (77%) report that they hire more external translators than U.S. institutions (40%).
Figure 16a: Hiring and Recruiting Multilingual Staff
38
28
33
27
1
21
15
12
23
0 0
5
10
15
20
25
30
35
40
Hire multilingual staff
Contract multilingual staff
Use multilingual volunteers
Hire external translators
Do not employ or use
multilingual staff
U.S.
International
31
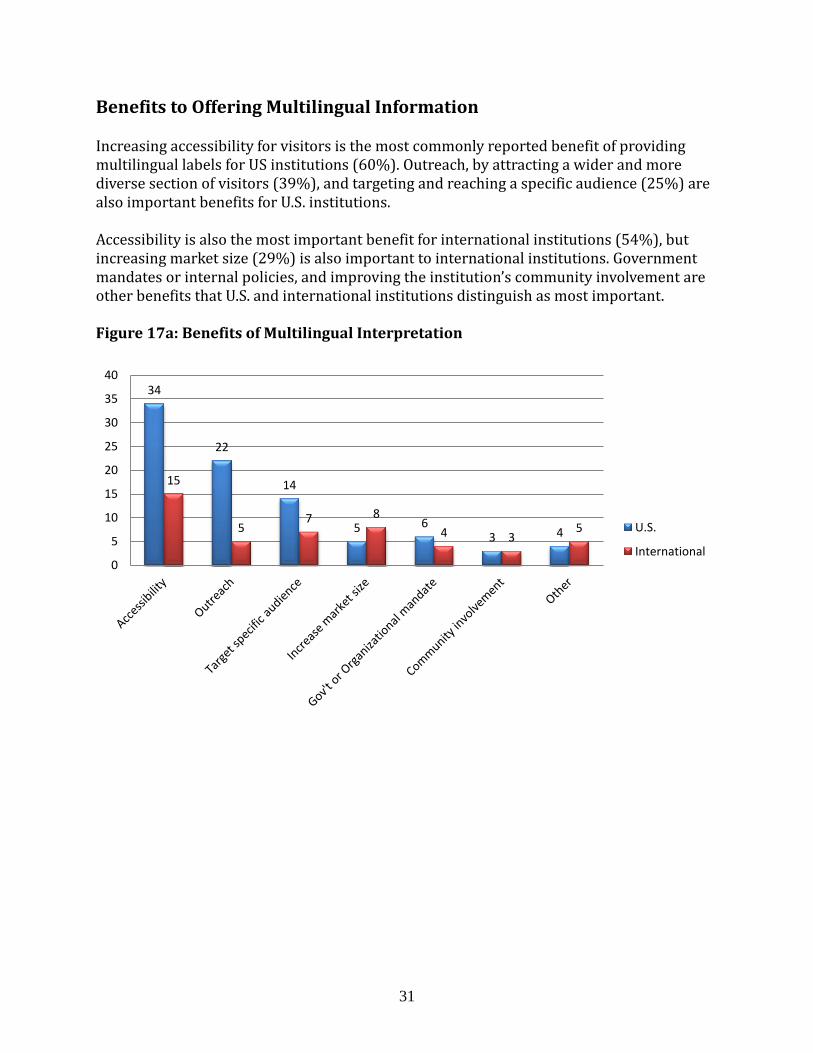
Benefits to Offering Multilingual Information Increasing accessibility for visitors is the most commonly reported benefit of providing multilingual labels for US institutions (60%). Outreach, by attracting a wider and more diverse section of visitors (39%), and targeting and reaching a specific audience (25%) are also important benefits for U.S. institutions. Accessibility is also the most important benefit for international institutions (54%), but increasing market size (29%) is also important to international institutions. Government mandates or internal policies, and improving the institution’s community involvement are other benefits that U.S. and international institutions distinguish as most important. Figure 17a: Benefits of Multilingual Interpretation
34
22
14
5 6 3 4
15
5 7 8
4 3 5
0
5
10
15
20
25
30
35
40
U.S.
International
32
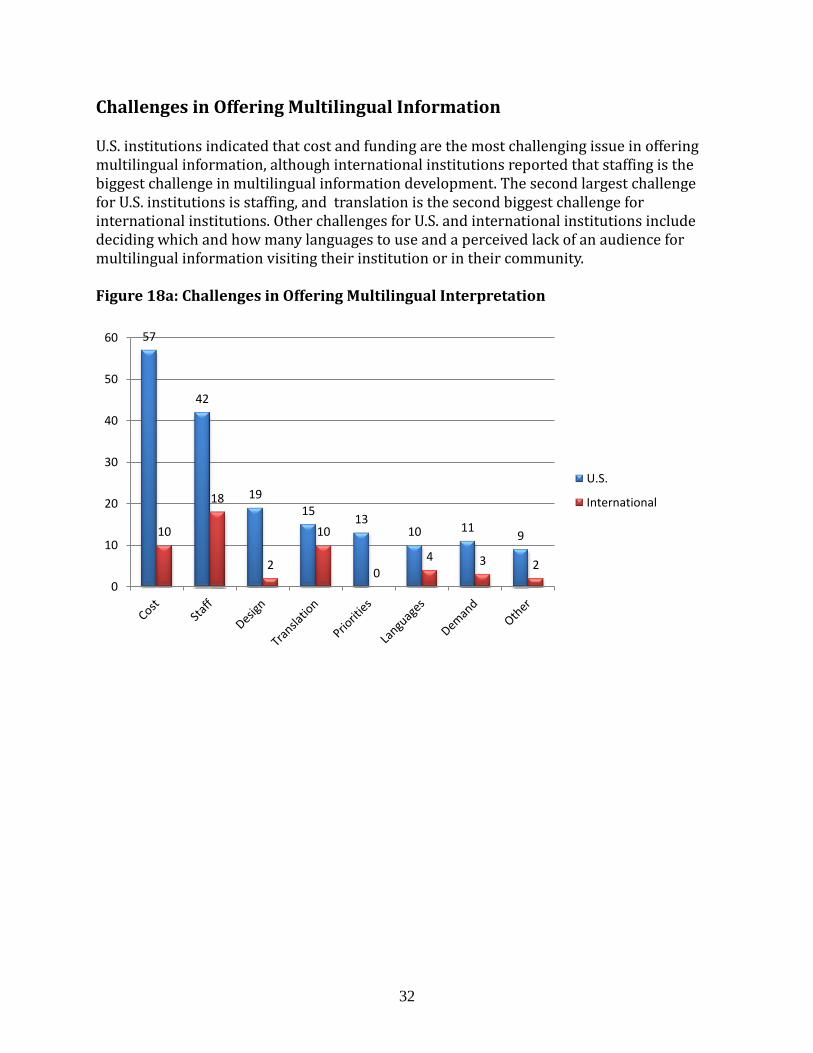
Challenges in Offering Multilingual Information U.S. institutions indicated that cost and funding are the most challenging issue in offering multilingual information, although international institutions reported that staffing is the biggest challenge in multilingual information development. The second largest challenge for U.S. institutions is staffing, and translation is the second biggest challenge for international institutions. Other challenges for U.S. and international institutions include deciding which and how many languages to use and a perceived lack of an audience for multilingual information visiting their institution or in their community. Figure 18a: Challenges in Offering Multilingual Interpretation
57
42
19
15 13
10 11 9 10
18
2
10
0
4 3 2
0
10
20
30
40
50
60
U.S.
International

33
APPENDICES

34
APPENDIX A- Participating Institutions (U.S. & International) A.C. Gilbert's Discovery Village Adler Planetarium Adventure Science Center Anniston Museum of Natural History Arizona Science Center Austin Children's Museum Bell Museum of Natural History Bermuda Underwater Exploration Institute (BUEI) Birch Aquarium at Scripps Bishop Museum Bloomfield Science Museum Jerusalem BNL Science Learning Center Boonshoft Museum of Discovery Bruce Museum California Academy of Sciences California Science Center Canadian Museum of Nature Carnegie Science Center Centro de Ciencias EXPLORA Charlotte County Historical Center Children's Discovery Museum of San Jose Children's Museum of Houston Clay Center for the Arts and Sciences of West Virginia Coastal Discovery Museum Connecticut Science Center COSI Da Vinci Discovery Center of Science and Technology Dallas Museum of Nature & Science Delaware Museum of Natural History Denver Museum of Nature & Science Discovery Place, Inc. Discovery Science Center Discovery World at Pier Wisconsin EdVenture Children's Museum Emerald Coast Science Center Exhibit Museum of Natural History Explora EXPLORA, Centro de Ciencias y Arte Exploratorium Explorit Science Center Fernbank Science Center Four Corners School of Outdoor Education Friends of the WNC Nature Center Glasgow Science Centre Guangdong Science Center Gujarat Council of Science City Gulf Coast Exploreum Science Center

35
Hands On! Regional Museum Heureka, the Finnish Science Centre Huntington Botanical Gardens Impression 5 Science Center Insights El Paso Science Museum International Wildlife Museum Kingman Museum Kopernik Observatory & Science Education Center Lakeview Museum of Arts and Sciences Las Cruces Museum of Natural History Lawrence Hall of Science Liberty Science Center Life Science Centre Loggerhead Marinelife Center Long Island Children's Museum Louisiana Art and Science Museum Louisville Science Center Macao Science Center Madison Children's Museum Maryland Science Center Mayborn Planetarium & Space Theater McAuliffe-Shepard Discovery Center McDonald Observatory Visitor's Center Miami Science Museum Montréal Science Centre Morehead Planetarium and Science Center Museo Tridentino di Scienze Naturali Museum of Discovery & Science, Inc. Museum of Life and Science Museum of Nature & Science Museum of Science & History of Jacksonville, Inc. Museum of Science and Industry Museum of the Earth at the Paleontological Research Institution National Ag Science Center National Center for Atmospheric Research/UCAR National Science Museum Project of Yemen National Watch & Clock Museum New Mexico Museum of Natural History and Science New York Hall of Science NOESIS - Thessaloniki Science Center & Technology Museum North Carolina Museum of Natural Sciences North Museum of Natural History and Science Omaha Children's Museum Ontario Science Centre Oregon Museum of Science and Industry Orlando Science Center Pacific Science Center Petrosains, The Discovery Centre Phaeno Pusat Peragaan Iptek - Science & Technology Center of Indonesia

36
QUESTACON, The National Science and Technology Centre Reuben H. Fleet Science Center Rochester Museum & Science Center Santa Barbara Museum of Natural History Saskatchewan Science Centre, Inc. Science Centre Singapore Science Discovery Museum Science East Science Museum of Minnesota Science Museum of Virginia Science North Science Projects Science Spectrum Science Timmins Science World British Columbia Sciencenter Sci-Port: Louisiana's Science Center SciWorks, The Science Center and Environmental Park of Forsyth County Shanghai Science & Technology Museum Sol del Niño, Science and Technology Center South Florida Museum and Bishop Planetarium Spartanburg Science Center Staten Island Children's Museum Techniquest Technopolis, the Flemish Science Centre Tekniska Museet TELUS World of Science - Calgary Thanksgiving Point Institute The Children's Museum of Science and Technology The Discovery Center for Science and Technology The Discovery Science Place The Field Museum of Natural History The Florida Air Museum at Sun 'n Fun The Franklin Institute The Health Adventure, Inc. The Health Museum The National Geographic Museum at Explorers Hall The Palo Alto Junior Museum & Zoo The Rocky Mount Children's Museum & Science Center The Science Center The Works: Ohio Center for History, Art and Technology University of Kansas Natural History Museum Utah Museum of Natural History Virginia Air & Space Center Virginia Discovery Museum Woods Hole Oceanographic Institution

37
APPENDIX B – Survey Instrument, U.S. Version

38

39

40

41

42

43

44

45
APPENDIX C – Survey Instrument, International Version

46

47
48

49

50

51

52
53
List of Figures Figure 1a: Level of Multilingual Support by Budget Size- U.S. Figure 1b: Level of Multilingual Support by Budget Size- International Figure 2: Motivations for Multilingual Support Figure 3a: Most Common Languages Offered Figure 4a: Experience Offering Multilingual Support- U.S. Figure 4b: Experience Offering Multilingual Support- International Figure 4c: Length of Time Offering Multilingual Interpretation Offered by Budget Size Figure 5a: Multilingual Strategies Offered Figure 5b: Multilingual Interpretation Strategies by Budget Size Figure 6a: Opportunities to Interact with Multilingual Staff or Speakers Figure 6b: Interactions with Multilingual Staff or Speakers by Budget Size- U.S. Figure 6c: Interactions with Multilingual Staff or Speakers by Budget Size- International Figure 7a: Evaluation of Multilingual Interpretation Strategies Figure 7b: Multilingual Research or Evaluation Conducted Figure 8a: Development of Multilingual Materials by Budget Size- U.S. Figure 8b: Development of Multilingual Materials by Budget Size- International Figure 9a: Multilingual Exhibit Labels- U.S. Figure 9b: Multilingual Exhibit Labels- International Figure 10a: Multiple Exhibit Label Formats- U.S. Figure 10b: Multiple Exhibit Label Formats- International Figure 10c: Exhibit Label Formats by Budget Size- U.S. Figure 10d: Exhibit Label Formats by Budget Size- International Figure 11a: Multiple Exhibit Label Formats by Budget Size- U.S. Figure 11b: Multiple Exhibit Label Formats by Budget Size- International Figure 12a: Information Used on Exhibit Labels Figure 13a: Top Challenges in Developing and Translating Multilingual Labels Figure 14a: Departments That Develop and Implement Multilingual Information Figure 15a: Percent of Annual Budget Devoted to Multilingual Information- U.S. Figure 15b: Percent of Annual Budget Devoted to Multilingual Information- International Figure 15c: Percent of Annual Budget Devoted to Multilingual Information by Budget Size- U.S. Figure 15d: Percent of Annual Budget Devoted to Multilingual Information by Budget Size- International Figure 16a: Hiring and Recruiting Practices for Multilingual Staff Figure 17a: Benefits to Offering Bi- and Multilingual Information Figure 18a: Challenges in Offering Bi- and Multilingual Information


