Research ArticleMultiphase Calcite Cementation and Fluids Evolution ofa Deeply Buried Carbonate Reservoir in the Upper OrdovicianLianglitag Formation, Tahe Oilfield, Tarim Basin, NW China
Jiaqing Liu,1 Zhong Li,1 Lijuan Cheng,1 and Jiawei Li2
1 Institute of Geology and Geophysics, Chinese Academy of Sciences, Beijing 100029, China2Research Institute of Tsinghua, Pearl River Delta, Guangzhou 510530, China
Oil and gas have been found in the Upper Ordovician Lianglitag Formation carbonates in the Tahe Oilfield, Tarim Basin, NWChina. This study documents the origin of diagenetic fluids by using a combination of petrology, SIMS, fluid inclusion, andradiogenic isotope analysis. Six stages of calcite cements were revealed. C1-C2 formed in marine to early burial environments.C3 has relatively low 𝛿18OVPDB values (−8.45‰ to −6.50‰) and likely has a meteoric origin. Meteoric water probably fluxed intoaquifers during the Early Paleozoic and Late Paleozoic uplift. C4 has 𝛿18OVPDB values typically 3‰ higher than those of C3, andprobably formed during shallow burial. C5 displays relatively negative 𝛿18OVPDB values (−8.26‰ to −5.12‰), and the moderate-to-high fluid-inclusion temperatures imply that it precipitated in burial environments. C6 shows homogenization temperatures (upto 200∘C) higher than the maximum burial and much lower salinities (<10.61 wt% NaCl), which may suggest that the fluid wasdeeply recycled meteoric water. The average 87Sr/86Sr ratios of fracture- and vug-filling calcite cements are much higher, indicativeof incorporation of radiogenic Sr. Caves and fractures constitute the dominant reservoir spaces. A corresponding diagenesis-relatedreservoir evolution model was established that favors exploration and prediction.
1. Introduction
Fluid origin and flow in sedimentary basins have an impor-tant influence on various diagenetic alteration processes,including cementation, dissolution, recrystallization, anddolomitization, which have significant impacts on reser-voir development [1–10]. Thus, constraining the origin andevolution of fluid and fluid flow events is of considerablesignificance for hydrocarbon exploration and reservoir devel-opment. Fluid is not only a component of the fluid-rockinteraction but also a carrier of matter and energy in thefluid-rock interaction. Fluid is an active control factor ofthe fluid-rock interaction system [7, 10, 11]. However, fordeeply buried reservoirs, due to their complicated burial andtectonic history, the fluid chemical composition and flow arevery complicated; therefore, understanding and predictingfluid flow are still challenging.
The Tahe Oilfield, located within the Tabei tectonic blockin the northern part of the basin, is the largest Paleozoic
marine oilfield in China. For the Tahe Oilfield, the currentmain oil-gas production layer is the Middle OrdovicianYijianfang Formation and the EarlyMiddle Ordovician Ying-shan Formation, and considerable previous works have beendone on these layers [12–17]. By contrast, carbonate rocksof the Upper Ordovician Lianglitag Formation are potentialexploration strata, which have received little attention. Thecarbonates of the UpperOrdovician Lianglitag Formation aredeeply buried, with depths> 4500m. Previous studiesmainlyfocused on the biostratigraphy, lithostratigraphy [18–20], andsedimentary environment [21–23]. Lu et al. [24] analyzed themain reservoir characteristics of the Lianglitag Formation:thematrix of the Lianglitag Formation is characterized by lowporosity andpermeability, with strong reservoir heterogeneity.
In situ Secondary IonMass Spectrometry (SIMS) has pro-vided a powerful technique for studying basin fluid activities[25–30]. SIMS can solve the traditional test difficulties; forexample, a small number of samples cannot meet the test
HindawiGeofluidsVolume 2017, Article ID 4813235, 19 pageshttps://doi.org/10.1155/2017/4813235
requirements or the analysis results are often the averagevalue of multiphase fluid mixing. In this paper, for the firsttime, in situ SIMS analysis has been used to characterizedifferent fluids and discriminate their nature in study areas.
This paper takes the carbonate reservoirs of the UpperOrdovician Lianglitag Formation as a typical example andfocuses on the activities of diagenetic fluids as well as theireffects on reservoir development under a complex multistagetectonic setting. This work can provide useful insights intofluid evolution during diagenesis for typical deeply buriedreservoirs. Specifically, we address the following questions:
(1) What are the petrological and geochemical charac-teristics of diagenetic calcites in the Late OrdovicianLianglitag Formation?
(2) What is the nature of the fluids and their impact onthe Lianglitag Formation?
(3) Whatmechanismswere responsible for the formationof the carbonate reservoir of the Lianglitag Formationin the Tahe Oilfield in the Tarim Basin?
(4) What is the model for diagenetic fluid flow andreservoir performance in deeply buried carbonatesuccessions?
2. Geological Background
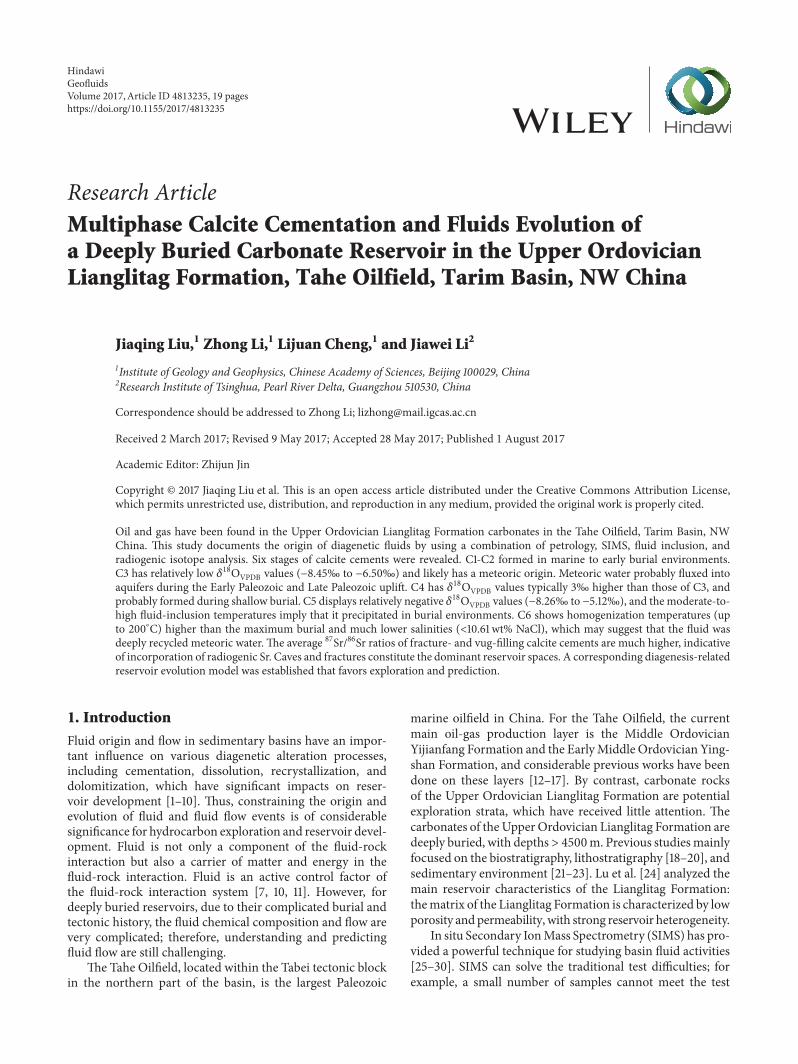
The Tarim Basin, located in southern Xinjiang province,northwestern China, is surrounded by the Tian Shan,Kunlun, and Altyn mountains to the north, southwest,and southeast, respectively (Figure 1(a)). It is a multicyclecomposite basin with continental crust, composed of pre-Sinian basaltic basins, which are formed by prototypicalbasins with different properties in different periods [32,33]. The basin can be divided into seven tectonic units:Kuqa Depression, Tabei Uplift, North Depression (Manjiaer-Awati Depressions), Central Uplift, Southwest Depression,Southeast Uplift, and Southeast Depression [32] (Figure 1(a)).The Tahe Oilfield, covering an area of 2400 km2, is locatedin the Akekule uplift in the eastern part of the Tabei Uplift(Figures 1(a) and 1(b)).
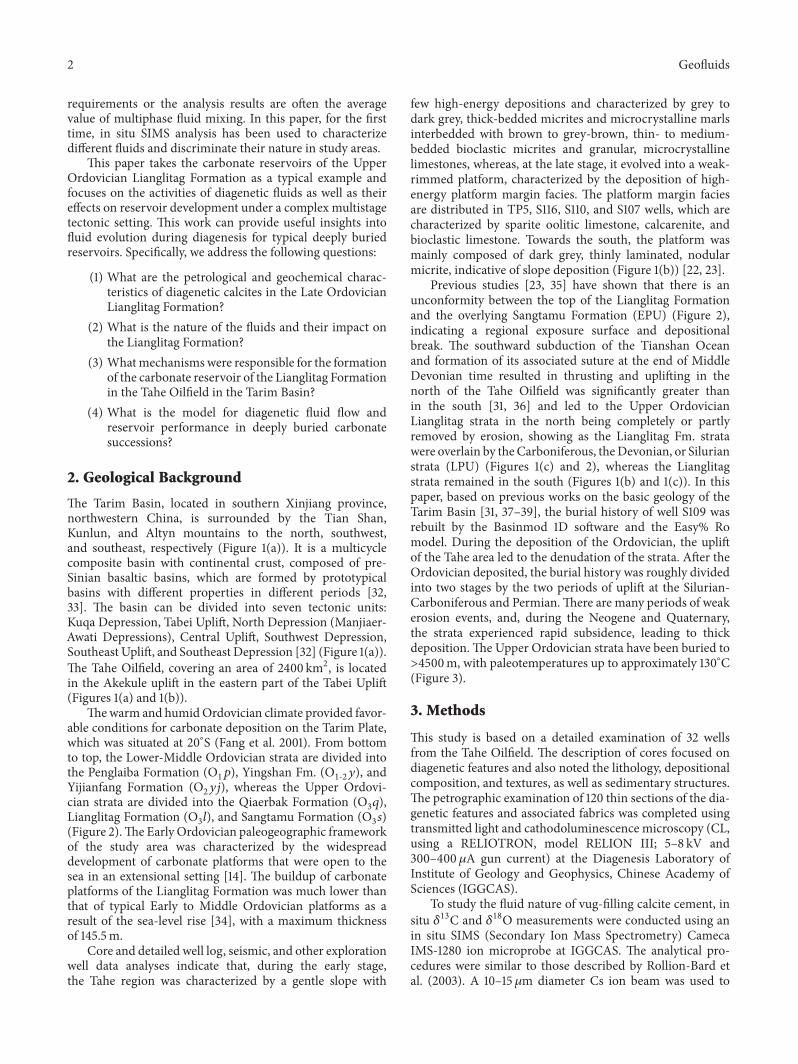
Thewarm and humidOrdovician climate provided favor-able conditions for carbonate deposition on the Tarim Plate,which was situated at 20∘S (Fang et al. 2001). From bottomto top, the Lower-Middle Ordovician strata are divided intothe Penglaiba Formation (O1𝑝), Yingshan Fm. (O1-2𝑦), andYijianfang Formation (O2𝑦𝑗), whereas the Upper Ordovi-cian strata are divided into the Qiaerbak Formation (O3𝑞),Lianglitag Formation (O3𝑙), and Sangtamu Formation (O3𝑠)(Figure 2).The Early Ordovician paleogeographic frameworkof the study area was characterized by the widespreaddevelopment of carbonate platforms that were open to thesea in an extensional setting [14]. The buildup of carbonateplatforms of the Lianglitag Formation was much lower thanthat of typical Early to Middle Ordovician platforms as aresult of the sea-level rise [34], with a maximum thicknessof 145.5m.
Core and detailed well log, seismic, and other explorationwell data analyses indicate that, during the early stage,the Tahe region was characterized by a gentle slope with
few high-energy depositions and characterized by grey todark grey, thick-bedded micrites and microcrystalline marlsinterbedded with brown to grey-brown, thin- to medium-bedded bioclastic micrites and granular, microcrystallinelimestones, whereas, at the late stage, it evolved into a weak-rimmed platform, characterized by the deposition of high-energy platform margin facies. The platform margin faciesare distributed in TP5, S116, S110, and S107 wells, which arecharacterized by sparite oolitic limestone, calcarenite, andbioclastic limestone. Towards the south, the platform wasmainly composed of dark grey, thinly laminated, nodularmicrite, indicative of slope deposition (Figure 1(b)) [22, 23].
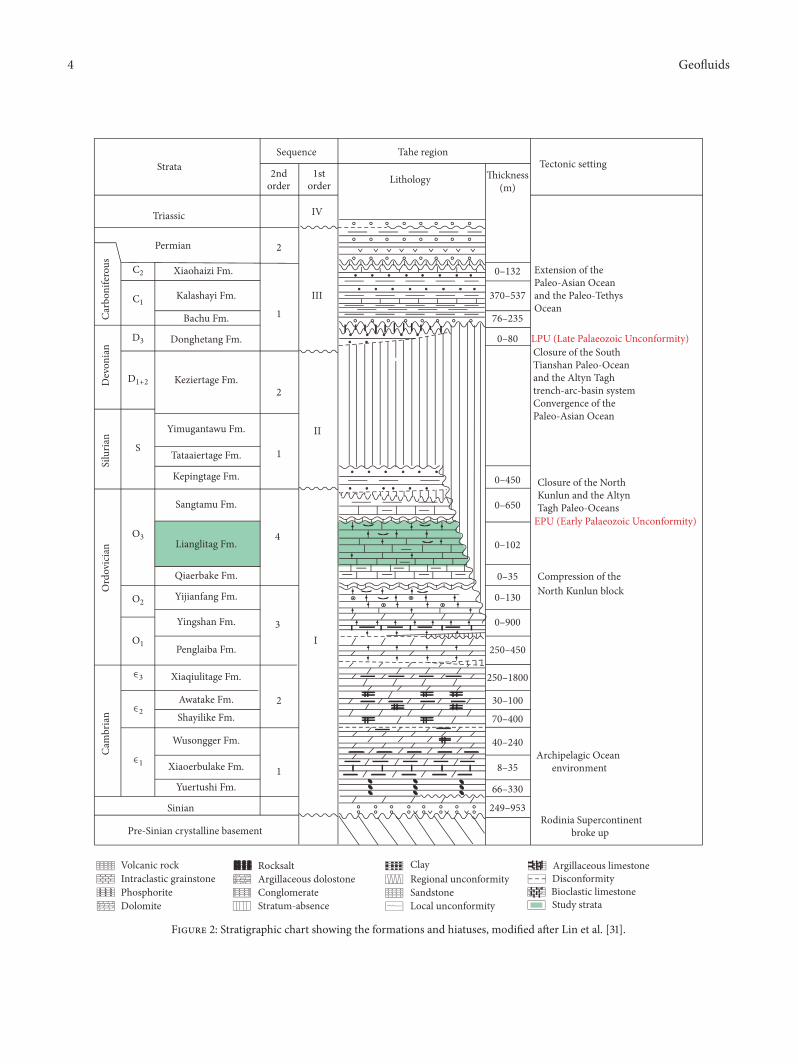
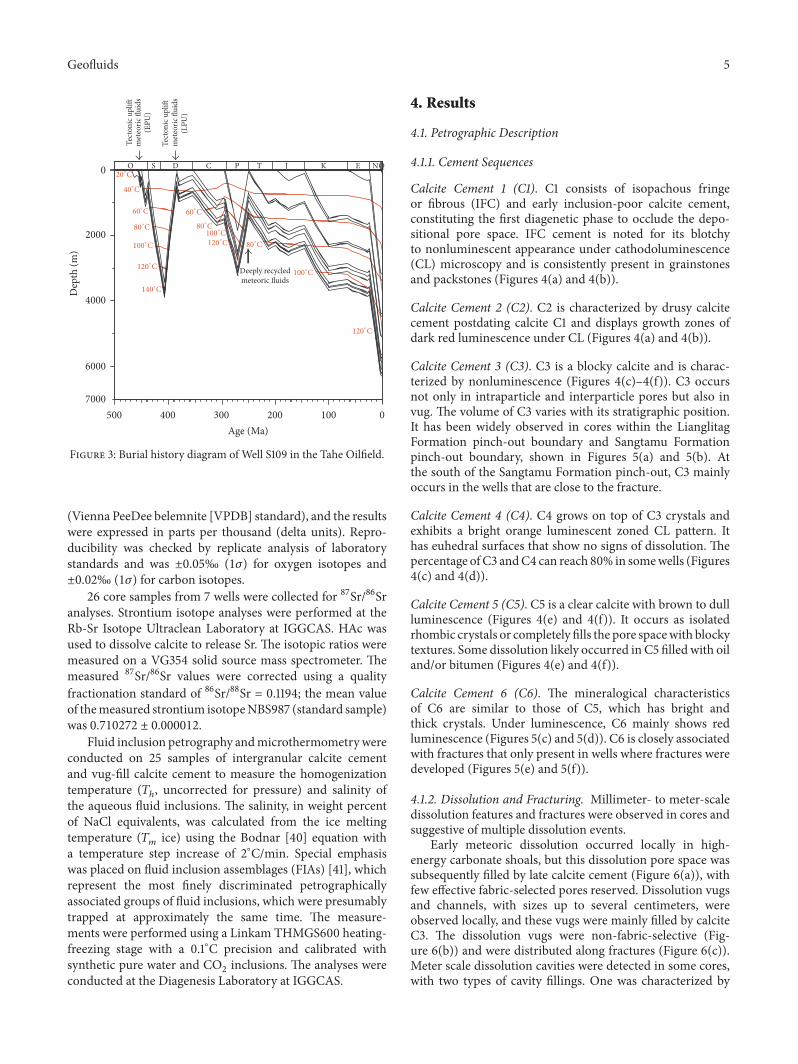
Previous studies [23, 35] have shown that there is anunconformity between the top of the Lianglitag Formationand the overlying Sangtamu Formation (EPU) (Figure 2),indicating a regional exposure surface and depositionalbreak. The southward subduction of the Tianshan Oceanand formation of its associated suture at the end of MiddleDevonian time resulted in thrusting and uplifting in thenorth of the Tahe Oilfield was significantly greater thanin the south [31, 36] and led to the Upper OrdovicianLianglitag strata in the north being completely or partlyremoved by erosion, showing as the Lianglitag Fm. stratawere overlain by theCarboniferous, theDevonian, or Silurianstrata (LPU) (Figures 1(c) and 2), whereas the Lianglitagstrata remained in the south (Figures 1(b) and 1(c)). In thispaper, based on previous works on the basic geology of theTarim Basin [31, 37–39], the burial history of well S109 wasrebuilt by the Basinmod 1D software and the Easy% Romodel. During the deposition of the Ordovician, the upliftof the Tahe area led to the denudation of the strata. After theOrdovician deposited, the burial history was roughly dividedinto two stages by the two periods of uplift at the Silurian-Carboniferous and Permian.There are many periods of weakerosion events, and, during the Neogene and Quaternary,the strata experienced rapid subsidence, leading to thickdeposition.The Upper Ordovician strata have been buried to>4500m, with paleotemperatures up to approximately 130∘C(Figure 3).
3. Methods
This study is based on a detailed examination of 32 wellsfrom the Tahe Oilfield. The description of cores focused ondiagenetic features and also noted the lithology, depositionalcomposition, and textures, as well as sedimentary structures.The petrographic examination of 120 thin sections of the dia-genetic features and associated fabrics was completed usingtransmitted light and cathodoluminescence microscopy (CL,using a RELIOTRON, model RELION III; 5–8 kV and300–400 𝜇A gun current) at the Diagenesis Laboratory ofInstitute of Geology and Geophysics, Chinese Academy ofSciences (IGGCAS).
To study the fluid nature of vug-filling calcite cement, insitu 𝛿13C and 𝛿18O measurements were conducted using anin situ SIMS (Secondary Ion Mass Spectrometry) CamecaIMS-1280 ion microprobe at IGGCAS. The analytical pro-cedures were similar to those described by Rollion-Bard etal. (2003). A 10–15 𝜇m diameter Cs ion beam was used to
Geofluids 3
Sample well siteFaultFlow directionof meteoric water
Study area
Lianglitag Fm. denudation area
Platform margin
Platform interior
Slope
China
0
Kuqa Depression
North Depression
Depression
Depression
Central Uplift Uplift
Uplift
Kunlun
Mountains Mountains
Altyn
Southeast Southeast
Southwest
Tabei
Figure 1(b)
120
Awati DepressionManjiaer Depression
MountainsTianshan
T738
T705
S106
S116
S114
S110S111
S107
T904T913 T914
T79 S72S60
S69S99
T443 T114T204
T751
Lianglitag Fm. pinch-out boundary
Sangtamu Fm.
pinch-out boundary
0
Lunnan
(a)
(b)
(c)
TP5
S112-1
T115
NW S60 S69 S107T115 T904 T914 SET913
50∘N
40∘N
30∘N
20∘N
80∘ E
90∘ E
110∘ E
100∘ E
120∘ E
500 km
12
41∘ 3
0
84∘00
83∘30 84∘00
83∘3041∘ 00
−6500
−6000
−5500
−5000
Dep
th (m
)(km)
(km)
C1b
S1K
O3s
O3lO3qO2yj
O1-2y
Figure 1: Tectonic subdivisions and location of the study areas. (a) Tectonic unit divisions of the Tarim Basin and location of the study areas.(b) Distribution of sample wells in the Tahe study region. (c) Strata profile fromWell S60 to Well S107 (please see the blue line in (b)).
ablate 10–15𝜇mdiameter spots from the sample.The internalprecision for each spot ranged between 0.009 and 0.015 (%Standard Error). The external precision was estimated to be0.4‰ for oxygen and 0.6‰ for carbon as determined byconsecutive analysis of a UWC (international calcite standardfrom University of Wisconsin) standard and OKA (Chineseprimary calcite standard number GBW04481) standard.
44 core samples from 15 wells were collected for con-ventional oxygen and carbon isotope analyses. The samplesanalyzed in this study were whole rocks and fracture- andvug-filling calcite cement. Samples were taken using a dentaldrill. The analyses were carried out at the C-O Isotope Lab-oratory at IGGCAS. The carbon and oxygen isotope compo-sitions were determined using a MAT-251 mass spectrometer
4 Geofluids
EPU (Early Palaeozoic Unconformity)
LPU (Late Palaeozoic Unconformity)
Volcanic rock
Phosphorite
Rocksalt
Conglomerate
Clay
Sandstone Bioclastic limestoneDolomite
Argillaceous dolostone
Stratum-absence
Regional unconformity
Local unconformity
DisconformityArgillaceous limestone
Intraclastic grainstone
Study strata
StrataTahe regionSequence
Tectonic setting
Extension of the Paleo-Asian Ocean and the Paleo-Tethys Ocean
Closure of the South Tianshan Paleo-Ocean and the Altyn Tagh trench-arc-basin systemConvergence of the Paleo-Asian Ocean
Closure of the North Kunlun and the Altyn Tagh Paleo-Oceans
Archipelagic Ocean environment
Rodinia Supercontinentbroke up
Triassic
Permian 2
1
2
1
4
3I
II
III
IV
2
1
Carb
onife
rous
Dev
onia
nSi
luria
nO
rdov
icia
nCa
mbr
ian
S
Xiaohaizi Fm.
Kalashayi Fm.
Bachu Fm.
Donghetang Fm.
Keziertage Fm.
Yimugantawu Fm.
Tataaiertage Fm.
Kepingtage Fm.
Sangtamu Fm.
Lianglitag Fm.
Qiaerbake Fm.
Yijianfang Fm.
Yingshan Fm.
Penglaiba Fm.
Xiaqiulitage Fm.
Awatake Fm.Shayilike Fm.
Wusongger Fm.
Xiaoerbulake Fm.
Yuertushi Fm.
Sinian
Pre-Sinian crystalline basement
Lithology Thickness(m)
370–537
0–132
76–235
0–80
0–450
0–650
0–102
0–35
0–130
0–900
250–450
250–1800
30–100
70–400
40–240
8–35
66–330
249–953
Compression of theNorth Kunlun block
C2
C1
D3
D1+2
O2
O1
O3
∈3
∈2
∈1
1storder
2ndorder
Figure 2: Stratigraphic chart showing the formations and hiatuses, modified after Lin et al. [31].
Geofluids 5D
epth
(m)
Age (Ma)
Tect
onic
upl
ift
Tect
onic
upl
ift
met
eoric
flui
ds(L
PU)
met
eoric
flui
ds(E
PU)
O S D C P T J K E NQ0
2000
4000
6000
7000
0100200300400500
20∘C
40∘C
60∘C 60∘C
80∘C 80∘C
80∘C100∘C100∘C
100∘C120∘C
120∘C
120∘C
140∘C
Deeply recycledmeteoric fluids
Figure 3: Burial history diagram of Well S109 in the Tahe Oilfield.
(Vienna PeeDee belemnite [VPDB] standard), and the resultswere expressed in parts per thousand (delta units). Repro-ducibility was checked by replicate analysis of laboratorystandards and was ±0.05‰ (1𝜎) for oxygen isotopes and±0.02‰ (1𝜎) for carbon isotopes.
26 core samples from 7 wells were collected for 87Sr/86Sranalyses. Strontium isotope analyses were performed at theRb-Sr Isotope Ultraclean Laboratory at IGGCAS. HAc wasused to dissolve calcite to release Sr. The isotopic ratios weremeasured on a VG354 solid source mass spectrometer. Themeasured 87Sr/86Sr values were corrected using a qualityfractionation standard of 86Sr/88Sr = 0.1194; the mean valueof themeasured strontium isotopeNBS987 (standard sample)was 0.710272 ± 0.000012.
Fluid inclusion petrography andmicrothermometrywereconducted on 25 samples of intergranular calcite cementand vug-fill calcite cement to measure the homogenizationtemperature (𝑇ℎ, uncorrected for pressure) and salinity ofthe aqueous fluid inclusions. The salinity, in weight percentof NaCl equivalents, was calculated from the ice meltingtemperature (𝑇𝑚 ice) using the Bodnar [40] equation witha temperature step increase of 2∘C/min. Special emphasiswas placed on fluid inclusion assemblages (FIAs) [41], whichrepresent the most finely discriminated petrographicallyassociated groups of fluid inclusions, which were presumablytrapped at approximately the same time. The measure-ments were performed using a Linkam THMGS600 heating-freezing stage with a 0.1∘C precision and calibrated withsynthetic pure water and CO2 inclusions. The analyses wereconducted at the Diagenesis Laboratory at IGGCAS.
4. Results
4.1. Petrographic Description
4.1.1. Cement Sequences
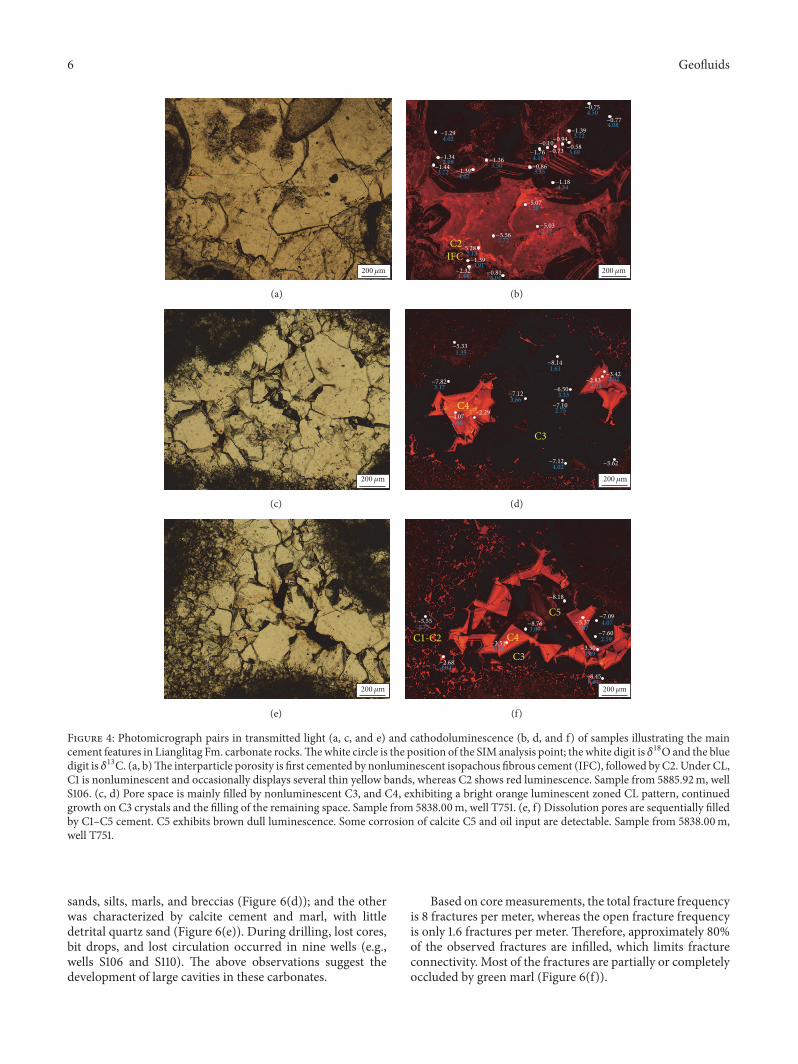
Calcite Cement 1 (C1). C1 consists of isopachous fringeor fibrous (IFC) and early inclusion-poor calcite cement,constituting the first diagenetic phase to occlude the depo-sitional pore space. IFC cement is noted for its blotchyto nonluminescent appearance under cathodoluminescence(CL) microscopy and is consistently present in grainstonesand packstones (Figures 4(a) and 4(b)).
Calcite Cement 2 (C2). C2 is characterized by drusy calcitecement postdating calcite C1 and displays growth zones ofdark red luminescence under CL (Figures 4(a) and 4(b)).
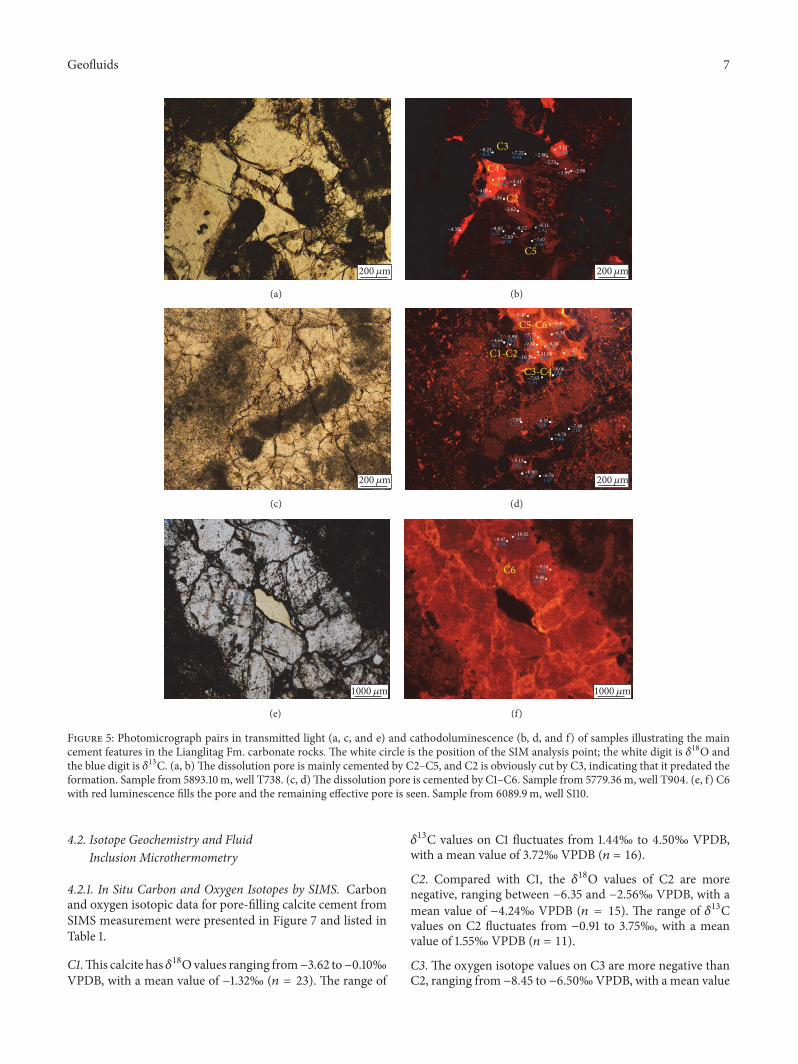
Calcite Cement 3 (C3). C3 is a blocky calcite and is charac-terized by nonluminescence (Figures 4(c)–4(f)). C3 occursnot only in intraparticle and interparticle pores but also invug. The volume of C3 varies with its stratigraphic position.It has been widely observed in cores within the LianglitagFormation pinch-out boundary and Sangtamu Formationpinch-out boundary, shown in Figures 5(a) and 5(b). Atthe south of the Sangtamu Formation pinch-out, C3 mainlyoccurs in the wells that are close to the fracture.
Calcite Cement 4 (C4). C4 grows on top of C3 crystals andexhibits a bright orange luminescent zoned CL pattern. Ithas euhedral surfaces that show no signs of dissolution. Thepercentage ofC3 andC4 can reach 80% in somewells (Figures4(c) and 4(d)).
Calcite Cement 5 (C5). C5 is a clear calcite with brown to dullluminescence (Figures 4(e) and 4(f)). It occurs as isolatedrhombic crystals or completely fills the pore spacewith blockytextures. Some dissolution likely occurred in C5 filled with oiland/or bitumen (Figures 4(e) and 4(f)).
Calcite Cement 6 (C6). The mineralogical characteristicsof C6 are similar to those of C5, which has bright andthick crystals. Under luminescence, C6 mainly shows redluminescence (Figures 5(c) and 5(d)). C6 is closely associatedwith fractures that only present in wells where fractures weredeveloped (Figures 5(e) and 5(f)).
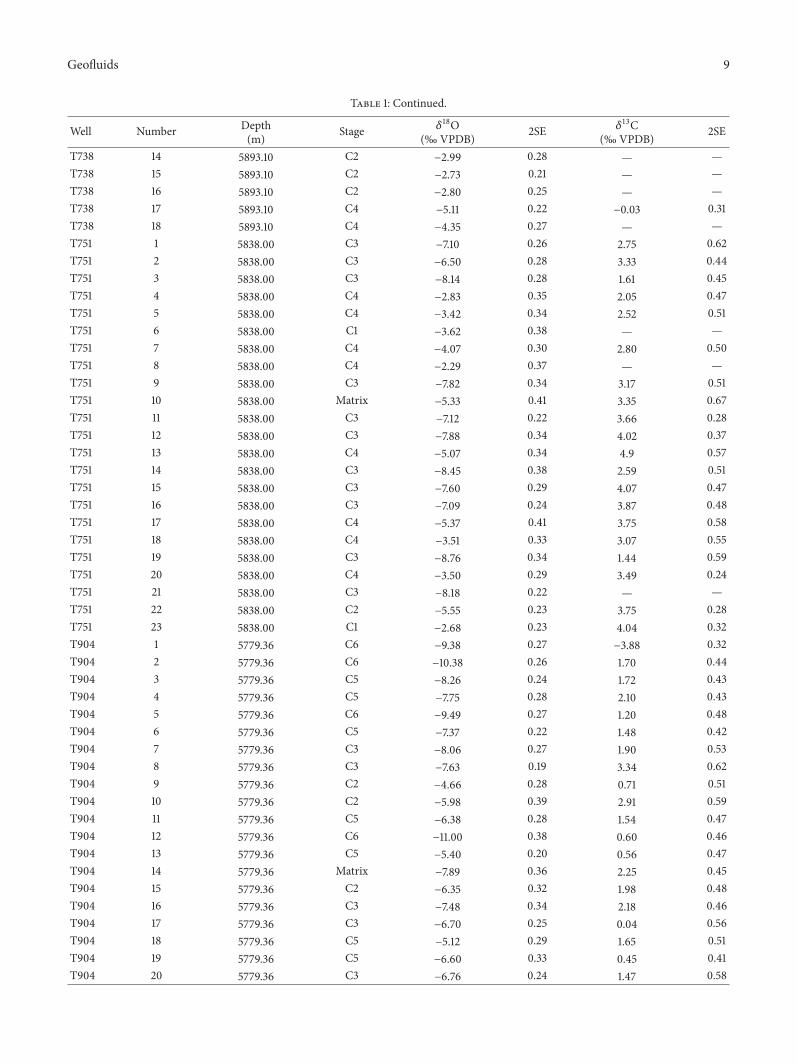
4.1.2. Dissolution and Fracturing. Millimeter- to meter-scaledissolution features and fractures were observed in cores andsuggestive of multiple dissolution events.
Early meteoric dissolution occurred locally in high-energy carbonate shoals, but this dissolution pore space wassubsequently filled by late calcite cement (Figure 6(a)), withfew effective fabric-selected pores reserved. Dissolution vugsand channels, with sizes up to several centimeters, wereobserved locally, and these vugs were mainly filled by calciteC3. The dissolution vugs were non-fabric-selective (Fig-ure 6(b)) and were distributed along fractures (Figure 6(c)).Meter scale dissolution cavities were detected in some cores,with two types of cavity fillings. One was characterized by
6 Geofluids
200 m
(a)
−0.77
−0.75
−1.39
−0.58−1.76
−0.10−0.73
−0.94
−1.18
−1.36−0.86−1.44
−1.34
−1.29
−1.39
−5.03
−5.07
−5.56
−5.28
−1.39
−0.81−2.32
4.08
4.50
3.72
3.694.10
4.34
3.353.50
4.02
1.58
2.472.72
2.13
3.911.44 4.04
3.722.98
4.02
IFCC2
200 m
(b)
200 m
(c)
−8.14
−2.83−3.42
−5.333.35
4.02
1.612.52
−7.10
−6.50−7.12
−7.12 −3.62
−4.07 −2.29
−7.82
2.75
3.173.33
3.66
2.05
2.80
C3
C4
200 m
(d)
200 m
(e)
−3.50
−8.45
−7.60
−7.09−5.37
−8.18
−3.51
−5.55
−2.68
−8.76
3.49
2.59
4.073.87
4.04
3.75 3.07
3.58
1.44
C3
C1-C2 C4
C5
200 m
(f)
Figure 4: Photomicrograph pairs in transmitted light (a, c, and e) and cathodoluminescence (b, d, and f) of samples illustrating the maincement features in Lianglitag Fm. carbonate rocks.Thewhite circle is the position of the SIM analysis point; the white digit is 𝛿18Oand the bluedigit is 𝛿13C. (a, b)The interparticle porosity is first cemented by nonluminescent isopachous fibrous cement (IFC), followed byC2. Under CL,C1 is nonluminescent and occasionally displays several thin yellow bands, whereas C2 shows red luminescence. Sample from 5885.92m, wellS106. (c, d) Pore space is mainly filled by nonluminescent C3, and C4, exhibiting a bright orange luminescent zoned CL pattern, continuedgrowth on C3 crystals and the filling of the remaining space. Sample from 5838.00m, well T751. (e, f) Dissolution pores are sequentially filledby C1–C5 cement. C5 exhibits brown dull luminescence. Some corrosion of calcite C5 and oil input are detectable. Sample from 5838.00m,well T751.
sands, silts, marls, and breccias (Figure 6(d)); and the otherwas characterized by calcite cement and marl, with littledetrital quartz sand (Figure 6(e)). During drilling, lost cores,bit drops, and lost circulation occurred in nine wells (e.g.,wells S106 and S110). The above observations suggest thedevelopment of large cavities in these carbonates.
Based on coremeasurements, the total fracture frequencyis 8 fractures per meter, whereas the open fracture frequencyis only 1.6 fractures per meter. Therefore, approximately 80%of the observed fractures are infilled, which limits fractureconnectivity. Most of the fractures are partially or completelyoccluded by green marl (Figure 6(f)).
Geofluids 7
200 m
(a)
−2.56
−2.62
−8.11−8.02−7.83
−8.12
−7.67
−3.41−4.49
−4.05
−4.35
−8.23 −7.22−5.11
−2.80−2.73
−2.98−2.99
1.57
2.38
−0.10
−0.32
2.30
1.92
−0.03−0.07 0.44
C5
C2
C3
C4
200 m
(b)
200 m
(c)
−8.06
−7.63
−4.66−5.98
−6.38
−11.00
−5.40
−7.89
−10.38
−9.38
−7.75
−9.49
−8.26−7.37
−6.35−7.48
−6.70
−5.12
−6.60 −6.76
1.90
3.34
0.712.91
0.60
1.54
0.56
2.25
−3.88
1.70
1.72
2.10
1.20
1.48
1.982.18
0.04
1.65
0.451.47
C1-C2
C3-C4
C5-C6
200 m
(d)
1000 m
(e)
−9.47−10.02
−9.54
−9.40
−0.34 0.12
0.48
0.57
C6
1000 m
(f)
Figure 5: Photomicrograph pairs in transmitted light (a, c, and e) and cathodoluminescence (b, d, and f) of samples illustrating the maincement features in the Lianglitag Fm. carbonate rocks. The white circle is the position of the SIM analysis point; the white digit is 𝛿18O andthe blue digit is 𝛿13C. (a, b)The dissolution pore is mainly cemented by C2–C5, and C2 is obviously cut by C3, indicating that it predated theformation. Sample from 5893.10m, well T738. (c, d)The dissolution pore is cemented by C1–C6. Sample from 5779.36m, well T904. (e, f) C6with red luminescence fills the pore and the remaining effective pore is seen. Sample from 6089.9m, well S110.
4.2. Isotope Geochemistry and FluidInclusion Microthermometry
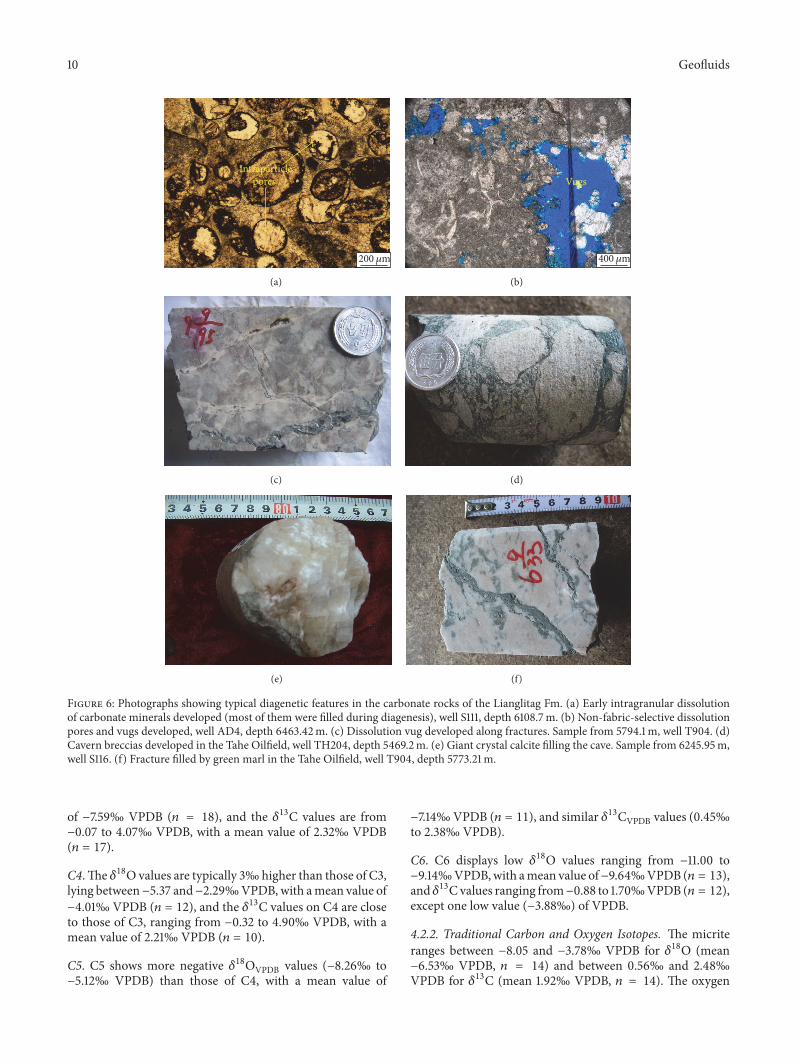
4.2.1. In Situ Carbon and Oxygen Isotopes by SIMS. Carbonand oxygen isotopic data for pore-filling calcite cement fromSIMS measurement were presented in Figure 7 and listed inTable 1.
C1.This calcite has 𝛿18Ovalues ranging from−3.62 to−0.10‰VPDB, with a mean value of −1.32‰ (𝑛 = 23). The range of
𝛿13C values on C1 fluctuates from 1.44‰ to 4.50‰ VPDB,with a mean value of 3.72‰ VPDB (𝑛 = 16).
C2. Compared with C1, the 𝛿18O values of C2 are morenegative, ranging between −6.35 and −2.56‰ VPDB, with amean value of −4.24‰ VPDB (𝑛 = 15). The range of 𝛿13Cvalues on C2 fluctuates from −0.91 to 3.75‰, with a meanvalue of 1.55‰ VPDB (𝑛 = 11).
C3. The oxygen isotope values on C3 are more negative thanC2, ranging from −8.45 to −6.50‰VPDB, with a mean value
8 Geofluids
Table 1: Carbon and oxygen isotopic data of different stages of pore-filling calcite cement by in situ SIMS of Lianglitag Formation carbonatesin the Tahe Oilfield.
Figure 6: Photographs showing typical diagenetic features in the carbonate rocks of the Lianglitag Fm. (a) Early intragranular dissolutionof carbonate minerals developed (most of them were filled during diagenesis), well S111, depth 6108.7m. (b) Non-fabric-selective dissolutionpores and vugs developed, well AD4, depth 6463.42m. (c) Dissolution vug developed along fractures. Sample from 5794.1m, well T904. (d)Cavern breccias developed in the Tahe Oilfield, well TH204, depth 5469.2m. (e) Giant crystal calcite filling the cave. Sample from 6245.95m,well S116. (f) Fracture filled by green marl in the Tahe Oilfield, well T904, depth 5773.21m.
of −7.59‰ VPDB (𝑛 = 18), and the 𝛿13C values are from−0.07 to 4.07‰ VPDB, with a mean value of 2.32‰ VPDB(𝑛 = 17).
C4.The 𝛿18Ovalues are typically 3‰higher than those of C3,lying between−5.37 and−2.29‰VPDB, with amean value of−4.01‰ VPDB (𝑛 = 12), and the 𝛿13C values on C4 are closeto those of C3, ranging from −0.32 to 4.90‰ VPDB, with amean value of 2.21‰ VPDB (𝑛 = 10).
C5. C5 shows more negative 𝛿18OVPDB values (−8.26‰ to−5.12‰ VPDB) than those of C4, with a mean value of
−7.14‰VPDB (𝑛 = 11), and similar 𝛿13CVPDB values (0.45‰to 2.38‰ VPDB).
C6. C6 displays low 𝛿18O values ranging from −11.00 to−9.14‰VPDB,with amean value of−9.64‰VPDB (𝑛 = 13),and 𝛿13Cvalues ranging from−0.88 to 1.70‰VPDB (𝑛 = 12),except one low value (−3.88‰) of VPDB.
4.2.2. Traditional Carbon and Oxygen Isotopes. The micriteranges between −8.05 and −3.78‰ VPDB for 𝛿18O (mean−6.53‰ VPDB, 𝑛 = 14) and between 0.56‰ and 2.48‰VPDB for 𝛿13C (mean 1.92‰ VPDB, 𝑛 = 14). The oxygen
Figure 7: 𝛿13C and 𝛿18O values of different stages of pore-fillingcalcite cement by in situ SIMS.
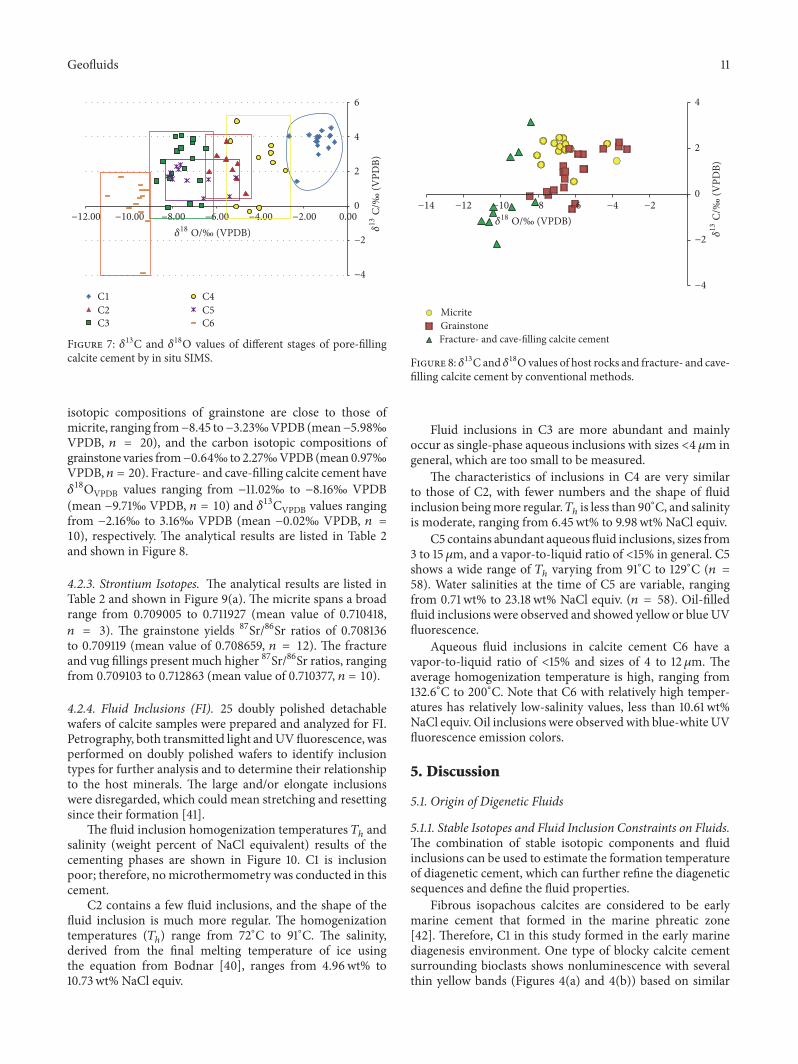
isotopic compositions of grainstone are close to those ofmicrite, ranging from−8.45 to−3.23‰VPDB (mean−5.98‰VPDB, 𝑛 = 20), and the carbon isotopic compositions ofgrainstone varies from−0.64‰to 2.27‰VPDB (mean 0.97‰VPDB, 𝑛 = 20). Fracture- and cave-filling calcite cement have𝛿18OVPDB values ranging from −11.02‰ to −8.16‰ VPDB(mean −9.71‰ VPDB, 𝑛 = 10) and 𝛿13CVPDB values rangingfrom −2.16‰ to 3.16‰ VPDB (mean −0.02‰ VPDB, 𝑛 =10), respectively. The analytical results are listed in Table 2and shown in Figure 8.
4.2.3. Strontium Isotopes. The analytical results are listed inTable 2 and shown in Figure 9(a). The micrite spans a broadrange from 0.709005 to 0.711927 (mean value of 0.710418,𝑛 = 3). The grainstone yields 87Sr/86Sr ratios of 0.708136to 0.709119 (mean value of 0.708659, 𝑛 = 12). The fractureand vug fillings present much higher 87Sr/86Sr ratios, rangingfrom 0.709103 to 0.712863 (mean value of 0.710377, 𝑛 = 10).
4.2.4. Fluid Inclusions (FI). 25 doubly polished detachablewafers of calcite samples were prepared and analyzed for FI.Petrography, both transmitted light andUVfluorescence, wasperformed on doubly polished wafers to identify inclusiontypes for further analysis and to determine their relationshipto the host minerals. The large and/or elongate inclusionswere disregarded, which could mean stretching and resettingsince their formation [41].
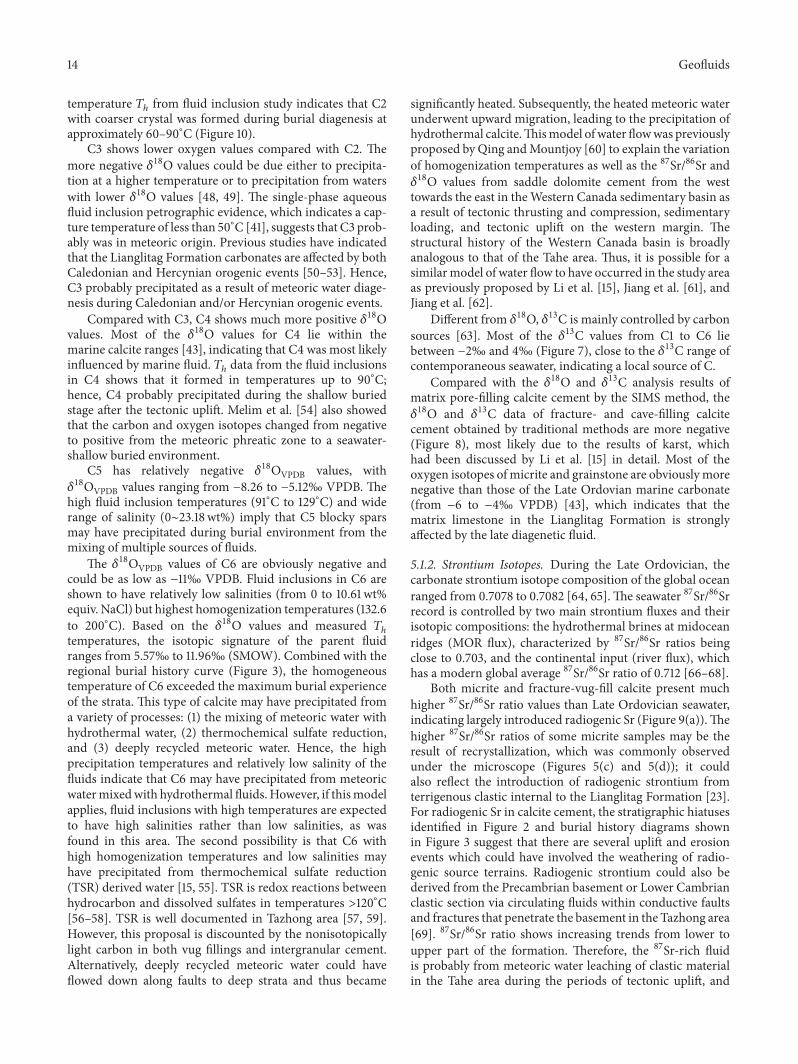
The fluid inclusion homogenization temperatures 𝑇ℎ andsalinity (weight percent of NaCl equivalent) results of thecementing phases are shown in Figure 10. C1 is inclusionpoor; therefore, nomicrothermometry was conducted in thiscement.
C2 contains a few fluid inclusions, and the shape of thefluid inclusion is much more regular. The homogenizationtemperatures (𝑇ℎ) range from 72∘C to 91∘C. The salinity,derived from the final melting temperature of ice usingthe equation from Bodnar [40], ranges from 4.96wt% to10.73 wt% NaCl equiv.
MicriteGrainstoneFracture- and cave-filling calcite cement
−12 −10 −8 −6 −4 −2−14
−4
−2
0
2
4
18 O/‰ (VPDB)
13
C/‰
(VPD
B)
Figure 8: 𝛿13C and 𝛿18Ovalues of host rocks and fracture- and cave-filling calcite cement by conventional methods.
Fluid inclusions in C3 are more abundant and mainlyoccur as single-phase aqueous inclusions with sizes <4 𝜇m ingeneral, which are too small to be measured.
The characteristics of inclusions in C4 are very similarto those of C2, with fewer numbers and the shape of fluidinclusion beingmore regular.𝑇ℎ is less than 90
∘C, and salinityis moderate, ranging from 6.45wt% to 9.98wt% NaCl equiv.
C5 contains abundant aqueous fluid inclusions, sizes from3 to 15𝜇m, and a vapor-to-liquid ratio of <15% in general. C5shows a wide range of 𝑇ℎ varying from 91∘C to 129∘C (𝑛 =58). Water salinities at the time of C5 are variable, rangingfrom 0.71 wt% to 23.18 wt% NaCl equiv. (𝑛 = 58). Oil-filledfluid inclusions were observed and showed yellow or blue UVfluorescence.
Aqueous fluid inclusions in calcite cement C6 have avapor-to-liquid ratio of <15% and sizes of 4 to 12 𝜇m. Theaverage homogenization temperature is high, ranging from132.6∘C to 200∘C. Note that C6 with relatively high temper-atures has relatively low-salinity values, less than 10.61 wt%NaCl equiv. Oil inclusions were observedwith blue-white UVfluorescence emission colors.
5. Discussion
5.1. Origin of Digenetic Fluids
5.1.1. Stable Isotopes and Fluid Inclusion Constraints on Fluids.The combination of stable isotopic components and fluidinclusions can be used to estimate the formation temperatureof diagenetic cement, which can further refine the diageneticsequences and define the fluid properties.
Fibrous isopachous calcites are considered to be earlymarine cement that formed in the marine phreatic zone[42]. Therefore, C1 in this study formed in the early marinediagenesis environment. One type of blocky calcite cementsurrounding bioclasts shows nonluminescence with severalthin yellow bands (Figures 4(a) and 4(b)) based on similar
12 Geofluids
Table 2: Carbon, oxygen, and strontium isotopic data of host rocks and fracture- and vug-filling calcite cements by conventional methods ofLianglitag Formation carbonates in the Tahe Oilfield.
Well Depth(m) Sample type Host lithology 𝛿18O
(‰ VPDB)𝛿13C
(‰ VPDB) Sr87/Sr86
S79 5499.96 Whole rock Micritic limestones −3.777 1.463 —T443 5515.90 Whole rock Micritic limestones −7.837 1.296 —T751 5838 Whole rock Micritic limestones −6.639 2.457 —T904 5776 Whole rock Micritic limestones −6.885 1.892 —T751 5840.20 Whole rock Micritic limestones −7.125 2.229 0.709005∗
T751 5835.70 Whole rock Micritic limestones −7.718 2.337 —T751 5776 Whole rock Micritic limestones −6.801 2.091 0.710323∗
T751 5772.7 Whole rock Micritic limestones −6.523 2.194 —S106 5884.14 Whole rock Micritic limestones −4.288 2.215 0.710756∗
T751 5833.9 Whole rock Micritic limestones −6.85 2.48 —T705 5657.95 Whole rock Micritic limestones −6.08 0.563 0.711927∗
T904 5803 Whole rock Micritic limestones −6.542 1.944 —T904 5792.54 Whole rock Micritic limestones −8.05 1.704 —T904 5779.36 Whole rock Micritic limestones −6.247 1.975 —S106 5934.86 Whole rock Grainstone −4.493 1.988S110 6088.43 Whole rock Grainstone −8.448 −0.078 0.708904∗
S99 5925.06 Whole rock Grainstone −6.335 1.999 —S110 6089.9 Whole rock Grainstone −7.44 −0.028 0.709088∗
S107 6186.86 Whole rock Grainstone −6.635 1.238 —S107 6188.9 Whole rock Sparry bioclastic limestone −6.635 0.959 —T705 5638.99 Whole rock Sparry oolitic limestone −6.171 −0.643 —T705 5648.6 Whole rock Grainstone −6.607 0.3 0.708659∗
T738 5883.9 Whole rock Grainstone −6.535 0.996 —T114 6299.39 Whole rock Grainstone −3.23 1.977 0.70856∗
S107 6230.33 Whole rock Grainstone −5.51 1.107 —S110 6086.52 Whole rock Grainstone −7.149 0.19 0.709119∗
S110 6083.91 Whole rock Grainstone −7.532 0.115 0.708919∗
TP5 6158.68 Whole rock Grainstone −6.568 0.679 —T114 6304.17 Whole rock Grainstone −3.664 2.091 0.708596∗
S106 5885.92 Whole rock Sparry bioclastic limestone −3.653 2.268 0.708353∗
T705 5638.3 Whole rock Bioclastic limestone −6.01 −0.403 0.708261∗
S111 6108.7 Whole rock Sparry bioclastic limestone −5.582 1.75 —S111 6105.89 Whole rock Sparry bioclastic limestone −5.86 1.757 0.708202∗
S111 6104.96 Whole rock Sparry bioclastic limestone −5.558 1.105 0.708136∗
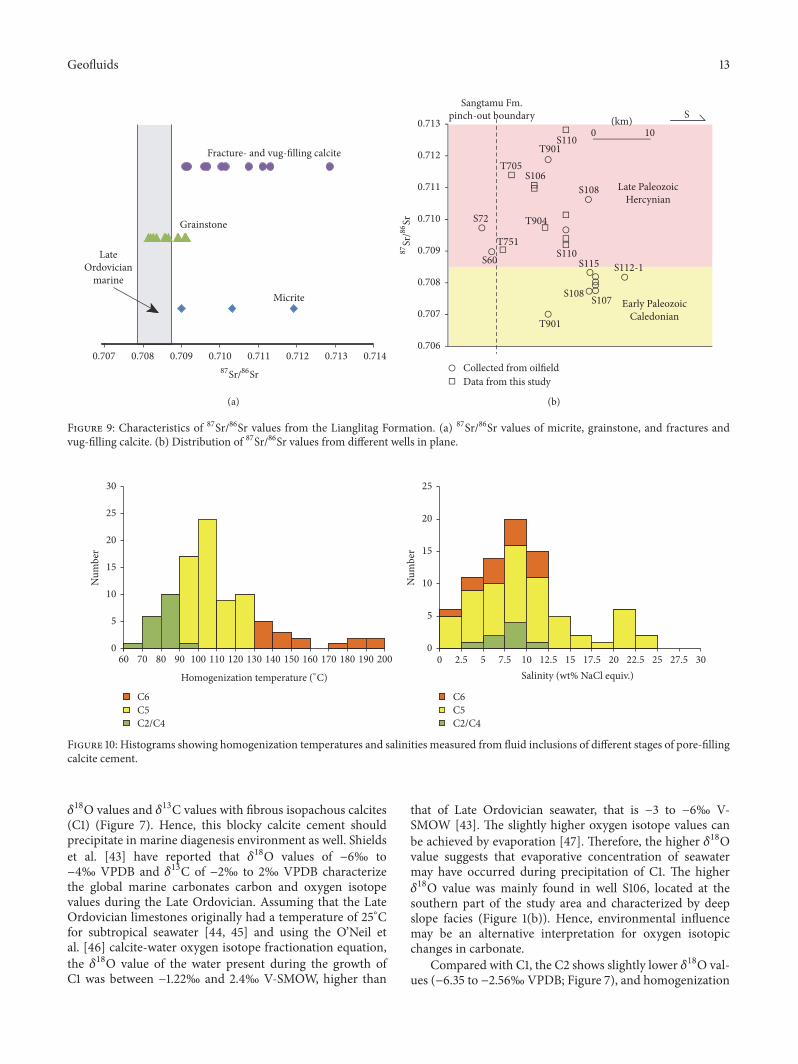
Figure 9: Characteristics of 87Sr/86Sr values from the Lianglitag Formation. (a) 87Sr/86Sr values of micrite, grainstone, and fractures andvug-filling calcite. (b) Distribution of 87Sr/86Sr values from different wells in plane.
Figure 10: Histograms showing homogenization temperatures and salinities measured from fluid inclusions of different stages of pore-fillingcalcite cement.
𝛿18O values and 𝛿13C values with fibrous isopachous calcites(C1) (Figure 7). Hence, this blocky calcite cement shouldprecipitate in marine diagenesis environment as well. Shieldset al. [43] have reported that 𝛿18O values of −6‰ to−4‰ VPDB and 𝛿13C of −2‰ to 2‰ VPDB characterizethe global marine carbonates carbon and oxygen isotopevalues during the Late Ordovician. Assuming that the LateOrdovician limestones originally had a temperature of 25∘Cfor subtropical seawater [44, 45] and using the O’Neil etal. [46] calcite-water oxygen isotope fractionation equation,the 𝛿18O value of the water present during the growth ofC1 was between −1.22‰ and 2.4‰ V-SMOW, higher than
that of Late Ordovician seawater, that is −3 to −6‰ V-SMOW [43]. The slightly higher oxygen isotope values canbe achieved by evaporation [47]. Therefore, the higher 𝛿18Ovalue suggests that evaporative concentration of seawatermay have occurred during precipitation of C1. The higher𝛿18O value was mainly found in well S106, located at thesouthern part of the study area and characterized by deepslope facies (Figure 1(b)). Hence, environmental influencemay be an alternative interpretation for oxygen isotopicchanges in carbonate.
Compared with C1, the C2 shows slightly lower 𝛿18O val-ues (−6.35 to −2.56‰VPDB; Figure 7), and homogenization
14 Geofluids
temperature 𝑇ℎ from fluid inclusion study indicates that C2with coarser crystal was formed during burial diagenesis atapproximately 60–90∘C (Figure 10).
C3 shows lower oxygen values compared with C2. Themore negative 𝛿18O values could be due either to precipita-tion at a higher temperature or to precipitation from waterswith lower 𝛿18O values [48, 49]. The single-phase aqueousfluid inclusion petrographic evidence, which indicates a cap-ture temperature of less than 50∘C [41], suggests that C3 prob-ably was in meteoric origin. Previous studies have indicatedthat the Lianglitag Formation carbonates are affected by bothCaledonian and Hercynian orogenic events [50–53]. Hence,C3 probably precipitated as a result of meteoric water diage-nesis during Caledonian and/or Hercynian orogenic events.
Compared with C3, C4 shows much more positive 𝛿18Ovalues. Most of the 𝛿18O values for C4 lie within themarine calcite ranges [43], indicating that C4 was most likelyinfluenced by marine fluid. 𝑇ℎ data from the fluid inclusionsin C4 shows that it formed in temperatures up to 90∘C;hence, C4 probably precipitated during the shallow buriedstage after the tectonic uplift. Melim et al. [54] also showedthat the carbon and oxygen isotopes changed from negativeto positive from the meteoric phreatic zone to a seawater-shallow buried environment.
C5 has relatively negative 𝛿18OVPDB values, with𝛿18OVPDB values ranging from −8.26 to −5.12‰ VPDB. Thehigh fluid inclusion temperatures (91∘C to 129∘C) and widerange of salinity (0∼23.18 wt%) imply that C5 blocky sparsmay have precipitated during burial environment from themixing of multiple sources of fluids.
The 𝛿18OVPDB values of C6 are obviously negative andcould be as low as −11‰ VPDB. Fluid inclusions in C6 areshown to have relatively low salinities (from 0 to 10.61 wt%equiv. NaCl) but highest homogenization temperatures (132.6to 200∘C). Based on the 𝛿18O values and measured 𝑇ℎtemperatures, the isotopic signature of the parent fluidranges from 5.57‰ to 11.96‰ (SMOW). Combined with theregional burial history curve (Figure 3), the homogeneoustemperature of C6 exceeded the maximum burial experienceof the strata. This type of calcite may have precipitated froma variety of processes: (1) the mixing of meteoric water withhydrothermal water, (2) thermochemical sulfate reduction,and (3) deeply recycled meteoric water. Hence, the highprecipitation temperatures and relatively low salinity of thefluids indicate that C6 may have precipitated from meteoricwatermixedwith hydrothermal fluids. However, if thismodelapplies, fluid inclusions with high temperatures are expectedto have high salinities rather than low salinities, as wasfound in this area. The second possibility is that C6 withhigh homogenization temperatures and low salinities mayhave precipitated from thermochemical sulfate reduction(TSR) derived water [15, 55]. TSR is redox reactions betweenhydrocarbon and dissolved sulfates in temperatures >120∘C[56–58]. TSR is well documented in Tazhong area [57, 59].However, this proposal is discounted by the nonisotopicallylight carbon in both vug fillings and intergranular cement.Alternatively, deeply recycled meteoric water could haveflowed down along faults to deep strata and thus became
significantly heated. Subsequently, the heated meteoric waterunderwent upward migration, leading to the precipitation ofhydrothermal calcite.Thismodel of water flowwas previouslyproposed by Qing andMountjoy [60] to explain the variationof homogenization temperatures as well as the 87Sr/86Sr and𝛿18O values from saddle dolomite cement from the westtowards the east in theWestern Canada sedimentary basin asa result of tectonic thrusting and compression, sedimentaryloading, and tectonic uplift on the western margin. Thestructural history of the Western Canada basin is broadlyanalogous to that of the Tahe area. Thus, it is possible for asimilarmodel of water flow to have occurred in the study areaas previously proposed by Li et al. [15], Jiang et al. [61], andJiang et al. [62].
Different from 𝛿18O, 𝛿13C is mainly controlled by carbonsources [63]. Most of the 𝛿13C values from C1 to C6 liebetween −2‰ and 4‰ (Figure 7), close to the 𝛿13C range ofcontemporaneous seawater, indicating a local source of C.
Compared with the 𝛿18O and 𝛿13C analysis results ofmatrix pore-filling calcite cement by the SIMS method, the𝛿18O and 𝛿13C data of fracture- and cave-filling calcitecement obtained by traditional methods are more negative(Figure 8), most likely due to the results of karst, whichhad been discussed by Li et al. [15] in detail. Most of theoxygen isotopes of micrite and grainstone are obviouslymorenegative than those of the Late Ordovian marine carbonate(from −6 to −4‰ VPDB) [43], which indicates that thematrix limestone in the Lianglitag Formation is stronglyaffected by the late diagenetic fluid.
5.1.2. Strontium Isotopes. During the Late Ordovician, thecarbonate strontium isotope composition of the global oceanranged from 0.7078 to 0.7082 [64, 65].The seawater 87Sr/86Srrecord is controlled by two main strontium fluxes and theirisotopic compositions: the hydrothermal brines at midoceanridges (MOR flux), characterized by 87Sr/86Sr ratios beingclose to 0.703, and the continental input (river flux), whichhas a modern global average 87Sr/86Sr ratio of 0.712 [66–68].
Both micrite and fracture-vug-fill calcite present muchhigher 87Sr/86Sr ratio values than Late Ordovician seawater,indicating largely introduced radiogenic Sr (Figure 9(a)).Thehigher 87Sr/86Sr ratios of some micrite samples may be theresult of recrystallization, which was commonly observedunder the microscope (Figures 5(c) and 5(d)); it couldalso reflect the introduction of radiogenic strontium fromterrigenous clastic internal to the Lianglitag Formation [23].For radiogenic Sr in calcite cement, the stratigraphic hiatusesidentified in Figure 2 and burial history diagrams shownin Figure 3 suggest that there are several uplift and erosionevents which could have involved the weathering of radio-genic source terrains. Radiogenic strontium could also bederived from the Precambrian basement or Lower Cambrianclastic section via circulating fluids within conductive faultsand fractures that penetrate the basement in the Tazhong area[69]. 87Sr/86Sr ratio shows increasing trends from lower toupper part of the formation. Therefore, the 87Sr-rich fluidis probably from meteoric water leaching of clastic materialin the Tahe area during the periods of tectonic uplift, and
Geofluids 15
this is supported by a recent study from formation watergeochemistry in the Tabei area [70].
Previous studies have indicated that the Lianglitag For-mation carbonates are likely affected by both Early PaleozoicCaledonian and Late Paleozoic Hercynian karstification [50–53]. However, because of the relatively similar characteristicsin the minerals and cathodoluminescence, it is difficult todistinguish these phases. According to the stratigraphic dis-tribution characteristics (Figure 2), one of the distinguishedfeatures of the Late Paleozoic is that the clastics aremore obvi-ous. Hence, strontium isotope may be useful in distinctionbetween the two karsts. The strontium isotopic compositioncould be broadly divided into two groups (Figure 9(b)): thefirst group represent the Early Paleozoic karst, characterizedby 87Sr/86Sr ratios that range from 0.70712 to 0.7085, whichis close to the strontium isotopic composition of the LateOrdovician seawater; the second group shows 87Sr/86Sr ratiosranging from 0.7085 to 0.71188, significantly higher than theLateOrdovicianmarine strontium isotopic composition.Thisgroup represents Late Paleozoic karst, which indicates thatstrontium may be added by continental weathering throughthe river. In addition, the strontium isotopic compositionof the northern part of the Tahe Oilfield (the north of theSangtamu Fm. pinch-out boundary) is much higher, which ismainly due to the Late Paleozoic karst, whereas the strontiumisotopic composition of the middle and southern parts ofthe Tahe Oilfield (the south of the Sangtamu Fm. pinch-outboundary) are broad and are both influenced by the EarlyPaleozoic and the Late Paleozoic karst, such as well S108and well T901, which are superimposed on the two karstinteractions.
5.2. Diagenetic Fluid Evolution and Its Influence on ReservoirProperties. Based on petrographic, isotopic, and fluid inclu-sion data, the diagenetic sequence is identified and dividedinto three main episodes. The eogenetic, mesogenetic, andtelogenetic stages were used in this study [71].
During the deposition of the Lianglitag Formation, theTahe region was characterized by a ramp and/or weaklyrimmed platform, with a low-gradient slope and small-scalereefs and shoals [23].Marine calcite cement (C1) is commonlyobserved (Figures 4(a) and 4(b)), especially in the south-ern slope facies, indicating that the Lianglitag Formationcarbonates experienced strong marine cementation in theeogenetic stage. Minor fabric-selective pores occur in high-energy shoals; however, they are more commonly partly orcompletely filled by calcite cement (Figure 6(a)). Therefore,the carbonates exhibit intensive marine cementation andweak syndepositional freshwater dissolution during the eoge-netic diagenetic stage (Figure 11(a)). Thereafter, the strataenter a shallow burial diagenetic environment where C2calcite cement was precipitated.
The large volume of C3 precipitated at the wells demon-strates that the telogenetic meteoric impact is ubiquitous. Inthe Caledonian, the arch developed as a monocline dippinggently to the SE; as the arch was uplifted several times, threeepisodes of karstification, designated episodes I, II, and III,occurred during this period [52, 53]. Episode I occurred
between the deposition of the Yijianfang and QiaerbakeFormations. Episode II occurred between the depositionof the Lianglitag and Sangtamu Formations. Episode IIIoccurred between the deposition of theOrdovician SangtamuFormation and Silurian strata. The Lianglitag Formation ismainly affected by Episode II [17]. The Lianglitag Formationcarbonates were exposed to the surface and infiltrated bygroundwater, leading to significant dissolution of the carbon-ates and formation of dissolution vugs and caves with sizesfrom centimeters to meters (Figure 11(b)). Some vugs andcaverns have been filled byminerals and/or sediments duringthe following mesogenetic stage (Figure 11(c)).
At the end of the Middle Devonian, because of theproximity to the South Tianshan Ocean, the northern partof the Tahe Oilfield was uplifted and subjected to subaerialerosion once again [31, 36]. The Lianglitag subcrop shownin Figure 1(b) and erosional removal of the Middle Ordovi-cian through Carboniferous section shown in Figure 2 areboth the result of Hercynian uplift and erosion. Therefore,Hercynian telogenetic fluids could have laterally access tothe Lianglitag Formation via the subcrop limit and resultin the development of dissolution cavities (Figures 1(c) and11(d)). Access would not necessarily require transit throughthe overlying Sangtamu section. Additionally, fractures areimportant diagenetic fluid channels for karstification. Thereare four periods of fault structures recognizable in the Taheseismic profiles at present [14], which from the bottom up areas follows: (1) thrust faults developed in Cambro-Ordovicianstrata that formed during the Middle-Late Ordovician; (2)a strike-slip fault that developed under the T6
0 reflectinglayer (i.e., Carboniferous base boundary) and formed in theMiddle-Late Devonian; (3) normal faults cutting Permianand older strata associated with early to middle Permianmagmatism; and (4) thrust faults that developed in pre-Jurassic strata and formed during the latest Permian toearliest Triassic. The Late Ordovician strata in the Taheregion are mainly affected by mid to late Devonian strike-slip faulting. Other periods of faulting are of subsidiaryimportance. Therefore, strike-slip faults in the Middle-LateDevonian developed and freshwater along fractures couldaffect the Lianglitag Formation strata.
Subsequently, the sediments were again influenced bymarine to shallow burial, from which bright orange CLcalcite (Cement 4) precipitated. Burial dissolution pores arelocally visible (Figures 4(e), 4(f), 5(e), and 5(f)). Althoughlate burial dissolution does occur, it is volumetrically minor.Previous studies have shown that burial dissolution mainlyincludes organic acids, CO2, H2S [72], and deep hydrother-mal dissolution [12, 73, 74]. According to Section 5.1.1, TSRand thermal fluid activity are not obvious in the UpperOrdovician Lianglitag Formation, which is consistent withthe results of Li et al. [14]. Deeply recycled meteoric watermay have entered the carbonate rocks during the late Permianfavored by fracturing [75] and generated both dissolutionand subsequent cementation C6 in vugs. As noted above,C6 was precipitated at temperatures from 130 to 200∘C andshowed significantly higher 87Sr/86Sr ratios and lighter 𝛿18Oand 𝛿13C values.We have observed someC6 temperature andoxygen isotopic decreasing trend in distance, and the trend of
Figure 11: Diagenetic evolution and reservoir formation models of Lianglitag Formation carbonates.
oxygen isotope values and temperatures during its pathwaysuggest that C6 was likely precipitated from recycling ofmeteoric water. Unfortunately, the data are not enough.Combined with previous works in Tarim Basin [15, 61, 62],C6 was probably closely related to deeply recycled meteoricwater. The reduced water coexisted with highly mature oilswith blue-white UV fluorescence emission colors. However,because most fractures in the Tahe region are partially orcompletely occluded by green marl, the development ofdeeply recycled meteoric water is very local (Figure 11(e)).
Non-fabric-selective vug and cave were produced duringnear-surface karst processes and later burial diagenesis formsan important class of carbonate reservoir in the LianglitagFormation in the Tahe Oilfield. Being near surface combinedwith burial diagenesis produced the complex reservoirs withseveral scales of heterogeneity. The main controlling factorof the reservoir distribution was multistage karstification andfracturing.
6. Conclusions(1) Combined with isotopic geochemical and fluid inclusiondata, the corresponding diagenetic fluid was identified. The
early nonluminescent C1 to growth zones of dark red lumi-nescent C2 is a syngenetic seawater-shallow burial diageneticenvironment; the subsequent nonluminescent C3 is related tothe meteoric fluid system resulting from tectonic uplift andexposure. Then, the strata were buried again and the brightorange luminescent C4 zone was formed during shallowburial. The C5 precipitated in a middle-deep burial environ-ment and was characterized by brown to dull luminescence.In addition, an abnormally high temperature and low salinitywere found in C6 along fractures, which may be the productof deeply recycled meteoric water.
(2) The abundance of C1 indicates that the LianglitagFormation carbonate suffered strong marine cementationand weak meteoric dissolution and cementation during theeogenetic diagenetic stage.The paleokarst during CaledonianII and Hercynian telogenetic karstification closely related toC3 constitutes the most constructive diagenesis. In addition,the carbonate was locally infected by deeply recycled mete-oric water during burial. Compared with the Early Paleozoicfracture- and vug-filling calcite, the Late Paleozoic fracture-and vug-filling calcite have a significantly higher 87Sr/86Srratio due to the presence of more terrigenous clastic material.
Geofluids 17
(3) The reservoir system in the Tahe carbonates is dom-inated by non-fabric-selective pores and remanent (unfilled)karst caves. The development of the reservoir is closelyrelated to fractures. The vugs and caves may be the resultof the infiltration and dissolution of meteoric fluid alongthe fractures when the strata are tectonically uplifted, ofhigh-temperature and low-salinitymeteoric water circulatingalong the deep basin, or of the two superimposed trans-formations. Multistage karstification and fracturing are themain controlling factors of reservoir development, which canprovide important guidance for future deep-buried oil andgas exploration, and have important economic implications.
Conflicts of Interest
The authors declare that there are no conflicts of interestregarding the publication of this paper.
Acknowledgments
This work is financially supported by the National NaturalScience Foundation of China (Grant no. 41302084), StrategicPriority Research Program Grant of the Chinese Academyof Sciences (XDA14010201-02), and National Science andTechnology Major Project of China (2017ZX05008-003). Theauthors thank Drs. Xiaoxiao Ling, Guoqiang Tang, Yu Liu,Qiuli Li, and Xianhua Li for their help during SIMS analysesin IGGCAS. Dr. Lei Jiang gave constructive advice both inEnglish language and in logic arrangement. Many thanksare also due to Professor Chunfang Cai for constructivecomments that helped to improve the manuscript.
References
[1] C. Cai, B. Mei, T. Ma, C. Chen, W. Li, and C. Liu, Approach toFluid-Rock Interaction in the Tarim Basin, Geological Publish-ing House, Beijing, China, 1997.
[2] S. Morad, J. M. Ketzer, and L. R. De Ros, “Spatial and temporaldistribution of diagenetic alterations in siliciclastic rocks: impli-cations formass transfer in sedimentary basins,” Sedimentology,vol. 47, no. 1, pp. 95–120, 2000.
[3] B. Rasmussen and B. Krapez, “Evidence of hydrocarbon andmetalliferous fluid migration in the Palaeoproterozoic Eara-heedy Basin of Western Australia,” Journal of the GeologicalSociety, vol. 157, no. 2, pp. 355–366, 2000.
[4] J. J. Packard, I. Al-Aasm, I. Samson, Z. Berger, and J. Davies, “ADevonian hydrothermal chert reservoir: the 225 bcf parklandfield, british columbia, Canada,” AAPG Bulletin, vol. 85, no. 1,pp. 51–84, 2001.
[5] J. R. Boles, P. Eichhubl, G. Garven, and J. Chen, “Evolution of ahydrocarbon migration pathway along basin-bounding faults:evidence from fault cement,” AAPG Bulletin, vol. 88, no. 7, pp.947–970, 2004.
[6] S. N. Ehrenberg, G. P. Eberli, M. Keramati, and S. A. Moallemi,“Porosity-permeability relationships in interlayered limestone-dolostone reservoirs,” AAPG Bulletin, vol. 90, no. 1, pp. 91–114,2006.
[7] Z. Li, D. Han, and J. Shou, “Diagenesis systems and their spatio-temporal attributes in sedimentary basins,” Acta PetrologicaSinica, vol. 22, no. 8, pp. 2151–2164, 2006.
[8] S. N. Ehrenberg, P. H. Nadeau, and A. A. M. Agrawi, “Acomparison of Khuff and Arab reservoir potential throughoutthe Middle East,” AAPG Bulletin, vol. 91, no. 3, pp. 275–286,2007.
[9] M. Moradpour, Z. Zamani, and S. A. Moallemi, “Controlson reservoir quality in the lower triassic kangan formation,Southern Persian gulf,” Journal of PetroleumGeology, vol. 31, no.4, pp. 367–385, 2008.
[10] Z. Li and J. Liu, “Key problems and research trend of diageneticgeodynamic mechanism and spatio-temporal distribution insedimentary Basins,” Acta Sedimentologica Sinica, vol. 27, pp.837–848, 2009.
[11] Z. Li, “Research frontiers of fluid-rock interaction and oil-gas formation in deep-buried basins,” Bulletin of Mineralogy,Petrology and Geochemistry, vol. 35, 2016.
[12] C. Cai, K. Li, B. Li, L. Cai, and L. Jiang, “Geochemicalcharacteristics and origins of fracture- and vug-filling of theOrdovician in Tahe Oilfield, Tarim Basin,” Acta PetrologicaSinica, vol. 25, pp. 91–96, 2009.
[13] Z. Jin, D. Zhu, W. Hu, X. Zhang, J. Zhang, and Y. Song,“Mesogenetic dissolution of the middle Ordovician limestonein the Tahe oilfield of Tarim basin, NW China,” Marine andPetroleum Geology, vol. 26, no. 6, pp. 753–763, 2009.
[14] Z. Li, S. Huang, J. Liu et al., “Buried diagenesis, structurallycontrolled thermal-fluid process and their effect on Ordoviciancarbonate reservoir in Tahe, Tarim Basin,”Acta SedimentologicaSinica, vol. 28, pp. 969–979, 2010.
[15] K. Li, C. Cai, H. He et al., “Origin of palaeo-waters in theOrdovician carbonates in Tahe oilfield, TarimBasin: constraintsfrom fluid inclusions and Sr, C and O isotopes,” Geofluids, vol.11, no. 1, pp. 71–86, 2011.
[16] H. Zeng, R. Loucks, X. Janson et al., “Three-dimensional seis-mic geomorphology and analysis of the Ordovician paleokarstdrainage system in the central Tabei Uplift, northern TarimBasin, western China,” AAPG Bulletin, vol. 95, no. 12, pp. 2061–2083, 2011.
[17] F. Tian, Q. Jin, X. Lu et al., “Multi-layered ordovician paleokarstreservoir detection and spatial delineation: a case study inthe Tahe Oilfield, Tarim Basin, Western China,” Marine andPetroleum Geology, vol. 69, pp. 53–73, 2016.
[18] C. Jia, S. Zhang, and S. Wu, Tarim Basin and the SurroundingStrata (Part II), Science Press, 2004.
[19] Z. Zhao and Z. Huang, “Ordovician conodont zones andsedimentary sequences of the Tarim Basin, Xinjiang, NWChina,” Journal of Stratigraphy, vol. 30, pp. 193–203, 2006.
[20] X. Cai, X. Jin, L. Zhao, Y. Yang, Z. Zhu, and M. Hu, “Clas-sification and correlation of Lianglitag Formation of UpperOrdovician in Tarim Basin,” Xinjiang Petroleum Geology, pp.447–449, 2012.
[21] M.-C. Hou, L. Wan, H. Fu, L.-M. Zhou, L.-X. Qi, and R.-L. Yu, “Study on the sedimentary environment of the UpperOrdovician Lianglitage Formation in the south of Tarim River,China,” Journal of Chengdu University of Technology, vol. 33, pp.509–516, 2006.
[22] J. Liu, Z. Li, Y. Han, S. Peng, D. Han, and C. Xu, “Characteristicsof sedimentary geochemistry and evolution of platform ofthe Lianglitag formation carbonate, Upper Ordovician in TaheOilfield,” Chinese Journal of Geology, vol. 45, no. 1, pp. 278–291,2010.
[23] J. Liu, Z. Li, J. Huang, and L. Yang, “Distinct sedimentary envi-ronments and their influences on carbonate reservoir evolution
18 Geofluids
of the Lianglitag Formation in the Tarim Basin, NorthwestChina,” Science China Earth Sciences, vol. 55, no. 10, pp. 1641–1655, 2012.
[24] Y. Lu, C. Liu, C. Du, H. Jiang, and F. Liang, “Reservoircharacteristics and control factors of Lianglitag Formation ofUpper Ordovician in The Tahe Oilfield,” Xinjiang Geology, vol.29, pp. 198–202, 2011.
[25] S. Buschaert, S. Fourcade, M. Cathelineau et al., “Widespreadcementation induced by inflow of continental water in theeastern part of the Paris basin: O and C isotopic study ofcarbonate cements,” Applied Geochemistry, vol. 19, no. 8, pp.1201–1215, 2004.
[26] B. Vincent, L. Emmanuel, P. Houel, and J.-P. Loreau, “Geo-dynamic control on carbonate diagenesis: petrographic andisotopic investigation of the Upper Jurassic formations of theParis Basin (France),” Sedimentary Geology, vol. 197, no. 3-4, pp.267–289, 2007.
[27] J. Bourdet, J. Pironon, G. Levresse, and J. Tritlla, “Petroleumaccumulation and leakage in a deeply buried carbonate reser-voir, Nı́spero field (Mexico),” Marine and Petroleum Geology,vol. 27, no. 1, pp. 126–142, 2010.
[28] P. A. Cox, R. A. Wood, J. A. D. Dickson, H. B. Al Rougha,H. Shebl, and P. W. M. Corbett, “Dynamics of cementation inresponse to oil charge: evidence from a Cretaceous carbonatefield, U.A.E,” Sedimentary Geology, vol. 228, no. 3-4, pp. 246–254, 2010.
[29] J. Sample, “Stable isotope constraints on vein formation andfluid evolution along a recent thrust fault in the Cascadiaaccretionary wedge,” Earth and Planetary Science Letters, vol.293, no. 3-4, pp. 300–312, 2010.
[30] R. I. Gabitov, A. C. Gagnon, Y. Guan, J.M. Eiler, and J. F. Adkins,“Accurate Mg/Ca, Sr/Ca, and Ba/Ca ratio measurements incarbonates by SIMS and NanoSIMS and an assessment of het-erogeneity in common calcium carbonate standards,” ChemicalGeology, vol. 356, pp. 94–108, 2013.
[31] C. Lin, H. Yang, J. Liu, Z. Rui, Z. Cai, and Y. Zhu, “Distributionand erosion of the Paleozoic tectonic unconformities in theTarim Basin, Northwest China: significance for the evolutionof paleo-uplifts and tectonic geography during deformation,”Journal of Asian Earth Sciences, vol. 46, pp. 1–19, 2012.
[32] C. Jia, Tectonic Characteristic and Petroleum in Tarim Basin,China, Performance Industry Press, Beijing, China, 1997.
[33] Q. Wang and Z. Li, Basin-Mountain System and Oil and Gas inKuche-Tianshan, Science Press, 2007.
[34] M. Jiang, J. Zhu, D. Chen, R. Zhang, and G. Qiao, “Carbonand strontium isotope variations and responses to sea-levelfluctuations in the Ordovician of the Tarim Basin,” Science inChina Series D: Earth Sciences, vol. 44, no. 9, pp. 816–823, 2001.
[35] X. Lou, “The seismic reflection boundary T72 and the UpperOrdovician carbonate karst reservoirs on the Tazhong uplift,Xinjiang,” Sedimentary Geology and Tethyan Geology, vol. 25,pp. 24–32, 2005.
[36] J. Charvet, L. Shu, S. Laurent-Charvet et al., “Palaeozoic tectonicevolution of the Tianshan belt, NWChina,” Science China EarthSciences, vol. 54, no. 2, pp. 166–184, 2011.
[37] N. Qiu, S. Hu, and L. He, Theory and Application of ThermalSystem in Sedimentary Basin, Petroleum Industry Press, 2004.
[38] C. S. Lin,H. J. Yang, J. Y. Liu et al., “Paleostructural geomorphol-ogy of the Paleozoic central uplift belt and its constraint on thedevelopment of depositional facies in the Tarim Basin,” Sciencein China Series D: Earth Sciences, vol. 52, no. 6, pp. 823–834,2009.
[39] N.-S. Qiu, R. Peter, Q.-H. Mei, G. Jiang, S. Nicolesco, and C.Tao, “Application of the (U-Th)/He thermochronometry to thetectono-thermal evolution of sedimentary basin—a case historyof well KQ1 in the Tarim basin,” Chinese Journal of Geophysics,vol. 52, no. 7, pp. 1825–1835, 2009.
[40] R. J. Bodnar, “Revised equation and table for determining thefreezing point depression of H
[41] R. H. Goldstein and T. J. Reynolds, Fluid inclusion, microther-mometry, 1994.
[42] C. H. Moore, Carbonate Diagenesis And Porosity, Elsevier,Amsterdam, Netherlands, 1989.
[43] G. A. Shields, G. A. F. Carden, J. Veizer, T. Meidla, J.-Y. Rong,and R.-Y. Li, “Sr, C, and O isotope geochemistry of Ordovicianbrachiopods: a major isotopic event around the Middle-LateOrdovician transition,” Geochimica et Cosmochimica Acta, vol.67, no. 11, pp. 2005–2025, 2003.
[44] D. Fang and Z. Shen, “Phanerozoic apparent polar-wanderpaths of Tarim and plate motion,” Journal of Zhejiang University(Science Edition, vol. 28, pp. 100–106, 2001.
[45] L. Li, N. Qiu, Z. Jin, and Z. He, “Geothermal history of TarimBasin,” Oil & Gas Gelology, vol. 26, pp. 613–617, 2005.
[46] J. R. O’Neil, R. N. Clayton, and T. K. Mayeda, “Oxygen isotopefractionation in divalent metal carbonates,” The Journal ofChemical Physics, vol. 51, no. 12, pp. 5547–5558, 1969.
[47] B. W. Robinson and A. Gunatilaka, “Stable isotope studies andthe hydrological regime of sabkhas in southernKuwait, ArabianGulf,” Sedimentary Geology, vol. 73, no. 1-2, pp. 141–159, 1991.
[48] J. Veizer, P. Bruckschen, F. Pawellek et al., “Oxygen isotopeevolution of Phanerozoic seawater,” Palaeogeography, Palaeocli-matology, Palaeoecology, vol. 132, no. 1-4, pp. 159–172, 1997.
[49] A. Immenhauser, J. A. M. Kenter, G. Ganssen, J. R. Bahamonde,A. Van Vliet, and M. H. Saher, “Origin and significance ofisotopes shifts in Pennslyvanian carbonates (Asturias, NWSpain),” Journal of Sedimentary Research, vol. 72, no. 1, pp. 82–94, 2002.
[50] X. Yan, Z. Han, and Y. Li, “Reservoir characteristics andformation mechanism of the Ordovician carbonate pools in theTahe Oilfield,” Geological Review, vol. 48, pp. 619–626, 2002.
[51] R. Yu, “Characteristics and significance of the Caledonian karstin the Tahe Oilfield, the Tarim basin,” Petroleum Geology &Experiment, vol. 27, pp. 468–472, 2005.
[52] R. Yu and H. Fu, “Influence of tectonic movement on Ordovi-cian carbonates of Tahe Oilfield,” Nature Gas Exploration andDevelopment, vol. 29, pp. 1–5, 2006.
[53] T. Zhang and X. Cai, “Caledonian paleo-karstification and itscharacteristics in Tahe area, Tarim basin,”Acta Geologica Sinica,vol. 81, no. 8, pp. 1125–1134, 2007.
[54] L. A. Melim, H. Westphal, P. K. Swart, G. P. Eberli, andA. Munnecke, “Questioning carbonate diagenetic paradigms:evidence from the Neogene of the Bahamas,” Marine Geology,vol. 185, no. 1-2, pp. 27–53, 2002.
[55] R. H. Worden, P. C. Smalley, and N. H. Oxtoby, “The effects ofthermochemical sulfate reduction upon formation water salin-ity and oxygen isotopes in carbonate gas reservoirs,”Geochimicaet Cosmochimica Acta, vol. 60, no. 20, pp. 3925–3931, 1996.
[56] R. H. Worden, P. C. Smalley, and N. H. Oxtoby, “Gas souringby thermochemical sulfate reduction at 140∘C,” AAPG Bulletin,vol. 79, no. 6, pp. 854–863, 1995.
[57] C. Cai, W. Hu, and R. H. Worden, “Thermochemical sulphatereduction in Cambro-Ordovician carbonates in Central Tarim,”Marine and Petroleum Geology, vol. 18, no. 6, pp. 729–741, 2001.
Geofluids 19
[58] H. G. Machel, “Bacterial and thermochemical sulfate reductionin diagenetic settings—old and new insights,” SedimentaryGeology, vol. 140, no. 1-2, pp. 143–175, 2001.
[59] C. Cai, Q. Xiao, C. Fang, T. Wang, W. He, and H. Li, “Theeffect of thermochemical sulfate reduction on formation andisomerization of thiadiamondoids and diamondoids in theLower Paleozoic petroleum pools of the Tarim Basin, NWChina,” Organic Geochemistry, vol. 101, pp. 49–62, 2016.
[60] H. Qing and E. Mountjoy, “Large-scale fluid flow in the Mid-dle Devonian Presqu’ile barrier, western Canada sedimentarybasin,” Geology, vol. 20, no. 10, article 903, 1992.
[61] L. Jiang, W. Pan, C. Cai et al., “Fluid mixing induced byhydrothermal activity in the ordovician carbonates in TarimBasin, China,” Geofluids, vol. 15, no. 3, pp. 483–498, 2015.
[62] L. Jiang, C. Cai, R. H.Worden et al., “Multiphase dolomitizationof deeply buried Cambrian petroleum reservoirs, Tarim Basin,north-west China,” Sedimentology, vol. 63, no. 7, pp. 2130–2157,2016.
[63] J. D. Hudson, “Stable isotopes and limestone lithification,”Journal of the Geological Society, vol. 133, no. 6, pp. 637–660,1977.
[64] R. E. Denison, R. B. Koepnick, W. H. Burke, and E. A.Hetherington, “Construction of the Cambrian and Ordovicianseawater 87Sr/86Sr curve,”Chemical Geology, vol. 152, no. 3-4, pp.325–340, 1998.
[65] J. M. McArthur, R. J. Howarth, and T. R. Bailey, “Strontiumisotope stratigraphy: LOWESS version 3: best fit to the marineSr-isotope curve for 0–509Ma and accompanying look-up tablefor deriving numerical age,” Journal of Geology, vol. 109, no. 2,pp. 155–170, 2001.
[66] G. Faure, Principles of Isotope Geology, 2nd edition, 1986.[67] J. D. Marshall, “Climatic and oceanographic isotopic signals
from the carbonate rock record and their preservation,” Geo-logical Magazine, vol. 129, no. 2, pp. 143–160, 1992.
[68] J. L. Banner, “Application of the trace element and isotopegeochemistry of strontium to studies of carbonate diagenesis,”Sedimentology, vol. 42, no. 5, pp. 805–824, 1995.
[69] C. Cai, K. Li, H. Li, and B. Zhang, “Evidence for cross forma-tional hot brine flow from integrated 87Sr/86Sr, REE and fluidinclusions of the Ordovician veins in Central Tarim, China,”Applied Geochemistry, vol. 23, no. 8, pp. 2226–2235, 2008.
[70] J. Chen, D. Liu, P. Peng, C. Yu, B. Zhang, and Z. Xiao, “Thesources and formation processes of brines from the Lun-nan Ordovician paleokarst reservoir, Tarim Basin, northwestChina,” Geofluids, vol. 13, no. 3, pp. 381–394, 2013.
[71] P. W. Choquette and L. C. Pray, “Geologic nomenclature andclassification of porosity in sedimentary carbonates,” AAPGBulletin, vol. 54, no. 2, pp. 207–250, 1970.
[72] S. J. Mazzullo and P. M. Harris, “Mesogenetic dissolution: itsrole in porosity development in carbonate reservoirs,” AAPGBulletin, vol. 76, no. 5, pp. 607–620, 1992.
[73] G. R. Davies and L. B. Smith Jr., “Structurally controlledhydrothermal dolomite reservoir facies: an overview,” AAPGBulletin, vol. 90, no. 11, pp. 1641–1690, 2006.
[74] Z. Jin, D. Zhu, W. Hu, X. Zhang, Y. Wang, and X. Yan,“Geological and geochemical signature of hydrothermal activityand their influence on carbonated reservoir bedside in theTarim Basin,” Acta Geologica Sinica, vol. 80, pp. 245–253, 2006.
[75] J.-W. Li, Z. Li, N.-S. Qiu, Y.-H. Zuo, J.-B. Yu, and J.-Q.Liu, “Carboniferous-Permian abnormal thermal evolution ofthe Tarim basin and its implication for deep structure and
magmatic activity,” Chinese Journal of Geophysics, vol. 59, no. 9,pp. 3318–3329, 2016.