18 November 2010 • CURRENCY TRADER In his 1997 book Trading Tactics: An Introduction to Finding, Exploiting and Managing Profitable Share Trading Opportunities, Daryl J. Guppy discussed the application of an indicator he called the Guppy Multiple Moving Average (GMMA), which was based on using groups of moving averages to better determine trend direction and strength. The idea is to use several slow moving averages to determine long-term trend direction, coupled with a group of faster moving averages to gauge short- and medium- term developments. The goal is to help traders spot trade opportunities by analyzing the level of interaction and sep- aration between the different moving averages, rather than using moving average crossovers, as most moving-average trading systems do. The following analysis explores the idea of using two groups of moving averages to create a simple system to follow longer-term trends. Reviewing the indicator To create a mechanical strategy to trade on the daily time frame, we will first establish the two groups of moving averages, as Guppy originally did: The “slow group” will consist of the 60-, 50-, 45-, 40-, 35-, and 30-day simple mov- ing averages (SMAs) and the “fast group” will consist of the 15-, 12-, 10-, 8-, 5-, and 3-day SMAs. Figure 1 shows a chart of these averages revealing sev- eral pieces of information, including the longer-term trend direction and the presence of consolidation periods and small countertrend moves highlighted by the shorter averages. However, translating such visual impressions into a mechanical trading strategy can be difficult because of the varying rela- tionships between the 12 different mov- ing averages. A simple approach is to evaluate the order of the moving aver- ages and enter trades when they are arranged in such a way that indicates trends on the long-term, intermediate, and short-term time frames are moving in the same direction. The trading strategy The system is a simple set of rules designed to keep you in the market only when there is a high degree of certainty regarding trend direction. Long trades are entered when on the Multiple average trend-following Translating a multi-moving average technique into a mechanical forex- trading system highlights the benefits of simplicity and diversification. BY DANIEL FERNANDEZ TRADING STRATEGIES TRADING STRATEGIES FIGURE 1: MOVING AVERAGE ALIGNMENT Trades are signaled when a large group of moving averages (in this case, 12) align in such a way that, in the case of long trades, the short-term averages are above the longer-term averages. Source for all figures: MetaTrader 4
In his 1997 book Trading Tactics: An Introduction to Finding, Exploiting and Managing Profitable Share Trading Opportunities, Daryl J. Guppy discussed the application of an indicator he called the Guppy Multiple Moving Average (GMMA), which was based on using groups of moving averages to better determine trend direction and strength.
The idea is to use several slow moving averages to determine long-term trend direction, coupled with a group of faster moving averages to gauge short- and medium-term developments. The goal is to help traders spot trade opportunities by analyzing the level of interaction and sep-aration between the different moving averages, rather than using moving average crossovers, as most moving-average
trading systems do.The following analysis explores the idea of using two
groups of moving averages to create a simple system to follow longer-term trends.
Reviewing the indicatorTo create a mechanical strategy to trade on the daily time frame, we will first establish the two groups of moving averages, as Guppy originally did: The “slow group” will consist of the 60-, 50-, 45-, 40-, 35-, and 30-day simple mov-ing averages (SMAs) and the “fast group” will consist of the 15-, 12-, 10-, 8-, 5-, and 3-day SMAs.
Figure 1 shows a chart of these averages revealing sev-eral pieces of information, including the longer-term trend direction and the presence of consolidation periods and small countertrend moves highlighted by the shorter averages. However, translating such visual impressions into a mechanical trading strategy can be difficult because of the varying rela-tionships between the 12 different mov-ing averages. A simple approach is to evaluate the order of the moving aver-ages and enter trades when they are arranged in such a way that indicates trends on the long-term, intermediate, and short-term time frames are moving in the same direction.
The trading strategyThe system is a simple set of rules designed to keep you in the market only when there is a high degree of certainty regarding trend direction. Long trades are entered when on the
Multiple average trend-following
Translating a multi-moving average technique into a mechanical forex-
trading system highlights the benefits of simplicity and diversification.
BY DANIEL FERNANDEZ
TRADING STRATEGIESTRADING STRATEGIES
FIGURE 1: MOVING AVERAGE ALIGNMENT
Trades are signaled when a large group of moving averages (in this case, 12) align in such a way that, in the case of long trades, the short-term averages are above the longer-term averages.Source for all figures: MetaTrader 4
last closed candle all 12 moving averages align in increas-ing order — that is, successively shorter moving averages are above the longer averages — e.g., 3-day SMA > 5-day SMA > 8-day SMA > 10-day SMA > 12-day SMA > 15-day SMA > 30-day SMA > 35-day SMA > 40-day SMA > 45-day SMA > 50-day SMA > 60-day SMA. Similarly, short trades are entered when the averages align in descending order (3-day MA < 5-day SMA < 8-day SMA < 10-day SMA, etc.). Any open trades are closed when the SMAs lose their proper alignments on the last closed candle.
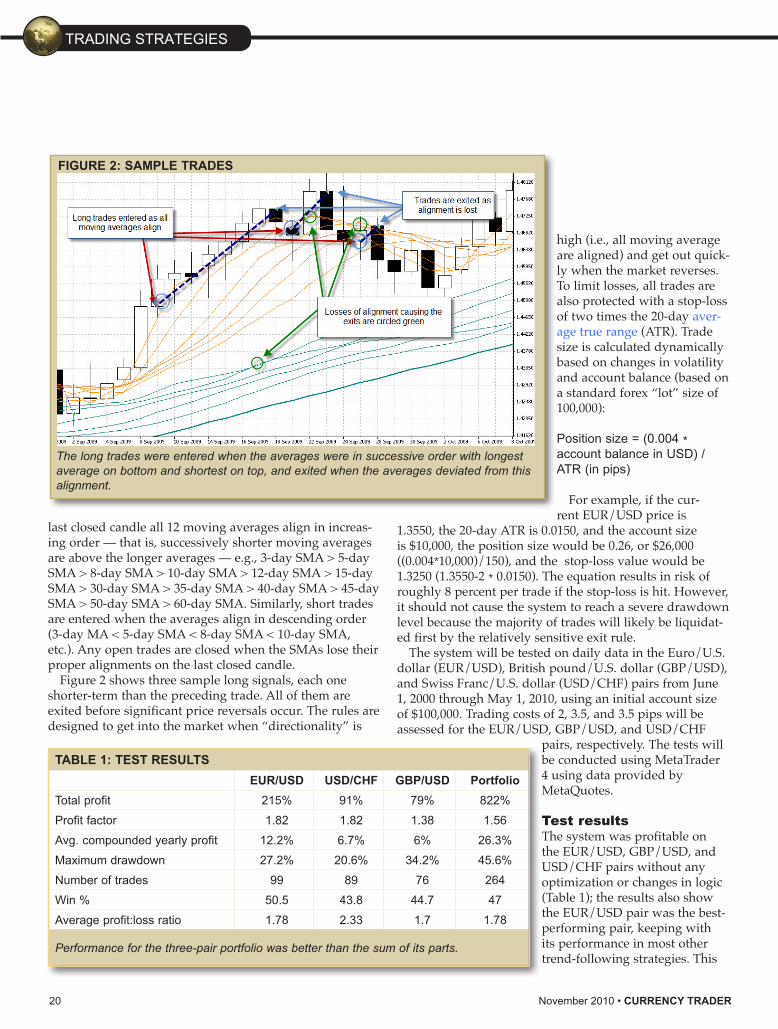
Figure 2 shows three sample long signals, each one shorter-term than the preceding trade. All of them are exited before significant price reversals occur. The rules are designed to get into the market when “directionality” is
high (i.e., all moving average are aligned) and get out quick-ly when the market reverses. To limit losses, all trades are also protected with a stop-loss of two times the 20-day aver-age true range (ATR). Trade size is calculated dynamically based on changes in volatility and account balance (based on a standard forex “lot” size of 100,000):
Position size = (0.004 * account balance in USD) / ATR (in pips)
For example, if the cur-rent EUR/USD price is
1.3550, the 20-day ATR is 0.0150, and the account size is $10,000, the position size would be 0.26, or $26,000 ((0.004*10,000)/150), and the stop-loss value would be 1.3250 (1.3550-2 * 0.0150). The equation results in risk of roughly 8 percent per trade if the stop-loss is hit. However, it should not cause the system to reach a severe drawdown level because the majority of trades will likely be liquidat-ed first by the relatively sensitive exit rule.
The system will be tested on daily data in the Euro/U.S. dollar (EUR/USD), British pound/U.S. dollar (GBP/USD), and Swiss Franc/U.S. dollar (USD/CHF) pairs from June 1, 2000 through May 1, 2010, using an initial account size of $100,000. Trading costs of 2, 3.5, and 3.5 pips will be assessed for the EUR/USD, GBP/USD, and USD/CHF
pairs, respectively. The tests will be conducted using MetaTrader 4 using data provided by MetaQuotes.
Test resultsThe system was profitable on the EUR/USD, GBP/USD, and USD/CHF pairs without any optimization or changes in logic (Table 1); the results also show the EUR/USD pair was the best-performing pair, keeping with its performance in most other trend-following strategies. This
20 November2010•CURRENCY TRADER
TRADING STRATEGIES
FIGURE 2: SAMPLE TRADES
The long trades were entered when the averages were in successive order with longest average on bottom and shortest on top, and exited when the averages deviated from this alignment.
TABLE 1: TEST RESULTSEUR/USD USD/CHF GBP/USD Portfolio
Total profit 215% 91% 79% 822%
Profit factor 1.82 1.82 1.38 1.56
Avg. compounded yearly profit 12.2% 6.7% 6% 26.3%
Maximum drawdown 27.2% 20.6% 34.2% 45.6%
Number of trades 99 89 76 264
Win % 50.5 43.8 44.7 47
Average profit:loss ratio 1.78 2.33 1.7 1.78
Performance for the three-pair portfolio was better than the sum of its parts.
superior performance can be attributed to the pair’s higher liquidity and more stable trend tendencies, which result in fewer whipsaws than in other pairs.
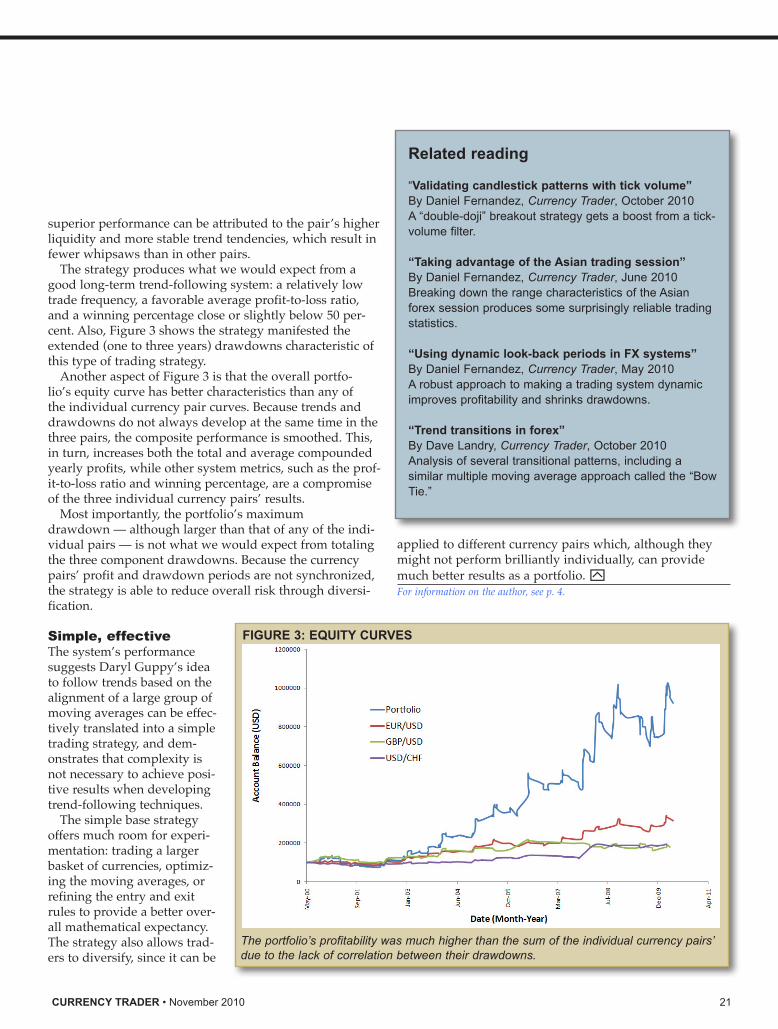
The strategy produces what we would expect from a good long-term trend-following system: a relatively low trade frequency, a favorable average profit-to-loss ratio, and a winning percentage close or slightly below 50 per-cent. Also, Figure 3 shows the strategy manifested the extended (one to three years) drawdowns characteristic of this type of trading strategy.
Another aspect of Figure 3 is that the overall portfo-lio’s equity curve has better characteristics than any of the individual currency pair curves. Because trends and drawdowns do not always develop at the same time in the three pairs, the composite performance is smoothed. This, in turn, increases both the total and average compounded yearly profits, while other system metrics, such as the prof-it-to-loss ratio and winning percentage, are a compromise of the three individual currency pairs’ results.
Most importantly, the portfolio’s maximum drawdown — although larger than that of any of the indi-vidual pairs — is not what we would expect from totaling the three component drawdowns. Because the currency pairs’ profit and drawdown periods are not synchronized, the strategy is able to reduce overall risk through diversi-fication.
Simple, effectiveThe system’s performance suggests Daryl Guppy’s idea to follow trends based on the alignment of a large group of moving averages can be effec-tively translated into a simple trading strategy, and dem-onstrates that complexity is not necessary to achieve posi-tive results when developing trend-following techniques.
The simple base strategy offers much room for experi-mentation: trading a larger basket of currencies, optimiz-ing the moving averages, or refining the entry and exit rules to provide a better over-all mathematical expectancy. The strategy also allows trad-ers to diversify, since it can be
applied to different currency pairs which, although they might not perform brilliantly individually, can provide much better results as a portfolio. yFor information on the author, see p. 4.
FIGURE 3: EQUITY CURVES
The portfolio’s profitability was much higher than the sum of the individual currency pairs’ due to the lack of correlation between their drawdowns.
Related reading
“Validating candlestick patterns with tick volume”By Daniel Fernandez, Currency Trader, October 2010A “double-doji” breakout strategy gets a boost from a tick-volume filter.
“Taking advantage of the Asian trading session”By Daniel Fernandez, Currency Trader, June 2010Breaking down the range characteristics of the Asian forex session produces some surprisingly reliable trading statistics.
“Using dynamic look-back periods in FX systems” By Daniel Fernandez, Currency Trader, May 2010A robust approach to making a trading system dynamic improves profitability and shrinks drawdowns.
“Trend transitions in forex” By Dave Landry, Currency Trader, October 2010Analysis of several transitional patterns, including a similar multiple moving average approach called the “Bow Tie.”