Multiple four-wave mixing in optical fibers: 1.5–3.4-THz femtosecond pulse sources and real-time monitoring of a 20-GHz picosecond source Julien Fatome, St´ ephane Pitois, Coraline Fortier, Bertrand Kibler, Christophe Finot, Guy Millot, Cl´ ement Courde, Michel Lintz, Etienne Samain To cite this version: Julien Fatome, St´ ephane Pitois, Coraline Fortier, Bertrand Kibler, Christophe Finot, et al.. Multiple four-wave mixing in optical fibers: 1.5–3.4-THz femtosecond pulse sources and real- time monitoring of a 20-GHz picosecond source. Optics Communications, Elsevier, 2010, 283 (11), pp.2425-2429. <10.1016/j.optcom.2010.01.057>. <hal-00472243> HAL Id: hal-00472243 https://hal.archives-ouvertes.fr/hal-00472243 Submitted on 10 Apr 2010 HAL is a multi-disciplinary open access archive for the deposit and dissemination of sci- entific research documents, whether they are pub- lished or not. The documents may come from teaching and research institutions in France or abroad, or from public or private research centers. L’archive ouverte pluridisciplinaire HAL, est destin´ ee au d´ epˆ ot et ` a la diffusion de documents scientifiques de niveau recherche, publi´ es ou non, ´ emanant des ´ etablissements d’enseignement et de recherche fran¸cais ou ´ etrangers, des laboratoires publics ou priv´ es.
Transcript
Multiple four-wave mixing in optical fibers: 1.5–3.4-THz
femtosecond pulse sources and real-time monitoring of a
Finot, Guy Millot, Clement Courde, Michel Lintz, Etienne Samain
To cite this version:
Julien Fatome, Stephane Pitois, Coraline Fortier, Bertrand Kibler, Christophe Finot, et al..Multiple four-wave mixing in optical fibers: 1.5–3.4-THz femtosecond pulse sources and real-time monitoring of a 20-GHz picosecond source. Optics Communications, Elsevier, 2010, 283(11), pp.2425-2429. <10.1016/j.optcom.2010.01.057>. <hal-00472243>
HAL Id: hal-00472243
https://hal.archives-ouvertes.fr/hal-00472243
Submitted on 10 Apr 2010
HAL is a multi-disciplinary open accessarchive for the deposit and dissemination of sci-entific research documents, whether they are pub-lished or not. The documents may come fromteaching and research institutions in France orabroad, or from public or private research centers.
L’archive ouverte pluridisciplinaire HAL, estdestinee au depot et a la diffusion de documentsscientifiques de niveau recherche, publies ou non,emanant des etablissements d’enseignement et derecherche francais ou etrangers, des laboratoirespublics ou prives.
Real time monitoring of an all-fibered 20 GHz optical pulse source and generation of high quality 1.5-2 THz femtosecond pulse
sources based on multiple four wave mixing approach
J. Fatome, S. Pitois, C. Fortier, B. Kibler, C. Finot, G. Millot
Institut Carnot de Bourgogne, UMR 5209 CNRS-Université de Bourgogne, 9 av. Alain Savary, 21078 Dijon, France
C. Courde, M. Lintz
ARTEMIS, Université de Nice Sophia-Antipolis, CNRS, Observatoire de la Côte d'Azur; Boulevard de l'Observatoire, 06304 Nice cedex 04, France
E. Samain
GeoAzur, Université de Nice Sophia-Antipolis, CNRS, Observatoire de la Côte d'Azur 2130 Route de l’Observatoire, 06460 Saint Vallier de Thiey, France
Abstract:
In this work, we report recent progress on the design of all-fibered ultra-high repetition-rate pulse sources for telecommunication applications around 1550 nm. The sources are based on the nonlinear compression of an initial beat-signal through a multiple four-wave mixing process taking place into an optical fiber. We experimentally demonstrate real time monitoring of a 20 GHz pulse source having an integrated phase noise 6x10⁻³ radian by phase locking the initial beat note against a reference RF oscillator. Based on this technique, we also experimentally demonstrate a well-separated high-quality 110 fs pulse source having a repetition rate of 2 THz. Finally, we show that with only 1.4 m of standard single mode fiber, we can achieve a twofold increase of the repetition rate, up to 3.4 THz, through the self-imaging Talbot effect. Experimental results are supported by numerical simulations based on the generalized nonlinear Schrödinger equation. Keywords: Nonlinear Optics, Optical fiber, Pulse Sources, Pulse Compression, Four Wave Mixing, Talbot effect, Optical Telecommunication.
Generation of high-quality high repetition rate optical pulse trains around 1550 nm has
become of a great interest in many scientific applications such as optical sampling [1]-[2], ultra-high capacity transmission systems [3]-[4], optical switching [5], optical clock generation [6], component testing, metrology or nonlinear phenomena studies [7]-[9]. Unfortunately, the current bandwidth limitations of optoelectronic devices prevent the direct generation of pulses with repetition rate higher than 50 GHz and with a temporal width below a few picoseconds. In order to overcome the limit of electronic bandwidth, an attractive and all-optical nonlinear method was proposed. This technique is based on the adiabatic transformation of a sinusoidal beat-signal into well-separated pulses through its nonlinear compression in optical fibers. The pulse repetition rate of the source is then simply determined by the frequency of the initial beating. This all-optical approach has been successfully demonstrated with various experimental setups including dispersion-decreasing fibers [10], adiabatic Raman compression in standard optical fibers [11] and step-like or comb-like dispersion profiled fibers [12]-[16]. However, these techniques often require relatively complicated fiber map arrangement via numerous reshaping stages based on a careful longitudinal dispersion management using custom designed optical fibers. More recently, this nonlinear compression effect has been observed through a multiple four wave mixing (MFWM) process taking place within an anomalous dispersive optical fiber [17]-[18]. This last method has been proved to be an attractive and efficient alternative way to generate very high repetition rate pulse trains, combining both stability and simplicity of the experimental setup [19]-[22]. This powerful method has been successfully used for the generation of a 1.3-ps high-quality pulse train at 160 GHz and subpicosecond pulses up to 1 THz [22]. Combined with a second stage of compression based on the parabolic reshaping taking place into a normal dispersive optical fiber, we have also demonstrated that pulse sources with lower duty-cycle (up to 1/17) could be obtained at various repetition rates [23]-[24]. In this work, we report several recent and significant advances on the design of this kind of all-fibered ultra-high repetition-rate pulse sources for telecommunication applications in the C-band. In particular, for the first time of our knowledge, thanks to a phase-lock set-up stabilizing the initial 20-GHz beat note, we experimentally demonstrate a direct real-time monitoring of the multiple four-wave mixing compression stage on a 50-GHz optical sampling oscilloscope. We have also demonstrated a record ultra-high repetition pulse source of 2 THz with pulses as short as 110 fs and finally, by means of 1.4 m of standard single mode fiber, we succeed to achieve a twofold increase of the repetition rate up to 3.4 THz through the self-imaging Talbot effect. Experimental setup:
The typical experimental setup is sketched in Fig. 1. The initial beat-signal is obtained by the superposition of two continuous wave 1.55-µm external cavity laser diodes (ECL) frequency separated by the repetition rate of the source under test. A phase modulator, driven around 130 MHz, is used to suppress the stimulated Brillouin scattering (SBS) effect occurring in the compression fiber. The resulting beat-signal is then amplified to the required average power [22] thanks to an Erbium doped fiber amplifier (EDFA) before injecting into the compression fiber. Note that the whole beat-signal generation stage is polarization maintaining in order to maximize the four wave mixing process in the compression fiber. At the fiber output, the generated pulse train is characterized in both intensity and phase by
2
means of a Frequency-Resolved Optical Gating (FROG) set-up and an optical spectrum analyzer (OSA) [25]-[26].
The initial 1.5-THz beating was first generated though the superposition of the two ECLs at 1549.6 nm and 1561.5 nm. The beat-signal was then amplified with an average power of 3.3 W before injection into a short segment of 29 m of highly nonlinear fiber (HNLF). At 1550 nm, the HNLF fiber has the following parameters measured by the modulation instability technique described in ref. [27]. Chromatic dispersion was D = 0.8 ps/nm.km. In order to avoid any asymmetry in the pulse intensity profile, a small dispersion slope fiber was chosen: S = 0.008 ps/nm².km. Finally the nonlinear Kerr coefficient was measured to γ = 9.5 W-1.km-1 and fiber losses α = 0.7 dB/km. Note that the end of the HNLF was directly connected to the FROG setup in order to avoid any pulse distortion due to propagation in single mode fiber pigtail.
The experimental results of the 1.5-THz pulse source are illustrated in Figs. 2. Figure 2a presents the FROG characterization; the inset shows the experimental FROG trace. The intensity profile shows very well separated pulses with a full width at half maximum (FWHM) of only 115 fs for a peak power of 15 W. The pulse shape is quasi Gaussian, without notable pedestal. Note that the phase is almost constant along the pulses, which indicates that they are nearly transform-limited. To compare the experimental results with numerical simulations, we numerically resolved the nonlinear Schrödinger equation including the measured experimental fiber parameters and higher-order effects such as third-order dispersion, self-steepening and Raman scattering [28]. The results are plotted in circles. The experimental and numerical results are in good agreement, indicating an easy and reliable design of our source. We can notice a π phase shift between two consecutive pulses which originates from the initial beating and which is conserved during the whole compression stage in good agreement with numerical results. Figure 1b shows the corresponding experimental spectrum of the 1.5-THz pulse train. We observe a broad frequency comb, resulting from the multiple four wave mixing process taking place into the HNLF as well as spontaneous modulation instability provided by each frequency component of the spectrum [7], [20].
At 1.7 THz the optimum compression was achieved in only 16 m of HNLF fiber and for an input average power of 5.5 W. Figure 3a illustrates the experimental results and presents the same features as those of Fig. 2. The retrieved intensity profile (solid line) shows well-separated pulses with a FWHM of about 110 fs in good agreement with numerical simulations (circles). Figure 3b shows the result obtained for the 2-THz pulse source in the same segment of fiber and for an average power of 5.3 W. As in the previous result, the pulses (solid-line) are clearly well separated with a FWHM of 110 fs and fit well the numerical results (circles). Finally, the phase (dashed-line) is quite flat along the pulses, indicating that they are nearly transform-limited.
Figure 3 (a) FROG results for the 1.7-THz pulse train: Retrieved intensity profile (solid line), retrieved phase (dashed line), simulation results (circles), inset shows the experimental FROG trace; (b) same for the 2-THz pulse train.
Twofold multiplication of the repetition rate:
In this section, we present the generation of a record 3.4-THz repetition rate pulse source by means of a twofold multiplication of the bit rate through self-imaging Talbot effect [29]. In the temporal Talbot effect the spectral components of a pulse train that is incident upon a linearly dispersive element acquire phase delays that can cause either a regeneration of the
4
original pulse train (integral self-imaging Talbot effect) or the generation of a pulse train at a multiple of the original repetition rate (fractional Talbot effect) [30]-[32].
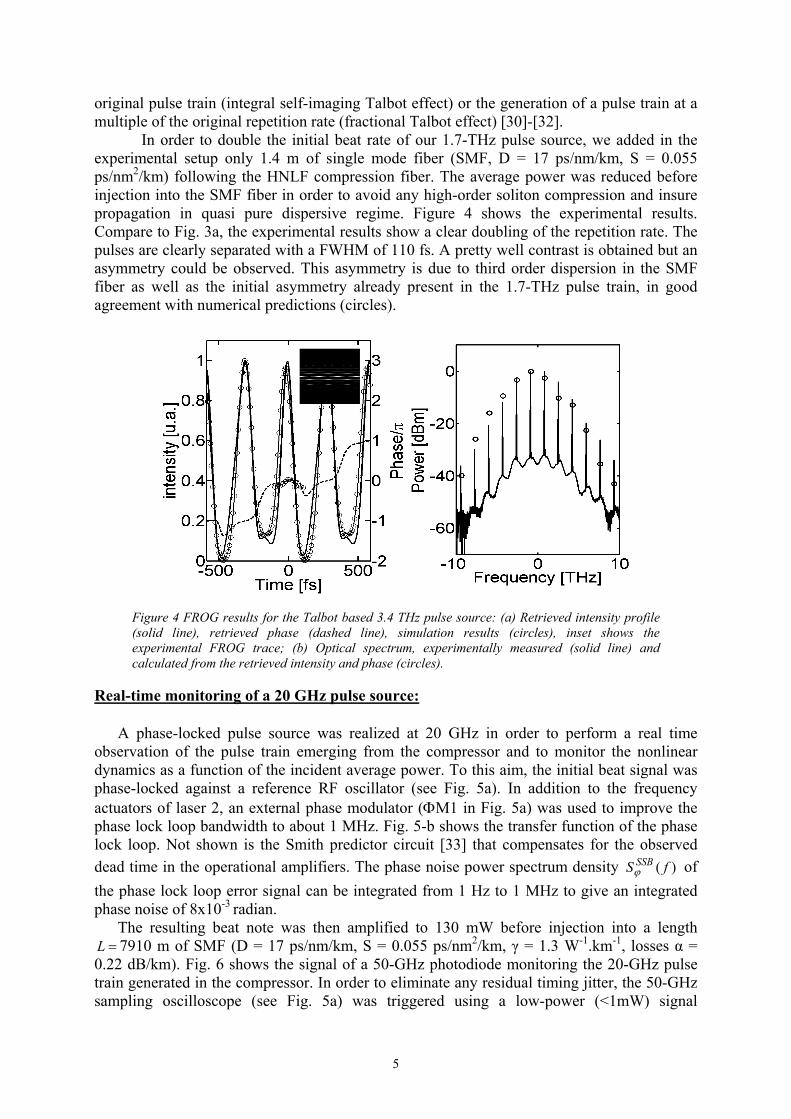
In order to double the initial beat rate of our 1.7-THz pulse source, we added in the experimental setup only 1.4 m of single mode fiber (SMF, D = 17 ps/nm/km, S = 0.055 ps/nm2/km) following the HNLF compression fiber. The average power was reduced before injection into the SMF fiber in order to avoid any high-order soliton compression and insure propagation in quasi pure dispersive regime. Figure 4 shows the experimental results. Compare to Fig. 3a, the experimental results show a clear doubling of the repetition rate. The pulses are clearly separated with a FWHM of 110 fs. A pretty well contrast is obtained but an asymmetry could be observed. This asymmetry is due to third order dispersion in the SMF fiber as well as the initial asymmetry already present in the 1.7-THz pulse train, in good agreement with numerical predictions (circles).
Figure 4 FROG results for the Talbot based 3.4 THz pulse source: (a) Retrieved intensity profile (solid line), retrieved phase (dashed line), simulation results (circles), inset shows the experimental FROG trace; (b) Optical spectrum, experimentally measured (solid line) and calculated from the retrieved intensity and phase (circles).
Real-time monitoring of a 20 GHz pulse source:
A phase-locked pulse source was realized at 20 GHz in order to perform a real time observation of the pulse train emerging from the compressor and to monitor the nonlinear dynamics as a function of the incident average power. To this aim, the initial beat signal was phase-locked against a reference RF oscillator (see Fig. 5a). In addition to the frequency actuators of laser 2, an external phase modulator (ΦM1 in Fig. 5a) was used to improve the phase lock loop bandwidth to about 1 MHz. Fig. 5-b shows the transfer function of the phase lock loop. Not shown is the Smith predictor circuit [33] that compensates for the observed dead time in the operational amplifiers. The phase noise power spectrum density of the phase lock loop error signal can be integrated from 1 Hz to 1 MHz to give an integrated phase noise of 8x10
)( fS SSBϕ
-3 radian. The resulting beat note was then amplified to 130 mW before injection into a length 7910 m of SMF (D = 17 ps/nm/km, S = 0.055 ps/nm=L 2/km, γ = 1.3 W-1.km-1, losses α =
0.22 dB/km). Fig. 6 shows the signal of a 50-GHz photodiode monitoring the 20-GHz pulse train generated in the compressor. In order to eliminate any residual timing jitter, the 50-GHz sampling oscilloscope (see Fig. 5a) was triggered using a low-power (<1mW) signal
5
transmitted through a second fiber of identical length . As the oscilloscope cannot be triggered at 20 GHz, a latch circuit is used to convert the 20 GHz signal to a frequency of 303 MHz. The pulse shapes are in excellent quantitative agreement with numerical predictions (Fig. 6a, circles) which take into account the time response of the photodetection system. The pulses are well-separated without noticeable pedestal, and the FWHM is found to be 11 ps. The eye-diagram, represented in Fig. 6b, is clear open and does not exhibit large timing jitter, thus underlining the efficiency of the phase lock loop to stabilize the absolute value of the beat note frequency.
L
Figure 5 (a) Set-up for real-time monitoring of the 20-GHz fibre compressor output (b) Transfer function of the feedback electronics (c) Total gain of the phase lock loop.
8.9 ps/div(a) (b)
Figure 6 (a) Intensity profile measured with a 50GHz optical sampling oscilloscope (solid line) compared with numerical simulations (circles). (b) Eye-diagram of the 20 GHz-pulse train.
The phase of the pulses obtained at the output of the fiber compressor, with respect to the
initial beat note, was characterized using a HF mixer and the spectrum analyzer shown in Fig. 5-a, to check for a possible noise added by the nonlinear compression. Using the measured power spectrum density (PSD) of the incoming beat note single sideband phase noise one can calculate the noise expected on the phase difference:
SSBSϕ
6
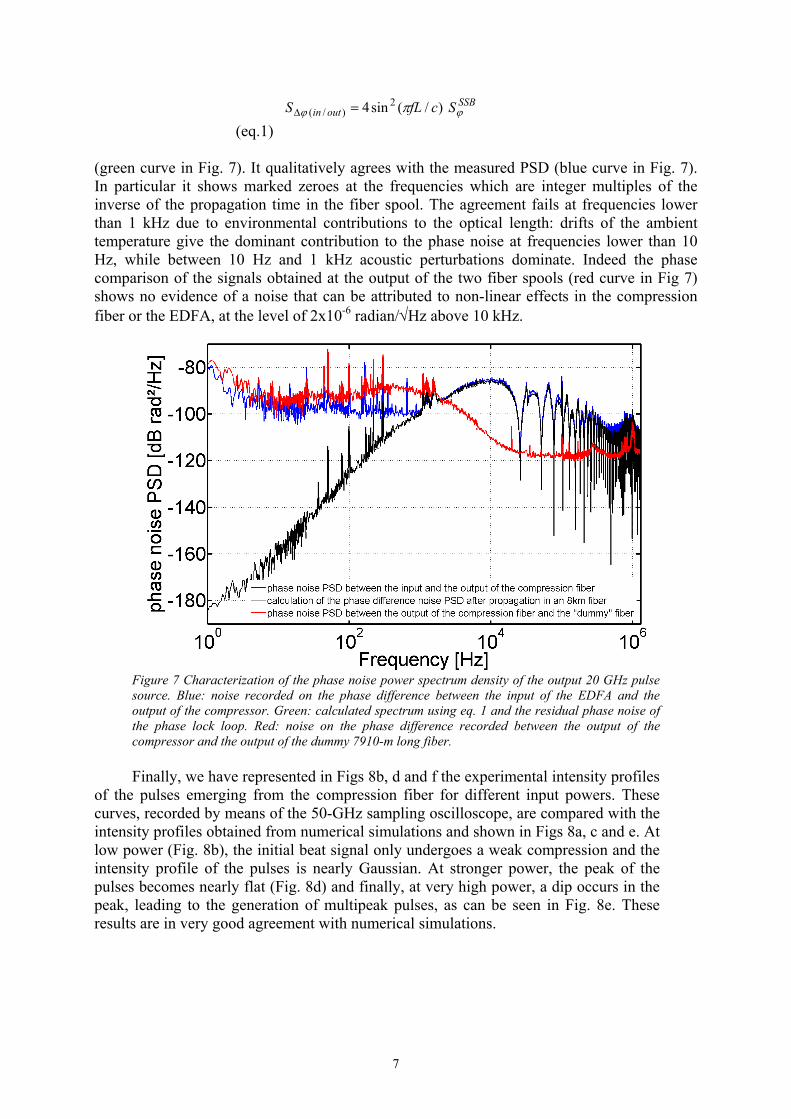
SSBoutin ScfLS ϕϕ π )/(sin4 2
)/( =Δ (eq.1)
(green curve in Fig. 7). It qualitatively agrees with the measured PSD (blue curve in Fig. 7). In particular it shows marked zeroes at the frequencies which are integer multiples of the inverse of the propagation time in the fiber spool. The agreement fails at frequencies lower than 1 kHz due to environmental contributions to the optical length: drifts of the ambient temperature give the dominant contribution to the phase noise at frequencies lower than 10 Hz, while between 10 Hz and 1 kHz acoustic perturbations dominate. Indeed the phase comparison of the signals obtained at the output of the two fiber spools (red curve in Fig 7) shows no evidence of a noise that can be attributed to non-linear effects in the compression fiber or the EDFA, at the level of 2x10⁻⁶ radian/√Hz above 10 kHz.
Figure 7 Characterization of the phase noise power spectrum density of the output 20 GHz pulse source. Blue: noise recorded on the phase difference between the input of the EDFA and the output of the compressor. Green: calculated spectrum using eq. 1 and the residual phase noise of the phase lock loop. Red: noise on the phase difference recorded between the output of the compressor and the output of the dummy 7910-m long fiber.
Finally, we have represented in Figs 8b, d and f the experimental intensity profiles
of the pulses emerging from the compression fiber for different input powers. These curves, recorded by means of the 50-GHz sampling oscilloscope, are compared with the intensity profiles obtained from numerical simulations and shown in Figs 8a, c and e. At low power (Fig. 8b), the initial beat signal only undergoes a weak compression and the intensity profile of the pulses is nearly Gaussian. At stronger power, the peak of the pulses becomes nearly flat (Fig. 8d) and finally, at very high power, a dip occurs in the peak, leading to the generation of multipeak pulses, as can be seen in Fig. 8e. These results are in very good agreement with numerical simulations.
7
0 50 1000
0.5
1
0 50 1000
0.5
1
0 50 1000
0.5
1
0 50 1000
0.5
1
0 50 1000
0.5
1
0 50 1000
0.5
1
Time (ps)Time (ps) Time (ps)
Inte
nsity
(arb
. uni
ts)
(a)
(b)
(c)
(d)
(e)
(f)
Figure 8. Intensity profile measured with a 50 GHz optical sampling oscilloscope (bottom) compared with numerical simulations (top). (a) and (b) : 40mW, (c) and (d) : 250 mW, (e) and (f) : 300 mW.
Conclusion:
In this work, we have reported recent progress on the design of all-fibered ultra-high
repetition-rate pulse sources around 1550 nm. Based on the nonlinear compression of an initial beating in optical fibers through a multiple four-wave mixing process, we have experimentally demonstrated that versatile high quality pulse sources having repetition rates ranging from 20 GHz to 2 THz could be achieved. Thanks to an efficient control of the repetition rate though the phase-locked of the initial beating against a RF reference we succeed, for the first time of our knowledge, to monitor the nonlinear dynamics of the multiple four wave mixing process occurring into the compression fiber. Finally, by means of the well-known self imaging Talbot effect, we achieved to generate a 3.4-THz record repetition rate pulse train with 110 fs full width at half maximum.
Acknowledgement:
We would like to acknowledge financial support of the Agence Nationale de la Recherche
(BLAN07-1_183657 ILIADE project). We also thank LeCroy (Xavier Boissier) for kindly providing an SO50 optical head.
References: [1] P. A. Andrekson, and Mathias Westlund, “Nonlinear optical fiber based high resolution all-optical
waveform sampling,” Laser Photon. Rev., vol. 1, pp. 231-248, 2007. [2] H. Takara, S. Kawanishi and M. Saruwatari, “Optical signal eye diagram measurement with
subpicosecond resolution using optical sampling,” Electron. Lett., vol. 32, pp. 1399-1400, 1996. [3] M. Nakazawa, T. Yamamoto, and K. R. Tamura, “1.28 Tbit/s-70 km OTDM transmission using third-
and fourth-order simultaneous dispersion compensation with a phase modulator,” Electron. Lett., vol. 36, pp. 2027–2029, 2000.
[4] H.G. Weber, S. Ferber, M. Kroh, C. Schmidt-Langhorst, R. Ludwig, V. Marembert, C. Boerner, F. Futami, S. Watanabe and C. Schubert, “Single channel 1.28 Tbit/s and 2.56 Tbit/s DQPSK transmission,” ECOC 2005, Glasgow, Scotland, UK (Post-Deadline Paper Th 4.1.2).
[5] T. Yamamoto, E. Yoshida and M. Nakazawa, “Ultrafast nonlinear optical loop mirror for demultiplexing 640 Gbit/s TDM signal,” Electron. Lett., vol. 34, pp. 1013-1014, 1998.
8
[6] G. Meloni, G. Berrettini, M. Scaffardi, A. Bogoni, L. Poti and M. Guglielmucci, “250-times repetition frequency multiplication for 2.5-THz clock signal generation”, Electron. Lett., vol. 41, pp. 1294-1295, 2005.
[7] F. C. Cruz, “Optical frequency combs generated by four-wave mixing in optical fibers for astrophysical spectrometer calibration and metrology,” Opt. Express, vol. 16, pp. 3267-13275, 2008.
[8] A. Bogoni, M. Scaffardi, P. Ghelfi and L. Poti, “Nonlinear Optical Loop Mirrors : Investigation Solution and Experimental Validation for Undesirable Counterpropagating Effects in All-Optical Signal Processing”, IEEE J. Sel. Top. Quantum Electron., vol. 10, pp. 1115-1123, 2004.
[9] J. Fatome, S. Pitois, A. Kamagate, G. Millot, D. Massoubre and J-L. Oudar, “All-optical reshaping based on a passive saturable absorber microcavity device for future 160-Gb/s applications”, IEEE Photon. Technol. Lett., vol. 19, pp. 245–247, 2007.
[10] P. V. Mamyshev, S. V. Chernikov, and E. M. Dianov, “Generation of fundamental soliton trains for high-bit-rate optical communication lines,” IEEE J. Quantum Electron., vol. 27, pp. 2347-2355, 1991.
[11] A. D’errico, C. Loiacono, M. Presi, G. Contestabile, and E. Ciaramella, “Widely tunable 40 GHz pulse source for 160 Gbit/s OTDM by simultaneous soliton generation and compression,” ECOC’03, Rimini, Italy, Paper We 2.6.5, 2003.
[12] S. V. Chernikov, J. R. Taylor, and R. Kashyap, “Comblike dispersion profiled fiber for soliton pulse train generation,” Opt. Lett., vol. 19, pp. 539-541, 1994.
[13] S.V. Chernikov, J.R. Taylor, and R. Kashyap, “Experimental demonstration of step-like dispersion profiling in optical fibre for soliton pulse generation and compression,” Electron. Lett. Vol. 30, pp. 433–435, 1994.
[14] K. Igarashi, H. Tobioka, M. Takahashi, T. Yagi, and S. Namiki, “Widely wavelength-tunable 40 GHz femtosecond pulse source based on compression of externally-modulated pulse using 1.4km comb-like profiled fibre,” Electron. Lett., vol. 41, pp. 797–798, 2005.
[15] Y. Ozeki, S. Takasaka, T. Inoue, K. Igarashi, J. Hiroishi, R. Sugizaki, M. Sakano, and S. Namiki, “Nearly Exact Optical Beat-to-Soliton Train Conversion Based on Comb-Like Profiled Fiber Emulating a Polynomial Dispersion Decreasing Profile,” IEEE Photon. Technol. Lett., vol. 17, pp. 1698–1700, 2005.
[16] T. Inoue, and S. Namiki, “Pulse compression techniques using highly nonlinear fibers,” Laser Photon. Rev., vol. 2, pp. 83-99, 2008
[17] S. Trillo, S. Wabnitz, and T.A.B. Kennedy, “Non linear dynamics of dual-frequency-pumped multiwave mixing in optical fibers”, Phys. Rev. A., vol. 50, pp 1732-1747, 1994.
[18] S. Pitois, J. Fatome and G. Millot, “Generation of a 160 GHz transform-limited pedestal-free pulse train through multiwave mixing compression of a dual-frequency beat signal”, Opt. Lett., vol. 27, pp. 1729-1731, 2002.
[19] J. F. L. Freitas, C. J. S. de Matos, and A. S. L. Gomes, “Simultaneous pulse train generation and wavelength conversion in a highly nonlinear fibre due to multiwave mixing,” presented at the ECOC 2005, Glasgow, U.K., Paper Mo 4.5.5.
[20] A. Cerqueira Sodre, J. M. Chavez Boggio, A. A. Rieznik, H. E. Hernandez-Figueroa, H. L. Fragnito, and J. C. Knight, “Highly efficient generation of broadband cascaded four-wave mixing products,” Opt. Express, vol. 16, pp. 2816-2828, 2008.
[21] J. Fatome, S. Pitois, and G. Millot, “320/640 GHz high-quality pulse sources based on multiple four-wave mixing in highly nonlinear optical fibre,” Electron. Lett., vol. 41, pp. 1391-1392, 2005.
[22] J. Fatome, S. Pitois, and G. Millot, “20-GHz-to-1-THz repetition rate pulse sources based on multiple four-wave mixing in optical fibers,” IEEE J. Quantum Electron., vol. 42, pp. 1038-1046, 2006.
[23] C. Finot, J. Fatome, S. Pitois, and G. Millot, “All-fibered high-quality low duty-cycle 20-GHz and 40-GHz picosecond pulse sources,” IEEE Photon. Technol. Lett., vol. 19, pp. 1711-1713, 2007.
[24] C. Fortier, B. Kibler, J. Fatome, C. Finot, S. Pitois, and G. Millot, “All-fibered high-quality low duty-cycle 160-GHz femtosecond pulse source,” Laser Phys. Lett., vol. 5, pp. 817-820, 2008.
[25] R. Trebino, K.W. Delong, D.N. Fittinghoff, J.N Sweetser, M.A. Krumbugel, B.A. Richman and D.J. Kane, “Measuring ultrashort laser pulses in the time-frequency domain using frequency-resolved optical gating”, Rev. Sci. Instrum., vol. 68, pp. 3277-3295, 1997.
[26] J. Fatome, S. Pitois, and G. Millot, “Sensitivity of SHG-FROG for the characterization of ultrahigh-repetition-rate telecommunication laser sources,” Opt. Fiber. Technol., vol. 10, pp. 73-78, 2004.
[27] J. Fatome, S. Pitois, and G. Millot, “Measurement of nonlinear and chromatic dispersion parameters of optical fibers using modulation instability,” Opt. Fiber Technol., vol. 12, pp. 243–250, 2006.
[28] G. P. Agrawal, Nonlinear Fiber Optics, third ed., Academic Press, New York, 2001. [29] J. Azaña, and M. A. Muriel, “Temporal self-imaging effects: Theory and application for multiplying
pulse repetition rates,” IEEE J. Sel. Top. Quantum Electron., vol. 7, pp. 728-744, 2001. [30] P. Petropoulos, M. Ibsen, M. N. Zervas, and D. J. Richardson, "Generation of a 40-GHz pulse stream by
pulse multiplication with a sampled fiber Bragg grating," Opt. Lett., vol. 25, pp. 521-523, 2000.
9
10
[31] J. Fatome, S. Pitois, and G. Millot, “Influence of third-order dispersion on the temporal Talbot effect”, Opt. Commun., vol. 234, pp. 29-34, 2004.
[32] J. A. Bolger, P. Hu, J. T. Mok, J. L. Blows and B. J. Eggleton, “Talbot self-imaging and cross-phase modulation for generation of tunable high repetition rate pulse trains,” Opt. Commun., vol. 249, pp. 431–439, 2005
[33] K. Warwick and D. Rees, Industrial Digital Control Systems, IET, 2nd ed., 1988. See section 4-6-6.