Slide 3— Statistics for Life Science (Week 5-2) — Multiple regression and analysis of variance
Linear regression
Simple linear regression may describe the relation between twovariables:
●●●
●● ●
●●
●●
●
●●●●
●
●
●●●
●●
●●
●●
● ●●
●●
●
65 70 75 80 85
1020
3040
5060
70
height
volu
me
●●●
●●●
●●
●●
●
●●●●
●
●
●●●
●●
●●
●●
●●●
●●
●
8 10 12 14 16 18 20
1020
3040
5060
70
diameter
volu
me
Slide 4— Statistics for Life Science (Week 5-2) — Multiple regression and analysis of variance
Linear regression
Regression of volume on height:
Coefficients:
Estimate Std. Error t value Pr(>|t|)
(Intercept) -87.1236 29.2731 -2.976 0.005835 **
Height 1.5433 0.3839 4.021 0.000378 ***
Regression of volume on diameter:
Coefficients:
Estimate Std. Error t value Pr(>|t|)
(Intercept) -36.9435 3.3651 -10.98 7.62e-12 ***
Girth 5.0659 0.2474 20.48 < 2e-16 ***
But what if both of the explanatory variables are needed in a goodmodel for the volume?
Slide 5— Statistics for Life Science (Week 5-2) — Multiple regression and analysis of variance
Multiple regression
The multiple linear regression model with d explanatory variables isgiven as
yi = α + β1xi1 + · · ·+ βdxid + ei , i = 1, . . . ,n,
where ei ∼ N(0,σ2).It has the same form as the simple linear regression, but with extraexplanatory variables.Three parameters in the model for the mean:
• α intercept with the y -axis when xi1 = · · · = xid = 0
• β1 and β2 are the partial slopes, giving the y if the otherexplanatory variables are held constant.
The residual standard deviation, σ , also enters the model.
Slide 6— Statistics for Life Science (Week 5-2) — Multiple regression and analysis of variance
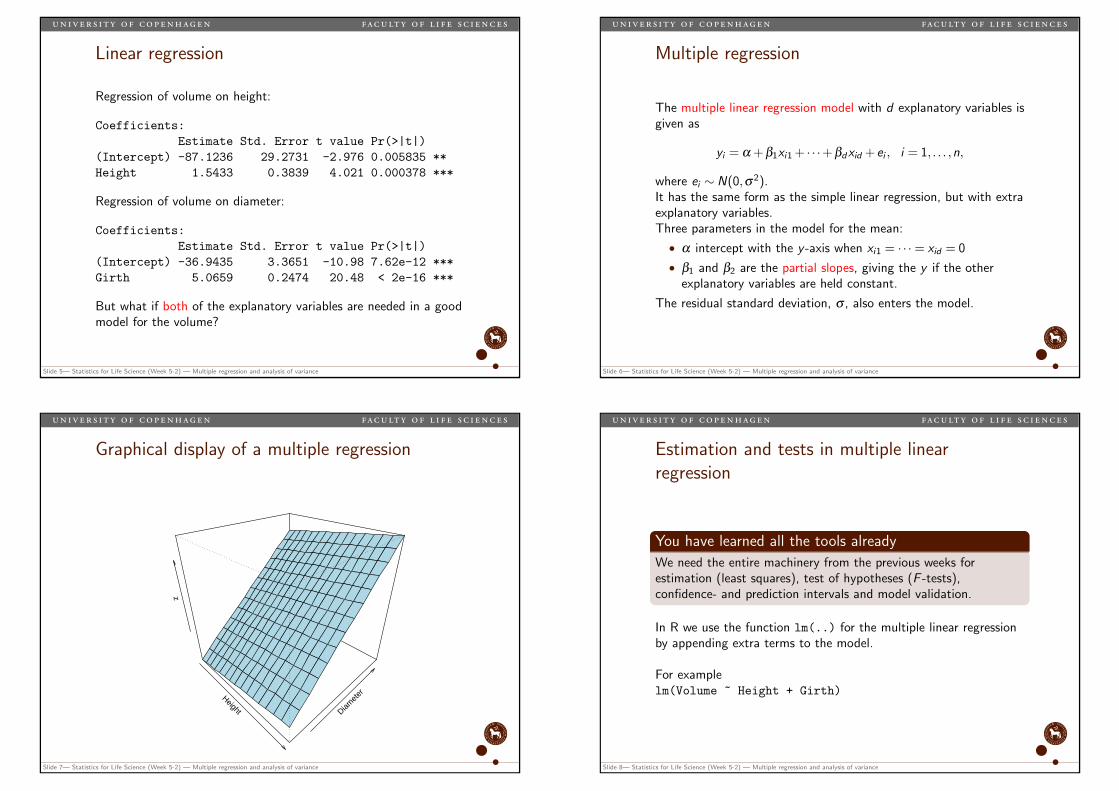
Graphical display of a multiple regression
Height Diamet
er
z
Slide 7— Statistics for Life Science (Week 5-2) — Multiple regression and analysis of variance
Estimation and tests in multiple linearregression
You have learned all the tools already
We need the entire machinery from the previous weeks forestimation (least squares), test of hypotheses (F -tests),confidence- and prediction intervals and model validation.
In R we use the function lm(..) for the multiple linear regressionby appending extra terms to the model.
For examplelm(Volume ~ Height + Girth)
Slide 8— Statistics for Life Science (Week 5-2) — Multiple regression and analysis of variance
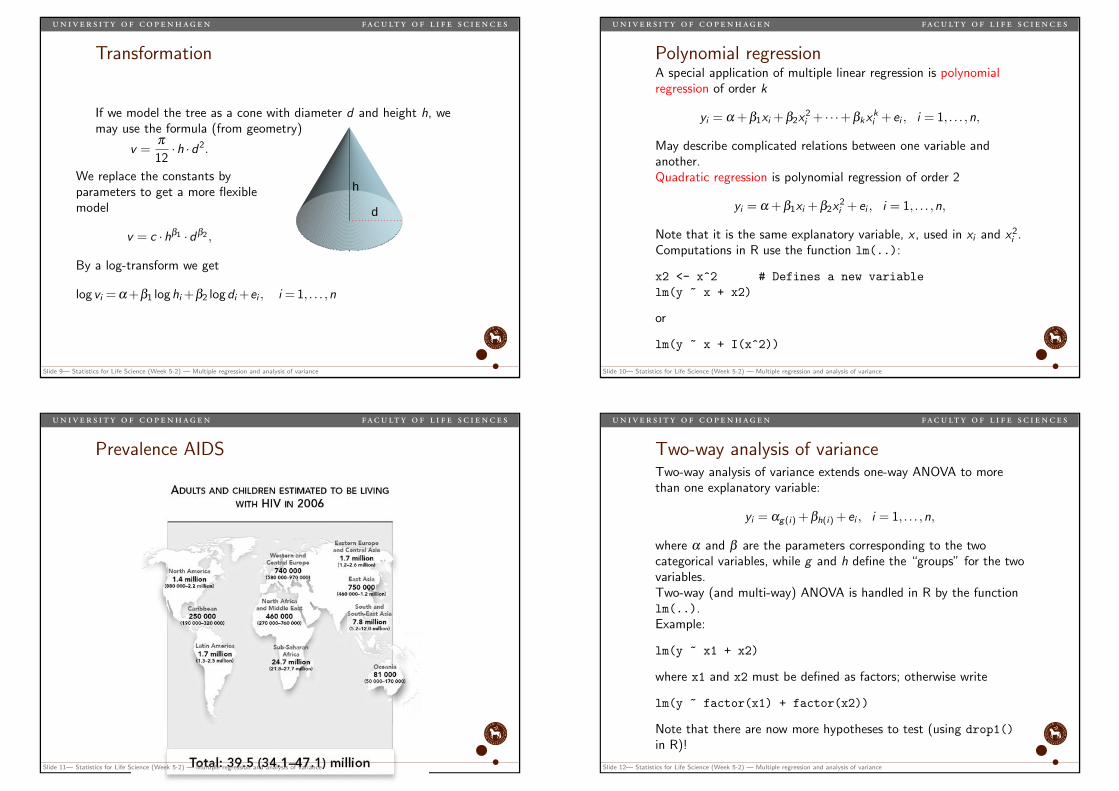
Transformation
If we model the tree as a cone with diameter d and height h, wemay use the formula (from geometry)
v =π
12·h ·d2.
We replace the constants byparameters to get a more flexiblemodel
Slide 9— Statistics for Life Science (Week 5-2) — Multiple regression and analysis of variance
Polynomial regressionA special application of multiple linear regression is polynomialregression of order k
yi = α + β1xi + β2x2i + · · ·+ βkx
ki + ei , i = 1, . . . ,n,
May describe complicated relations between one variable andanother.Quadratic regression is polynomial regression of order 2
yi = α + β1xi + β2x2i + ei , i = 1, . . . ,n,
Note that it is the same explanatory variable, x , used in xi and x2i .Computations in R use the function lm(..):
x2 <- x^2 # Defines a new variable
lm(y ~ x + x2)
or
lm(y ~ x + I(x^2))
Slide 10— Statistics for Life Science (Week 5-2) — Multiple regression and analysis of variance
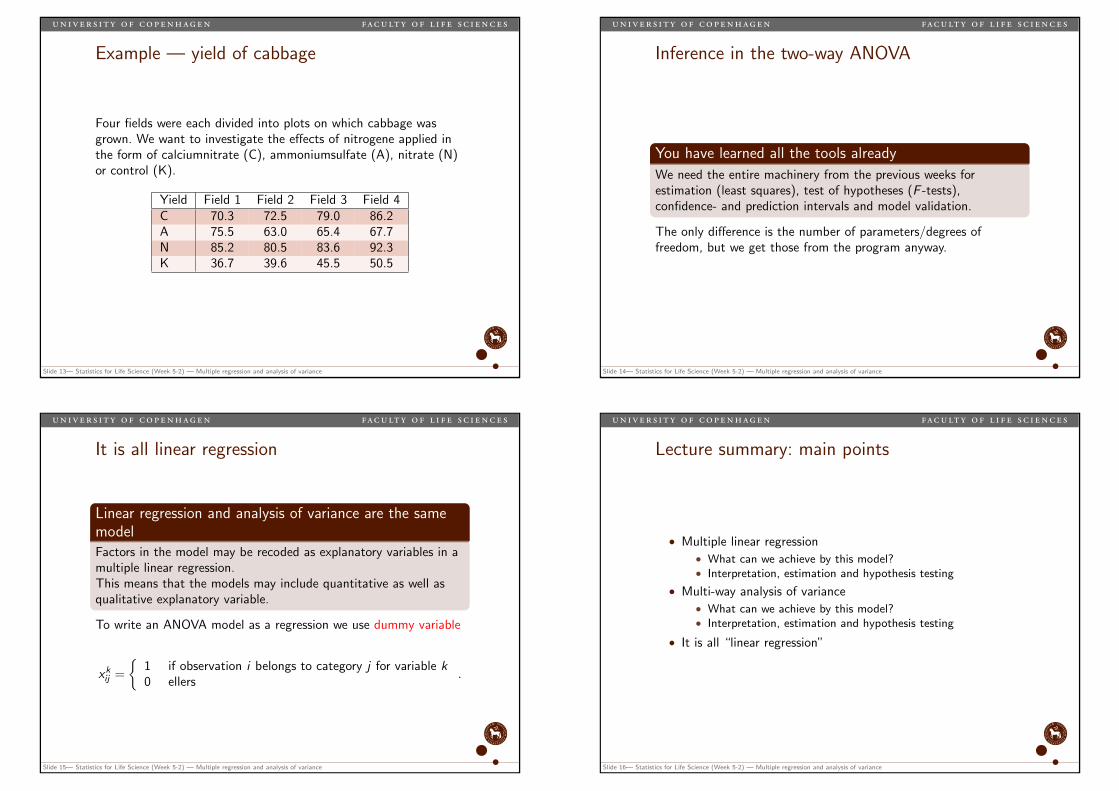
Prevalence AIDS
Slide 11— Statistics for Life Science (Week 5-2) — Multiple regression and analysis of variance
Two-way analysis of varianceTwo-way analysis of variance extends one-way ANOVA to morethan one explanatory variable:
yi = αg(i) + βh(i) + ei , i = 1, . . . ,n,
where α and β are the parameters corresponding to the twocategorical variables, while g and h define the “groups” for the twovariables.Two-way (and multi-way) ANOVA is handled in R by the functionlm(..).Example:
lm(y ~ x1 + x2)
where x1 and x2 must be defined as factors; otherwise write
lm(y ~ factor(x1) + factor(x2))
Note that there are now more hypotheses to test (using drop1()
in R)!
Slide 12— Statistics for Life Science (Week 5-2) — Multiple regression and analysis of variance
Example — yield of cabbage
Four fields were each divided into plots on which cabbage wasgrown. We want to investigate the effects of nitrogene applied inthe form of calciumnitrate (C), ammoniumsulfate (A), nitrate (N)or control (K).
Yield Field 1 Field 2 Field 3 Field 4C 70.3 72.5 79.0 86.2A 75.5 63.0 65.4 67.7N 85.2 80.5 83.6 92.3K 36.7 39.6 45.5 50.5
Slide 13— Statistics for Life Science (Week 5-2) — Multiple regression and analysis of variance
Inference in the two-way ANOVA
You have learned all the tools already
We need the entire machinery from the previous weeks forestimation (least squares), test of hypotheses (F -tests),confidence- and prediction intervals and model validation.
The only difference is the number of parameters/degrees offreedom, but we get those from the program anyway.
Slide 14— Statistics for Life Science (Week 5-2) — Multiple regression and analysis of variance
It is all linear regression
Linear regression and analysis of variance are the samemodelFactors in the model may be recoded as explanatory variables in amultiple linear regression.This means that the models may include quantitative as well asqualitative explanatory variable.
To write an ANOVA model as a regression we use dummy variable
xkij =
{1 if observation i belongs to category j for variable k0 ellers
.
Slide 15— Statistics for Life Science (Week 5-2) — Multiple regression and analysis of variance
Lecture summary: main points
• Multiple linear regression• What can we achieve by this model?• Interpretation, estimation and hypothesis testing
• Multi-way analysis of variance• What can we achieve by this model?• Interpretation, estimation and hypothesis testing
• It is all “linear regression”
Slide 16— Statistics for Life Science (Week 5-2) — Multiple regression and analysis of variance