54
MULTISCALE ANALYSIS OF EMULSIONS: A COMPUTATIONAL FLUID DYNAMICS APPROACH Juan Pablo Gallo Molina Universidad de los Andes Department of Chemical Engineering 2017

MULTISCALE ANALYSIS OF EMULSIONS: A COMPUTATIONAL FLUID
DYNAMICS APPROACH
Juan Pablo Gallo Molina
Universidad de los Andes
Department of Chemical Engineering
2017

Advisor
Prof. Dr. Ing. Oscar Alvarez
Director Associate Professor Department of Chemical Engineering Faculty of Engineering Universidad de los Andes Referees Prof. Dr. Ing. Nicolás Ríos Prof. Dr. Ing. Andrés González Assistant Professor Associate Professor Department of Chemical Engineering Department of Mechanical Engineering Faculty of Engineering Faculty of Engineering Universidad de los Andes Universidad de los Andes

TABLE OF CONTENTS
Chapter 1. Introduction ............................................................................................ 1
Chapter 2. Methodology .......................................................................................... 5
2.1. Materials ....................................................................................................... 5
2.2. Methods ........................................................................................................ 5
2.2.1. Experimental ........................................................................................... 5
2.2.2. CFD Modelling ........................................................................................ 8
Chapter 3. Multiscale Analysis and CFD Modelling of Water-in-Oil Emulsions ..... 15
3.1. Introduction. ................................................................................................ 15
3.2. Results and Analysis. .................................................................................. 15
3.3. Conclusions................................................................................................. 26
Chapter 4. Multiscale Analysis and CFD Modelling of Oil-in-Water Emulsions ..... 28
4.1. Introduction. ................................................................................................ 28
4.2. Results and Analysis. .................................................................................. 29
4.3. Conclusions................................................................................................. 43
Conclusions ........................................................................................................... 44
Bibliography ........................................................................................................... 46

1
Chapter 1. Introduction*
Emulsions are thermodynamically unstable colloids composed by immiscible liquids.
Due to this instability, its preparation necessitates the addition energy and surfactant
agents (Leal-Calderon et al., 2007). These systems are broadly used in diverse
industrial applications (e.g. cosmetics, pharmaceutics, food, oil recovery), which
suggests that an adequate knowledge of its behavior is of importance. There is,
however, a large number of variables that affect the final properties of an emulsion
product. Among these variables, disperse phase concentration, continuous phase
characteristics and process variables (i.e. mixing velocity, impeller type, etc.) are of
special importance.
Several authors have indicated that numerous factors on different levels (i.e.
molecular, microscopic and macroscopic) intertwine in the process of determining
the properties of an emulsion. For instance, rheological properties are highly
influenced by microscopic variables such as fraction of dispersed phase and droplet
size distribution (Babak et al., 2003; Derkach, 2009). Additionally, Azodi & Nazar
(2013) studied the interrelationship between viscosity, stability and surface tension,
while Acedo-Carrillo et al. (2006) analyzed the influence of zeta-potential on droplet
diameter and chain size of the dispersed phase in water-in-oil (W/O) emulsions. On
the other hand, Roldan-Cruz et al. (2016) pointed out that environmental conditions,
droplet size distribution and interfacial phenomena affect stability, a crucial property
in industrial applications. The authors also found that surfactant concentration has a
significant impact on zeta potential and indicated that the ability of nonionic
surfactants to stabilize emulsions is related to changes introduced to the interfacial
rheology and interactions between molecules at the interface. Wu et al. (2014)
* Partially redrafted from: Gallo-Molina, J. P.; Ratkovich, N.; Álvarez, Ó. Multiscale Analysis of Water-
in-Oil Emulsions : A Computational Fluid Dynamics Approach. Ind. Eng. Chem. Res. 2017, 56, 7757−7767 and Gallo-Molina, J. P.; Ratkovich, N.; Álvarez, Ó. The Application of Computational Fluid Dynamics to the Multiscale Study of Oil-in-Water Emulsions. Ind. Eng. Chem. Res. Submitted.

2
discussed that environmental variables also impact the formation of zeta potential
and studied the effects of functional groups on this variable.
In his study, Sagis (2011) stablished that the molecular level, represented by the
dynamics at the interface, affects the macroscopic responses in emulsions and other
similar systems. Moreover, Dowding et al. (2001) investigated the effect of process
variables on particle size distributions, while Kowalska (2016) studied the relation
between the former variable and stability.
Taking this large number of relevant variables, a multiscale approach is an adequate
approximation for studying emulsion systems. This approach consists in the building
of relations between the internal dynamics of a system and its performance as a
product (Pradilla et al., 2015). Recently, Alvarez et al. (2010) and Pradilla et al.
(2015) implemented this approximation into emulsions and found both numerical and
qualitative relations among process (i.e. type of propeller), macroscopic (i.e.
rheological characteristics), microscopic (i.e. particle size distribution) and molecular
(i.e. near infrared spectroscopy measurements) variables. Incorporated energy was
used as a transversal factor.
Taking into account that emulsification process variables are arguably among the
most easily controllable factors, it is convenient to gain insight into its effects on other
relevant variables. As mentioned above, this endeavor can be accomplished via a
multiscale study. However, one possible shortcoming is the fact that experimental
measurements often cannot reflect the conditions in the entire volume of the studied
system but instead offer average results. In turn, this could hide important factors
such as particle size gradients in the mixing vessel. For this reason, this work sought
to couple Computational Fluid Dynamics (CFD) with a multiscale analysis in order to
analyze the relationships between process, macroscopic, microscopic and
molecular properties in both Water-in-Oil and Oil-in-Water emulsions and to better
understand the link to process variables and the three-dimensional behavior of
macroscopic and microscopic responses.
CFD is a technique that allows for the description of the behavior of one or more
fluids under several conditions. It solves numerically physical equations and uses a

3
discretization of a geometric domain via the finite volume method. Besides
conservation equations, it is possible to couple, among others, rheological and
phase interaction models (Blazek, 2001). In the field of emulsions, several
approaches have been proposed for the modelling of particle size distribution and
the phenomena affecting it (e.g. coalescence and break-up). Among those,
population balances models (PBM) are, arguably, the most rigorous but other
statistically based models such as S-gamma are also viable (Agterof et al., 2003;
Roudsari et al., 2012).
This work have been divided into several chapters for the reason that it is the
compilation of two articles previously published in a peer-reviewed journal. Chapter
two discusses the methodology implemented for both studies; including the
experimental methods as well as the numerical models used during CFD
simulations. Generally speaking, a multiscale approximation was implemented for
the study of water-in-oil and oil-in-water (O/W) emulsions in a range of
concentrations from 10% to 90%. Emulsions were prepared using a semibatch
process and four impeller geometries were assessed.
In chapter three, W/O emulsions are studied with the mentioned approximation. For
this endeavor, the elastic modulus was chosen as a representative macroscopic
variable, while the droplet size distribution was the studied microscopic response.
Stability measurements were also taken into consideration and incorporated energy
was analyzed as a transversal variable. As mentioned before, the relationships
among these variables were assessed in a wide range of dispersed phase
concentrations for four types of impeller. CFD simulations were performed in the
same range of concentrations for one impeller geometry.
In chapter four, O/W emulsions are investigated under a similar methodology. In
order to expand the scope of the multiscale approach, the molecular realm was
included via zeta potential measurements and an additional impeller geometry was
modelled with CFD. Similarly to Chapter 3, the combination of numerical and
experimental techniques allowed for the observation of relevant interrelationships
among process, macroscopic, microscopic and molecular variables and the three-

4
dimensional profiles behind the averaged experimental results. Furthermore, it was
found that the dynamics of O/W emulsions are significantly different to W/O
emulsions under the study conditions.

5
Chapter 2. Methodology*
2.1. Materials
Emulsions were prepared using mineral oil (USP-grade) and Mili-Q de-ionized
water. Two commercial non-ionic surfactants were used: Span 80 (sorbitan
monooleate), oil soluble, HLB 4.3, and Tween 20 (polisorbate 20), water soluble,
HLB 16.7.
CFD modelling was conducted using commercial software STAR-CCM+, v. 11.04
(Siemens®). CAD geometry was constructed using Autodesk® Inventor 2017.
2.2. Methods
2.2.1. Experimental
2.2.1.1. Formulation and emulsification process.
W/O emulsions (10 to 90% dispersed phase concentration) were prepared using a
1.5 (w.t. %) total surfactant mixture concentration and a Hydrophile-Lipophile
Balance (HLB) of 5. The interfacial tension (measured using the pendant drop
technique in an Attension® Theta optical tensiometer) was 9.51 mN/m, which was
within the reported ranges in the literature (Boxall et al., 2010; Peng et al., 2011) for
similar systems. O/W emulsions were prepared in the same range of concentrations
with a 4 (wt %) total surfactant mixture concentration and a HLB of 13. The
surfactant concentrations was selected during preliminary tests. The choice of
emulsifiers and HLB was made in accordance to common industry practice
(Uniqema, 2004).
A semibatch process consisting of three steps was used. Initially, Span 80 was
added to the oil phase and Tween 20® was added to the aqueous phase. Both
mixtures were separately homogenized for 15 min at 300 rpm. During the second
* Partially redrafted from: Gallo-Molina, J. P.; Ratkovich, N.; Álvarez, Ó. Multiscale Analysis of Water-
in-Oil Emulsions : A Computational Fluid Dynamics Approach. Ind. Eng. Chem. Res. 2017, 56, 7757−7767 and Gallo-Molina, J. P.; Ratkovich, N.; Álvarez, Ó. The Application of Computational Fluid Dynamics to the Multiscale Study of Oil-in-Water Emulsions. Ind. Eng. Chem. Res. Submitted.

6
step, the dispersed phase was added to the continuous phase at a constant flow rate
of 0.5 mL/s. A Fischer Scientific® peristaltic pump was utilized. The tip velocity of
the impellers was kept at 1.7 m/s. Finally, the emulsions were homogenized at the
same tip velocity for 10 min. Torque vs time data was recorded using a Lightnin®
LabMaster L1U10F and a Heidolph Hei-TORQUE Precision 400 mixing devices.
Temperature was kept at 40ºC.
Four types of impellers were used: propeller, straight paddles turbine, 45º pitched
blade turbine and Rushton turbine (Figure 2.1). The impeller-to-tank diameter ratio
was kept constant at 0.78.
(a) (b)
(c) (d)
Figure 2.1. Schematic of impeller types and
dimensions. (a) Propeller. (b) Straight paddles
turbine. (c) Rushton Turbine. (d) Pitched blade
turbine.

7
2.2.1.3. Experimental Measurements
Rheological measurements were performed using a TA Instruments® DHR1 hybrid
rheometer with a temperature of 40 ± 0.1 ◦C. The first test was a flow sweep with the
shear rate varying in a range of 1 to 100 s-1. Subsequently a frequency sweep with
a step of 0.1-300 rad/s at 0.2 Pa was implemented. The final test was a stress sweep
with a step of 0.1-300 Pa.
Droplet size distributions were measured using a Malvern Instruments Mastersizer
3000. This instrument permits particle size measurements in the range of 0.01 to
3500 μm and uses Mie theory for calculation size distributions. This theory uses
Maxwell’s field equations and predicts scattering intensity produced by particles in a
sample. It assumes spherical particles and takes into consideration diffraction,
refraction and absorption, for which optical properties of both dispersant medium
and particle material must be known (Malvern Instruments, 2009). In order to avoid
that light scattered by one particle interacted with other droplets before detection,
the samples were diluted in such a way that obscuration was maintained within the
limits suggested by the equipment manufacturer.
Stability tests were performed with a Formulaction Turbiscan. Sample scans were
done every 25 s for a period of 30 min with a temperature of 40 °C. This equipment
analyzes transmission and backscattering in a cylindrical sample cell produced by a
near infrared light source. Destabilization kinetics are inferred by analyzing changes
in transmission and light scattering as a function of the different destabilization
mechanisms in play (e.g. flocculation and sedimentation). Results are presented in
a form of the Turbiscan Stability Index (TSI), which is a relative number that reflects
the variations in time of stability in comparison with the status of the sample at the
start of the analysis (Kaombe et al., 2013).
Zeta potential was measured with a Malvern Instruments Zetasizer Nano ZS. This
equipment estimates the electrophoretic mobility within a cell with a laser light source

8
and an electric field. Then, Henry equation is used for calculating zeta potential l(Cho
et al., 2012). For this, the dielectric constant of the continuous phase had to be
known.
2.2.2. CFD Modelling
2.2.2.1. Mathematical Models
The Eulerian approach was utilized during simulations. This means that a set of
equations is solved for each phase, alongside models that account for phase
interactions. The continuity equation for a phase i is (Hirsch, 2007, Chapter 1;
Siemens, 2016) :
𝜕
𝜕𝑡∫ 𝛼𝑖𝜌𝑖𝑥 𝑑𝑉
𝑉
+ ∮ 𝛼𝑖𝜌𝑖𝑥 (𝑉𝑖 − 𝑉𝑔) . 𝑑𝒂𝐴
= ∫ ∑(𝑚𝑖𝑗− 𝑚𝑗𝑖)
𝑖≠𝑗
𝑥 𝑑𝑉 + ∫ 𝑆𝑖𝛼 𝑑𝑉
𝑉𝑉
(1)
Where α is the volume fraction of phase i, 𝜌𝑖 is the density of phase i, x is the void
fraction, 𝑉𝑖 is the velocity of phase i, 𝑉𝑔 is the grid velocity, 𝑚𝑖𝑗 is the mass flow from
i to j and 𝑚𝑗𝑖 is the mass flow from j to i.
Momentum equation for phase i is(Hirsch, 2007; Siemens, 2016):
𝜕
𝜕𝑡∫ 𝛼𝑖𝜌𝑖𝑥 𝑑𝑉
𝑉
+ ∮𝛼𝑖𝜌𝑖𝑥 (𝑉𝑖 − 𝑉𝑔) . 𝑑𝑎𝐴
= − ∫ 𝛼𝑖𝑥 𝛻𝑃 𝑑𝑉 + ∫ 𝛼𝑖𝜌𝑖𝑥 𝑔 𝑑𝑉 + ∮ [𝛼(𝜏𝑖 − 𝜏𝑖𝑡)] 𝑥. 𝑑𝒂
𝐴
𝑉𝑉
+ ∫𝑀𝑖𝑥 𝑑𝑣 𝑣
+ ∫(𝐹𝑖𝑛𝑡)𝑖𝑥 𝑑𝑣𝑣
+ ∫𝑆𝑖𝑣 𝑑𝑣
𝑣
+ ∫ ∑(𝑚𝑖𝑗 𝑣 − 𝑚𝑗𝑖𝑣)𝑥 𝑑𝑣 𝑣
(2)
Where P is pressure, which is equal for both phases, g is the gravity vector, 𝜏𝑖 is the
molecular stress tensor of phase i, 𝜏𝑖𝑡 is the turbulent stress tensor of phase i,, (𝐹𝑖𝑛𝑡)𝑖
represents internal forces at phase i, 𝑆𝑖𝑣 is the phase momentum source term and
𝑀𝑖 is interphase momentum transfer per unit volume, where:
∑ 𝑀𝑖 = 0 (3)
No turbulence model was implemented for the reason that flow regimes were
considered to be laminar under all conditions (Re, calculated with the Metzner and

9
Otto Method (Foucault et al., 2005; Metzner & Otto, 1957), was of the order of 10
under all conditions). Additionally, the system was taken to be isothermal (40ºC)
and each phase was assigned constant density and viscosity values. These
properties were measured for the oil phase (𝜌 = 851 kg/m3, 𝜇=0.0185 Pa s) and the
widely reported values for the aqueous phase at the working temperature were used.
Drag was modeled using the well-known Schiller and Naumann expression (Schiller
& Naumann, 1933) because it is well suited for cases in which fluid particles are
small and can be considered spherical such as in this study. Additionally, recent
works in the literature have shown that it is adequate for systems similar to the
emulsions studied here (For example, see the work of Roudsari et al. (2012) and
references within). Lift force was not considered for the reason that it is not significant
in comparison to drag force in emulsions(Drew & Lahey, 1993). Virtual mass forces
were not considered due to the reason that they occur when the dispersed phase
accelerates relative to the continuous phase and this is significant only when the
dispersed phase density is considerably smaller than the continuous phase
density(Drew & Lahey, 1993; Lotfiyan et al., 2014).
Even though the studied emulsions are composed by two Newtonian fluids, non-
Newtonian behavior arises due to interaction between particles and particles and the
continuous phase(Barnes, 2000, Chapter 15). For this reason, an emulsion rheology
model was implemented as well.
The mentioned model uses relative viscosity for describing the mixture viscosity:
𝜂𝑟 =𝜂
𝜂𝑐 (4)
Where 𝜂 is the mixture viscocity and 𝜂𝑐 is the viscosity of the continuous phase.
In turn, relative viscosity was described using the Morris and Boulay model(Morris &
Boulay, 1999):
𝜂𝑟(𝜙) = 1 + 2,5𝜙 (1 −𝜙
𝜙𝑚)
−1
+ 𝐾𝑠 (𝜙
𝜙𝑚)
2
(1 −𝜙
𝜙𝑚)
−2
(5)

10
Where 𝐾𝑠 is the contact contribution, ϕ is the disperse phase volume fraction and
𝜙𝑚 is the maximum packing fraction. Although this model was originally developed
for flows with anisotropic components, it can describe isotropic flows if an identity
tensor is used as the anisotropy tensor in the normal stress tensor:
𝜏𝑝,𝑁𝑆 = −𝜂𝜂(𝜙)𝜂𝑓�̇�𝑙𝑄 (6)
Where 𝜂𝜂 is the continuous phase viscosity, �̇�𝑙 is the shear rate of the liquid and Q
is the anisotropy tensor.
Particle size distribution as well as coalescence and break up were described with
the S-gamma formulation (Lo & Zhang, 2009; Lo & Rao, 2007). This method
assumes a lognormal distribution, which was deemed acceptable because
experimental measurements showed that actual distributions are close to the
lognormal form.
The method is statistical in nature and is based in the resolution of transport
equations for moments of the size distribution:
𝑆𝛾 = 𝑛 ∫ 𝑑𝛾𝑃(𝑑)𝑑(𝑑) ∞
0
(7)
Where 𝑛 is the number of particle per unit volume, 𝑑 is the particle diameter and P(d)
is the probability function of particle diameter.
Coalescence and breakup were modeled within the S-gamma framework by adding
source terms to the transport equation for each moment of size distribution. For
instance, the transport equation for 𝑆0 adopts the following form:
𝜕𝑆0
𝜕𝑡+ ∇. (𝑆0𝑣𝑑) = 𝑠𝑏𝑟 + 𝑠𝑐𝑙 (8)
Where 𝑣𝑑 is the dispersed phase velocity and 𝑠𝑏𝑟 and 𝑠𝑐𝑙 are the terms for breakup
and coalescence, respectively.
For breakup, the equation formulated by Lo and Zhang(S Lo & Zhang, 2009) was
implemented:

11
𝑑
𝑑𝑡𝑆𝛾 = ∫ 𝑛𝑃(𝑑)
(𝑁(𝑑)1−𝛾3 − 1)
𝜏(𝑑)
∞
𝑑𝑐𝑟
𝑑𝛾𝑑(𝑑) (9)
Where N is the number of small droplets produced when a particle breaks down and
𝑑𝑐𝑟 is the critical diameter:
𝑑𝑐𝑟 =2𝜎𝛺𝑐𝑟
𝜇𝑐�̇� (10)
Where 𝜇𝑐 is the continuous phase dynamic viscosity, 𝜎 is the surface tension, �̇� is
the local shear rate and 𝛺𝑐𝑟 is the critical capillary number, which only depends on
the ratio of viscosities between the dispersed and continuous phases (Leal-Calderon
et al., 2007).
The timescale for breakup (𝜏) depends on the breakup regime (i.e. viscous or
inertial). For this study, only the viscous case was relevant due to the fact that only
laminar flows were considered. Thus, the mentioned time scale is (Lo & Zhang,
2009):
𝜏(𝑑) =𝜇𝑐𝑑
𝜎𝑓(𝜆) (11)
Where 𝜆 is the ratio of viscosities between the dispersed and continuous phases.
Here, 𝑓(𝜆) is an experimentally derived function, the details of which can be found
elsewhere (Hill, 1998).
The implemented coalescence model based on the work of Lo & Zhang (2009) as
well. The source term for coalescence is given by equation 12:
𝑑
𝑑𝑡𝑆𝛾 = 𝐹𝑐𝑙 (2
𝛾3 − 2) 𝐾𝑐𝑜𝑙𝑙𝑃𝑐𝑙(𝑑𝑒𝑞)𝑑𝑒𝑞
𝛾 (12)
Where 𝐹𝑐𝑙 is a calibration coefficient, 𝐾𝑐𝑜𝑙𝑙 is the collision rate, 𝑃𝑐𝑙 is the probability
of collision leading to coalescence and 𝑑𝑒𝑞 is an equivalent diameter defined by the
authors(Lo & Zhang, 2009). For the viscous case, the collision is defined as follows:
𝐾𝑐𝑜𝑙𝑙 = (8𝜋
3)
12
(�̇�𝑑𝑒𝑞)𝑑𝑒𝑞2 (
6ϕ
𝜋𝑑𝑒𝑞3 )
2
(13)

12
According to Lo & Zhang (2009), the probability of collision depends on the shear
rate and the drainage time of the film of continuous phase between colliding droplets.
Consequently, this probability represents a comparison of the interaction time of the
droplets and the required time for the film to drain away. Equation 14 defines the
probability of collision.
𝑃𝑐𝑙(𝑑𝑒𝑞) = exp(−𝑡𝑑�̇�) (14)
The mentioned drainage time (𝑡𝑑) depends on the presence of blockages at the
interphase. Considering that surfactants act as barriers at the interphase, a partially
mobile interface model for the drainage time was selected:
𝑡𝑑 =𝜋𝜇𝑑√𝐹𝑖
2ℎ𝑐𝑟(
𝑑𝑒𝑞
4𝜋𝜎)
3/2
(15)
Where 𝐹𝑖 is the interaction force during the collision and ℎ𝑐𝑟 is the critical film
thickness. The definition of both parameters can be found in the literature(S Lo &
Zhang, 2009). The critical film thickness depends on the Hamaker constant, which
was estimated using the work of Bergstrom (1997).

13
2.2.2.2. Mesh and mesh independence.
Autodesk Inventor 2017 was used to reproduce the geometric details of the
experimental setup. STAR-CCM+ was used for the discretization of the geometric
domain. For this, polyhedral cells were constructed in the bulk of the fluid and a prism
layer was used near walls. Considering the complexity of the physical models used
and the fact that simulations were conducted in steady state, relatively fine meshes
were selected. Two geometries were modelled: propeller turbine and straight
paddles turbine. For the propeller setups, the mesh consisted of 602560 cells, while
the grid contained 538316 cells for the straight paddles turbine configuration. In
Figure 2.2 the grids and experimental setup can be appreciated.
Two factors were considered during mesh independence tests: average velocity
after convergence and velocity profiles near the agitator. Mesh independence was
considered to be achieved when these variables did not change more than 5%.
Figure 1.3 shows radial velocity profiles for both modelled geometries in a 10%
emulsion. Three mesh sizes are presented: a coarse mesh consisting of
approximately 100000 cells, a fine mesh, consisting in circa 1 million cells and the
chosen mesh, which is denoted as ‘medium mesh’. It was found that the three grids
predicted the same forms of the profiles but the coarse mesh generated a noticeable
underestimation of velocity magnitudes. On the other hand, the difference between
(a) (b) (c)
Figure 2.2. (a) Geometry mesh, propeller configuration. (b) Geometry mesh, straight paddles
turbine configuration. (c) Experimental setup.

14
the medium and fine meshes was insignificant. a similar behavior was encountered
for the average values of other relevant variables such as average droplet size,
incorporated energy and relative viscosity, Considering the increased
computational time required by the later, it was concluded that the medium mesh is
acceptable.
2.2.2.3. Simulations.
As mentioned before, simulations were conducted for two impellers: propeller and
straight paddles turbine. Only the third step of the process described in section
2.2.1.1. (i.e. homogenization) was simulated in steady state. This was deemed to be
acceptable due to the reason that preliminary studies showed that the systems
become steady immediately after the end of the incorporation phase. Considering
this, the impeller motion was simulated with the Moving Reference Frames (MRF)
method, which considers the forces associated with a motion without requiring a
movement of the cells (Brucato et al., 1998; Siemens, 2016).
Residuals and relevant variables (i.e. torque, relative viscosity, average droplet
diameter, mean velocity) were used as convergence criteria. Six 10 core Intel Zeon
2.4 Ghz processors were used and convergence was achieved after an average of
28.36 h.
-4 -2 0 2 40
0.2
0.4
0.6
0.8
1
Position [cm]
Ve
locity [
m/s
]
Above impeller. Fine mesh
Above impeller. Medium mesh
Above impeller. Coarse mesh
Below impeller. Fine mesh
Below impeller. Medium mesh
Below impeller. Coarse mesh
Figure 2.3. Radial velocity profiles for different mesh sizes. (a) Propeller configuration. (b)
Straight paddles configuration.
0
0.1
0.2
Ve
locity [
m/s
]
Fine mesh
Medum mesh
Coarse mesh
-4 -3 -2 -1 0 1 2 3 40
0.1
0.2
Position [cm]
Ve
locity [
m/s
]
(a) (b)

15
Chapter 3. Multiscale Analysis and CFD Modelling of Water-in-Oil
Emulsions*
3.1. Introduction.
As mentioned before, the large amount of relevant variables in both W/O and O/W
emulsions and the complex interrelationships amongst those variables makes a
multiscale approach attractive for the study of these systems. In this work, the
macroscopic and microscopic dynamics of W/O emulsions were related with process
variables and the performance of the emulsions as products,
The study is divided in two parts. In the first part, relationships between rheology,
droplet size, stability, concentration of dispersed phase and energy incorporated
during the emulsification process were stablished. Four types of impellers were used
in a range of concentrations from 10 to 90%. The second part of this work analyses
the influence of mixing during the emulsification process on the rheological
properties, incorporated energy and particle size. For this endeavor, CFD results
were used for concentrations of disperse phase ranging from 10 to 90% and one
type of impeller.
3.2. Results and Analysis.
As mentioned before, the first part of the discussion will focus on the multiphase
analysis of the studied W/O emulsions, using incorporated energy during the
incorporation and homogenization process as a transversal factor. This energy
corresponds to the work done by the impellers and is critical for the final properties
of an emulsion, for the reason that it is responsible for the creation of additional
interfacial area and the deformation of said interface, which allows for the adsorption
of surfactant molecules (Leal-Calderon et al., 2007; Tadros, 2013). In their study,
Alvarez et al. (2010) found that, in highly concentrated emulsions (above 80% w.t.),
the incorporated energy during homogenization is larger than the added energy
* Redrafted from: Gallo-Molina, J. P.; Ratkovich, N.; Álvarez, Ó. Multiscale Analysis of Water-in-Oil
Emulsions : A Computational Fluid Dynamics Approach. Ind. Eng. Chem. Res. 2017, 56

16
during the incorporation of the dispersed phase. As could be expected, this situation
occurs in less concentrated emulsions as well. However, as the amount of dispersed
phase to incorporate diminishes, it was observed that the difference in magnitudes
experimented a growth. This can be explained by the fact that less concentrated
emulsions experiment lowers increases in viscosity and requires less incorporation
time.
Figure 3.13.1 shows the evolution of mean droplet size and incorporated energy as
a function of the dispersed phase. It can be seen that the former is inversely
proportional to concentration, while the latter exhibits the opposite behavior.
Langevin (2000) showed that an increase in concentration of the dispersed phase
generates an increment in the elasticity of the interphases, which increments the
amount of energy that the impeller must incorporate. Additionally, the increasing
amounts of dispersed phase reduces the available space between droplets, while
the mentioned increase in elasticity makes droplets more resilient to coalescence.
As mentioned by Pradilla et al. (2015), this allows for more interactions between
droplets, which generates larger elastic modules as the concentration grows.
Figure 3.1. Average droplet size (D[4,3]) and
incorporated energy during homogenization phase
as functions of dispersed phase concentration in
W/O emulsions prepared using four different
impellers.
0
5
10
15
D[4
,3] µ
m
0 20 40 60 80 1000
10
20
Concentration [%]
Incorp
ora
ted E
nerg
y [J/m
L]
Propeller
Straight Paddles
Pitched Blade
Rushton
17
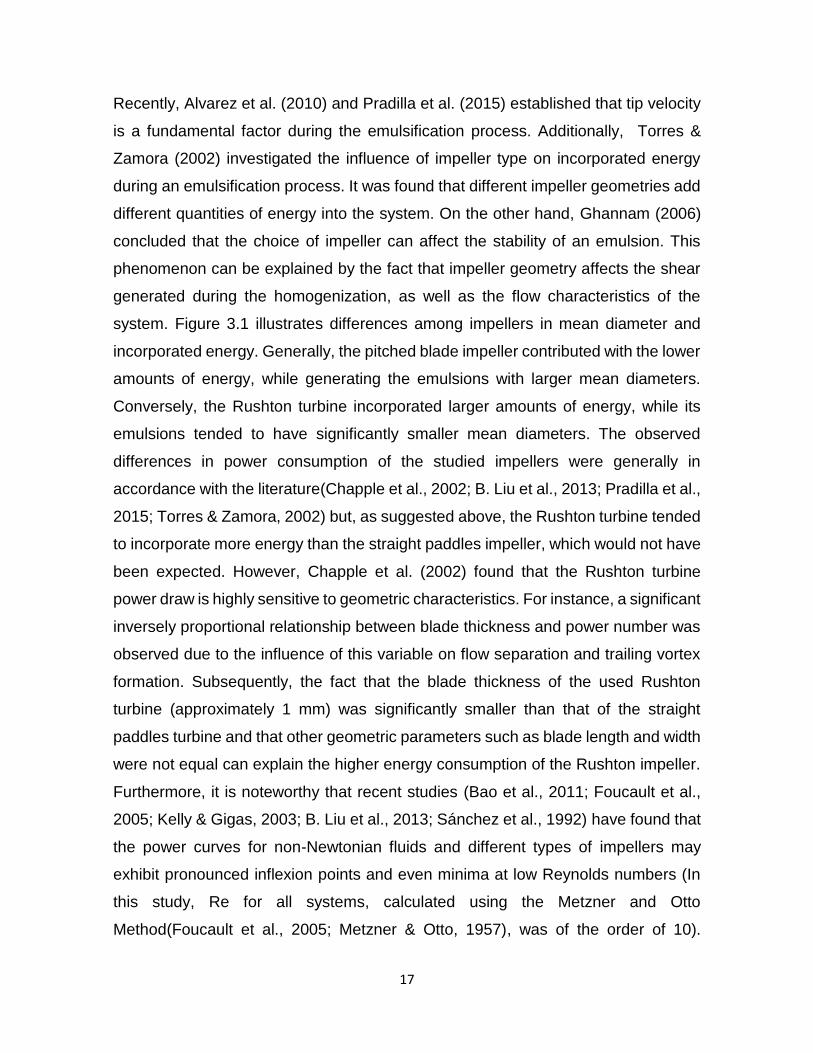
Recently, Alvarez et al. (2010) and Pradilla et al. (2015) established that tip velocity
is a fundamental factor during the emulsification process. Additionally, Torres &
Zamora (2002) investigated the influence of impeller type on incorporated energy
during an emulsification process. It was found that different impeller geometries add
different quantities of energy into the system. On the other hand, Ghannam (2006)
concluded that the choice of impeller can affect the stability of an emulsion. This
phenomenon can be explained by the fact that impeller geometry affects the shear
generated during the homogenization, as well as the flow characteristics of the
system. Figure 3.1 illustrates differences among impellers in mean diameter and
incorporated energy. Generally, the pitched blade impeller contributed with the lower
amounts of energy, while generating the emulsions with larger mean diameters.
Conversely, the Rushton turbine incorporated larger amounts of energy, while its
emulsions tended to have significantly smaller mean diameters. The observed
differences in power consumption of the studied impellers were generally in
accordance with the literature(Chapple et al., 2002; B. Liu et al., 2013; Pradilla et al.,
2015; Torres & Zamora, 2002) but, as suggested above, the Rushton turbine tended
to incorporate more energy than the straight paddles impeller, which would not have
been expected. However, Chapple et al. (2002) found that the Rushton turbine
power draw is highly sensitive to geometric characteristics. For instance, a significant
inversely proportional relationship between blade thickness and power number was
observed due to the influence of this variable on flow separation and trailing vortex
formation. Subsequently, the fact that the blade thickness of the used Rushton
turbine (approximately 1 mm) was significantly smaller than that of the straight
paddles turbine and that other geometric parameters such as blade length and width
were not equal can explain the higher energy consumption of the Rushton impeller.
Furthermore, it is noteworthy that recent studies (Bao et al., 2011; Foucault et al.,
2005; Kelly & Gigas, 2003; B. Liu et al., 2013; Sánchez et al., 1992) have found that
the power curves for non-Newtonian fluids and different types of impellers may
exhibit pronounced inflexion points and even minima at low Reynolds numbers (In
this study, Re for all systems, calculated using the Metzner and Otto
Method(Foucault et al., 2005; Metzner & Otto, 1957), was of the order of 10).

18
Considering the complexities introduced by non-Newtonian flow, it is expected that
these peculiarities in the power curves are dependent on impeller geometry and fluid
properties as well as the Reynolds number, which may further explain the observed
differences in power consumption among impellers and dispersed phase
concentrations. Even though this may deserve further research, it can be concluded
that impeller geometry is a major process variable during the emulsification process,
since it modifies shear and incorporated energy.
The effects of different microscopic and process variables on rheological behavior
has been investigated by several authors. For example, Derkach (2009) discussed
the proportional relationship between concentration and relative viscosity and the
non-Newtonian behavior arising by close packing and droplet interactions.
Furthermore, it has been stablished that elasticity in emulsions is strongly related to
interfacial energy density and both are connected with dispersed phase
concentration(Cohen-Addad & Höhler, 2014). Liu et al. (2016) found that a transition
from Newtonian to non-Newtonian regimes occurs in function of dispersed phase
concentration and established that highly concentrated O/W emulsions exhibit
shear-thinning behavior, which can be well represented by a power law. Pradilla et
al. (2015) reported a directly proportional relationship between the elastic modulus
in the linear viscoelastic region and incorporated energy in O/W emulsions. As
shown by Figure 3.2., a similar behavior was observed for W/O emulsions, which
implies that, for these systems, larger amounts of incorporated energy also leads to
more elasticity in the interphase. As suggested before, this elasticity is reflected in
the values of the elastic modulus.
Moreover, the appreciable differences in elastic modulus when the concentrations
are equal show that the impeller type may be an important factor in the emulsion
formulation. For instance, there exist an order-of-magnitude difference between the
elastic modulus of 50% emulsions prepared with the Rushton turbine and the pitched
blade turbine. Less dramatic differences for higher concentrations were observed.
As previously discussed, these divergences can be explained by the shear and

19
energy incorporated by the different impellers which, in turn, is determined by its
geometry when all other factors are kept equal. It is noteworthy, however, that in
most cases the differences between elastic modulus values are relatively small when
the concentration is equal. For this reason, it can be concluded the amount of
interactions amongst droplets –which is highly dependent on concentration- is critical
for the determination of the elastic modulus.
Figure 3.3. shows a behavior consistent with the results previously reported by
Pradilla et al. (2015) for O/W emulsions. That is: an increase in incorporated energy
generates a decrease in average droplet diameter and a growth in elasticity in the
studied systems. Furthermore, it was observed that divergences in mean diameter
among impeller types are more pronounced for higher values of incorporated energy
Figure 3.2. Elastic modulus in the linear viscoelastic
region as a function of incorporated energy during the
homogenization phase for W/O emulsions using four
different impellers. The concentration values in
ascending order are: 60%, 70%, 80 % and 90% for the
propeller turbine; 60%, 70% and 80% for the straight
paddles turbine; 50%, 60%, 70% and 80% for the
Rushton and pitched blade turbines.
0 .1 10 200.1
1
10
100
1000
Incorporated Energy [J/mL]
G' [
Pa
]
Propeller
Straight Paddles
Pitched Blade
Rushton
90% wt
50% wt

20
(i.e. higher concentrations). This is explained by the fact that, at lower
concentrations, the interactions between droplets are negligible, the flow regime is
essentially Newtonian and the viscosities are relatively low (Liu et al., 2016). In turn,
this causes that the differences introduced by the different geometries become less
important than the factors that were kept constant (i.e. homogenization time and
surfactant concentration). Conversely, when the concentration of dispersed phase
increases, the larger amounts of elasticity and interactions between droplets cause
the differences in impeller geometry to play a bigger role, which generated the
observed difference in mean diameter.
Figure 3.3. Mean droplet diameter as a function of
incorporated energy during the homogenization phase for
W/O emulsions using four different impellers. The
concentration values in descending order are: 10%, 20%,
30%, 40%, 50%, 60%, 70%, 80% and 90% for the
propeller turbine; 30%, 40%, 60%, 70% and 80% for the
straight paddles turbine; 30%, 40%, 50%, 60%, 70% and
80% for the pitched blade; 20%, 30%, 40%, 60%, and
80% for the Rushton turbine.
1 10 201
10
20
Incorporated Energy [J/mL]
D[4
,3]
µm
Propeller
Straight Paddles
Pitched Blade
Rushton
10% wt
90% wt

21
Previous publications have investigated the effect of dispersed phase concentration
in the stability of emulsions (Domian et al., 2014; Qiao et al., 2015), as well as the
influences of surfactant concentration and environmental variables in the same
variable (Almeida et al., 2016; Aoki et al., 2005). Figure 3.4. shows the TSI of the
studied emulsions for different concentrations and impeller types. As expected, more
concentrated emulsions exhibited lower values of the TSI (i.e. higher stabilities), for
the reason that at lower concentrations, the larger droplets are more sensitive to
gravitational effects causing sedimentation and creaming. Furthermore, at higher
concentrations, the osmotic pressure within the droplets can equilibrate the
differences in Laplace pressure, which reduces Ostwald ripening (Leal-Calderon et
al., 2007).
A comparison between figures 3.1, 3.3. and 3.4. shows that impeller type also has
an influence on stability. As discussed before, the pitched blade tended to
incorporate lower amounts of energy during the homogenization stage, which
created emulsions with generally larger mean diameters. Consequently, this made
emulsions less stable than those prepared with impellers that tended to incorporate
more energy (e.g. Rushton).
Figure 3.4. TSI after 30 min for different
concentrations and impeller types.
1 0% 30% 50% 90%0
2
4
6
8
10
Concentration
TS
I
Propeller
Straight Paddles
Pitched Blade
Rushton
22
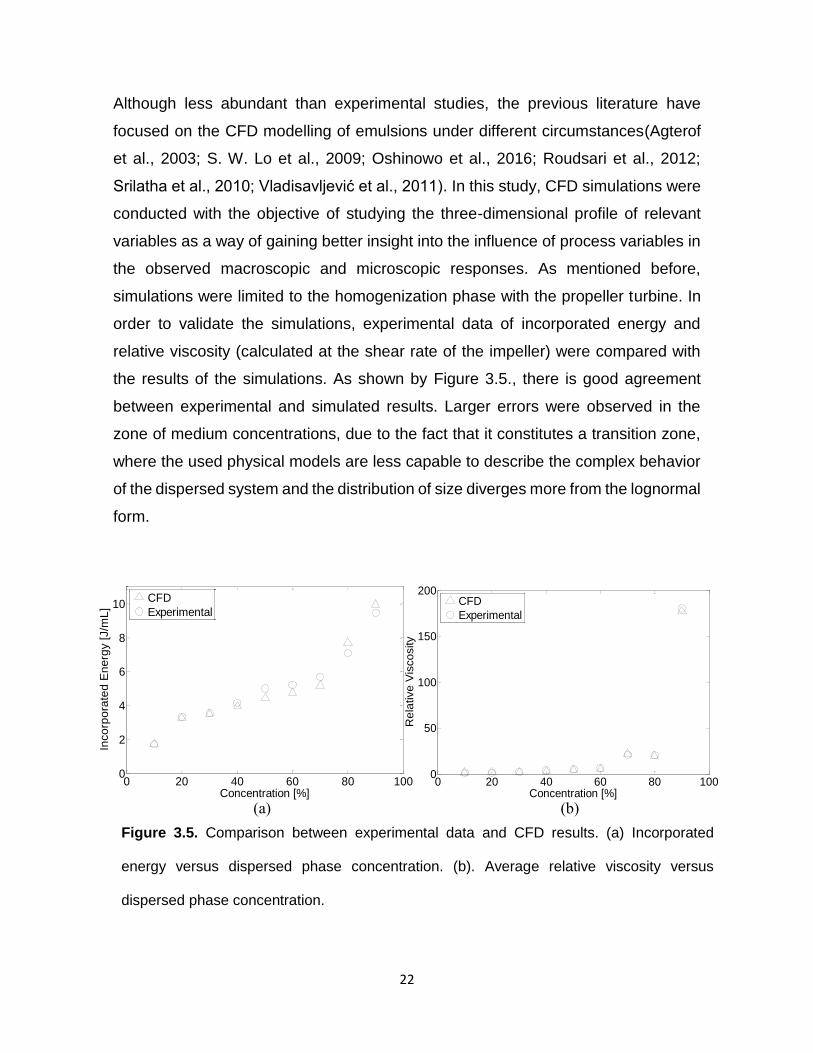
Although less abundant than experimental studies, the previous literature have
focused on the CFD modelling of emulsions under different circumstances(Agterof
et al., 2003; S. W. Lo et al., 2009; Oshinowo et al., 2016; Roudsari et al., 2012;
Srilatha et al., 2010; Vladisavljević et al., 2011). In this study, CFD simulations were
conducted with the objective of studying the three-dimensional profile of relevant
variables as a way of gaining better insight into the influence of process variables in
the observed macroscopic and microscopic responses. As mentioned before,
simulations were limited to the homogenization phase with the propeller turbine. In
order to validate the simulations, experimental data of incorporated energy and
relative viscosity (calculated at the shear rate of the impeller) were compared with
the results of the simulations. As shown by Figure 3.5., there is good agreement
between experimental and simulated results. Larger errors were observed in the
zone of medium concentrations, due to the fact that it constitutes a transition zone,
where the used physical models are less capable to describe the complex behavior
of the dispersed system and the distribution of size diverges more from the lognormal
form.
Figure 3.5. Comparison between experimental data and CFD results. (a) Incorporated
energy versus dispersed phase concentration. (b). Average relative viscosity versus
dispersed phase concentration.
(a) (b)
0 20 40 60 80 1000
2
4
6
8
10
Concentration [%]
Inco
rpo
rate
d E
ne
rgy [
J/m
L]
CFD
Experimental
0 20 40 60 80 1000
50
100
150
200
Concentration [%]
Re
lative
Vis
co
sity
CFD
Experimental

23
Figure 3.6. shows the velocity profiles for an emulsion with a concentration value of
10%. As it could be expected, higher velocities were observed in the vicinity of the
impeller, while lower magnitudes occurred in the edges of the tank. Simulations
showed a decrease in the average velocity and an enlargement of dead zones as
the water concentration increased. This behavior was caused by the higher
viscosities exhibited by more concentrated systems. As discussed before, this is
generated by the increments in elasticity associated with more droplet interactions
in the emulsions. Several authors have discussed the effects of the emulsification
flow regime on the resulting droplet size distribution: Maggioris et al. (2000) and
Roudsari et al. (2012) for the inertial case and Baldyga & Podgórska (1998) and
Vankova et al. (2007) for the viscous case. In the latter regime, which was
predominant in the studied emulsions, due to the relatively low impeller speeds and
large viscosities, it has been reported that shear forces are directly responsible for
droplet break-up.
Figure 3.6. Velocity profile (m/s) with 10% dispersed phase concentration.
(a) Transversal profile. (b). Axial profile
(a) (b)

24
As shown by Figure 3.7., larger droplet diameters were predicted to exist far from
the agitator for all concentrations but with greater differences being observed in more
concentrated emulsions. This behavior is caused by the higher shear forces exerted
on the fluid in the vicinity of the impeller, which favors a larger break-up rate than in
the far reaches of the mixing vessel. Although both the CFD model and the
experimental measurements showed a relatively narrow size distribution, the
existence of the mentioned gradients in droplet diameter suggests that mixing is
critical for this variable in scaled-up applications; especially when highly
concentrated emulsions are being prepared. Figure 3.8. shows a somewhat more
dramatic behavior in the case of the viscosity of the product. The flow tests
performed during the experimental phase of this study as well as several authors
have shown that W/O emulsions exhibit a strong shear-thinning behavior(Cohen-
Addad & Höhler, 2014; Derkach, 2009; C. Liu et al., 2016; Loewenberg & Hinch,
1996). In accordance to this, the CFD model predicted smaller viscosities near the
impeller, with larger differences in more concentrated systems. In the same manner
as with the particle size profiles, the lower shear rates experienced by the emulsions
far from the propeller induced higher viscosities in those zones. There were less
significant gradients in less concentrated emulsions because those systems exhibit
less pronounced non-Newtonian effects and lower viscosities. Incidentally, this
phenomenon was evident during the preparation of highly concentrated emulsions,
as the flow of the fluid was clearly diminished far from the impeller during the
(a) (b) (c)
Figure 3.7. Profile of Sauter diameter (D[3,2], μm) for different dispersed phase
concentrations. (a) 10%. (b) 50%. (c) 90%. Red zones indicate diameters equal or larger than
2.5 μm.

25
incorporation and homogenization phases. This situation is expected to be greatly
exacerbated in a scaled-up situation.
Dispersed phase volume fraction profiles (Figure 3.9.) showed that the chosen
impeller is capable to produce a relatively even distribution of water droplets at the
preferred tip velocity (1.7 m/s). Analogously to the previously discussed profiles,
more concentrated systems exhibited larger gradients. This is explained by the fact
that, at higher concentrations, the viscosity of the emulsions makes mixing difficult
and generate effects on other variables associated with inappropriate mixing. For
this reason, higher tip velocities and/or other impeller geometries may be more
appropriate for the homogenization of highly concentrated emulsions.
(a) (c) (b)
Figure 3.8. Profile of relative viscosity for different dispersed phase concentrations. (a) 10%.
(b) 50%. (c) 90%. Different scales were used due to the large differences in magnitude. Red
zones indicate viscosities equal or larger than the indicated corresponding value
(a) (b) (c)
Figure 3.9. Profile of water volume fraction for different concentrations. (a) 10%. (b) 50%. (c).
90%. Different scales were used due to the large differences in magnitude.

26
3.3. Conclusions.
In this study an experimental multiscale analysis of W/O emulsions was coupled with
the CFD modelling of the same systems. Rheological, particle size, stability and
incorporated energy measurements were taken in the laboratory, while the
simulations were conducted using an Eulerian model with the S-gamma approach
for the droplet size distribution and the Morris and Boulay model for the rheology of
the emulsions.
Using the incorporated energy during the incorporation and homogenization steps
as a transversal variable, it was possible to find relationships among macroscopic
(i.e. rheological), microscopic (i.e. particle size) and stability variables. Larger
amounts of incorporated energy tended to generate more stable emulsions with
lower average droplet diameters and higher elastic modulus. A comparison among
different impeller types showed that the agitator geometry plays an important role in
the rheology, size distribution and stability of the final emulsions by virtue of different
impellers being capable of adding different amounts of energy and shear to the
mixture.
The CFD simulations were validated (Figure 3.5.) with the obtained experimental
results and resulting three-dimensional profiles were proven to be useful as a
complement to the multiscale approach used in this study. Gradients in droplet
diameter, relative viscosity and dispersed phase volume fraction were found to exist
in the mixing tank, which indicated that the chosen impeller and tip velocity don’t
provide optimal mixing, while generating effects in the final macroscopic and
microscopic properties of the product.
In sum, the combination of an experimental multiscale study and CFD modelling of
emulsions appears to be a useful tool for the analysis of the various variables
affecting the final properties of these complex systems. Additionally, the use of

27
computational methods may be useful for connecting laboratory results to full-scale
observations.

28
Chapter 4. Multiscale Analysis and CFD Modelling of Oil-in-Water
Emulsions*
4.1. Introduction.
Oil-in-water and water-in-oil emulsions share similarities. However, the inverted
continuous and dispersed phases changes the hydrodynamics of the systems as
well as a variety of mechanisms at the microscopic and macroscopic scales.
Furthermore, there are differences in interfacial properties that are produced, among
others, by the dissimilar required amounts of surfactants and HLB, which in turn
changes interfacial tension and rheology. As a result, the overall dynamics and
properties of O/W emulsions can be significantly different to analogous W/O
systems.
For this reason, this work sought to study O/W emulsions with a multiscale
approximation similar to the one that was implemented in the previous chapter.
Macroscopic and microscopic variables were linked to process and product variables
and, additionally, zeta potential measurements were used as way of approaching
the molecular scale. Four types of impellers were used in a range of concentrations
from 10 to 90%.
In a second part of the work, CFD was used in order to better assess the influence
of process variables (i.e. the mixing and shear provided by an impeller geometry) on
rheology, incorporated energy and particle size. The same range of concentrations
was simulated and two impeller were considered: a low power draw geometry (i.e.
propeller turbine) and a high power consumption configuration (i.e. straight paddles
turbine).
* Redrafted from: Gallo-Molina, J. P.; Ratkovich, N.; Álvarez, Ó. The Application of Computational
Fluid Dynamics to the Multiscale Study of Oil-in-Water Emulsions. Ind. Eng. Chem. Res. Submitted.

29
4.2. Results and Analysis.
The first part of this study consists in the experimental multiscale analysis of O/W
emulsions prepared with the four previously mentioned impellers. A minimum of
three replicate experiments were conducted per data point and each individual
measurement was repeated at least three times as well (For example, particle sizes
for each concentration were obtained from at least three different samples and each
sample was measured at least three times) . For the sake of clarity, error bars are
not displayed in the subsequent figures but percent deviation was approximately 5%
for incorporated energy measurements, 5-8% for mean droplet diameters, 2-9% for
elastic modulus, 8-10% for TSI and 1-6% for zeta potential. Similar deviations were
observed by Pradilla et al. (2015) for highly concentrated emulsions. In the second
part, CFD is used in order to gain a better understanding of the experimental
observations.
The incorporated energy during the incorporation and homogenization phases was
used as a transversal variable in the multiscale study. The reason for this choice is
that it is necessary to add energy in order to create additional interfacial area and to
deform the interface with the objective of allowing surfactant molecules to be
adsorbed (Leal-Calderon et al., 2007; Tadros, 2013). Previous studies have found
that more energy is incorporated during the homogenization phase and that this
difference is exacerbated as the concentration of dispersed phase diminishes due
to the reduction in viscosity and required incorporation time (Alvarez et al., 2010;
Gallo-Molina et al., 2017).
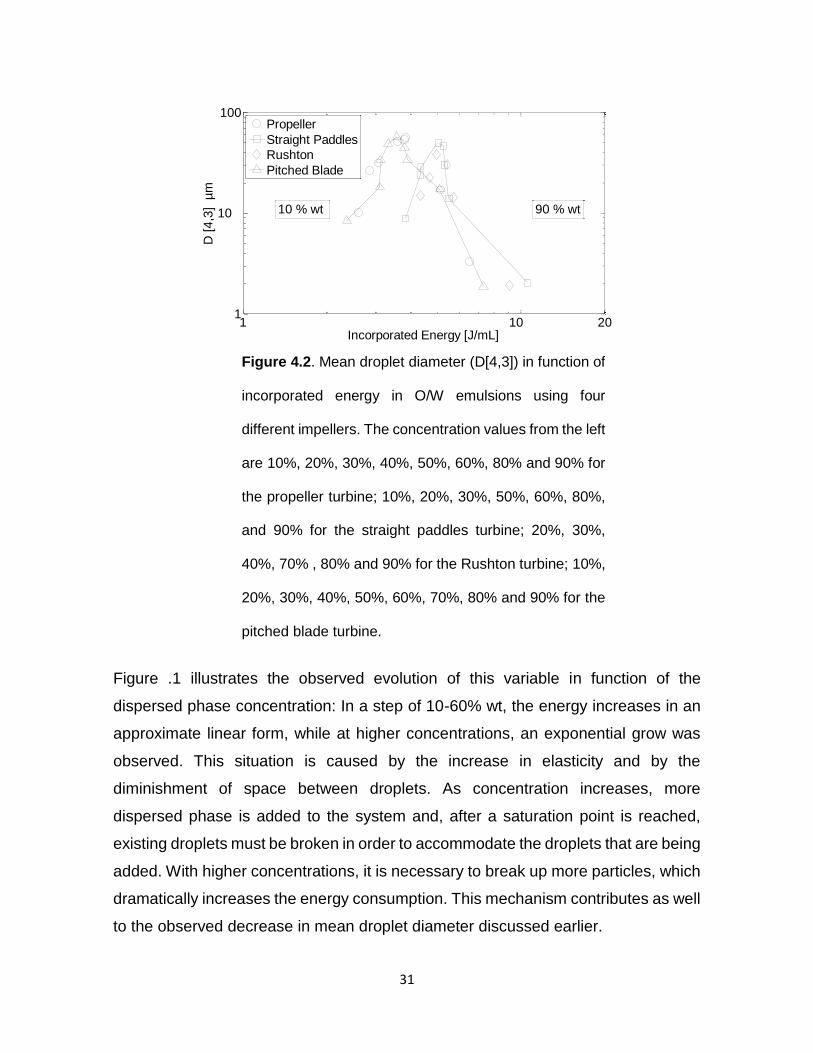
As shown by Figure .1 and Figure 4.2, an interesting behavior in average droplet
size diameter was observed: at low concentrations, it is directly proportional to the
incorporated energy and, after reaching an inflection point, the opposite behavior
arises. Hadnadev et al. (2013) reported similar results and pointed out that the
dependence of dispersed phase concentration on the droplet diameter is a reflection
of complex interactions among different variables. Salager (1996) reported that, in

30
these systems, the relation between viscosity and stirring efficiency is of importance,
while Langevin (2000) found that the elasticity at the interface increases with
dispersed phase concentration. For this reason, it can be argued that this behavior
can be attributed to the dominant set of interactions at each point of dispersed phase
concentration. At low concentrations, the elasticity is low, while the effect of the low
viscosity of the continuous phase became relevant. This low viscosity allows the
impellers to generate more shear forces, which are critical for droplet breakup in a
viscous emulsification regime (Baldyga & Podgórska, 1998; Vankova et al., 2007).
However, as the concentration increases, the growing interactions among droplets
generate an increase in viscosity, which decreases stirring efficiency. Consequently,
contacts between droplets became more prevalent and coalescence generates
higher droplet diameters. When the inflection point is reached (around 50% wt), the
larger amounts of elasticity at the interphases not only keep increasing the
incorporated energy but also overcome the trend in droplet diameter generated by
the low stirring efficiency of the impeller. As these higher elasticities make droplets
more resistant to coalescence and the available space between droplets is reduced,
the systems start to tend towards smaller average diameters.
Figure 4.1. Mean droplet diameter (D[4,3]) and
incorporated energy as functions of dispersed phase
concentration in O/W emulsions prepared with four
different impellers.
0 20 40 60 80 1000
10
20
30
40
50
60
Concentration [%]
D [
4,3
] µ
m
0
2
4
6
8
10
12
Inco
rpo
rate
d E
ne
rgy [
J/m
L]
Propeller
Straight Paddles
Rushton
Pitched Blade
Propeller
Straight Paddles
Rushton
Pitched Blade
Mean Diameter
Incorporated Energy
31
Figure .1 illustrates the observed evolution of this variable in function of the
dispersed phase concentration: In a step of 10-60% wt, the energy increases in an
approximate linear form, while at higher concentrations, an exponential grow was
observed. This situation is caused by the increase in elasticity and by the
diminishment of space between droplets. As concentration increases, more
dispersed phase is added to the system and, after a saturation point is reached,
existing droplets must be broken in order to accommodate the droplets that are being
added. With higher concentrations, it is necessary to break up more particles, which
dramatically increases the energy consumption. This mechanism contributes as well
to the observed decrease in mean droplet diameter discussed earlier.
Figure 4.2. Mean droplet diameter (D[4,3]) in function of
incorporated energy in O/W emulsions using four
different impellers. The concentration values from the left
are 10%, 20%, 30%, 40%, 50%, 60%, 80% and 90% for
the propeller turbine; 10%, 20%, 30%, 50%, 60%, 80%,
and 90% for the straight paddles turbine; 20%, 30%,
40%, 70% , 80% and 90% for the Rushton turbine; 10%,
20%, 30%, 40%, 50%, 60%, 70%, 80% and 90% for the
pitched blade turbine.
1 1 0 201
1 0
100
Incorporated Energy [J/mL]
D [
4,3
] µ
m
Propeller
Straight Paddles
Rushton
Pitched Blade
10 % wt 90 % wt

32
Recent studies have found that the impeller geometry is relevant for different
variables, such as incorporated energy (Gallo-Molina et al., 2017; Pradilla et al.,
2015; Torres & Zamora, 2002) and stability (Gallo-Molina et al., 2017; Ghannam,
2006). In the previous chapter, it was discussed that these differences originate from
the variance in shear forces and flow characteristics introduced by each impeller
geometry. From Figure .1, it can be inferred that the straight paddles and Rushton
turbines incorporated the larger amounts of energy and produced the emulsions with
the lowest average diameters. On the contrary, the propeller and pitched blade
turbines produced emulsions with higher mean sizes and had lower power draws.
This results are consistent with the previous literature (Chapple et al., 2002; Gallo-
Molina et al., 2017; B. Liu et al., 2013; Pradilla et al., 2015; Torres & Zamora, 2002)
but, as discussed in Chapter 3, the high sensitivity of the power consumption of the
Rushton turbine to geometric characteristics and the particularities in the power
curves at low Reynolds numbers for non-Newtonian fluids, introduce complexities
that affect the differences in power consumption among impellers.
The results reported in Figure4.2. are similar to the observations of Pradilla et al.
(2015) for analogous O/W emulsions: at high concentrations, the differences in mean
droplet diameter between impellers tend to be more pronounced. However, it was
also observed that, at lower concentrations, large dissimilarities in power draw did
not translate into comparable divergences in mean droplet diameter. This can be
explained by the fact that interactions among droplets are not significant, while other
constant variables (e.g. surfactant concentration) play a bigger role. Thus, the
coalescence and breakup mechanisms are roughly the same, regardless of the
energy that is being added to the system. This phenomenon also helps to explain
the similarities in mean diameter growth among different impellers: the decrease in
stirring efficiency associated with higher viscosities induced higher droplet sizes, but
other mechanisms (probably related to the interfaces) were kept approximately
equal. Nonetheless, the observed variances indicate that geometry differences do
play a role, albeit small, in the growth of droplet diameter at low concentrations.

33
The rheology of emulsions and its relationship with microscopic and process
variables has been examined in previous publications(Alvarez et al., 2010; Cohen-
Addad & Höhler, 2014; Derkach, 2009; Gallo-Molina et al., 2017; Klinkesorn et al.,
2004; C. Liu et al., 2016; Pradilla et al., 2015; Yaghi, 2003). Figure4.3. shows that
higher values of the incorporated energy lead to higher elastic modulus (displayed
here in Pa). This behavior was observed in previous studies for both highly
concentrated O/W emulsions (Pradilla et al., 2015) and W/O emulsions (Gallo-
Molina et al., 2017). This is caused by the increases in elasticity associated with
higher dispersed phase concentrations. As previously discussed, this makes
droplets more resistant to coalescence. In turn, this allows for more interactions
among droplets, which is reflected in larger elastic modulus. Cohen-Addad & Höhler
(2014) found that elasticity is significantly connected with interfacial energy density.
Figure 4.3. Elastic modulus in the linear viscoelastic
region as a function of incorporated energy for O/W
emulsions prepared with four impeller types. The
concentration values in ascending order are 60%, 80%
and 90% for the propeller turbine; 50%, 60%, 70%, 80%
and 90% for the straight paddles turbine; 70%, 80% and
90% for the Rushton turbine; 50%, 60%, 70%, 80% and
90% for the pitched blade turbine.
1 10 20
0.01
1
100
Incorporated Energy [J/mL]
G' [P
a]
Propeller
Straight Paddles
Rushton
Pitched Blade
90% wt
50% wt

34
Therefore, it can be concluded that the larger amounts of incorporated energy
required to prepare highly concentrated emulsions generated higher elasticities that
were macroscopically translated in the elastic modulus.
Noticeable differences in the elastic modulus were observed in function of the
impeller type. This implies that the impeller geometry plays a role in the final
macroscopic characterization of O/W emulsions. However, these divergences are
small when the dispersed phase concentration is equal. Therefore, it can be
concluded that other factors are more important for the determination of the elastic
modulus. It was discussed in the previous chapter that one of these factors is the
amount of interactions among droplets, which is linked with dispersed phase
concentration.
The stability of emulsions under different conditions has been studied in the literature
as well. For example, Almeida et al. (2016) assessed process and formulation
variables in order to obtain stable W/O emulsions. Domian et al. (2014), Felix et al.
(2017) and Qiao et al. (2015) inspected the rheology and stability of O/W systems.
Aoki et al. (2005) investigated the influence of environmental conditions on stability
while Roldan-Cruz et al. (2016) explored the relation between surfactant
concentration and stability. Figure 4.4. shows the stability of the emulsions studied
here in the form of TSI. At the higher concentrations, the observed behavior is similar
to the results presented in Chapter 3 for W/O emulsions: more concentrated
emulsions exhibited higher stabilities. This is explained by the fact that the smaller
droplets associated with concentrated emulsions are less sensitive to gravitational
effects and are able to equilibrate the differences in Laplace pressure; reducing
Ostwald ripening (Leal-Calderon et al., 2007). In contrast to W/O emulsions, less
concentrated systems (10-20%) were more stable than medium-concentration
emulsions. This is related to the previously discussed behavior of mean diameter: at
lower concentrations, smaller droplets are favored, which generate more stable
emulsions.

35
Impeller geometry was observed to impact stability as well. The higher power draws
associated with the Rushton and straight paddles turbines tended to produce smaller
mean droplet diameters and, consequently, more stable emulsions. As expected,
emulsions prepared with less energy-intensive impellers exhibited larger values of
TSI.
Zeta potential is commonly used to predict stability in emulsions and it has been
considered in previous studies for a variety of purposes (Acedo-Carrillo et al., 2006;
Mirhosseini et al., 2008; Wu et al., 2014; Zanatta et al., 2010). It is well established
that the presence of repulsive forces at the interface is a significant factor for
emulsion stability for the reason that they hinder coalescence. Although these
repulsive forces cannot be directly measured, they are related to zeta potential,
which is defined as the potential difference between the electroneutral region and
the bound layer of ions on the droplet surface (Roland et al., 2003). The observed
values of zeta potential as a function of oil concentration are showed by Figure4.5.
The effect of impeller type was found to be insignificant. A comparison between
figures Figure .1 and 4.5 suggests that a slight relation between droplet diameter
and zeta potential exists. Considering the relatively high total surfactant
concentration, this effect is likely caused by the theorized displacement of ions
(produced from dissolved atmospheric carbon dioxide and water dissociation) from
Figure 4.4. TSI after 30 min for different impeller types.
1 0 30 50 70 900
5
10
15
20
Concentration [%]
TS
I
Propeller
Straight Paddles
Rushton
Pitched Blade

36
the interface that occurs when interface coverage is high. This displacement reduces
the interfacial charge and thus the magnitude of zeta potential (Manev & Pugh, 1991;
Roldan-Cruz et al., 2016). In this case, the smaller interfacial areas associated with
larger droplet diameters allowed the same number of surfactant molecules (as the
total mass of surfactant was kept constant) to cover more efficiently each droplet;
displacing more ions. Consequently, larger droplet sizes favored smaller magnitudes
in zeta potential. In turn, this phenomenon favored the observed instability at medium
concentrations due to the smaller repulsive potentials that lead to higher rates of
coalescence. Additionally, it can be argued that this phenomenon produced a
positive feedback effect below the point of maximum droplet size (around 50% wt):
the larger droplet diameters induced by the stirring regime allowed for a reduction in
the interfacial repulsive forces, which generated even larger droplet diameters via
flocculation and coalescence.
As stated before, the relation between droplet diameter and zeta potential is minor.
This is to be expected as the use of deionized water suggests that only a relatively
small amount of ions could be formed before measurement. Therefore, it can be
concluded that dispersed phase concentration is not very influential to the resulting
values of zeta potential. This result was also reported by Medrzycka (1991) and,
0 20 40 60 80 100-50
-45
-40
-35
-30
-25
-20
Concentration [%]
Ze
ta P
ote
ntia
l [m
V]
Propeller
Straight Paddles
Rushton
Pitched Blade
Figure 4.5. Zeta Potential in function of dispersed phase
concentration for O/W emulsions prepared with four
impeller types.
37
more recently, by Mirhosseini et al. (2007). The resulting interfacial potential is much
more dependent on the action of the surfactant. As the concentration and type of
surfactant were kept constant, this effect could not be observed during this study.
Furthermore, the non-ionic surfactants used in this work stabilize emulsions manly
by steric repulsion, which implies that electrostatic repulsions are of secondary
importance(Roldan-Cruz et al., 2016). Therefore, it can be concluded that the
gravitational effects associated with droplet diameter are more important to the
stability in the emulsions studied here.
CFD have been implemented for the modelling of emulsions under different
conditions. Roudsari et al. (2012) studied the mixing of W/O emulsions in lab-scale
conditions, while Oshinowo et al. (2016) analyzed the separation of the same type
of emulsions in batch gravity separators. Agterof et al. (2003). focused on the
prediction of particle size distributions and Lo et al. (2009) assessed the effect of
multiple variables on pressure distributions in W/O emulsions. Furthermore,
Vladisavljević et al. (2011) used CFD to relate microscopic and macroscopic
variables in microchannel emulsification, while Lotfiyan et al. (2014) investigated
O/W emulsion microfiltration. Finally, Gallo-Molina et al. (2017) showed that CFD is
a valuable tool in the multiscale analysis of W/O emulsions. In this same manner, a
CFD model was implemented in this study with the objective of better understanding
the effect of process variables and the resulting three-dimensional gradients in the
mixing vessel in the studied microscopic and macroscopic variables.
As previously mentioned, only the homogenization phase of the preparation
procedure was modelled and two impeller geometries were considered: the propeller
turbine, which has a low power draw and the straight paddles turbine, which has a
higher energy consumption. The characteristics in flow and other variables for the
pitched blade turbine are expected to be similar to the propeller, while analogous
similarities are expected for the Rushton and straight paddles geometries.

38
Simulations were validated with experimental data of relative viscosity and
incorporated energy for the reason that these were deemed as the main variables
for analysis in this work. Figure 4.6. shows that there is good agreement between
experimental and CFD results. As expected, the simulations reflected the differences
in energy consumption between the studied impeller geometries. Both experimental
and CFD results showed that incorporated energy during the homogenization phase
is proportional to dispersed phase concentration. As previously discussed, this is
caused by the increments in interfacial elasticity and interactions among droplets,
which ultimately impact the system hydrodynamics and increases its viscosity;
forcing the impeller to add more energy. The relation between concentration and
incorporated energy was observed to be approximately linear up until 60%-70%
dispensed phase concentration. From that point onwards, the behavior was roughly
exponential, which suggests that a saturation point was reached. This saturation
point conducted to much higher values of viscosity and incorporated energy.
Smaller values of relative viscosity were reported for the straight paddles impeller
because these values of viscosity were calculated at the shear rate provided near
the impeller. As this geometry provides more shear forces and emulsions exhibit
strong shear thinning behavior (Cohen-Addad & Höhler, 2014; Domian et al., 2014)
(this was also observed during the flow tests conducted in this study), this result was
(a) (b)
Figure 4.6. Comparison between experimental and CFD data. (a) Incorporated energy in
function of dispersed phase concentration. (b) Relative viscosity in function of
concentration.
0 20 40 60 80 1 001
1 0
100
Concentration [%]
Re
lative
Vis
co
sity
Straight Paddles. Experimental
Straight Paddles. CFD
Propeller. Experimental
Propeller. CFD
0 20 40 60 80 1 002
3
4
5
6
7
Concentration [%]
Inco
rpo
rate
d E
ne
rgy [
J/m
L]
Straight Paddles. Experimental
Straight Paddles. CFD
Propeller. Experimental
Propeller. CFD

39
to be expected as well. In both cases, there are larger errors at medium
concentrations. This is caused by the fact that this is a transition region that exhibits
a complex set of interactions, which the physical models are less able to describe.
Velocity profiles for a 10% emulsion are showed in Figure4.7. The observed results
are typical: the radial flow configuration of the straight paddles turbine produced
higher velocities in a perpendicular direction to the blades. Conversely, the axial
characteristics of the propeller induced more stratification in the velocity profile in the
vertical direction. The increases in viscosity associated with higher dispersed phase
concentrations produced a reduction in velocity magnitudes and an expansion of
dead zones. In turn, this viscosity changes are induced by the previously alluded
increases in interfacial elasticity. Furthermore, the mentioned differences in the
hydrodynamics caused by impeller geometry are critical for the properties of the
studied emulsions. This was observed in the experimental measurements (which
(a)
(b)
Figure 4.7.Transversal and axial velocity profiles (m/s) with
10% dispersed phase concentration. (a) Straight paddles
geometry. (b) Propeller geometry. Red zones indicate
velocities equal or larger than the indicated corresponding
value.

40
reflect an average over the whole content of the mixing vessel) and was deemed to
be of importance for the particularities of the three-dimensional profiles obtained
from the simulations
Figure4.8. illustrates droplet diameter profiles for three dispersed phase
concentrations. Generally larger particle sizes were predicted far from both
impellers. This is consistent with the fact that breakup is mainly produced by shear
forces in a viscous emulsification regime, which in this case was produced by the
low impeller speeds and high viscosities. The larger shear forces existing near the
blades of the impeller induce higher breakup rates, which is reflected in smaller
droplet diameters. More pronounced gradients were observed when the dispersed
phase concentration was 50%. This situation is likely caused by the discussed
influence of viscosity and stirring efficiency on droplet diameter. At 50%
concentration, the fluid viscosity is high enough to significantly reduce mixing
performance, which reduces the breakup rate and perhaps more importantly,
exacerbate its dependence to the distance from the impeller. In other words, this low
mixing performance further decreases shear forces far from the impeller, which
favors larger droplet diameters. Additionally, it can be argued that at this point of
(a) (b) (c)
(d) (e) (f)
Figure 4.8. Profile of Sauter diameter (D[3,2],µm) for different dispersed phase concentrations.
(a) 10%, straight paddles. (b) 50%, straight paddles. (c) 90%, straight paddles. (d) 10%,
propeller. (e) 50%, propeller. (f) 90%, propeller. Dark red zones indicate diameters equal or
larger than the indicated corresponding value.
41
concentration, elasticity is not enough to hinder coalescence in a sufficient degree
and thus this factor is not able to offset the grow in particle sizes far from the
agitators. The lower power draws of the propeller turbine produced an appreciable
intensification in diameter gradients. Smaller incorporated energies not only produce
higher average droplet sizes but also imply that the impeller is less able to transmit
shear to the whole content of the mixing vessel; especially the regions that are far
from the blades. Subsequently, the propeller geometry is less efficient at breaking
up bubbles far from its blades; producing more pronounced gradients.
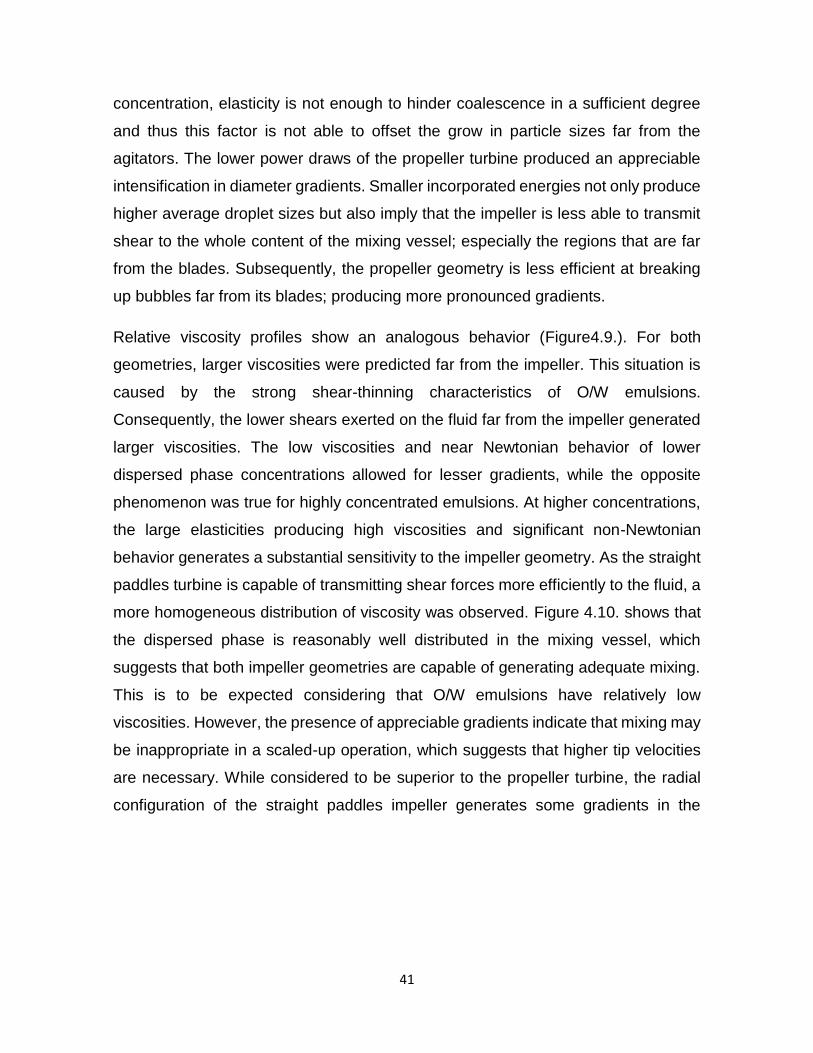
Relative viscosity profiles show an analogous behavior (Figure4.9.). For both
geometries, larger viscosities were predicted far from the impeller. This situation is
caused by the strong shear-thinning characteristics of O/W emulsions.
Consequently, the lower shears exerted on the fluid far from the impeller generated
larger viscosities. The low viscosities and near Newtonian behavior of lower
dispersed phase concentrations allowed for lesser gradients, while the opposite
phenomenon was true for highly concentrated emulsions. At higher concentrations,
the large elasticities producing high viscosities and significant non-Newtonian
behavior generates a substantial sensitivity to the impeller geometry. As the straight
paddles turbine is capable of transmitting shear forces more efficiently to the fluid, a
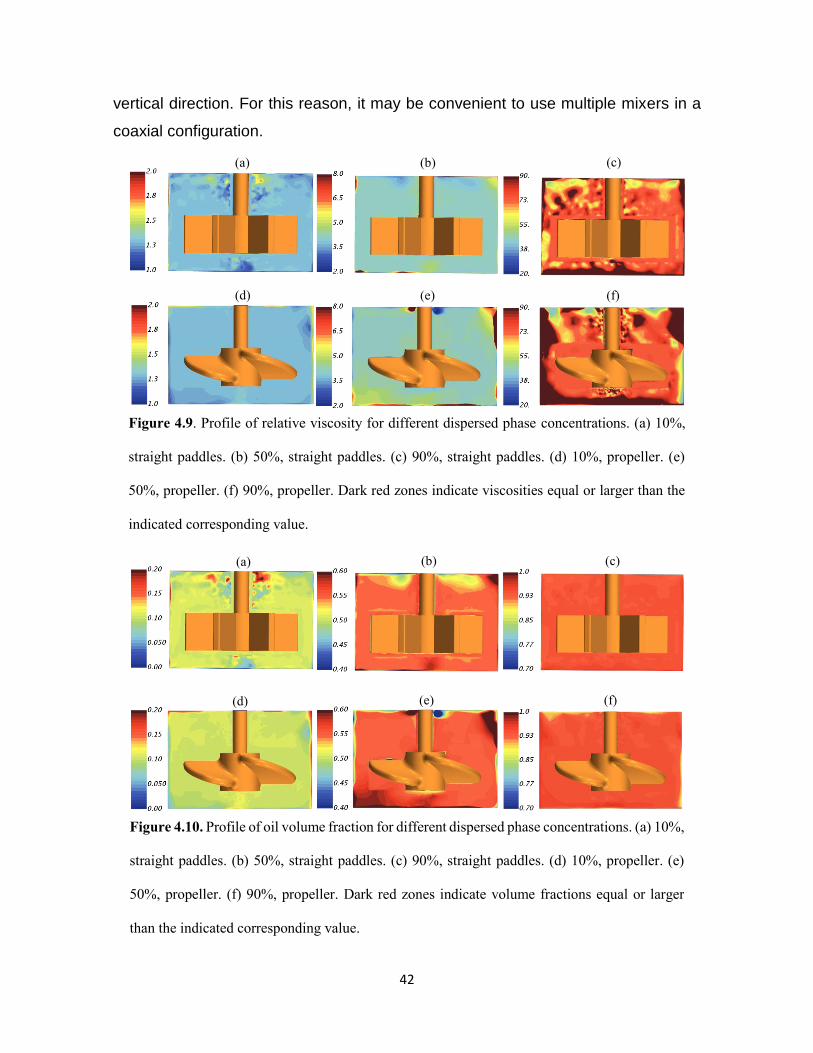
more homogeneous distribution of viscosity was observed. Figure 4.10. shows that
the dispersed phase is reasonably well distributed in the mixing vessel, which
suggests that both impeller geometries are capable of generating adequate mixing.
This is to be expected considering that O/W emulsions have relatively low
viscosities. However, the presence of appreciable gradients indicate that mixing may
be inappropriate in a scaled-up operation, which suggests that higher tip velocities
are necessary. While considered to be superior to the propeller turbine, the radial
configuration of the straight paddles impeller generates some gradients in the
42
vertical direction. For this reason, it may be convenient to use multiple mixers in a
coaxial configuration.
(a)
(d)
(b)
(e)
(c)
(f)
Figure 4.9. Profile of relative viscosity for different dispersed phase concentrations. (a) 10%,
straight paddles. (b) 50%, straight paddles. (c) 90%, straight paddles. (d) 10%, propeller. (e)
50%, propeller. (f) 90%, propeller. Dark red zones indicate viscosities equal or larger than the
indicated corresponding value.
(a)
(d)
(b)
(e)
(c)
(f)
Figure 4.10. Profile of oil volume fraction for different dispersed phase concentrations. (a) 10%,
straight paddles. (b) 50%, straight paddles. (c) 90%, straight paddles. (d) 10%, propeller. (e)
50%, propeller. (f) 90%, propeller. Dark red zones indicate volume fractions equal or larger
than the indicated corresponding value.

43
4.3. Conclusions.
In this work, CFD were used as a complement to experimental data in a multiscale
study of O/W emulsions. The systems were simulated with the Eulerian approach,
the S-gamma model for droplet size distribution and the Morris and Boulay
formulation for describing non-Newtonian rheology. The experimental part of the
work consisted of measurements of rheological data along with incorporated energy,
particle size, stability, zeta potential and stability.
Incorporated energy was treated as a transversal variable that allowed a better
understanding of the relationships among macroscopic (i.e. rheological),
microscopic (i.e. droplet size), molecular (i.e. zeta potential) and stability variables.
Higher amounts of incorporated energy were related with larger elastic modulus but,
unlike W/O emulsions studied previously under the same conditions, an inversely
proportional relation to mean droplet diameter was not observed in the entirety of the
studied range of concentrations. This phenomenon was attributed to the effect of
viscosity, mixing efficiency and low interfacial elasticity at the lower concentrations.
As expected, this situation was reflected in the stability of the emulsions. A minor
relationship between zeta potential and droplet diameter was observed. Even though
the used surfactants act via steric repulsions, this effect is expected to impact
emulsion stability. Impeller geometry was found to play an important role in most of
the studied values for the reason that geometry determines the amounts of energy
and shear forces transferred to the fluid.
After validation with relevant experimental data, CFD simulations provided three-
dimensional profiles of droplet diameter, relative viscosity and dispersed phase
volume fraction. These results were proven to be useful for the experimental part of
this study because the predicted gradients in the analyzed variables are expected to
produce significant effect in the macroscopic and microscopic response of the
systems; especially in a scaled-up situation. CFD results confirmed the
experimentally made assessment that the straight paddles impeller provides
superior mixing and emulsion characteristics in comparison to the propeller turbine.

44
Conclusions
The multiscale approach was implemented for the study of both water-in-oil and oil-
in-water emulsions. It was possible to relate macroscopic, microscopic and
molecular properties with process and product variables in a wide range of
concentrations for four different impeller geometries. Due to its importance during
the emulsification process, incorporated energy was used as a transversal variable.
CFD simulations were coupled with the experimental studies with the objective of
better understanding the link of process variables with macroscopic and microscopic
responses. The simulations were properly validated with experimental data and,
additionally, gradients in relevant variables were observed.
The growth in interfacial elasticity and droplet interactions associated with increases
in dispersed phase concentration generated marked increases in incorporated
energy for W/O and O/W emulsions. In the case of W/O emulsions, these increases
in incorporated energy were always related with smaller droplet diameters. However,
the differences in the viscosities of the dispersed and continuous phase and the poor
mixing efficiency generated a different effect in O/W emulsions: mean droplet size
was observed to be lower at low concentrations than at medium concentrations.
The interactions among droplets and the interfacial energy density were found to be
crucial for the determination of the elastic modulus in the linear viscoelastic region.
Thus, experiments showed that this variable grows with incorporated energy and
dispersed phase concentration. This modulus is an indicator of the rheological
(macroscopic) behavior of emulsions and, perhaps more importantly, a proxy for
consumer perception of a product.
Zeta potential was investigated for O/W emulsions. The encountered effects were
minor due to the stabilization mechanisms in play for the used non-ionic surfactants.
However, it was postulated that the displacement of ions (produced from
atmospheric carbon dioxide and water dissociation) by surfactant molecules has an
effect in stability and droplet size.

45
In W/O emulsions, the constant diminishments of mean droplet size and increases
in elasticity associated with growths in dispersed phase concentration generated
more stable emulsions. In contrast, the larger droplet diameters associated with
medium-concentration O/W emulsions and the smaller observed zeta potential,
caused the systems in this concentration range to be less stable than emulsions with
lower and higher concentrations.
The differences among impeller geometries in flow regimes and exerted shears
produced a significant effect in all studied variables with the exception of zeta
potential. Generally, the Rushton turbine tended to incorporate the largest amounts
of energy, which led to smaller droplet diameters and higher stabilities. The opposite
effect was observed for the pitched blade turbine.
CFD simulations predicted gradients in the studied variables to exist in the mixing
vessel. This gradients cannot be easily observed with experimental methods. In the
case of droplet diameter, the smaller shear forces far from the impeller generated
larger sizes in these regions. The better mixing efficiency of the straight paddles
turbine for O/W emulsions generated more homogeneity in this variable.
In a similar manner, the pseudoplastic behavior of both O/W and W/O emulsions
caused significant gradients in relative viscosity. Far from the impeller, the smaller
shear forces produced higher viscosities. For O/W emulsions, the straight paddles
turbine showed a better performance but small axial gradients (associated with the
radial flow figuration of the geometry) could be observed.
For both types of emulsions, the dispersed phase was predicted to be well distributed
in the whole volume of the mixing vessel. However, larger gradients were observed
as concentrations grew. This phenomenon was predicted for all of the studied
variables and was related with increasing viscosities and non-Newtonian behavior,
which constricted mixing and transport of shear by the impellers.
The presence of gradients in the studied variables implies that the mixing during the
homogenization phase is not optimal. This may be of great importance in a scale-up
operation.

46
Bibliography
Acedo-Carrillo, J. I., Rosas-Durazo, A., Herrera-Urbina, R., Rinaudo, M., Goycoolea, F. M., & Valdez, M. A. (2006). Zeta potential and drop growth of oil in water emulsions stabilized with mesquite gum. Carbohydrate Polymers, 65(3), 327–336.
Agterof, W. G. M., Vaessen, G. E. J., Haagh, G. A. A. V, Klahn, J. K., & Janssen, J. J. M. (2003). Prediction of emulsion particle sizes using a computational fluid dynamics approach. Colloids and Surfaces B: Biointerfaces, 31(1–4), 141–148.
Almeida, M. L., Charin, R. M., Nele, M., & Tavares, F. W. (2016). Stability Studies of High-Stable Water-in-Oil Model Emulsions. Journal of Dispersion Science and Technology, 2691(February), 01932691.2016.1144195.
Alvarez, O. A., Choplin, L., Sadtler, V., Marchal, P., Stebe, M. J., Mougel, J., & Baravian, C. (2010). Influence of semibatch emulsification process conditions on the physical characteristics of highly concentrated water-in-oil emulsions. Industrial and Engineering Chemistry Research, 49(13), 6042–6046.
Aoki, T., Decker, E. A., & McClements, D. J. (2005). Influence of environmental stresses on stability of O/W emulsions containing droplets stabilized by multilayered membranes produced by a layer-by-layer electrostatic deposition technique. Food Hydrocolloids, 19(2), 209–220.
Azodi, M., & Nazar, A. R. S. (2013). Experimental Design Approach to Investigate the Effects of Operating Factors on the Surface Tension, Viscosity, and Stability of Heavy Crude Oil-in-Water Emulsions. Journal of Dispersion Science and Technology, 34(2), 273–282.
Babak, V. G., Stébé, M.-J., & Fa, N. (2003). Physico-chemical model for molecular diffusion from highly concentrated emulsions. Mendeleev Communications, 13(6), 254–256.
Baldyga, J., & Podgórska, W. (1998). Drop break-up in intermittent turbulence: Maximum stable and transient sizes of drops. The Canadian Journal of Chemical Engineering, 76(3), 456–470.
Bao, Y., Yang, B., Xie, Y., Gao, Z., Zhang, Z., Liu, T., & Gao, X. (2011). Power demand and mixing performance of coaxial mixers in non-newtonian fluids. Journal of Chemical Engineering of Japan, 44(2), 57–66.
Barnes, H. a. (2000). A Handbook of Elementary Rheology. a Handbook of Elementary Rheology. Aberystwyth: Institute of Non-Newtonian Fluid Mechanics, Department of Mathematics, University of Wales Aberystwyth.
Bergstrom, L. (1997). Hamaker constants of inorganic materials. Advances in Colloid and Interface Science, 70, 125–169.
Blazek, J. (2001). Computational Fluid Dynamics: Principles and Applications.

47
(Elsevier, Ed.) (First Edit).
Boxall, J. A., Koh, C. A., Sloan, E. D., Sum, A. K., & Wu, D. T. (2010). Measurement and calibration of droplet size distributions in water-in-Oil emulsions by particle video microscope and a focused beam reflectance method. Industrial and Engineering Chemistry Research, 49(3), 1412–1418.
Brucato, A., Ciofalo, M., Grisafi, F., & Micale, G. (1998). Numerical prediction of flow fields in baffled stirred vessels: A comparison of alternative modelling approaches. Chemical Engineering Science, 53(21), 3653–3684.
Chapple, D., Kresta, S. M., Wall, A., & Afacan, A. (2002). The Effect of Impeller and Tank Geometry on Power Number for a Pitched Blade Turbine. Chemical Engineering Research and Design, 80(4), 364–372.
Cho, D., Lee, S., & Frey, M. W. (2012). Characterizing zeta potential of functional nanofibers in a microfluidic device. Journal of Colloid and Interface Science, 372(1), 252–260.
Cohen-Addad, S., & Höhler, R. (2014). Rheology of foams and highly concentrated emulsions. Current Opinion in Colloid and Interface Science, 19(6), 536–548.
Dapčević Hadnadev, T., Dokić, P., Krstonošić, V., & Hadnadev, M. (2013). Influence of oil phase concentration on droplet size distribution and stability of oil-in-water emulsions. European Journal of Lipid Science and Technology, 115(3), 313–321.
Derkach, S. R. (2009). Rheology of emulsions. Advances in Colloid and Interface Science, 151(1–2), 1–23.
Domian, E., Brynda-Kopytowska, A., & Oleksza, K. (2014). Rheological properties and physical stability of o/w emulsions stabilized by OSA starch with trehalose. Food Hydrocolloids, 44, 49–58.
Dowding, P. J., Goodwin, J. W., & Vincent, B. (2001). Factors governing emulsion droplet and solid particle size measurements performed using the focused beam reflectance technique. Colloids and Surfaces A: Physicochemical and Engineering Aspects, 192(1–3), 5–13.
Drew, D.; Lahey, R. (1993). In particulate two phase flow. Boston: Butterworth- Heinemann.
Felix, M., Romero, A., & Guerrero, A. (2017). Viscoelastic properties, microstructure and stability of high-oleic O/W emulsions stabilised by crayfish protein concentrate and xanthan gum. Food Hydrocolloids, 64, 9–17.
Foucault, S., Ascanio, G., & Tanguy, P. A. (2005). Power characteristics in coaxial mixing: Newtonian and non-newtonian fluids. Industrial and Engineering Chemistry Research, 44(14), 5036–5043.
Gallo-Molina, J. P., Ratkovich, N., & Álvarez, Ó. (2017). Multiscale Analysis of Water-in-Oil Emulsions : A Computational Fluid Dynamics Approach. Industrial
48
and Engineering Chemistry Research, 56, 7757−7767.
Ghannam, M. (2006). Stability investigation of water-in-crude oil emulsion. Journal of Applied Sciences, 6(14), 2895–2900.
Hill, D. P. (1998). The Computer Simulation of Dispersed Two-phase Flows. Imperial College, London.
Hirsch, C. (2007). Numerical Computation of Internal and External Flows. John Wiley and Sons, Chichester (Second Edi).
Kaombe, D. D., Lenes, M., Toven, K., & Glomm, W. R. (2013). Turbiscan as a tool for studying the phase separation tendency of pyrolysis oil. Energy and Fuels, 27(3), 1446–1452.
Kelly, W., & Gigas, B. (2003). Using CFD to predict the behavior of power law fluids near axial-flow impellers operating in the transitional flow regime. Chemical Engineering Science, 58(10), 2141–2152.
Klinkesorn, U., Sophanodora, P., Chinachoti, P., & McClements, D. J. (2004). Stability and rheology of corn oil-in-water emulsions containing maltodextrin. Food Research International, 37(9), 851–859.
Kowalska, M. (2016). Physical Stability and the Droplet Distribution of Rice Oil – in - Water Emulsion. Journal of Dispersion Science and Technology, 37(October 2015), 222–230.
Langevin, D. (2000). Influence of interfacial rheology on foam and emulsion properties. Advances in Colloid and Interface Science, 88(1–2), 209–222.
Leal-Calderon, F., Schmitt, V., & Bibette, J. (2007). Emulsion science, (Second Edi). New York: Springer.
Liu, B., Liu, J., Zhang, Y., Chen, M., Qin, F., & Jin, Z. (2013). Experimental research on the power consumption of a coaxial mixer in a fluid with high viscosity. Industrial and Engineering Chemistry Research, 52(20), 6862–6867.
Liu, C., Li, M., Han, R., Li, J., & Liu, C. (2016). Rheology of Water-in-Oil Emulsions with Different Drop Sizes. Journal of Dispersion Science and Technology, 37(3), 333–344.
Lo, S., & Rao, P. (2007). Modelling of droplet breakup and coalescence in an oil-water pipeline. 6th International Conference on Multiphase Flow, ICMF …, (136), 1–7. Retrieved from http://cdaes.com/sites/default/files/Presentation/2007-ICMF.pdf
Lo, S. W., Huang, K.-C., & Zhou, M.-C. (2009). CFD Study on Oil-in-Water Emulsions. Tribology Transactions, 52(April 2013), 66–72.
Lo, S., & Zhang, D. (2009). Modelling of break-up and coalescence in bubbly two-phase flows. The Journal of Computational Multiphase Flows, 1(1), 23–38.
Loewenberg, M., & Hinch, E. J. (1996). Numerical simulation of a concentrated

49
emulsion in shear flow. Journal of Fluid Mechanics, 321(1), 395.
Lotfiyan, H., Zokaee Ashtiani, F., Fouladitajar, A., & Armand, S. B. (2014). Computational fluid dynamics modeling and experimental studies of oil-in-water emulsion microfiltration in a flat sheet membrane using Eulerian approach. Journal of Membrane Science, 472, 1–9.
Maggioris, D., Goulas, A., Alexopoulos, A. H., Chatzi, E. G., & Kiparissides, C. (2000). Prediction of particle size distribution in suspension polymerization reactors: effect of turbulence nonhomogeneity. Chemical Engineering Science, 55(20), 4611–4627.
Malvern Instruments. (2009). Mie theory The first 100 years. White paper MRK1304-02. Worcestershire.
Manev, E; Pugh, R. (1991). Diffuse layer electrostatic potential and stability of thin aqueous films containing a nonionic surfactant. Langmuir, 7(10), 2253–2260.
Medrzycka, K. B. (1991). The effect of particle concentration on zeta potential in extremely dilute solutions. Colloid & Polymer Science, 269(1), 85–90.
Metzner, A. B., & Otto, R. E. (1957). Agitation of non-Newtonian fluids. AIChE Journal, 3(1), 3–10.
Mirhosseini, H., Tan, C. P., Hamid, N. S. A., & Yusof, S. (2007). Modeling the relationship between the main emulsion components and stability, viscosity, fluid behavior, ??-potential, and electrophoretic mobility of orange beverage emulsion using response surface methodology. Journal of Agricultural and Food Chemistry, 55(19), 7659–7666.
Mirhosseini, H., Tan, C. P., Hamid, N. S. A., & Yusof, S. (2008). Effect of Arabic gum, xanthan gum and orange oil contents on ζ-potential, conductivity, stability, size index and pH of orange beverage emulsion. Colloids and Surfaces A: Physicochemical and Engineering Aspects, 315(1–3), 47–56.
Morris, J. F., & Boulay, F. (1999). Curvilinear flows of noncolloidal suspensions: The role of normal stresses. Journal of Rheology, 43(5), 1213–1237.
Oshinowo, L. M., Quintero, C. G., & Vilagines, R. D. (2016). CFD and Population Balance Modeling of Crude Oil Emulsions in Batch Gravity Separation—Comparison to Ultrasound Experiments. Journal of Dispersion Science and Technology, 37(5), 665–675.
Peng, B. Z., Chen, G. J., Sun, C. Y., Liu, B., Zhang, Y. Q., & Zhang, Q. (2011). Dynamic interfacial tension between water and n -octane plus sorbitan monolaurate at (274.2 to 293.2) K. Journal of Chemical and Engineering Data, 56(4), 1617–1621.
Pradilla, D., Vargas, W., & Alvarez, O. (2015). The application of a multi-scale approach to the manufacture of concentrated and highly concentrated emulsions. Chemical Engineering Research and Design, 95(February), 162–172.

50
Qiao, X., Wang, L., Shao, Z., Sun, K., & Miller, R. (2015). Stability and rheological behaviors of different oil/water emulsions stabilized by natural silk fibroin. Colloids and Surfaces A: Physicochemical and Engineering Aspects, 475(1), 84–93.
Roland, I., Piel, G., Delattre, L., & Evrard, B. (2003). Systematic characterization of oil-in-water emulsions for formulation design. International Journal of Pharmaceutics, 263(1–2), 85–94.
Roldan-Cruz, C., Vernon-Carter, E. J., & Alvarez-Ramirez, J. (2016). Assessing the stability of Tween 80-based O/W emulsions with cyclic voltammetry and electrical impedance spectroscopy. Colloids and Surfaces A: Physicochemical and Engineering Aspects, 511, 145–152.
Roudsari, S. F., Turcotte, G., Dhib, R., & Ein-Mozaffari, F. (2012). CFD modeling of the mixing of water in oil emulsions. Computers & Chemical Engineering, 45, 124–136.
Sagis, L. M. C. (2011). Dynamic properties of interfaces in soft matter: Experiments and theory. Reviews of Modern Physics, 83(4), 1367–1403.
Salager, J.-L. (1996). Guidelines for the formulation, composition and ctirring to attain desired emulsion properties (type, droplet size, viscosity and stability). In K. Chattopadhyay, A; Mittal (Ed.), Surfactants in Solution (pp. 261–295). New York: CRC Press.
Sánchez, A., Martínez, A., Torres, L., & Galindo, E. (1992). Power consumption of three impeller combinations in mixing Xanthan fermentation broths. Process Biochemistry, 27(6), 351–365.
Schiller, L.; Naumann, A. (1933). Uber die grundlegenden Berechnungen bei der Schwerkraftaufbereitung. VDI Zeits, 77(12), 318–320.
Siemens. (2016). Star CCM+ Documentation.
Srilatha, C., Morab, V. V., Mundada, T. P., & Patwardhan, A. W. (2010). Relation between hydrodynamics and drop size distributions in pump–mix mixer. Chemical Engineering Science, 65(11), 3409–3426.
Tadros, T. F. (2013). Emulsion Formation,Stability, and Rheology. Emulsion Formation and Stability, 1–76.
Torres, L. G., & Zamora, E. R. (2002). Preparation and power consumption of surfactant-fuel oil-water emulsions using axial, radial, and mixed flow impellers. Fuel, 81(17), 2289–2302.
Uniqema. (2004). The Hlb System; Presentation to the Midwest chapter of the Society of Cosmetic Chemists.
Vankova, N., Tcholakova, S., Denkov, N. D., Ivanov, I. B., Vulchev, V. D., & Danner, T. (2007). Emulsification in turbulent flow. Journal of Colloid and Interface Science, 312(2), 363–380.

51
Vladisavljević, G. T., Kobayashi, I., & Nakajima, M. (2011). Effect of dispersed phase viscosity on maximum droplet generation frequency in microchannel emulsification using asymmetric straight-through channels. Microfluidics and Nanofluidics, 10(6), 1199–1209.
Wu, Y., Li, Q., Deng, F., Liang, X., & Liu, H. (2014). Solvent effect on ζ potential at an aqueous/oil interface in surfactant-free emulsion. Langmuir, 30(8), 1926–1931.
Yaghi, B. (2003). Rheology of oil-in-water emulsions containing fine particles. Journal of Petroleum Science and Engineering, 40(3–4), 103–110.
Zanatta, C. F., Sato, A. M. C. de F., Camargo Junior, F. B. de, Campos, P. M. B. G. M., & Rocha-Filho, P. A. (2010). Rheological behavior, zeta potential, and accelerated stability tests of Buriti oil ( Mauritia flexuosa ) emulsions containing lyotropic liquid crystals. Drug Development and Industrial Pharmacy, 36(1), 93–101.


