Multiscale analysis of waves reflected by granular media: Acoustic experiments on glass beads and effective medium theories Yves Le Gonidec 1,2 and Dominique Gibert 1,3 Received 19 May 2006; revised 20 November 2006; accepted 13 December 2006; published 10 May 2007. [1] The wavelet response is a multiscale method based on the continuous wavelet transform. We use it to characterize the acoustic reflectivity of a layer of glass beads with diameter d = 1 mm randomly arranged in water. The volumetric concentration is f ’ 63% of spherical inclusions. The wavelet response is measured over a large frequency range (100 kHz f 5 MHz) where five different acoustic regimes are identified on the basis of scattering phenomena. A strong decrease in the reflectivity occurs when the wavelength of the incident wave is twice the bead diameter, a situation where lateral scattering is dominant. The energy ratio of the ballistic and the coda parts of the wavelet response reveals a clear transition from a ballistic propagation regime to a diffusion regime where multiple scattering occurs. The experimental data are explained with an effective medium theory approach: the reflectivity data in the low-frequency domain of the spanned frequency range are correctly reproduced with quasi-static models. For higher frequencies, more sophisticated models accounting for multiple scattering must be used. The high-frequency part of the experimental reflectivity curve may be explained by strong multiple scattering at the top of the glass beads located at the surface of the layer and corresponds to the optical geometric limit. Citation: Le Gonidec, Y., and D. Gibert (2007), Multiscale analysis of waves reflected by granular media: Acoustic experiments on glass beads and effective medium theories, J. Geophys. Res., 112, B05103, doi:10.1029/2006JB004518. 1. Introduction [2] The nondestructive characterization of heterogeneous geological materials with either seismic or electromagnetic waves is an important issue which has motivated numerous studies concerned with the heterogeneous properties of the Earth from the global scale [Wysession et al., 1992; Chambers et al., 2005] down to the very small scales encountered in environmental and engineering applications [Exon et al., 1998; Pecher et al., 2003]. Near-surface layers also constitute an increasing matter of interest for either pollution concerns or safety assessment of civil engineering equipments. An example pertaining to the civil engineering industry concerns the characterization of the sea bottom [Schock et al., 1989; De Moustier and Matsumoto, 1993; Augustin et al., 1996; Orange et al., 2002; Acosta et al., 2004] for the purpose of planning the installation of optic fiber networks and communication cables or to identify resources for future mining and fishing facilities [Carter, 1992; McClatchie et al., 2000; Kostylev et al., 2001]. [3] Acoustic probing of heterogeneous interfaces requires a good knowledge of wave propagation inside the structures where strong interactions between the acoustic wave and the medium heterogeneities can occur. The interpretation of these phenomena is not straightforward: geological reflec- tors are complex, multiphase interfaces (i.e., mixtures of fluids, rocks and gas). For instance, the seafloor consists of different sedimental components (e.g., mud, silt, sand, lava) mixed with water, constituting heterogeneous substrates [Goff et al., 2000; Le Gonidec et al., 2005]. The main physical parameters derived from echo sounder data are the velocity and the attenuation of the coherent waves, i.e., the specular reflections. Attenuation of broadband Chirp signals is used for sediment classification [Vandenplas et al., 2000; Stevenson et al., 2002; Gutowski et al., 2002]. Attenuation is frequency-dependent, and new acoustic techniques use multifrequency methods [Vanneste et al., 2001; Walter et al., 2002; Lambert et al., 2002; Price, 2006]. [4] Wave propagation inside complex media has been intensively described and has motivated numerous studies [e.g., O’Doherty and Anstey , 1971; Sheng et al., 1986; Burridge et al., 1988, 1993; Scales, 1993; Page et al., 1995; Cowan et al., 1998; Derode et al., 1998; Tournat et al., 2004; Marchetti et al., 2004; Dineva et al., 2006]. The interaction of the acoustic wave with a complex interface is strongly controlled by the ratio l/d of the incident wave- length to the heterogeneity size [Le Gonidec et al., 2002]: At the macroscopic scale, when the wavelength l is much JOURNAL OF GEOPHYSICAL RESEARCH, VOL. 112, B05103, doi:10.1029/2006JB004518, 2007 Click Here for Full Articl e 1 Ge ´osciences Rennes, CNRS/INSU UMR 6118, Universite ´ Rennes 1, Rennes, France. 2 Now at Ge ´osciences Azur, CNRS/INSU UMR 6526, Observatoire Oce ´anologique de Villefranche-sur-Mer, Villefranche-sur-Mer, France. 3 Also at GdR Formations Ge ´ologiques Profondes, CNRS/Agence Nationale pour la gestion des De ´chets Radioactifs, Rennes, France. Copyright 2007 by the American Geophysical Union. 0148-0227/07/2006JB004518$09.00 B05103 1 of 12
Transcript
Multiscale analysis of waves reflected by granular
media: Acoustic experiments on glass beads and
effective medium theories
Yves Le Gonidec1,2 and Dominique Gibert1,3
Received 19 May 2006; revised 20 November 2006; accepted 13 December 2006; published 10 May 2007.
[1] The wavelet response is a multiscale method based on the continuous wavelettransform. We use it to characterize the acoustic reflectivity of a layer of glass beads withdiameter d = 1 mm randomly arranged in water. The volumetric concentration is f ’ 63%of spherical inclusions. The wavelet response is measured over a large frequencyrange (100 kHz � f � 5 MHz) where five different acoustic regimes are identified on thebasis of scattering phenomena. A strong decrease in the reflectivity occurs when thewavelength of the incident wave is twice the bead diameter, a situation where lateralscattering is dominant. The energy ratio of the ballistic and the coda parts of the waveletresponse reveals a clear transition from a ballistic propagation regime to a diffusion regimewhere multiple scattering occurs. The experimental data are explained with aneffective medium theory approach: the reflectivity data in the low-frequency domain of thespanned frequency range are correctly reproduced with quasi-static models. For higherfrequencies, more sophisticated models accounting for multiple scattering must be used.The high-frequency part of the experimental reflectivity curve may be explained by strongmultiple scattering at the top of the glass beads located at the surface of the layer andcorresponds to the optical geometric limit.
Citation: Le Gonidec, Y., and D. Gibert (2007), Multiscale analysis of waves reflected by granular media: Acoustic experiments on
glass beads and effective medium theories, J. Geophys. Res., 112, B05103, doi:10.1029/2006JB004518.
1. Introduction
[2] The nondestructive characterization of heterogeneousgeological materials with either seismic or electromagneticwaves is an important issue which has motivated numerousstudies concerned with the heterogeneous properties of theEarth from the global scale [Wysession et al., 1992;Chambers et al., 2005] down to the very small scalesencountered in environmental and engineering applications[Exon et al., 1998; Pecher et al., 2003]. Near-surface layersalso constitute an increasing matter of interest for eitherpollution concerns or safety assessment of civil engineeringequipments. An example pertaining to the civil engineeringindustry concerns the characterization of the sea bottom[Schock et al., 1989; De Moustier and Matsumoto, 1993;Augustin et al., 1996; Orange et al., 2002; Acosta et al.,2004] for the purpose of planning the installation of opticfiber networks and communication cables or to identifyresources for future mining and fishing facilities [Carter,1992; McClatchie et al., 2000; Kostylev et al., 2001].
[3] Acoustic probing of heterogeneous interfaces requiresa good knowledge of wave propagation inside the structureswhere strong interactions between the acoustic wave and themedium heterogeneities can occur. The interpretation ofthese phenomena is not straightforward: geological reflec-tors are complex, multiphase interfaces (i.e., mixtures offluids, rocks and gas). For instance, the seafloor consists ofdifferent sedimental components (e.g., mud, silt, sand, lava)mixed with water, constituting heterogeneous substrates[Goff et al., 2000; Le Gonidec et al., 2005]. The mainphysical parameters derived from echo sounder data are thevelocity and the attenuation of the coherent waves, i.e., thespecular reflections. Attenuation of broadband Chirp signalsis used for sediment classification [Vandenplas et al., 2000;Stevenson et al., 2002; Gutowski et al., 2002]. Attenuationis frequency-dependent, and new acoustic techniques usemultifrequency methods [Vanneste et al., 2001; Walter etal., 2002; Lambert et al., 2002; Price, 2006].[4] Wave propagation inside complex media has been
intensively described and has motivated numerous studies[e.g., O’Doherty and Anstey, 1971; Sheng et al., 1986;Burridge et al., 1988, 1993; Scales, 1993; Page et al.,1995; Cowan et al., 1998; Derode et al., 1998; Tournat etal., 2004; Marchetti et al., 2004; Dineva et al., 2006]. Theinteraction of the acoustic wave with a complex interface isstrongly controlled by the ratio l/d of the incident wave-length to the heterogeneity size [Le Gonidec et al., 2002]:At the macroscopic scale, when the wavelength l is much
JOURNAL OF GEOPHYSICAL RESEARCH, VOL. 112, B05103, doi:10.1029/2006JB004518, 2007ClickHere
for
FullArticle
1Geosciences Rennes, CNRS/INSU UMR 6118, Universite Rennes 1,Rennes, France.
2Now at Geosciences Azur, CNRS/INSU UMR 6526, ObservatoireOceanologique de Villefranche-sur-Mer, Villefranche-sur-Mer, France.
3Also at GdR Formations Geologiques Profondes, CNRS/AgenceNationale pour la gestion des Dechets Radioactifs, Rennes, France.
Copyright 2007 by the American Geophysical Union.0148-0227/07/2006JB004518$09.00
larger than the microstructure characteristic size d, theRayleigh regime dominates and static effective mediumtheories provide a useful framework to derive the macro-scopic properties of composite materials [e.g., Chylek etal., 2000]. Such static methods describe the frequency-independent properties of the equivalent homogeneousmedium and has been studied by many authors [Foldy,1945; Hashin and Shtrikman, 1963; Kuster and Toksoz,1974; Berryman, 1980; Berryman and Berge, 1996; Aristeguiand Angel, 2002]. In the mesoscale domain where l ’ d, theinteraction between the acoustic wave and the microstruc-ture of the medium strongly depends on the ratio l/d, anddynamic effective medium theories have been proposed toaccount for both the frequency-dependent properties ofmultiphase composites and multiple scattering [Watermanand Truell, 1961; Sheng, 1995; Busch and Soukoulis, 1996].[5] In the present paper, we study the frequency depen-
dence of the acoustic reflectivity of a layer made of adensely packed granular medium. In particular, we examinethe influence of the ratio l/d by means of the ‘‘waveletresponse’’ introduced in a previous paper [Le Gonidec et al.,2002]. Similar to the continuous wavelet transform, definedas the convolution between the analyzed signal and a familyof wavelets obtained from a given analyzing function (seeHolschneider [1995] for an introduction), the waveletresponse also uses a family of wavelets which are propa-gated (NOT convolved) through the medium to be analyzed.The properties of the wavelet transform concerning thecharacterization of abrupt changes in signals [e.g., Mallatand Hwang, 1992; Herrmann, 1994; Alexandrescu et al.,1995, 1996] are retrieved in the wavelet response. Thismethod may therefore be used to remotely probe the multi-scale structure of complex interfaces [Herrmann and Staal,1996; Wapenaar, 1998, 1999; Marsan and Bean, 1999] andmore generally of heterogeneous structures. When com-
pared to other analyzing methods, the wavelet responsecharacterizes the multiscale interface structure over a verylarge dilation range both in the time and frequency domains.[6] In section 1, we recall the main steps of the wavelet
response method and we present the acoustic experiments.We measure the wavelet response of a biphase compositemedium made of a dense packing of glass beads surroundedby fluid. We analyze the acoustic response of the granularmedium from the wavelet response data, and we identifyfive characteristic frequency ranges. In section 2, we discussthe observed macroscopic effects from a microscale point ofview. We show that the scattering diagram of a single glassbead can explain the acoustic response of the granularmedium. We put in evidence the propagation-to-diffusiontransition. Sections 3 and 4, we introduce and compareeffective medium theories with the experimental data. Wedefine the frequency ranges where the theories agree withthe data and discuss the results.
2. Acoustic Reflectivity of a Layer of Glass Beads
2.1. Principles of the Method and Experiments
[7] In order to analyze the acoustic response of a granularmedium, we use the wavelet response method, a multiscaleanalysis technique based on the continuous wavelet trans-form introduced in details in previous papers [Le Gonidec etal., 2002, 2003]. The main idea at the basis of the waveletresponse is to use a family of incident waves whose sourcesignals constitute a wavelet family as shown in Figure 1(i.e., a set of signals with constant shape and differentdurations). The experimental wavelet family is obtainedby simulated annealing [Conil et al., 2004]. The advantageof this method is to span a wide frequency range whilekeeping a good temporal localization of the source signals,this allows an optimal identification of the signals reflected
Figure 1. (a) One member of the experimental wavelet family. Each wavelet is inverted in order to bestfit with the fourth derivative of a Gaussian: (d4/dt4)exp(�t2). (b) Assemblage of the whole experimentalwavelet family obtained by ranking each wavelet with respect to its dilation inversely proportional to itscentral frequency.
B05103 LE GONIDEC AND GIBERT: MULTISCALE ANALYSIS OF REFLECTED WAVES
2 of 12
B05103
by the target, both in time and frequency domains. Anotheradvantage is to avoid postprocessing operations like noise-sensitive deconvolution as often required in more conven-tional methods where the source signals are not controlled.The wavelet response has the further advantage to deter-mine the homogeneity degree of a target geometry in termsof discontinuities. This has been described in previouspapers [Le Gonidec et al., 2002, 2003] where planarinterfaces can be assimilated to Dirac-like and Heaviside-like discontinuities at low and high frequencies, respec-tively. A detailed account of the properties of the wavelettransform with respect to homogeneous functions is givenby Mallat and Hwang [1992] and by Alexandrescu et al.[1995, 1996] for geophysical applications.[8] The wavelet family used in the present study consists
in 30 wavelets (Figure 1b) spanning a frequency rangegoing from 200 kHz to 1 MHz. It has been generated bymeans of four pairs of transducers with central frequenciesof 250, 500, 750, and 1000 kHz. The analyzing wavelet isthe fourth derivative of a Gaussian function (Figure 1a) inorder to have a well-defined central frequency while beingsufficiently localized in time.[9] The experimental setup shown in Figure 2 has already
been discussed in details by Le Gonidec et al. [2002]. Itconsists in a rigid frame holding two transducers mounted inthe normal incidence configuration, one for the emissionand one for the reception. The acoustic reflector is agranular medium composed of a thick layer of glass beads.
Both the transducers and the medium are immersed in thewater of an acoustic tank. The medium is roughly 60 cmbelow the transducers and can be translated in order tomeasure the mean acoustic field in the far-field conditions.The experimental wavelet response of the medium is con-structed by successively emitting each source signal (i.e.,wavelet) and averaging the reflected signals.[10] The glass beads of the granular medium are densely
packed in a box, and the porosity derived from massmeasurements is 37%. The concentration of the glass beadsis f ’ 63%, typical of a random close packing [Page et al.,1995, 1996] and significantly smaller than the densestconcentration of 74% corresponding to a face-centeredcubic packing of spherical inclusions [Neser et al., 1997].[11] A relevant nondimensional control parameter of the
experiment is the ratio l/d between the incident waveletwavelength l to the bead diameter d. Indeed, the granularmedia used in the present study have a porosity independentof the bead diameter and experimentally measured around37% for all glass bead diameters. Then, the acousticresponse of a granular medium only depends on the ratiol/d: the glass beads are monodisperse and uniformlypacked, so the wavelet responses measured for differentbead diameters d may be rescaled to a common diameterand merged to obtain a global wavelet response spanning awider range of the l/d ratio. The wavelet response ismeasured for six different granular media with bead ofdiameters d = 0.6, 1, 2, 3, 4, and 5 mm, respectively.These individual wavelet responses are further rescaled atan equivalent unique diameter d = 1 mm and for acorresponding frequency range 100 kHz � f � 5 MHz(Figure 3). We emphasize that the reference wavelet res-ponse is associated to a perfect half-space reflector.
2.2. Identification of the Coherent Frequency Bands
[12] Thanks to the controlled shape of the sourcesignals used in the wavelet response method, the distor-tions observed in the wavelet response of the granularmedia when compared with the reference wavelet responseof a perfect reflector (Figures 3a and 1b, respectively) maysafely be attributed to wave phenomena produced by theheterogeneous nature of the glass bead layer. Both waveletresponses have a similar appearance at low frequency, anddiscrepancies are larger and larger when the frequencyincreases. The intermediate wavelength domain l ’ pdmarks a clear limit between the low-frequency domainwhere both wavelet responses look very similar with acommon conical-like structure, and a high-frequency domainwhere the conical structure of the wavelet response becomesvery complex in the case of glass beads.[13] A quantitative analysis of the wavelet response may
be done from its so-called ridge functions as detailed byLe Gonidec et al. [2002, 2003]. The analyzing waveletused in the present study counts five extrema (Figure 1a)from which five ridge functions may be defined. Eachridge function is locked on a given extrema and may befollowed across the dilation range spanned by the wholewavelet family. The average amplitude of the waveletresponse along a given ridge function may be plotted ina log-log diagram as a function of the l/d ratio as shownin Figure 3b. This average curve represents the reflectivity
Figure 2. (a) Experimental setup holding two piezo-electric transducers above a rolling box filled with glassbeads. The box can be horizontally translated while stackingthe reflected signals in order to record the mean field.(b) Monodisperse glass beads randomly distributed in water.The concentration f ’ 0.63 roughly corresponds to109 beads/m3 for d = 1 mm.
B05103 LE GONIDEC AND GIBERT: MULTISCALE ANALYSIS OF REFLECTED WAVES
3 of 12
B05103
curve of the layer of monodisperse glass beads, andconstitutes the data which we now discuss in details.[14] A first interpretation of the wavelet response may be
done in the framework of homogeneous discontinuityanalysis [Le Gonidec et al., 2002, 2003]. From this pointof view, the reflectivity curve may be decomposed instraight line segments with different slopes a (Figure 3b)which depend on the homogeneity degree of the disconti-nuity present at the acoustical interface (i.e., zero for a step-like transition). By this way, five frequency domains labeled
from I to V are recognized in the experimental reflectivitycurve. The limits of these domains correspond to remark-able reduced wavelengths, l/d, represented as verticaldashed segments in Figure 3b: the corner wavelengthscorrespond to l = 2pd, pd, pd/2 and 2 d/p, respectively.[15] The dotted curve in Figure 3a marks the upper time
limit of the wavelets used as source signals (Figure 1b). Inbands I and II, the duration of the wavelet responsecoincides with this limit, while it is much larger in bandsIII, IV, and V because of the presence of a long coda wave.
Figure 3. (a) Experimental wavelet response of a layer of glass beads with diameter d. The horizontalaxis represents the nondimensional control parameter l/d, the time axis is vertical, and the color scalerepresents the amplitude of the averaged reflected signal. The black dots mark the time limit of thereference wavelet shown in Figure 1: The coherent ballistic component of the wavelet response is locatedbefore this limit, and the coda component comes after. (b) Amplitude of the ballistic component of thewavelet response shown in Figure 3a. In this log-log diagram, the average curve (solid line) appearsmostly linear in 4 frequency bands represented by straight segments with slopes equal to 0, +1, +2, and 0from left to right, respectively.
B05103 LE GONIDEC AND GIBERT: MULTISCALE ANALYSIS OF REFLECTED WAVES
4 of 12
B05103
2.2.1. Long-Wavelength Domain[16] The long-wavelength domains I–II correspond to
reduced wavelengths l > pd where the wavelet responseof the granular medium has a simple conical appearanceidentical to the reference wavelet response with 5 ridgefunctions (Figures 3a and 1b, respectively). In thesedomains, the wave reflected by the surface of the granularmedium appears as a single wave packet, identical to whathappens for an Heaviside-like discontinuity. The distinctionbetween domains I and II is motivated by the slope breakobserved in the ridge functions at l = 2dp.[17] In domain I, the ridge function is flat with a = 0
indicating that the reflectivity does not depend on thefrequency of the incident wave. The experimental reflectioncoefficient R = 0.34 is identical to the one predicted for anhomogeneous half-space interface as shown in section 5.1[Le Gonidec et al., 2002].[18] The reflectivity observed in domain II is frequency-
dependent indicating that the granular medium can beassimilated to a homogeneous half-space with frequency-dependent properties. The reflectivity linearly decreasesfrom R = 0.34 to R = 0.15 as the wavelength shortens(in a log-log plot). The frequency attenuation for glassbeads d = 1 mm is then estimated to 0.02 dB/kHz. Insection 3, we give physical interpretation of this decreasedue to scattering processes which get stronger as thereduced wavelengths l/d shortens.2.2.2. Intermediate-Wavelength Domain[19] Domain III covers the range pd > l > pd/2 where the
simple cone-like appearance of the wavelet response prog-ressively disappears and splits into subconical structures atl ’ 2d (Figure 3a). Observed from Figure 3b, the ampli-tude of the ridge functions does not obey a power law andthe reflectivity curve presents a deep minimum R ’ 0.025at l ’ 2d. The temporal limit plotted in black dots inFigure 3a does not coincide with the time of the referencewavelet response: we observe reflected wave trains longerin time than the reference wavelets. Strong interactionsoccur inside the granular medium between the acousticwave and the glass beads. We associate domain III to thetransition region where the glass bead layer cannot beassimilated to a Heaviside-like interface but appears to bea complex structure.2.2.3. Short-Wavelength Domain[20] Domains IV–V correspond to the wavelength range
l < pd/2 where the reflected wave trains have a total durationmuch longer than the one of the reference wavelets. Thereflected waves are mainly composed of a late coda typicalof strong multiple scattering between the source signals andthe small-scale structures of the granular medium. A strongdecrease of the ridge functions is observed in domain IVwith a slope a = +2 for pd/2 > l >2 d/p where the frequencyattenuation is 0.04 dB/kHz for glass beads d = 1 mm. Indomain V, the slope of the ridge function is roughly a ’ 0when r < 2/p where the experimental data are scatteredaround a mean reflectivity R ’ 0.01.
3. Acoustic Wave Phenomena
3.1. Definition of Scattering Parameters
[21] The amplitude f of an acoustic plane wave scatteredby an inclusion depends both on the l/d ratio and on the
observation angles (q, f). For a spherical scatterer, f (q, f) =f (q) and, in the forward scattering q = 0 and back-scatteringq = p directions, the far-field amplitudes are [McClementsand Povey, 1989]
f 0ð Þ ¼ 1
ikm
X1n¼0
2nþ 1ð ÞAn ð1Þ
f pð Þ ¼ 1
ikm
X1n¼0
�ið Þn 2nþ 1ð ÞAn; ð2Þ
where k is the wave number in the fluid matrix. The termsAn [Goodman and Stern, 1962] include the physicalproperties of the materials.[22] The scattering cross section ss(q) is defined by
ss ¼ f qð Þj j2 ð3Þ
and represents the distribution of the intensity scattered in agiven direction. The total scattering cross section st isdefined by
st ¼Z
ssd qð Þ; ð4Þ
and the extinction coefficient of an isolated scatterer is thetotal scattering cross section st normalized by the geome-trical cross section. For a spherical scatterer, the geometricalcross section is sg = p d2/4.[23] In average, an acoustic wave propagating in a com-
plex medium is characterized by an exponential decay andthe wave coherence disappears as the wave propagates. Thecorresponding distance, coherently traveled by the wavesinside the heterogeneous medium until 1/3 of the incidentenergy is annihilated by multiple scattering, is defined as themean free path l(r):
l rð Þ ¼ 1=nst ; ð5Þ
where n is the number of scatterers per volume unit and st isthe total scattering cross section of a single scatterer.
3.2. Small-Scale Scattering
[24] In this section, we discuss the characteristics of thescattered wavefield with respect to the five frequency bandsidentified from the ridge functions (Figure 3b). The resultsare presented as two-dimensional (2-D) radiation diagramswhich are computed for a spherical scatterer with thephysical properties of the glass. Figure 4a shows thesediagrams representing the amplitude, j f(q)j2, of the wave-field re-radiated by a scatterer in response to an incidentwave traveling in the q = p direction. The q = 0 and q = pdirections correspond to the longitudinal back and forwardscattering directions, respectively. Transverse scatteringcorresponds to q = ±p/2. A first glance at Figure 4areveals that each frequency band corresponds to a parti-cular scattering regime, from back scattering in domainsI–II to forward scattering in domains IV–V. This isquantitatively assessed by examining the curves shown
B05103 LE GONIDEC AND GIBERT: MULTISCALE ANALYSIS OF REFLECTED WAVES
5 of 12
B05103
in Figures 4b and 4c which represent the back-to-forwardand transverse-to-longitudinal ratios of the scattered ampli-tudes, respectively.[25] The curve of Figure 4b indicates that in the low-
frequency bands I–II, the back-scattered energy is about1 order of magnitude larger than the energy re-radiated inthe forward direction. The energy ratio is constant andequal to 10 in domain I and begins to decrease indomain II. The low-frequency bands correspond to adominant back-scattering regime. The energy balance inthe high-frequency bands IV–V is opposite to whathappens in bands I–II with the forward scattered energyabout one, and even two, orders of magnitude larger thanthe energy reradiated in the backward direction. Thehigh-frequency bands correspond to a dominant forwardscattering regime where most of the incident energy isscattered deeper in the bead layer. The experimental limitbetween domains IV–V falls on a strong perturbation ofboth the back-to-forward and transverse-to-longitudinal
ratios of cross sections corresponding to a sharp Mieresonance line.[26] The curve of the transverse-to-longitudinal energy
ratio (Figure 4c) possesses an absolute maximum centeredin band III which separates the low-frequency domainwhere the layer of glass beads behaves as a simplereflector, i.e., the conical pattern of the wavelet responsein Figure 3b, and the high-frequency range where the layerof beads behaves as a random medium re-radiating adiffuse wavefield. Band III is also remarkable in the sensethat the backscattered and forward scattered energies areequal for l = 2d where the transverse-scattered energy ismaximum, up to 1 order of magnitude larger than thelongitudinal-scattered energy (Figure 4c). The intermediatefrequency band then corresponds to a dominant transverse-scattering regime. Both experimental frequency limits ofdomain III correspond to the equilibrium between thetransverse-to-longitudinal energy ratio, as predicted bythe scattering patterns for a single scatterer.[27] The frequency bands identified from the experi-
mental data correspond to particular radiation diagramscomputed for a single bead: the macroscopic response of themonodisperse granular medium appears to be controlled byscattering processes at the microscopic scale. Each scatterercontributes coherently in the mean reflected field inducinga strong link between the behavior of a single bead andthat of many. In particular, note the semblance betweenthe reflectivity curve (Figure 3b) representative of theenergy reflected by the whole granular medium, and theback-to-forward energy ratio (Figure 4b) representative ofthe energy reflected by a single glass bead. We can interpretthe strong decrease in the wavelet response amplitude,observed in band III of the ridge function curves(Figure 3b), as a significant amount of the incident waveenergy reradiated perpendicularly to the incident direction.The similarity we found with results from single scatteringmodel occurs in the mean-field measurements of thebackscattered energy where multiple-scattering processesare averaged in the experimental results.
3.3. Propagation-to-Diffusion Transition
[28] We now consider in more details what happens in thewavelength band III which corresponds to the transitionbetween the long-wavelength domain, where the granularmedium is equivalent to a simple localized reflector, and theshort-wavelength domain, where multiple scattering occursand induces back-scattered coda wavefield. The waveletresponse method allows for separating the ballistic waveand the coda waves to perform a quantitative study of theenergy balance between these two components of the back-scattered wavefield. The time of the ballistic arrival (dottedcurve in Figure 3a) corresponding to the reference waveletresponse of Figure 1b is used to distinguish the coherentballistic reflection from the late arrivals forming the coda.We calculate the associated energies Eb and Ec by integra-ting the two signal components, respectively. The ballistic-to-coda energy ratio Eb/Ec is plotted as a function of l/d in alog-log diagram (Figure 5a).[29] The ballistic energy is 1 order of magnitude larger
than the coda energy in domains I–II and down to 2 ordersof magnitude smaller in domains IV–V. At low frequen-cies, the reflected energy comes from coherent reflection at
Figure 4. (a) Directivity patterns, i.e., the scattering of aplane wave coming from the right and incident on a sphericalinclusion, computed for each frequency domain. (b) Back-to-forward ratio of scattering amplitude defined as j f (0)j2/j f (p)j2. Bands I and II and bands IV and V correspond todominant back scattering and to dominant forward scatter-ing, respectively. (c) Transverse-to-longitudinal ratio ofscattering amplitude defined as j f (p/2)j2/max [j f (p)j2,j f (0)j2]. Band III corresponds to the frequency domainwhere transverse scattering is dominant. In all three plots, thevertical dashed lines indicate the experimental frequencylimits defined from the wavelet response analysis.
B05103 LE GONIDEC AND GIBERT: MULTISCALE ANALYSIS OF REFLECTED WAVES
6 of 12
B05103
the interface, whereas it is mainly associated to multiplescattering at high frequencies where the scattered wavesfollow long tortuous paths in the heterogeneous medium.[30] In frequency band I, the extinction coefficient
follows a Rayleigh scattering law /l�4 [Ishimaru, 1978](Figure 5b) indicating a single-scattering regime inside thegranular medium when l > 2pd where propagation dom-inates. In domain II, transverse scattering increases for asingle bead (Figure 4c), and the single-scattering regime isless and less valid. Domains IV–V correspond to multiple-scattering regime.[31] At intermediate frequencies of domain III, the
energies of the ballistic component and the coda areequivalent when l = 2d, corresponding to a strongtransition of a propagation regime at low frequencies toa diffusion regime at high frequencies. These experimentalresults on mean-field measurements (solid line inFigure 5a) are similar to the theoretical curve of the back-to-forward scattering energy ratio computed for a singleglass bead (dotted line in Figure 5a) which microscopic
coherency induces the macroscopic behavior of the granularmedium.
4. Effective Medium Theories
4.1. Single-Scattering Regime
[32] We now consider effective medium models andconsider their efficiency to reproduce the experimentalreflectivity curve discussed in sections 2 and 3. A first classof models concerns the quasi-static models whose effectivemedium properties do not depend on the frequency. This isfor instance the case of the models proposed by Kuster andToksoz [1974] and by Berryman [1980] in the context ofgeophysical applications. These models are fully con-strained by the experimental physical and geometricalproperties of the granular medium, namely the shape, size,concentration and nature of both the inclusions (i.e., glassbeads) and the fluid matrix (i.e., water). The models ofKuster and Toksoz [1974] and of Berryman [1980] are bothderived by considering the statistical properties of a largenumber of elastic spherical inclusions randomly dispersedin a fluid matrix. The diffusing spheres of diameter doccupy a volume fraction f and their scattered far field iscomputed for signal wavelengths l � d using the single-scattering approximation. The physical properties of theequivalent homogeneous medium are the effective density,r*, and the effective compressibility modulus K*.[33] In the model of Kuster and Toksoz [1974], the cluster
of spheres embedded in the fluid matrix is replaced by ahomogeneous equivalent sphere such that the scattered farfield is unchanged in the fluid matrix. With this constrain,the effective density r*KT of the effective medium is a real-valued quantity given by
rm � r*KTrm þ 2r*KT
¼ frm � rsrm þ 2rs
; ð6Þ
where rs and rm are the densities of the sphericalinclusions and the fluid matrix, respectively. Theconcentration of elastic inclusions in the fluid matrix is0.74 > f � 0. The effective compressibility modulus K*KTis defined by Wood’s law:
1
K*¼ f
Ks
þ 1� fKm
; ð7Þ
where Ks and Km are the compressibility moduli of thespherical inclusions and the fluid matrix, respectively.[34] In the model of Berryman [1980], the same cluster of
spherical inclusions in material s embedded in a fluid matrixm is replaced by a compound of inclusions in a homoge-neous equivalent matrix * such that no scattered field isradiated outside the cluster of inclusions in material i and m,respectively, embedded in the effective medium *. Underthis constrain, the effective density r*B is a real-valuedparameter defined by
1
r*B þ 12r*B
¼ f
rs þ 12r*B
þ 1� f
rm þ 12r*B
: ð8Þ
Note that formula (8) for the effective density is symmetricunder interchange of constituent labels, m for the fluid
Figure 5. (a) Experimental curve representing the energyratio between the ballistic energy and the back-scatteredenergy extracted from the wavelet response of the glassbead layer (see Figure 3a). Domain III corresponds to thetransition between a propagation regime to a diffusionregime, identified in the domains I – II and IV–V,respectively. (b) Extinction coefficient (solid line), i.e., totalscattering cross section divided by the geometrical crosssection p d2/4. Also shown are the five frequency bandsidentified in the data (see Figure 3). In band I, the scatteringcross section closely follows the Rayleigh scattering powerlaw (/l�4) (dashed line).
B05103 LE GONIDEC AND GIBERT: MULTISCALE ANALYSIS OF REFLECTED WAVES
7 of 12
B05103
matrix and s for the spherical inclusions which concentra-tions are (1 � f) and f, respectively.[35] The effective velocity c* of the fluid equivalent
homogeneous medium is a real value and the effectivereflectivity g* follows the real acoustic impedance contrastexpressed in equation (9):
where cm = 1480 m/s and rm = 1000 kg/m3 is the soundvelocity and density of water, respectively.
4.2. Multiple-Scattering Regime
[36] Waterman and Truell [1961] have proposed aneffective medium theory taking multiple scattering intoaccount. This model has been applied to the problem ofan elastic wave scattered by a finite number of inclusionsinside a homogeneous matrix [McClements and Povey,1989; Anson and Chivers, 1993; Robert et al., 2004]. Thismodel also considers the case of spherical scatterersembedded in a fluid matrix. The model is fully constrainedby the physical parameters of the experimental granularmedium. The properties of the effective equivalent mediumare frequency-dependent, and the model of Waterman andTruell [1961] belongs to the so-called class of dynamiceffective models.[37] From a granular medium made of spherical inclu-
sions, Waterman and Truell [1961] define an equivalenthomogeneous medium whose effective properties are char-acterized by complex value parameters, the imaginary partof which stands for scattering absorption. The effectivemedium wave number k*, expressed by
k*
km
!2
¼ 1þ 2pnf 0ð Þk2m
� �2
� 2pnf pð Þk2m
� �2
; ð10Þ
is complex valued owing to the scattering parameters f (0)and f (p) which are the diffusion amplitudes of a singlescatterer in the back- and forward scattering direction,respectively (see Sheng [1995] for details). The wavenumber km is the (real) wave number in the fluid matrix andn = 6f/pd3 is the number of elastic spherical inclusions pervolume unit. The inclusions are supposed to be uniformlydistributed.[38] From equation (10), the effective velocity of the
equivalent fluid medium is also a complex-valued quantityand is expressed in equation (11) corresponding to theeffective medium immersed in water (cm and km are thesound velocity and the wave number in the water, respec-tively). The effective reflectivity g* following the acousticimpedance contrast is given by equation (11) (the reflectioncoefficient of the glass bead layer is defined as the modulusof the effective reflectivity):
c* ¼ cmkm
k*; g*
¼ r*c* � rmcmr*c* þ rmcm
: ð11Þ
5. Comparison With the Experimental Dataand Discussions
5.1. Very Long Wavelength Domain
[39] Identified from the experimental wavelet response,domain I is characterized by five ridge functions whichslope is a = 0 in a log-log diagram for wavelengths l > 2 pd(Figure 3b). In this frequency band, the interface betweenwater and the layer of glass beads can be represented by asharp Heaviside-like interface between water and an equi-valent homogeneous medium with frequency-independentproperties. The reflected field is measured in the far-fieldcondition and the extinction coefficient curve plotted in
Figure 6. Experimental reflectivities (dots and solid line) extracted from the granular medium waveletresponse superimposed with the equivalent theoretical reflectivities gKT* = 0.34 and gB* = 0.37 computedfrom Kuster and Toksoz [1974] and Berryman [1980], respectively (dashed vertical lines). The dashedhorizontal line stands for the reflectivity g = 0.81 of a pure bulk glass. The horizontal arrows in the upperright part of the graph represent the upper and lower reflectivity bounds of Hashin and Shtrikman [1963].
B05103 LE GONIDEC AND GIBERT: MULTISCALE ANALYSIS OF REFLECTED WAVES
8 of 12
B05103
Figure 5b shows the wave phenomenon at work in band I isa Rayleigh single-scattering regime.[40] Using the physical properties of experimental gran-
ular medium, the characteristics of the effective mediumgiven by the models of Kuster and Toksoz [1974] and ofBerryman [1980] may be computed to obtain the effectivereflectivity g*. We obtain gKT* = 0.34 and gB* = 0.37 for themodels of Kuster and Toksoz [1974] and of Berryman[1980], respectively. As can be seen in Figure 6, thesetheoretical reflectivity coefficients are in good agreementwith the experimental curve in domain I. Also shown forcomparison is the reflectivity g = 0.81 of bulk glass. Even ifno confining pressure is applied on the close packing ofspherical inclusions, percolating stress network should existthrough the Hertz contacts among the glass beads [Rioual etal., 2003]. This effect should contribute to the efficiency ofthe granular medium reflectivity but it does not appear inthe methods of Kuster and Toksoz [1974] and Berryman[1980]: the effect is then supposed to be very weak in ourexperiments.
5.2. Intermediate-Wavelength Domain
[41] In the frequency bands II-III-IV, the experimentalreflectivity curve (Figure 3b) displays a strong dependenceof the reflectivity with the wavelength of the incident waveand the wave phenomena involved in each band aredifferent. The Rayleigh scattering occurring in band I ceasesto be valid in band II, and a dominant lateral scatteringoccurs in band III where by a strong decrease in thereflected energy is observed. Band IV is dominated bystrong forward scattering which produces a long coda waveformed by the scattered waves coming from deeper parts ofthe heterogeneous medium (see Figure 3a). In these inter-mediate frequencies, we cannot apply quasi-static methodsand we work on dynamic effective medium methods as thetheory proposed by Waterman and Truell [1961].[42] All physical parameters are controlled in our experi-
ments and none has to be adjusted. We compute the model
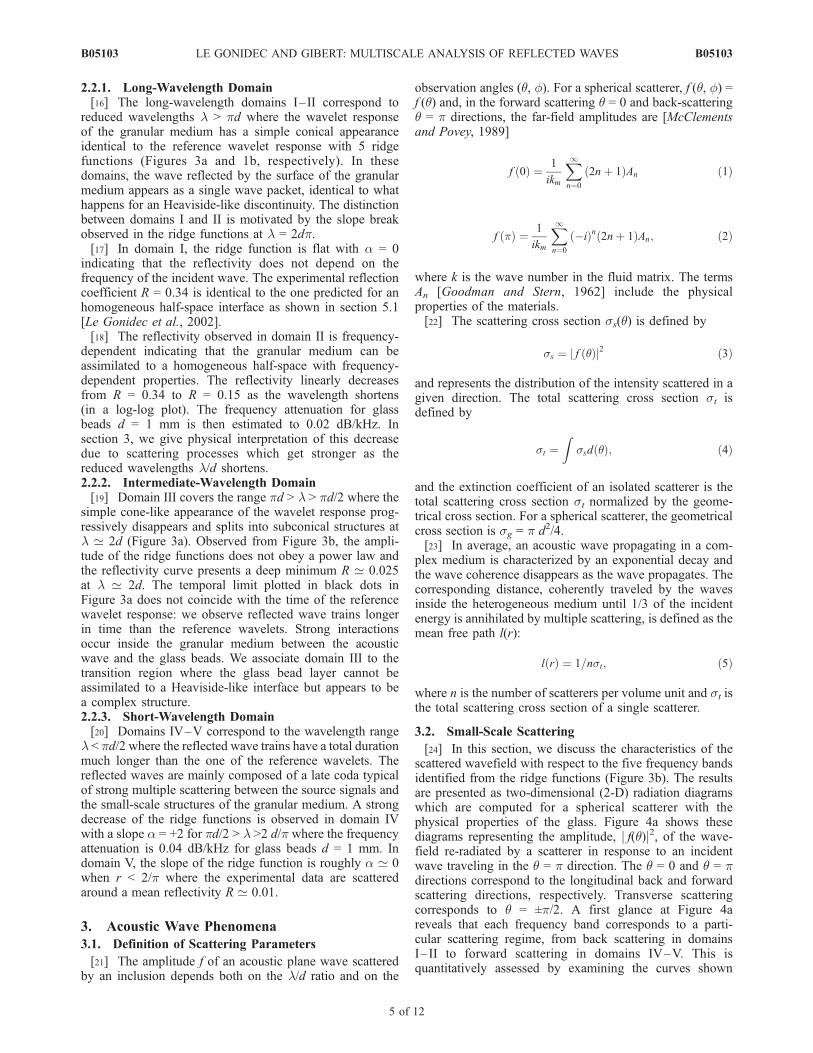
of Waterman and Truell [1961] for a large frequency range,i.e., between 100 kHz and 5 MHz, and for 63% of d = 1 mmglass beads immersed in water. The theoretical results areplotted in Figure 7 together with the experimental reflec-tivity curve. The theoretical reflectivity predicted by Water-man and Truell is in good agreement with the data over alarge frequency range including the low-frequency domain I.It slightly underestimates the data in domains I, II, and III,where the reflectivity decrease measured around l = 2d isalso well predicted by the theory. In domain IV, the effectivemedium theory of Waterman and Truell [1961] fits verywell the experimental data. Also note the theoretical reso-nance located on the high-frequency limit l ’ 2 d/p. Indomain V, we observe a significant discrepancy between themodel and the data, discussed in section 5.3.[43] From equations (11), we compute the effective
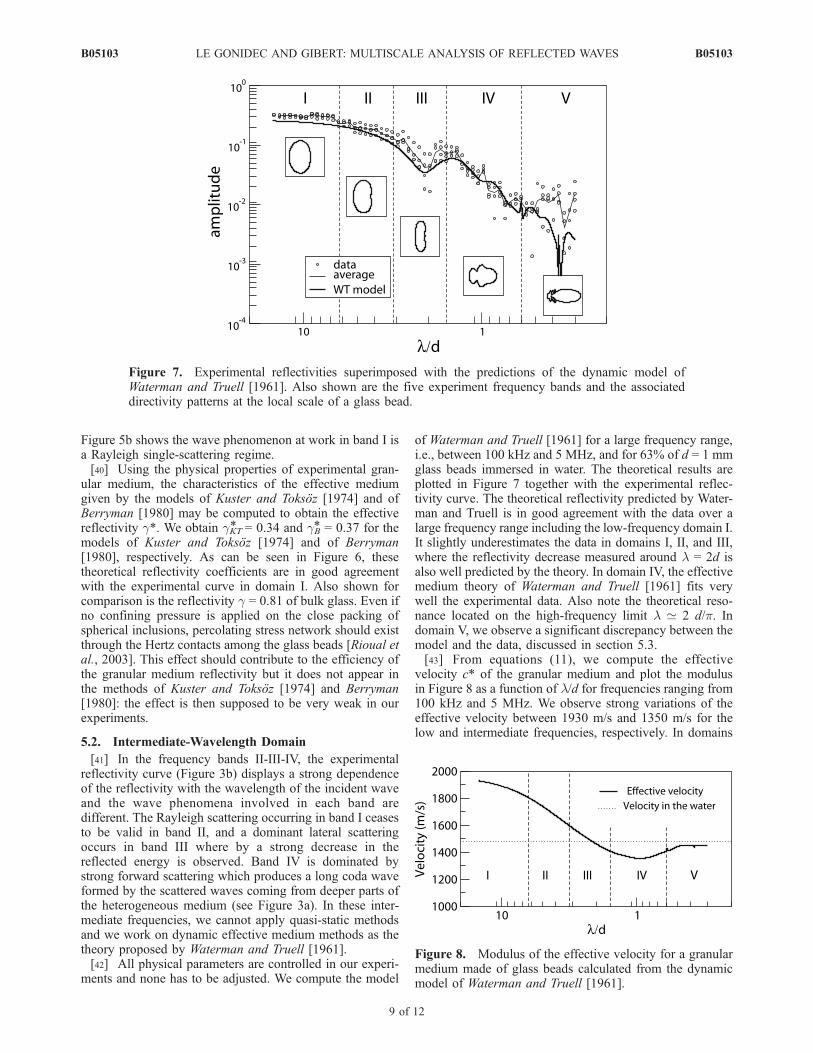
velocity c* of the granular medium and plot the modulusin Figure 8 as a function of l/d for frequencies ranging from100 kHz and 5 MHz. We observe strong variations of theeffective velocity between 1930 m/s and 1350 m/s for thelow and intermediate frequencies, respectively. In domains
Figure 7. Experimental reflectivities superimposed with the predictions of the dynamic model ofWaterman and Truell [1961]. Also shown are the five experiment frequency bands and the associateddirectivity patterns at the local scale of a glass bead.
Figure 8. Modulus of the effective velocity for a granularmedium made of glass beads calculated from the dynamicmodel of Waterman and Truell [1961].
B05103 LE GONIDEC AND GIBERT: MULTISCALE ANALYSIS OF REFLECTED WAVES
9 of 12
B05103
I–II and IV–V, the effective velocity jc*j is larger andsmaller, respectively, than the sound velocity in the fluidmatrix cm = 1480 m/s and jc*j = cm when l/d = 2 indomain III. At low frequencies, the resulting effectivevelocity jc*j > 1600 m/s: the acoustic waves propagatethrough the glass beads which sound velocity is muchlarger than cm. In the high-frequency domain, the acousticwaves are multiple scattered inside the granular mediumbefore being re-radiated: the effective velocity is complexand the imaginary part arises from tortuosity effects inducedby the glass beads. The acoustic waves mainly propagatethrough the matrix and follow longer paths around the glassbeads, resulting in a smaller effective velocity.
5.3. Very Short Wavelength Domain
[44] In the high-frequency band, the model ofWatermanand Truell [1961] is not in good agreement with the data. Thedata scatter is large in domain V, but in the average,the measurements are one order of magnitude larger thanthe model predictions when l < pd/2 which is thefrequency limit between domains IV and V. This high-frequency limit appears as the validity limit of the theoryof Waterman and Truell. In domain V, multiple-scatteringattenuation is important. The acoustic waves are stronglyscattered by the glass beads and cannot propagate verydeep inside the medium. In order to propose a theoreticalinterpretation of this limit, we study the elastic mean freepath [see Sheng, 1995]. This multiple-scattering parameter,defined by equation (5), quantifies the distance traveled bythe coherent waves inside the medium and is plottedversus l/d in Figure 9.[45] In the low-frequency bands I-II-III, the elastic
mean free path is much larger than the bead diameter d:the waves propagate over large distances and multiplescattering involves a large number of interactions betweenthe acoustic waves and the glass beads. This agrees with themodel of Waterman and Truell [1961] which requiresaveraging of statistical quantities. In the high frequenciesV, the elastic mean free path may be smaller than the beaddiameter. Hence scattering occurs in the very first layers ofglass beads and no wave can propagate deep inside thegranular medium: this makes volume averaging effects
insignificant when l < 2d/p and the model of Watermanand Truell is not in accordance with the data in domain V.[46] In the high-frequency band V, the experimental data
tend to be frequency-independent with a ridge functioncharacterized by a slope a ’ 0 (Figure 3b). The granularmedium appears to be equivalent to a homogeneous mediumdefined by rough interface which induces scattering. Theaverage reflectivity of this equivalent interface is g* ’ 0.01and takes surface scattering attenuation into account.
6. Conclusion
[47] From the wavelet response method, we define acoherent acoustic response over a large frequency range fora perfect reflector. We extend the analysis to characterizegranular media with dense packing of glass beads saturatedwith water. We increase the frequency range by rescaling andmerging the individual wavelet responses measured fordifferent monodisperse layers of glass beads with differentdiameters, respectively. The global wavelet response spansa 5-octave frequency range, and the dimensionless para-meter l/d varies from 0.3 to 15 (Figure 3). We identifyfive ranges from the experimental wavelet response anddefine the frequency limits at l = 2dp, l = dp,l = p d/2 and l = 2d/p.[48] In the low-frequency bands I and II, defined for l >
2dp, we observe a coherent structure in the waveletresponse where back scattering dominates. The ridge func-tions are linear curves with slopes a = 0 and a = +1 fordomains I and domain II, respectively. In domain I, weshow the existence of Rayleigh scattering where the granu-lar medium can be replaced by an equivalent elastic andhomogeneous medium defined by frequency-independentphysical parameters. We apply quasi-static effective theoriesto define the effective properties and show good agreementbetween the experimental data and the theoretical predic-tions from Kuster and Toksoz [1974] and Berryman [1980].[49] In domain II, where 2dp > l > dp, we observe a
simple and coherent structure in the wavelet response but afrequency dependence of the ridge function amplitudes. Weshow that the Rayleigh scattering is not valid and thatmultiple scattering appears inside the granular medium. Inorder to describe the experimental data, we apply thedynamic effective medium theory developed by Watermanand Truell [1961] which takes multiple scattering intoaccount. We put in evidence a very good agreementbetween the theoretical predictions and the data over botha large frequency range and a densely packed granularmedium.[50] We show that the intermediate domain III is
characterized by strong transition phenomena: we observea pronounced decrease of the back-scattered wavefieldenergy. We analyze the theoretical scattering for singleglass bead and associate this observation to a dominantlateral scattering (Figure 4b). From the experiments, wedefine the limits of domain III by l = pd and l = pd/2.In this domain, an equilibrium between the longitudinaland the transversal scattering dominates when l = 2d andwe put in evidence a transition from the propagationregime to a multiple-scattering regime at low frequenciesand high frequencies, respectively.
Figure 9. Elastic mean free path. In band V, it reaches theglass bead radius. This means that the wave does notpenetrate inside the medium and that the first bead layerreflects the incident wave.
B05103 LE GONIDEC AND GIBERT: MULTISCALE ANALYSIS OF REFLECTED WAVES
10 of 12
B05103
[51] In the higher-frequency domains IV and V, we showa dominant forward scattering for a single scatterer inaccordance with multiple-scattering phenomena observedwith the existence of coda wave in the wavelet response.[52] From the wavelet response experiments we perform
in highly concentrated granular media, we observe scat-tering phenomena and quantify the results from theoreticalapproach based on effective medium methods. We study indetails the influence of the ratio l/d on the granularmedium reflectivity curve. This work, where we associateexperimental and theoretical results, can help in theunderstanding of acoustic probing of geological interfaces.
[53] Acknowledgments. We thank Frederic Conil for his help whenconstructing the wavelet family and Michel Lemoine, who helped us indesigning the experimental setup. This work is financially supported by theCNRS and ANDRA through the GdR FORPRO (Research action 99.II) andcorresponds to GdR FORPRO contribution 2006/10 A.
ReferencesAcosta, J., M. Canals, A. Carbo, A. Munoz, R. Urgeles, A. Munoz-Martın,and E. Uchupi (2004), Sea floor morphology and Plio-Quaternary sedi-mentary cover of the Mallorca Channel, Balearic Islands, western Med-iterranean, Mar. Geol., 206, 165–179.
Alexandrescu, M., D. Gibert, G. Hulot, J.-L. Le Mouel, and G. Saracco(1995), Detection of geomagnetic jerks usingwavelet analysis, J. Geophys.Res., 100, 12,557–12,572.
Alexandrescu, M., D. Gibert, G. Hulot, J.-L. Le Mouel, and G. Saracco(1996), Worldwide wavelet analysis of geomagnetic jerks, J. Geophys.Res., 101, 21,975–21,994.
Anson, L. W., and R. C. Chivers (1993), Ultrasonic velocity in suspensionsof solids in solids—A comparison of theory and experiment, J. Phys. D,26, 1566–1575.
Aristegui, C., and Y. C. Angel (2002), New results for isotropic pointscatterers: Foldy revisited, Wave Motion, 36, 383–399.
Augustin, J. M., R. Le Suave, X. Lurton, M. Voisset, S. Dugelay, andC. Satra (1996), Contribution of the multibeam acoustic imagery tothe exploration of the sea-bottom, Mar. Geophys. Res., 18, 459–486.
Berryman, J. G. (1980), Long-wavelength propagation in composite elasticmedia: Spherical inclusions, J. Acoust. Soc. Am., 68, 1809–1819.
Berryman, J. G., and P. A. Berge (1996), Critique of two explicit schemesfor estimating elastic properties of multiphase composite, Mech. Mater.,22, 149–164.
Burridge, R., G. Papanicolaou, and B. White (1988), One-dimensionalwave propagation in a highly discontinuous medium, Wave Motion, 10,19–44.
Burridge, R., M. V. De Hoop, K. Hsu, L. Le, and A. Norris (1993), Wavesin stratified viscoelastic media with microstructure, J. Acoust. Soc. Am.,94, 2884–2894.
Busch, K., and C. M. Soukoulis (1996), Transport properties of randommedia: An energy-density CPA approach, Phys. Rev. B, 54, 893–899.
Carter, L. (1992), Acoustical characterization of seafloor sediments and itsrelationship to active sedimentary processes in Cook Strait, New Zealand,N. Z. J. Geol. Geophys., 35, 289–300.
Chambers, K., A. Deuss, and J. H. Woodhouse (2005), Reflectivity of the410-km discontinuity from PP and SS precursors, J. Geophys. Res., 110,B02301, doi:10.1029/2004JB003345.
Chylek, P., G. Videen, W. Geldart, S. Dobbie, and W. Tso (2000), Effectivemedium approximation for heterogeneous particles, in Light Scatteringby Non-spherical Particles: Theory, Measurements, and GeophysicalApplications, pp. 273–308, edited by M. Mishchenko, J. W. Hovenier,and L. D. Travis, Elsevier, New York.
Conil, F., D. Gibert, and F. Nicollin (2004), Nonlinear synthesis of inputsignals in ultrasonic experimental setups, J. Acoust. Soc. Am., 115, 246–252.
Cowan, M. L., K. Beaty, J. H. Page, Z. Liu, and P. Sheng (1998), Groupvelocity of acoustic waves in strongly scattering media: Dependence onthe volume fraction of scatterers, Phys. Rev. E, 58(5), 6626–6635.
De Moustier, C., and H. Matsumoto (1993), Seafloor acoustic remotesensing with multibeam echo-sounders and bathymetric sidescan sonarsystems, Mar. Geophys. Res., 15, 27–42.
Derode, A., A. Tourin, and M. Fink (1998), Time reversal in multiplyscattering media, Ultrasonics, 36, 443–447.
Dineva, P. S., G. D. Manolis, and T. V. Rangelov (2006), Sub-surface crackin an inhomogeneous half-plane: Wave scattering phenomena by BEM,Eng. Anal. Boundary Elements, 30(5), 350–362.
Exon, N. F., G. R. Dickens, J.-M. Auzende, Y. Lafoy, P. A. Symonds, andS. Van de Beuque (1998), Gas hydrates and free gas on the Lord HoweRise, Tasman Sea, PESA J., 26, 148–158.
Foldy, L. L. (1945), The multiple scattering of waves: I. General theory ofisotropic scattering by randomly distributed scatterers, Phys. Rev., 67,107–119.
Goff, J. A., H. C. Olson, and C. S. Duncan (2000), Correlation of side-scanbackscatter intensity with grain-size distribution of shelf sediments, NewJersey margin, Geo Mar. Lett., 20(3), 43–49.
Goodman, R. R., and R. Stern (1962), Reflection and transmission of soundby elastic spherical shells, J. Acoust. Soc. Am., 34(3), 338–344.
Gutowski, M., J. Bull, T. Henstock, J. Dix, P. Hogarth, T. Leighton, andP. White (2002), Chirp sub-bottom profiler source signature design andfield testing, Mar. Geophys. Res., 23, 481–492.
Hashin, Z., and S. Shtrikman (1963), A variational approach to the theory ofthe elastic behavior of multiphase materials, J. Mech. Phys. Solids, 2,127–140.
Herrmann, F. J. (1994), Scaling of the pseudo primary analyzed by thewavelet transform, paper presented at the 64th meeting of SEG, Soc. ofExplor. Geophys., Tulsa, Okla.
Herrmann, F. J., and J. J. Staal (1996), Waves in scaling media, theimplication of non-differentiability, in 58th Annual EAGE Conference,edited by D. J. Feenstra, Abstract C007, Eur. Assoc. of Geosci. andEng, Amsterdam.
Holschneider, M. (1995), Wavelets: An Analysis Tool, 423 pp., Clarendon,Oxford, U. K.
Ishimaru, A. (1978), Wave Propagation and Scattering in Random Media,IEEE Press, Piscataway, N. J.
Kostylev, V. E., B. J. Todd, G. B. J. Fader, R. C. Courtney, G. D. M.Cameron, and R. A. Pickrill (2001), Benthic habitat mapping on theScotian Shelf based on multibeam bathymetry, surficial geology andsea floor photographs, Mar. Ecol. Prog. Ser., 219, 121–137.
Kuster, G. T., and M. N. Toksoz (1974), Velocity and attenuation of seismicwaves in two-phase media: Theoretical formulation, Geophysics, 39,587–618.
Lambert, D. N., M. T. Kalcic, and R. W. Faas (2002), Variability in theacoustic response of shallow-water marine sediments determined bynormal-incident 30-kHz and 50-kHz sound, Mar. Geol., 182, 179–208.
Le Gonidec, Y., D. Gibert, and J. Proust (2002), Multiscale analysis ofwaves reflected by complex interfaces: Basic principles and experiments,J. Geophys. Res., 107(B9), 2184, doi:10.1029/2001JB000558.
Le Gonidec, Y., F. Conil, and D. Gibert (2003), The wavelet response as amultiscale NDT method, Ultrasonics, 41, 487–497.
Le Gonidec, Y., G. Lamarche, and I. C. Wright (2005), Inhomogeneoussubstrate analysis using EM300 backscatter imagery, Mar. Geophys. Res.,24, 305–321.
Mallat, S., and W. L. Hwang (1992), Singularity detection and processingwith wavelets, IEEE Trans. Inf. Theory, 38, 617–643.
Marchetti, E., M. Ichihara, and M. Ripepe (2004), Propagation of acousticwaves in a viscoelastic two-phase system: Influence of gas bubble con-centrationSingularity detection and processing with wavelets, J. Volcanol.Geotherm. Res., 137, 93–108.
Marsan, D., and C. J. Bean (1999), Multiscaling nature of sonic velocitiesand lithology in the upper crystalline crust: Evidence from the KTB MainBorehole, Geophys. Res. Lett., 26, 275–278.
McClatchie, S., R. E. Thorne, P. Grimes, and S. Hanchet (2000), Groundtruth and target identification for fisheries acoustics, Fish. Res., 47, 173–191.
McClements, D. J., and M. J. W. Povey (1989), Scattering of ultrasound byemulsions, J. Phys. D, 22, 38–47.
Neser, S., C. Bechinger, P. Leiderer, and T. Palberg (1997), Finite-sizeeffects on the closest packing of hard spheres, Phys. Rev. Lett., 7912,2348–2351.
O’Doherty, R. F., and N. A. Anstey (1971), Reflections on amplitudes,Geophys. Prospect., 19(3), 430–458.
Orange, D. L., J. Yun, N. Maher, and J. Barry (2002), Tracking Californiaseafloor seeps with bathymetry, backscatter and ROVs, Cont. Shelf Res.,22, 2273–2290.
Page, J. H., H. P. Schriemer, A. E. Bailey, and D. A. Weitz (1995), Experi-mental test of the diffusion approximation for multiply scattered sound,Phys. Rev. E, 523, 3106–3114.
Page, J. H., P. Sheng, H. P. Schriemer, I. Jones, X. Jing, and D. A. Weitz(1996), Group velocity in strongly scattering media, Science, 271, 634–637.
Pecher, I. A., W. S. Holbrook, M. K. Sen, D. Lizarralde, W. T. Wood, D. R.Hutchinson, W. P. Dillon, H. Hoskins, and R. A. Stephen (2003), Seismicanisotropy in gas-hydrate- and gas-bearing sediments on the Blake Ridge,from a walkaway vertical seismic profile, Geophys. Res. Lett., 30(14),1733, doi:10.1029/2003GL017477.
B05103 LE GONIDEC AND GIBERT: MULTISCALE ANALYSIS OF REFLECTED WAVES
11 of 12
B05103
Price, P. B. (2006), Attenuation of acoustic waves in glacial ice and saltdomes, J. Geophys. Res., 111, B02201, doi:10.1029/2005JB003903.
Rioual, F., A. Valance, and D. Bideau (2003), Collision process of a beadon a two-dimensional bead packing importance of the inter-granular con-tacts, Europhys. Lett., 61(2), 194–200.
Robert, S., J.-M. Conoir, H. Franklin, and F. Luppe (2004), Resonant elasticscattering by a finite number of cylindrical cavities in an elastic matrix,Wave Motion, 40, 225–339.
Scales, J. A. (1993), On the use of localization theory to characterize elasticwave propagation in randomly stratified 1-D media, Geophysics, 58,177–179.
Schock, S. G., L. R. LeBlanc, and L. A. Mayer (1989), Chirp subbottomprofiler for quantitative sediment analysis, Geophysics, 54, 445–450.
Sheng, P. (1995), Introduction to Wave Scattering, Localization andMesoscopic Phenomena, Elsevier, New York.
Sheng, P., Z. Q. Zhang, B. White, and G. Papanicolaou (1986), Multiple-scattering noise in one dimension: Universality through localization-length scaling, Phys. Rev. Lett., 57, 1000–1003.
Stevenson, I. R., C. McCann, and P. B. Runciman (2002), An attenuation-based sediment classification technique using Chirp sub-bottom profilerdata and laboratory acoustic analysis, Mar. Geophys. Res., 23, 277–298.
Tournat, V., V. Pagneux, D. Lafarge, and L. Jaouen (2004), Multiple scat-tering of acoustic waves and porous absorbing media, Phys. Rev. E., 70,026609, doi:10.1103/PhysRevE.70.026609.
Vandenplas, S., A. B. Temsamani, Z. Cisneros, and L. Van Biesen (2000),A frequency domain inversion method applied to propagation models inunconsolidated granular materials, Ultrasonics, 38, 195–199.
Vanneste, M., M. De Batist, A. Golmshtok, A. Kremlev, and W. Versteeg(2001), Multi-frequency seismic study of gas hydrate-bearing sedimentsin Lake Baikal, Siberia, Mar. Geol., 172, 1–21.
Walter, D. J., D. N. Lambert, and D. C. Young (2002), Sediment faciesdetermination using acoustic techniques in a shallow-water carbonateenvironment, Dry Tortugas, Florida, Mar. Geol., 182, 161–177.
Wapenaar, K. (1998), Seismic reflection and transmission coefficients of aself-similar interface, Geophys. J. Int., 135, 585–594.
Wapenaar, K. (1999), Amplitude-variation-with-angle behavior of self-similar interface, Geophysics, 64, 1928–1938.
Waterman, P. C., and R. Truell (1961), Multiple scattering of waves,J. Math. Phys., 2, 512–537.
Wysession, M. E., E. A. Okal, and C. R. Bina (1992), The structure of thecore-mantle boundary from diffracted waves, J. Geophys. Res., 97,8749–8764.
�����������������������D. Gibert, Geosciences Rennes, Universite Rennes 1, B15 Campus de
Beaulieu, F-35042 Rennes cedex, France. ([email protected])Y. Le Gonidec, Geosciences Azur, B.P. 48 Port de la Darse, F-06235