Multiscale Computational Models for Optogenetic Control of Cardiac Function Oscar J. Abilez, †‡ Jonathan Wong, § Rohit Prakash, †{ Karl Deisseroth, †k Christopher K. Zarins, ‡ and Ellen Kuhl †§ * † Department of Bioengineering, ‡ Department of Surgery, § Department of Mechanical Engineering, { Department of Neurosciences, and k Department of Psychiatry and Behavioral Sciences, Stanford University, Stanford, California ABSTRACT The ability to stimulate mammalian cells with light has significantly changed our understanding of electrically excit- able tissues in health and disease, paving the way toward various novel therapeutic applications. Here, we demonstrate the potential of optogenetic control in cardiac cells using a hybrid experimental/computational technique. Experimentally, we intro- duced channelrhodopsin-2 into undifferentiated human embryonic stem cells via a lentiviral vector, and sorted and expanded the genetically engineered cells. Via directed differentiation, we created channelrhodopsin-expressing cardiomyocytes, which we subjected to optical stimulation. To quantify the impact of photostimulation, we assessed electrical, biochemical, and mechanical signals using patch-clamping, multielectrode array recordings, and video microscopy. Computationally, we introduced channel- rhodopsin-2 into a classic autorhythmic cardiac cell model via an additional photocurrent governed by a light-sensitive gating variable. Upon optical stimulation, the channel opens and allows sodium ions to enter the cell, inducing a fast upstroke of the transmembrane potential. We calibrated the channelrhodopsin-expressing cell model using single action potential readings for different photostimulation amplitudes, pulse widths, and frequencies. To illustrate the potential of the proposed approach, we virtually injected channelrhodopsin-expressing cells into different locations of a human heart, and explored its activation sequences upon optical stimulation. Our experimentally calibrated computational toolbox allows us to virtually probe landscapes of process parameters, and identify optimal photostimulation sequences toward pacing hearts with light. INTRODUCTION For more than 40 years, biologists have studied microorgan- isms that produce proteins to directly regulate the flow of charged ions across their plasma membrane in response to light. The first identified protein of this kind was the light- gated ion pump bacteriorhodopsin, transporting positively charged hydrogen ions across the cell membrane (1). While bacteriorhodopsin naturally acts as an on-switch for electri- cally active cells, the second reported light-gated ion pump, halorhodopsin, transports negatively charged chloride ions, thereby acting as an off-switch (2). The first reported light-gated ionic channel illustrated in Fig. 1, channelrho- dopsin, was only identified 30 years later (3,4), but has since revolutionized neuroscience. Since the early 1990s, we have known that phototaxis and photophobic responses in the green alga Chlamydomonas reinhardtii are mediated by rhodopsins with a microbial- type all-trans retinal chromosphore (5,6). The photochem- ical isomerization of this all-trans retinal to 13-cis retinal is illustrated in Fig. 2. It occurs at peak absorption wave- lengths of 470 nm, opening the channel to sodium, potas- sium, and calcium cations in response to blue light. In the dark, the covalently bound retinal spontaneously relaxes to all-trans, providing closure of the channel and regeneration of the chromophore. A breakthrough-enabling technology was reported in 2005, when the light-sensitive target was first introduced genetically using engineered viruses (7,8), a technique that is now known as optogenetics (9,10). Since then, optical tools for controlling the electrical activity of neurons have rapidly evolved, and are now gaining widespread use in neuronal research and medicine (11,12). Although initial applications of optogenetics have been restricted exclu- sively to the neuronal system, optogenetic tools have now advanced to a level of maturity, where they can confidently be applied to other cells and organs (9). Natural first candi- dates of choice are stem cells, and electrically active glial cells, muscle cells, and cardiac cells (O. Abilez, J. A. Baugh, M. L. Gorrepati, R. Prakash, C. Lee-Messer, M. Huang, F. Jia, J. Yu, K. D. Wilson, J. C. Wu, K. Deisseroth, and C. K. Zarins, unpublished; and (14)). The objective of this study is to demonstrate the potential of optogenetic control of the cardiac system using a hybrid experimental/computational technique. We demonstrate that channelrhodopsin-2 (ChR2) can be expressed stably and safely in human embryonic stem cells (hESC), which can then be differentiated into cardiomyocytes (hESC ChR2 -CM). Upon photostimulation, ChR2 opens rapidly and allows sodium ions to enter the cell, inducing a defined transmem- brane potential, commonly known as the action potential. We illustrate how ChR2 can be introduced into a computa- tional autorhythmic cell model via an additional photocurrent governed by a light-sensitive gating variable to simulate this Submitted April 29, 2011, and accepted for publication August 1, 2011. *Correspondence: [email protected]This is an Open Access article distributed under the terms of the Creative Commons-Attribution Noncommercial License (http://creativecommons. org/licenses/by-nc/2.0/), which permits unrestricted noncommercial use, distribution, and reproduction in any medium, provided the original work is properly cited. Editor: Randall L. Rasmusson. Ó 2011 by the Biophysical Society 0006-3495/11/09/1326/9 $2.00 doi: 10.1016/j.bpj.2011.08.004 1326 Biophysical Journal Volume 101 September 2011 1326–1334
Transcript
1326 Biophysical Journal Volume 101 September 2011 1326–1334
Multiscale Computational Models for Optogenetic Control of CardiacFunction
Oscar J. Abilez,†‡ Jonathan Wong,§Rohit Prakash,†{Karl Deisseroth,†kChristopher K. Zarins,‡ and Ellen Kuhl†§*†Department of Bioengineering, ‡Department of Surgery, §Department of Mechanical Engineering, {Department of Neurosciences, andkDepartment of Psychiatry and Behavioral Sciences, Stanford University, Stanford, California
ABSTRACT The ability to stimulate mammalian cells with light has significantly changed our understanding of electrically excit-able tissues in health and disease, paving the way toward various novel therapeutic applications. Here, we demonstrate thepotential of optogenetic control in cardiac cells using a hybrid experimental/computational technique. Experimentally, we intro-duced channelrhodopsin-2 into undifferentiated human embryonic stem cells via a lentiviral vector, and sorted and expanded thegenetically engineered cells. Via directed differentiation, we created channelrhodopsin-expressing cardiomyocytes, which wesubjected to optical stimulation. To quantify the impact of photostimulation, we assessed electrical, biochemical, andmechanicalsignals using patch-clamping, multielectrode array recordings, and video microscopy. Computationally, we introduced channel-rhodopsin-2 into a classic autorhythmic cardiac cell model via an additional photocurrent governed by a light-sensitive gatingvariable. Upon optical stimulation, the channel opens and allows sodium ions to enter the cell, inducing a fast upstroke of thetransmembrane potential. We calibrated the channelrhodopsin-expressing cell model using single action potential readingsfor different photostimulation amplitudes, pulse widths, and frequencies. To illustrate the potential of the proposed approach,we virtually injected channelrhodopsin-expressing cells into different locations of a human heart, and explored its activationsequences upon optical stimulation. Our experimentally calibrated computational toolbox allows us to virtually probe landscapesof process parameters, and identify optimal photostimulation sequences toward pacing hearts with light.
INTRODUCTION
For more than 40 years, biologists have studied microorgan-isms that produce proteins to directly regulate the flow ofcharged ions across their plasma membrane in response tolight. The first identified protein of this kind was the light-gated ion pump bacteriorhodopsin, transporting positivelycharged hydrogen ions across the cell membrane (1). Whilebacteriorhodopsin naturally acts as an on-switch for electri-cally active cells, the second reported light-gated ion pump,halorhodopsin, transports negatively charged chloride ions,thereby acting as an off-switch (2). The first reportedlight-gated ionic channel illustrated in Fig. 1, channelrho-dopsin, was only identified 30 years later (3,4), but has sincerevolutionized neuroscience.
Since the early 1990s, we have known that phototaxis andphotophobic responses in the green alga Chlamydomonasreinhardtii are mediated by rhodopsins with a microbial-type all-trans retinal chromosphore (5,6). The photochem-ical isomerization of this all-trans retinal to 13-cis retinalis illustrated in Fig. 2. It occurs at peak absorption wave-lengths of 470 nm, opening the channel to sodium, potas-sium, and calcium cations in response to blue light. In thedark, the covalently bound retinal spontaneously relaxes to
Submitted April 29, 2011, and accepted for publication August 1, 2011.
org/licenses/by-nc/2.0/), which permits unrestricted noncommercial use,
distribution, and reproduction in any medium, provided the original work
is properly cited.
Editor: Randall L. Rasmusson.
� 2011 by the Biophysical Society
0006-3495/11/09/1326/9 $2.00
all-trans, providing closure of the channel and regenerationof the chromophore.
A breakthrough-enabling technology was reported in2005, when the light-sensitive target was first introducedgenetically using engineered viruses (7,8), a technique thatis now known as optogenetics (9,10). Since then, opticaltools for controlling the electrical activity of neurons haverapidly evolved, and are now gaining widespread use inneuronal research and medicine (11,12). Although initialapplications of optogenetics have been restricted exclu-sively to the neuronal system, optogenetic tools have nowadvanced to a level of maturity, where they can confidentlybe applied to other cells and organs (9). Natural first candi-dates of choice are stem cells, and electrically active glialcells, muscle cells, and cardiac cells (O. Abilez, J. A. Baugh,M. L. Gorrepati, R. Prakash, C. Lee-Messer, M. Huang, F.Jia, J. Yu, K. D. Wilson, J. C. Wu, K. Deisseroth, and C.K. Zarins, unpublished; and (14)).
The objective of this study is to demonstrate the potentialof optogenetic control of the cardiac system using a hybridexperimental/computational technique. We demonstrate thatchannelrhodopsin-2 (ChR2) can be expressed stably andsafely in human embryonic stem cells (hESC), which canthen be differentiated into cardiomyocytes (hESCChR2-CM).Upon photostimulation, ChR2 opens rapidly and allowssodium ions to enter the cell, inducing a defined transmem-brane potential, commonly known as the action potential.We illustrate how ChR2 can be introduced into a computa-tional autorhythmic cell model via an additional photocurrentgoverned by a light-sensitive gating variable to simulate this
FIGURE 1 Channelrhodopsin-2 (ChR2) is a light-gated cation channel
native to the green alga C. reinhardtii. It consists of seven transmembrane
proteins and absorbs light through its interaction with retinal. Here, we
induce channelrhodopsin coupled to enhanced yellow fluorescent protein
(eYFP) into undifferentiated human embryonic stem cells via a lentiviral
vector and differentiate these cells into cardiomyocytes.
Optogenetic Control of Cardiac Function 1327
effect. The calibrated cell model is capable of reliably repro-ducing photostimulation amplitudes, pulse widths, and fre-quencies from single action potential readings. Using acustom-designed finite element model, we virtually injectour calibrated model cells into different locations of a humanheart to illustrate the potential of the proposed approachtoward pacing hearts with light.
MATERIALS AND METHODS
All experiments, methods, and protocols for this study were approved by
the Stanford University Stem Cell Research Oversight committee.
Opsin sources and lentiviral vector
The channelrhodopsin-2 (ChR2) variant described here was optimized for
mammalian expression by truncating the native sequence from 2241 base-
pair (bp) to 933 bp, by changing the native histidine (H) codon (CAC) to the
arginine (R) codon (CGC) coding for protein residue 134 of ChR2
(H134R), and by changing its gene’s codon usage to conform to human
codon usage distribution (15,16). The lentiviral vector pLenti-EF1a-
ChR2-eYFP-WPRE (pLECYT) was constructed as previously described
(7,16). The pLET plasmid contains the ubiquitously expressed elongation
factor 1-alpha (EF1a), to obtain high levels of ChR2-eYFP expression in
FIGURE 2 Channelrhodopsin-2 (ChR2) is activated by photoisomeriza-
tion of all-trans retinal to 13-cis retinal at wavelengths of 470 nm. After
photoisomerization, the covalently bound retinal spontaneously relaxes to
all-trans in the dark, providing closure of the ion channel and regeneration
of the chromophore.
a mammalian system ((8), O. Abilez, J. A. Baugh, M. L. Gorrepati,
R. Prakash, C. Lee-Messer, M. Huang, F. Jia, J. Yu, K. D. Wilson, J. C. Wu,
K. Deisseroth, and C. K. Zarins, unpublished). All constructs have been fully
sequenced previously for accuracy of cloning (7,15). High-titer lentivirus
was produced using a second-generation lentiviral system by cotransfection
of 293FT cells (Invitrogen, Carlsbad, CA), the pLECYT viral vector
described above, pCMVRD8.74 (containing GAG and POL), pMD2.G (con-
taining VSVg), and calcium phosphate as previously described (16,17).
Stem cell culture and differentiation
Channelrhodopsin-expressing human embryonic stem cells (hESCChR2þ)were grown as monolayers (O. Abilez, J. A. Baugh, M. L. Gorrepati, R. Pra-
kash, C. Lee-Messer, M. Huang, F. Jia, J. Yu, K. D.Wilson, J. C. Wu, K. De-
isseroth, and C. K. Zarins, unpublished) on hESC-qualified Matrigel (BD
Biosciences, San Jose, CA) and maintained in the pluripotent state through
daily feeding with mTeSR1 media (StemCell Technologies, Vancouver,
British Columbia, Canada) (18), supplemented with 1� penicillin/strepto-
mycin (Invitrogen). Cardiomyocyte differentiation was usually begun
2–5 days after initially seeding hESCChR2þ on Matrigel (BD Biosciences).
At this time, the cells were transferred to RPMI-1640 media supplemented
with B27, 1� nonessential amino acids, 1� penicillin/streptomycin, and
0.1 mM b-mercaptoethanol (all Invitrogen) and our differentiation
method was begun using aspects of other methods previously described
(19,20).
On the first day of differentiation, Day 0, RPMI media with 50 ng/mL of
Activin A (R&D Systems, Minneapolis, MN) was added to each well. On
the subsequent day, Day 1, 5 ng/mL of BMP-4 (R&D Systems) was added
to each well. On Day 3, fresh RPMI media was added to each well and
was replaced every 48 h until Day 11, when the cells were transferred to
Dulbecco’s modified Eagle’s medium (DMEM) (Invitrogen) supplemented
with 5% fetal bovine serum (Invitrogen), 1� nonessential amino acids,
1� penicillin/streptomycin, and 0.1 mM b-mercaptoethanol. This DMEM
was then replaced approximately every 48 h. Cardiomyocytes generally
began spontaneously beating between Days 9 and 20.
Fluorescence-activated cell sorting
Fluorescence-activated cell sorting (FACS) was performed with a BD
FACSAria instrument equipped with BD FACSDiva 6.0 software (BD
Biosciences). Up to 1 � 106 cells transduced with the ChR2-eYFP lenti-
virus were sorted. Sorted cells were then resuspended in mTeSR1 media
and replated on Matrigel-coated wells. After 2–3 days in culture, enhanced
yellow fluorescent protein (eYFP) signal was confirmed via fluorescence
microscopy. Analysis of FACS datawas performed offlinewith FlowJo 7.6.1
software (Tree Star, Ashland, OR).
Polymerase chain reaction
For undifferentiated hESC, polymerase chain reaction (PCR) primers with
gene product length for the following genes were used: GAPDH (152 bp),
Oct-4 (169 bp), Nanog (154 bp), a region within eYFP (187 bp), a region
spanning eYFP-ChR2 (197 bp), and a region within ChR2 (174 bp). Total
RNAwas isolated and RNA yield was then quantified using a Quant-iT kit
(Invitrogen) and Qubit fluorometer (Invitrogen) per the manufacturer’s
instructions. For cDNA synthesis, 1 mg total RNA, random hexamers, an-
nealing buffer, 2� First-Strand Reaction Mix (Invitrogen) and SuperScript
III/RNase OUT Enzyme Mix (Invitrogen), and RNase/DNase-free water
were combined, then incubated per the manufacturers instructions. For
which are, mathematically speaking, functions of the transmembrane poten-
tial f, the individual gating variables ggate, and the ion concentrations cion:
Icrt ¼ Icrt
�f; ggate; cion
�: (7)
These 12 ionic currents consist of 10 transmembrane currents, i.e., the fast
sodium current INa, the background sodium current IbNa, the hyperpolariza-
tion-activated sodiumandpotassiumcurrents If, the sodiumcalciumexchanger
current INaCa, the sodium potassium pump current INaK, the channelrhodopsin
sodium current IChR2, the delayed rectifying potassium current IK, the back-
ground potassium current IbK, the long-lasting L-type calcium current ICaL,
and the transient T-type calcium current ICaT, and two sarcoplasmic reticulum
currents, i.e., the calcium uptake Iup and the calcium release Irel.
Mathematical model of ionic concentrations
From a chemical point of view, light induces a channelrhodopsin current
IChR2, which directly impacts the intracellular sodium concentrations ciNa,
_ciNa ¼ � 1
FVi
�INa þ IbNa þ IfNa þ 3INaCa þ 3INaK
þ IKNa þ IChR2�;
(8)
where Vi is the cytosolic volume and F is the Faraday constant. The sodium
concentration will directly, and indirectly through the resulting changes in
the transmembrane potential f, affect all other ionic concentrations in the
cell. The biochemistry of our cell model is characterized through nion ¼8 ion concentrations,
cion ¼ �ceNa; c
eK; c
eCa; c
iNa; c
iK; c
iCa; c
upCa; c
relCa
�; (9)
defined in terms of their evolution equations,
_cion ¼ _cion
�f; ggate; cion
�; (10)
which are parameterized in terms of the transmembrane potential f, the
gating variables ggate, and the ion concentrations cion themselves. In partic-
ular, ceNa, ceK, and ceCa are the extracellular sodium, potassium, and
calcium concentrations; ciNa, ciK, and ciCa are the intracellular sodium,
potassium, and calcium concentrations; and cupCa and crelCa are the sarco-
plasmic reticulum calcium uptake and release (see the Supporting Material
for details about the cell model and its material parameters).
Mathematical model of action potentialpropagation
From an electrical point of view, light induces a channelrhodopsin current
IChR2, which directly impacts the action potential propagation f in the heart.
Biophysical Journal 101(6) 1326–1334
1 2 3 4 5 6 7 8
hESCChR2+ APhESCChR2+
1330 Abilez et al.
Unlike the local ion concentrations for single cells, however, the action
potential is a global field variable (29). Its spatiotemporal evolution
_f ¼ f f�f; ggate; cion
�þ div qðfÞ (11)
is driven by a local source term f f at the single cell level, and by a global
flux term, div q, the divergence of the propagation vector q at the organ
200 µm
eYFPhESCChR2+
50 µm
z z zz
z
m
DAPITnI
20 µm
hESCChR2+
-CM
hESCChR2+
-CM
a b
dc
level. The local source term
f f ¼ � 1
C
�INa þ IbNa þ If þ INaCa þ INaK þ IChR2
þ IK þ IbK þ ICaL þ ICaT� (12)
is directly related to the negative sum of all transmembrane currents scaled
by the individual cell membrane capacitance per unit surface area C. To
account for the nonlocal nature of propagating excitation waves in the heart,
we introduce the propagation vector
q ¼ D$Vf (13)
through the second-order diffusion tensor D scaling the gradient of the
action potential field Vf (see the Supporting Material for the finite-
element-based solution of the action potential propagation problem, and
see (27,29,30)).
400 µm1 µm fe
FIGURE 5 Undifferentiated human embryonic stem cells (hESC) stably
transduced with a ChR2-eYFP lentiviral vector (hESCChR2þ) remain plurip-
otent and can differentiate into cardiomyocytes (hESCChR2þ-CM). (a) PCR
shows that hESC ChR2þ express the pluripotent Oct-4 gene (169 bp, lane 4)
and Nanog gene (154 bp, lane 5) (blue box). In addition, amplification
within the ChR2 gene (174 bp, lane 6), across the ChR2-eYFP gene
(197 bp, lane 7), and within the eYFP gene (187 bp, lane 8), confirms stable
transduction of the ChR2-eYFP lentivirus in undifferentiated hESCChR2þ
(yellow box). A ladder (100 bp, lane 1) confirms the predicted sizes of
PCR products. Nontemplate control (lane 2) and GAPDH (152 bp, lane
3) serve as negative and positive controls, respectively. (b) Pluripotent
hESCChR2þ stain is positive for alkaline phosphatase (red). (c) Fluorescence
microscopy shows hESCChR2þ has a positive eYFP signal (green). (d)
hESCChR2þ-CM have positive TnI signals (red), consistent with a CM
phenotype. DAPI staining (blue) demonstrates the position of nuclei. (e)
Transmission electron microscopy shows sarcomeres with associated
z-lines (z) and mitochondria (m) in hESCChR2þ-CM. (f) Light microscopy
shows three hESCChR2þ-CM colonies (dashed white circles) on a multielec-
trode array.
RESULTS
Fig. 5 demonstrates our ability to stably transduce undiffer-entiated hESC with a ChR2-eYFP lentiviral vector. The re-sulting hESCChR2þ remain pluripotent and can differentiateinto hESCChR2þ-CM. In Fig. 5 a, the PCR shows thathESCChR2þ express the pluripotent Oct-4 gene (169 bp,lane 4) and Nanog gene (154 bp, lane 5) (blue box). In addi-tion, amplification within the ChR2 gene (174 bp, lane 6),across the ChR2-eYFP gene (197 bp, lane 7), and withinthe eYFP gene (187 bp, lane 8), confirms stable transductionof the ChR2-eYFP lentivirus in undifferentiated hESCChR2þ
(yellow box). A ladder (100 bp, lane 1) confirms the pre-dicted sizes of PCR products. Nontemplate control (lane2) and GAPDH (152 bp, lane 3) serve as negative andpositive controls, respectively. Fig. 5 b illustrates thatpluripotent hESCChR2þ is stain-positive for alkaline phos-phatase (red). Fig. 5 c demonstrates the hESCChR2þ positiveeYFP signal upon fluorescence microscopy (green). Fig. 5 dconfirms that hESCChR2þ-CM have positive TnI signals(red), consistent with a CM phenotype. DAPI staining(blue), demonstrates the position of nuclei. Fig. 5 e illus-trates transmission electron microscopy of hESCChR2þ-CMshowing sarcomeres with characteristic z-lines and mito-chondria. Fig. 5 f shows the light microscopy of threehESCChR2þ-CM colonies (dashed white circles) on a multi-electrode array.
Fig. 6 demonstrates the experimental and computationalsensitivity of hESCChR2-CM with respect to different lightintensities. With light on, the photocurrent IChR2 increasesrapidly, peaks, and decays toward a characteristic plateauvalue. With light off, the photocurrent IChR2 drops rapidlyand decays to zero. Fig. 6 (top) illustrates the varying light
Biophysical Journal 101(6) 1326–1334
intensities from 12.5% to 25%, 50%, and 100% for whichwe measure the photocurrent IChR2 upon whole-cell voltage-clamp. Fig. 6 (middle) demonstrates the experimentallymeasured photocurrent IChR2, which increases with in-creasing light intensity. Fig. 6 (bottom) shows the calibratedcomputational cell model that captures the characteristiclight sensitivity, displaying increased photocurrents IChR2with increased light intensity (see the Supporting Material).
Fig. 7 demonstrates the experimental and computationalsensitivity of hESCChR2-CMwith respect to different stimula-tion frequencies. Applied light stimulation at 100% intensityis illustrated (blue lines) at 100-ms pulse width. Experimen-tally measured electrical field potentials and mechanicalcontractions (black and red lines) and computationally pre-dicted electrical transmembrane potentials are indicated
FIGURE 6 Experimental and computational sensitivity of hESCChR2-
CM with respect to light intensity. With light on, the photocurrent IChR2increases rapidly, peaks, and decays toward a characteristic plateau value.
With light off, the photocurrent IChR2 drops rapidly and decays to zero.
Light intensity is varied from 12.5% to 25%, 50%, and 100% (top).
Whole-cell voltage-clamp reveals an increased photocurrent IChR2 as the
light intensity increases (middle). The computational hESCChR2-CM model
captures the light sensitivity and displays increased photocurrents IChR2with increased light intensity (bottom).
FIGURE 7 Experimental and computational sensitivity of hESCChR2-
CM with respect to stimulation frequency. Light stimulation (blue) evokes
field potentials (black) that translate into mechanical contractions (red).
Light stimulation at 100% intensity is performed at 0.5 Hz (top), 1.0 Hz
(middle), and 1.5 Hz (bottom). Evoked signals during light stimulation
(center) are markedly different from pre- and poststimulation signals at
all frequencies (left and right). The computational hESCChR2-CM model
(green) captures the electrical signal at all frequencies, both during light
stimulation (center), and pre- and poststimulation (left and right).
Optogenetic Control of Cardiac Function 1331
(green lines). We probe the cells with light stimulation at0.5 Hz (Fig. 7, top), 1.0 Hz (Fig. 7, middle), and 1.5 Hz(Fig. 7, bottom). Electrical and mechanical signals duringlight stimulation, shown in the center, are significantlydifferent from pre- and poststimulation signals at all frequen-cies, shown at the beginning and end of the readings. Thecomputational hESCChR2-CM model excellently capturesthe electrical signal both during light stimulation, and pre-and poststimulation. The two initial double spikes (see greencurves) of the computationalmodel paced at 0.5Hz are causedby an interference of the photostimulation with the cell’snatural frequency of 0.7 Hz. This interference is only presentwhen cells are paced below their natural frequency, anddoes not occur during photostimulation at 1.0 Hz and 1.5 Hz.
Fig. 8 illustrates the potential of the proposed technologyto virtually pace a human heart with light. The finite elementmodel of the heart created from magnetic resonance imagesconsists of 3129 nodes and 11,347 three-dimensionaltetrahedral elements (31) (see the Supporting Material).Fig. 8 (top) shows the effects of atrioventricular (AV)node photostimulation initiated through hESCChR2-CM,which are virtually injected into the basal region of theseptum, whereas all other regions are modeled as standardventricular CM. For AV node pacing, the depolarizationwave is initiated at the AV node, travels down the septum,
and then activates the left and right ventricles. Fig. 8(bottom) shows the effects of biventricular photostimula-tion, initiated through hESCChR2-CM, which are virtuallyinjected into the lateral wall of the left and right ventricles,whereas all other regions are modeled as standard ventric-ular CM. For biventricular photostimulation, the depolariza-tion wave is initiated at the lateral left and right ventricularwalls, travels along the ventricles, and then activates theapex and the septum. The color code indicates the
Biophysical Journal 101(6) 1326–1334
FIGURE 8 Virtual activation sequences of light-paced hearts. Atrioven-
tricular node (top) and biventricular (bottom) photosimulations are initiated
through hESCChR2-CM, virtually injected into the basal septum and into
both lateral walls, respectively. All other regions are modeled as standard
ventricular CM. The color code indicates the magnitude of the transmem-
brane potential f varying from �90 mV (blue) to þ20 mV (red).
1332 Abilez et al.
magnitude of the transmembrane potential varying from�90 mV (blue) to þ20 mV (red).
DISCUSSION
In Fig. 5, we have shown that ChR2 can be expressed stablyand safely in hESC-CM to drive CM depolarization via pho-tostimulation. Using a lentiviral vector (7,16), we haveintroduced ChR2 coupled to YFP into undifferentiatedhESC. After confirming expression via immunocytochem-istry, we have expanded these ChR2-expressing cells anddemonstrated their pluripotency using PCR. Via directeddifferentiation, we have created hESCChR2-CM, which wehave then subjected to optical stimulation. We have success-fully recorded their electrical, biochemical, and mechanicalsignals using patch-clamping, MEA recordings, and videomicroscopy. These data have allowed us to calibrate ourcomputational hESCChR2-CM model.
In Fig. 6, we have demonstrated the sensitivity of bothexperimental and computational photocurrents with respectto the stimulating light intensity (25). Both graphs illustratethe characteristic rapid increase to the intensity-dependentpeak current, followed by a slower decrease toward theintensity-dependent asymptotic plateau value (32,33).
Biophysical Journal 101(6) 1326–1334
Although the translation of optogenetic techniques intoclinical practice may still have many technical hurdles topass, the technology itself can already serve as a valuableresearch tool in cardiac electrophysiology. Traditional toolsbased on the simultaneous use of electrical stimulation andelectrical recording typically suffer from unavoidable arti-facts (34). The inherent orthogonality of optical and electri-cal techniques allows us to significantly reduce thesespurious errors when using optical stimulation combinedwith electrical recordings, as shown in Fig. 7.
A tremendous potential of opsin-based systems foroptical manipulation lies in their inherent ability to notonly turn-cells-on using channelrhodopsin as a blue-light-gated ion channel transporting positively charged cationsalong their concentration gradients (9), but also to turn-cells-off using halorhodopsin as a yellow-light-driving ionpump transporting negatively charged chloride ions againsttheir concentration gradients (10). A promising first study inzebrafish has shown that a combination of channelrhodopsinand halorhodopsin allows for optically controlling heartrate, reversing cardiac conduction, and inducing diseaselikearrhythmias (14).
Computational modeling allows us to predict the responseof living cells, both in isolation and in interaction with theirenvironment. In Fig. 8, we have demonstrated our very firstproof-of-principle, using finite element modeling in anattempt to bridge the scales from cells to systems (35).Finite-element-based models allow us to combine virtuallyany cell type (36) on virtually any geometry (37). Here,they allow us to predict the activation sequences in thehuman heart for different pacing sites (38).
Pacing hearts in silico by means of photostimulation willallow us to virtually probe different scenarios (39,40) towardour ultimate goal of light pacing hearts in vivo (14). Incontrast to electrical pacemakers, light delivery is minimallyinvasive, genetically targeted, and temporally precise. Mostimportantly, light can be delivered at a distance. Unlikepacing leads for electrical stimulation, which are known tohave a high failure rate due to mechanical fatigue (41), thelight source for optical stimulation does not have to sitdirectly on the continuously moving heart muscle. Lightpacing might therefore be an attractive remote, less invasive,and more durable alternative to current electrical pacingleads (42).
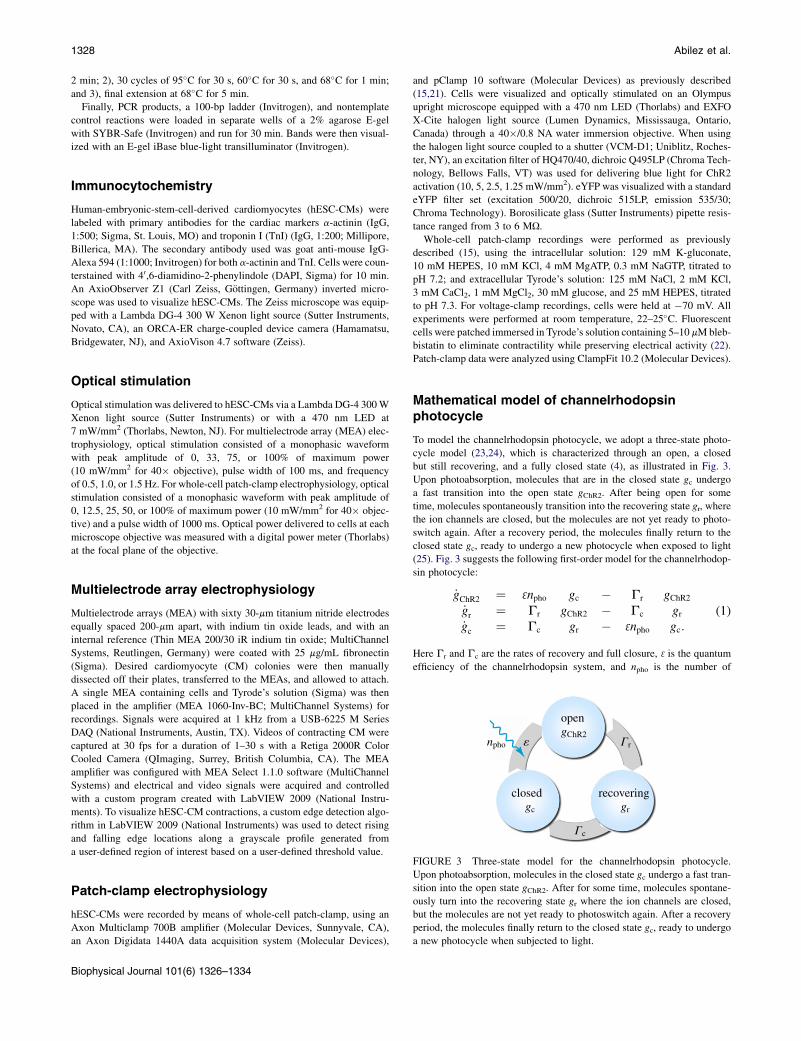
Limitations
This study presents our first attempts toward pacing theheart with light using a multiscale approach. On the photo-cycle level (4), we have adapted a classic three-state modelfor the ChR2 photocycle, which was initially proposed forChR2-expressing neurons. This conceptually elegant modelhas allowed us to reliably reproduce the characteristicfeatures of a light-evoked response in ChR2-expressinghESC-CM. However, the extension to a four-state (24) or
Optogenetic Control of Cardiac Function 1333
five-state (43) model, either of which is known to reproducethe biexponential decay of the light-off current more accu-rately (23), is conceptually straightforward. In terms of pho-tostimulation, we have applied pulse widths of 100 and1000 ms. These relatively long durations of channel openingmay increase sodium overload and adversely influenceaction potential profiles. Because the rapid upstroke of theaction potential takes place in the first 10 ms (26), the stim-ulation pulse width could potentially be decreased to 10 msor less (O. Abilez, J. A. Baugh, M. L. Gorrepati, R. Prakash,C. Lee-Messer, M. Huang, F. Jia, J. Yu, K. D. Wilson,J. C. Wu, K. Deisseroth, and C. K. Zarins, unpublished),which would favorably limit light exposure time (see theSupporting Material). Novel developments in ultrafastoptogenetics suggest using the rationally engineered chan-nelrhodopsin ChETA, which provides high-fidelity opticalcontrol of spiking at high frequencies and eliminates plateaupotentials during continued stimulation (44).
On the ion channel level, we have assumed that the ChR2current is driven exclusively by concentration gradientsin the sodium concentration (24). Accordingly, we havemodeled ChR2 to be selectively permeable to sodium ionsonly. Although ChR2 is known to be a general cationchannel (12), its effects on potassium and calcium remainpoorly characterized (45). However, making the channelpermeable to other monovalent and divalent cations (4),would require only modular changes in the mathematicalmodel.
On the cellular level, due to the lack of mathematicalmodels for stem cell-derived cardiac cells, we have adopteda widely used and well-characterized model for maturecardiac cells (26,28). A recent study confirmed that ChR2expresses its characteristic features independent of theparticular expression system (45). Therefore, we have modi-fied the mature cell model via an additional photocurrentgoverned by a light-sensitive gating variable. A thoroughidentification of the individual channel characteristics ofhESC-CM and their quantitative comparison with matureCM and hESCChR2þ-CM remain to be addressed to fullyvalidate our conceptual approach (21).
On thewhole-heart level, the simulation of the light-pacedheart is admittedly relatively simplistic. Although our algo-rithm can, in principle, handle arbitrary mixtures of differentcell types (36), here, we have assumed that the injected cellsare pure hESCChR2þ-CM.Wehave adopted a common proce-dure to model cell injection (37), which does not addressadditional obstacles commonly associated with cell deliverysuch as cell migration away from the injection site or cellsurvival in the myocardial wall. At this stage, our modelalso fails to appropriately predict the effects of light scat-tering by tissue and absorption by blood. Light scattering isa general barrier to in vivo translation, and efforts areunderway by our groups and others to red-shift the opsinsand maximize the efficiency of light delivery through tissues(15,46).
CONCLUSION
At an unprecedented temporal and spatial precision, optoge-netic tools now enable us to manipulate electrically activecells. This study capitalizes on recent developments inoptics and genetics, supplemented by novel technologiesin stem cell biology, electrophysiology, and computationalmechanics. It documents our first attempts to introduce alight-sensitive ion channel in human-embryonic-stem-cell-derived cardiomyocytes, with the ultimate goal to controlthe cardiac system by means of photostimulation. Unliketraditional electrical stimulation, optogenetics allows us toprecisely control the selective permeability of the plasmamembrane, its conductivity with respect to different ions,its sensitivity to light of different wavelengths, and thespatiotemporal evolution of different opening and closingprofiles. Given this incredible freedom, we need to establishan economical strategy to optimize the matrix of inputvariables. Predictive computational models allow us tovirtually probe landscapes of process parameters andidentify optimal photostimulation sequences in variousdifferent tissues and organs. Here, as a very first proof-of-principle, we virtually inject photosensitive cells intodifferent locations of a human heart model, and pace theheart with light. We believe that this concept will be widelyapplicable to systematically manipulate electrically activecells and, ultimately, support the design of novel therapiesfor various types of neuronal, musculoskeletal, pancreatic,and cardiac disorders such as depression, schizophrenia,cerebral palsy, paralysis, diabetes, pain syndromes, andcardiac arrhythmias.
SUPPORTING MATERIAL
Supporting equations, two tables, and three figures are available at http://
We thank Joshua Baugh and Madhu Gorrepati for technical assistance.
This material was supported by the Stanford ARTS Fellowship to O.J.A., by
the Stanford Graduate Fellowship to J.W., by National Science Foundation
grant EFRI-CBE-0735551 and by California Institute for Regenerative
Medicine No. RC1-00151 to C.K.Z., and by National Science Foundation
CAREER Award CMMI-0952021 and National Institutes Health grant
U54 GM072970 to E.K.
REFERENCES
1. Oesterhelt, D., and W. Stoeckenius. 1971. Rhodopsin-like protein fromthe purple membrane of Halobacterium halobium. Nat. New Biol.233:149–152.
2. Matsuno-Yagi, A., and Y. Mukohata. 1977. Two possible roles ofbacteriorhodopsin; a comparative study of strains of Halobacteriumhalobium differing in pigmentation. Biochem. Biophys. Res. Commun.78:237–243.
3. Nagel, G., D. Ollig, ., P. Hegemann. 2002. Channelrhodopsin-1:a light-gated proton channel in green algae. Science. 296:2395–2398.
4. Nagel, G., T. Szellas, ., E. Bamberg. 2003. Channelrhodopsin-2,a directly light-gated cation-selective membrane channel. Proc. Natl.Acad. Sci. USA. 100:13940–13945.
5. Hegemann, P., W. Gartner, and R. Uhl. 1991. All-trans retinal consti-tutes the functional chromophore in Chlamydomonas rhodopsin.Biophys. J. 60:1477–1489.
6. Lawson, M. A., D. N. Zacks, ., J. L. Spudich. 1991. Retinal analogrestoration of photophobic responses in a blind Chlamydomonasreinhardtii mutant. Evidence for an archaebacterial like chromophorein a eukaryotic rhodopsin. Biophys. J. 60:1490–1498.
7. Boyden, E. S., F. Zhang, ., K. Deisseroth. 2005. Millisecond-timescale, genetically targeted optical control of neural activity. Nat.Neurosci. 8:1263–1268.
8. Zhang, F., L. P. Wang, ., K. Deisseroth. 2006. Channelrhodopsin-2and optical control of excitable cells. Nat. Methods. 3:785–792.
9. Deisseroth, K. 2011. Optogenetics. Nat. Methods. 8:26–29.
10. Hegemann, P., and A. Moglich. 2011. Channelrhodopsin engineeringand exploration of new optogenetic tools. Nat. Methods. 8:39–42.
11. Lin, J. Y., M. Z. Lin, ., R. Y. Tsien. 2009. Characterization ofengineered channelrhodopsin variants with improved properties andkinetics. Biophys. J. 96:1803–1814.
12. Szobota, S., and E. Y. Isacoff. 2010. Optical control of neuronalactivity. Annu. Rev. Biophys. 39:329–348.
14. Arrenberg, A. B., D. Y. R. Stainier, ., J. Huisken. 2010. Optogeneticcontrol of cardiac function. Science. 330:971–974.
15. Gradinaru, V., F. Zhang, ., K. Deisseroth. 2010. Molecular andcellular approaches for diversifying and extending optogenetics. Cell.141:154–165.
16. Zhang, F., L. P. Wang,., K. Deisseroth. 2007. Multimodal fast opticalinterrogation of neural circuitry. Nature. 446:633–639.
17. Sena-Esteves, M., J. C. Tebbets, ., A. W. Flake. 2004. Optimizedlarge-scale production of high titer lentivirus vector pseudotypes.J. Virol. Methods. 122:131–139.
18. Ludwig, T. E., V. Bergendahl, ., J. A. Thomson. 2006. Feeder-inde-pendent culture of human embryonic stem cells. Nat. Methods. 3:637–646.
19. Laflamme, M. A., K. Y. Chen, ., C. E. Murry. 2007. Cardiomyocytesderived from human embryonic stem cells in pro-survival factorsenhance function of infarcted rat hearts. Nat. Biotechnol. 25:1015–1024.
20. Yang, L., M. H. Soonpaa, ., G. M. Keller. 2008. Human cardiovas-cular progenitor cells develop from a KDRþ embryonic-stem-cell-derived population. Nature. 453:524–528.
21. Mummery, C., D. Ward-van Oostwaard,., L. Tertoolen. 2003. Differ-entiation of human embryonic stem cells to cardiomyocytes: role of co-culture with visceral endoderm-like cells. Circulation. 107:2733–2740.
22. Fedorov, V. V., I. T. Lozinsky, ., I. R. Efimov. 2007. Application ofblebbistatin as an excitation-contraction uncoupler for electrophysio-logic study of rat and rabbit hearts. Heart Rhythm. 4:619–626.
23. Hegemann, P., S. Ehlenbeck, and D. Gradmann. 2005. Multiple photo-cycles of channelrhodopsin. Biophys. J. 89:3911–3918.
24. Nikolic, K., N. Grossman, ., P. Degenaar. 2009. Photocycles ofchannelrhodopsin-2. Photochem. Photobiol. 85:400–411.
25. Nikolic, K., P. Degenaar, and C. Toumazou. 2006. Modeling andengineering aspects of Channelrhodopsin2 system for neural photosti-mulation. Proc. 28th IEEE EMBS. 40:1626–1629.
26. Dokos, S., B. Celler, and N. Lovell. 1996. Ion currents underlying sino-atrial node pacemaker activity: a new single cell mathematical model.J. Theor. Biol. 181:245–272.
Biophysical Journal 101(6) 1326–1334
27. Wong, J., S. Goktepe, and E. Kuhl. 2011. Computational modeling ofelectrochemical coupling: a novel finite element approach towardsionic models for cardiac electrophysiology. Comput. Methods Appl.Mech. Eng. 200:3139–3158.
28. DiFrancesco, D. 1993. Pacemaker mechanisms in cardiac tissue. Annu.Rev. Physiol. 55:455–472.
29. Goktepe, S., and E. Kuhl. 2009. Computational modeling of electro-physiology: a novel finite element approach. Int. J. Numer. MethodsEng. 79:156–178.
30. Dal, H., S. Goktepe, ., E. Kuhl. 2011. A fully implicit finite elementmethod for bidomain models of cardiac electrophysiology. Comput.MethodsBiomech. Biomed. Eng.DOI:10.1080/10255842.2011.554410.
31. Kotikanyadanam, M., S. Goktepe, and E. Kuhl. 2010. Computationalmodeling of electrocardiograms—a finite element approach towardscardiac excitation. Int. J. Numer. Meth. Biomed. Eng. 26:524–533.
32. Ishizuka, T., M. Kakuda, ., H. Yawo. 2006. Kinetic evaluation ofphotosensitivity in genetically engineered neurons expressing greenalgae light-gated channels. Neurosci. Res. 54:85–94.
33. Tsunoda, S. P., D. Ewers, ., P. Hegemann. 2006. Hþ-pumpingrhodopsin from the marine alga Acetabularia. Biophys. J. 91:1471–1479.
34. Lee, J. H., R. Durand, ., K. Deisseroth. 2010. Global and local fMRIsignals driven by neurons defined optogenetically by type and wiring.Nature. 465:788–792.
35. Goktepe, S., O. J. Abilez, ., E. Kuhl. 2010. A multiscale model foreccentric and concentric cardiac growth through sarcomerogenesis.J. Theor. Biol. 265:433–442.
36. Chen, M. Q., J. Wong, ., G. T. A. Kovacs. 2011. Characterization ofelectrophysiological conduction in cardiomyocyte co-cultures usingco-occurrence analysis. Comp. Meth. Biomech. Biomed. Eng. In press.
37. Wenk, J. F., P. Eslami, ., J. M. Guccione. 2011. A novel method forquantifying the in-vivo mechanical effect of material injected intoa myocardial infarction. Ann. Thorac. Surg. 92:935–941.
38. Goktepe, S., and E. Kuhl. 2010. Electromechanics of the heart—a unified approach to the strongly coupled excitation-contractionproblem. Comput. Mech. 45:227–243.
39. Puwal, S., and B. J. Roth. 2009. Optimization of feedback pacing fordefibrillation. IEEE Trans. Biomed. Eng. 56:532–534.
40. Goktepe, S., J. Wong, and E. Kuhl. 2010. Atrial and ventricular fibril-lation—computational simulation of spiral waves in cardiac tissue.Arch. Appl. Mech. 80:569–580.
41. Khan, M. N., G. Joseph, ., B. L. Wilkoff. 2005. Delayed lead perfo-ration: a disturbing trend. Pacing Clin. Electrophysiol. 28:251–253.
42. Vlay, S. C. 2002. Complications of active-fixation electrodes. PacingClin. Electrophysiol. 25:1153–1154.
43. Bamann, C., T. Kirsch, ., E. Bamberg. 2008. Spectral characteristicsof the photocycle of channelrhodopsin-2 and its implication for channelfunction. J. Mol. Biol. 375:686–694.
44. Gunaydin, L. A., O. Yizhar, ., P. Hegemann. 2010. Ultrafast optoge-netic control. Nat. Neurosci. 13:387–392.
45. Berndt, A., M. Prigge, ., P. Hegemann. 2010. Two open states withprogressive proton selectivities in the branched channelrhodopsin-2photocycle. Biophys. J. 98:753–761.
46. Berndt, A., P. Schoenenberger,., T. G. Oertner. 2011. High-efficiencychannel rhodopsins for fast neuronal stimulation at low light levels.Proc. Natl. Acad. Sci. USA. 108:7595–7600.