Multivariable And Sensor Feedback Based Real-TimeMonitoring And Control Of Microalgae Production System
Item Type text; Electronic Dissertation
Authors Jia, Fei
Publisher The University of Arizona.
Rights Copyright © is held by the author. Digital access to this materialis made possible by the University Libraries, University of Arizona.Further transmission, reproduction or presentation (such aspublic display or performance) of protected items is prohibitedexcept with permission of the author.
Download date 08/06/2018 16:49:13
Link to Item http://hdl.handle.net/10150/579045
MULTIVARIABLE AND SENSOR FEEDBACK BASED REAL-TIME
MONITORING AND CONTROL OF MICROALGAE PRODUCTION SYSTEM
by
Fei Jia
__________________________ Copyright © Fei Jia 2015
A Dissertation Submitted to the Faculty of the
DEPARTMENT OF AGRICULTURAL AND BIOSYSTEMS ENGINEERING
In Partial Fulfillment of the Requirements
For the Degree of
DOCTOR OF PHILOSOPHY
In the Graduate College
THE UNIVERSITY OF ARIZONA
2015
2
THE UNIVERSITY OF ARIZONA
GRADUATE COLLEGE
As members of the Dissertation Committee, we certify that we have read the dissertation
prepared by Fei Jia, titled “Multivariable and Sensor Feedback Based Real-time
Monitoring and Control of Microalgae Production System” and recommend that it be
accepted as fulfilling the dissertation requirement for the Degree of Doctor of
Philosophy.
_______________________________________________________________________ Date: 7/29/2015
Dr. Murat Kacira
_______________________________________________________________________ Date: 7/29/2015
Dr. Kimberly Ogden
_______________________________________________________________________ Date: 7/29/2015
Dr. Lingling An
_______________________________________________________________________ Date: 7/29/2015
Dr. Judith Brown
Final approval and acceptance of this dissertation is contingent upon the candidate’s
submission of the final copies of the dissertation to the Graduate College.
I hereby certify that I have read this dissertation prepared under my direction and
recommend that it be accepted as fulfilling the dissertation requirement.
________________________________________________ Date: 7/29/2015
Dissertation Director: Dr. Murat Kacira
3
STATEMENT BY AUTHOR
This dissertation has been submitted in partial fulfillment of the requirements for
an advanced degree at the University of Arizona and is deposited in the University
Library to be made available to borrowers under rules of the Library.
Brief quotations from this dissertation are allowable without special permission,
provided that an accurate acknowledgement of the source is made. Requests for
permission for extended quotation from or reproduction of this manuscript in whole or in
part may be granted by the copyright holder.
SIGNED: Fei Jia
4
ACKNOWLEDGEMENTS
I would like to acknowledge the following for their valuable contributions to this research
and to the development of this dissertation:
The research grant from the United States of America Department of Energy for their
financial support.
I am thankful to my advisor, Dr. Murat Kacira, for his guidance on my academic path.
Thanks for his encouragement and valuable advices to make me a better researcher.
I would like to acknowledge my committee members, Dr. Kimberly Ogden, Dr. Judith
Brown and Dr. Lingling An for their great directions and expertise enabling this
dissertation to be successful.
I thank Charlie DeFer and his team at the Agricultural and Biosystems Engineering
Department shop, for their time and patience on assisting me to fabricate the fixture for
the optical sensor system; Neal Barto, for his technical assistance on all the works I have
accomplished at the CEAC.
I would like to extend my thanks to my colleagues working, and used to work in Dr.
Kacira’s lab, the Agricultural and Biosystems Engineering Department and the
Controlled Environment Agriculture Center for their help whenever needed.
Finally, I would like to give my special thanks to my family and friends for their love and
support.
5
TABLE OF CONTENTS
ABSTRACT ........................................................................................................................ 8
1. INTRODUCTION ........................................................................................................ 10
1.1 Microalgae production systems .............................................................................. 10
1.1.1 Open pond raceways ........................................................................................ 10
1.1.2. Closed Photobioreactors (PBRs)..................................................................... 11
1.2 Microalgae biomass concentration measurements .................................................. 12
1.2.1 Ash Free Dry Weight (AFDW)........................................................................ 12
1.2.2 Cell counting .................................................................................................... 13
1.2.3 Spectrophotometry ........................................................................................... 13
1.2.4 Turbidity measurement .................................................................................... 15
1.2.5 Chlorophyll fluorescence measurement ........................................................... 16
1.2.6 Flow cytometry ................................................................................................ 16
1.3 Real-time monitoring and control ........................................................................... 17
1.4 Commercial microalgae sensors ............................................................................. 18
1.5 Problem Statement .................................................................................................. 20
1.6 Research Objectives ................................................................................................ 21
2. LITERATURE REVIEW ............................................................................................. 22
3. PRESENT STUDY ....................................................................................................... 31
3.1 Overall Summary .................................................................................................... 31
3.2 Overall Conclusions and Recommendations .......................................................... 33
4. REFERENCES ............................................................................................................. 36
APPENDIX A - MULTI-WAVELENGTH BASED OPTICAL DENSITY SENSOR
FOR AUTONOMOUS MONITORING OF MICROALGAE ................................... 42
Abstract ......................................................................................................................... 42
Keywords ...................................................................................................................... 42
1. Introduction ............................................................................................................... 43
2. Material and Methods ............................................................................................... 46
2.1. Optical density measurement sensor .................................................................. 46
6
2.2. Cultivation conditions and organisms ................................................................ 48
2.3 Offline biomass concentration measurement ...................................................... 49
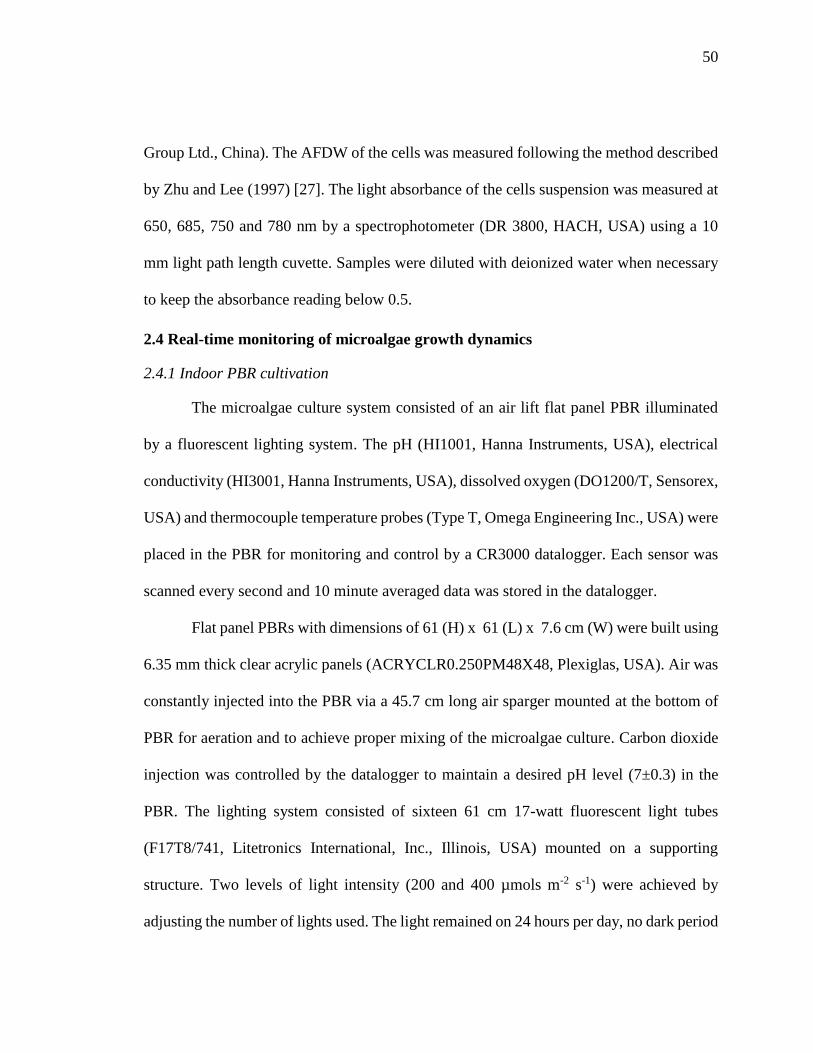
2.4 Real-time monitoring of microalgae growth dynamics ...................................... 50
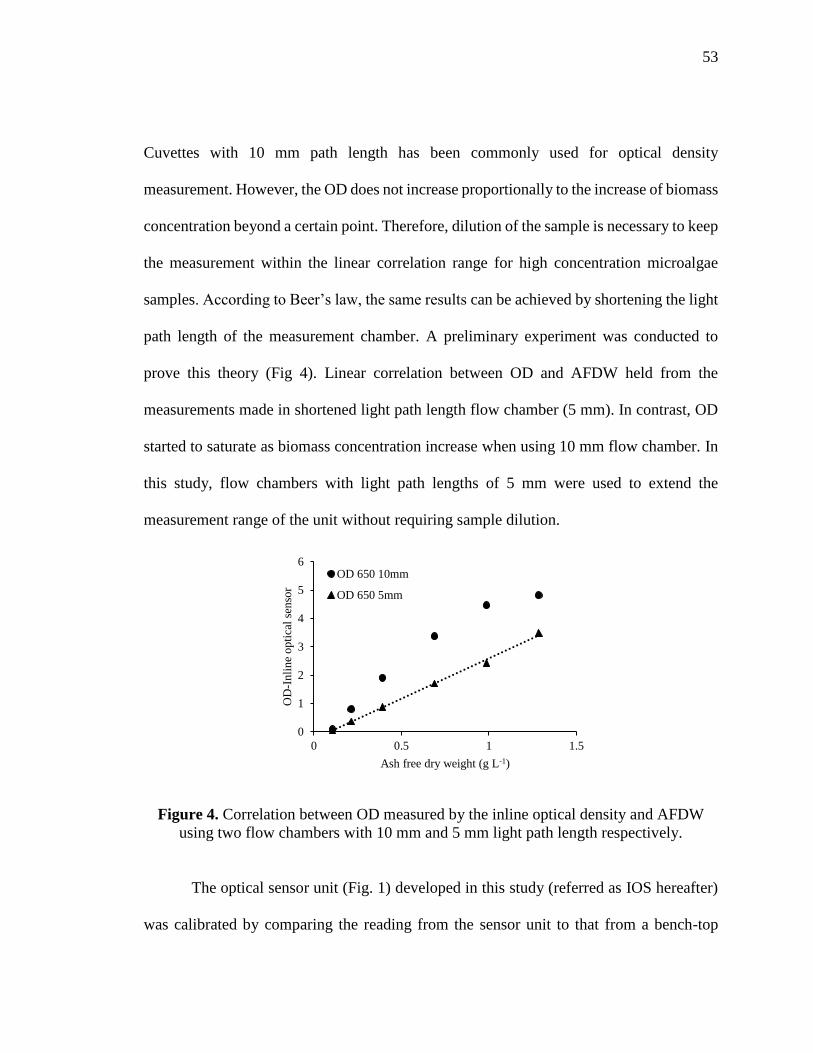
3. Results and Discussion ............................................................................................. 52
3.1 In situ calibration of the optical density measurement unit ................................ 52
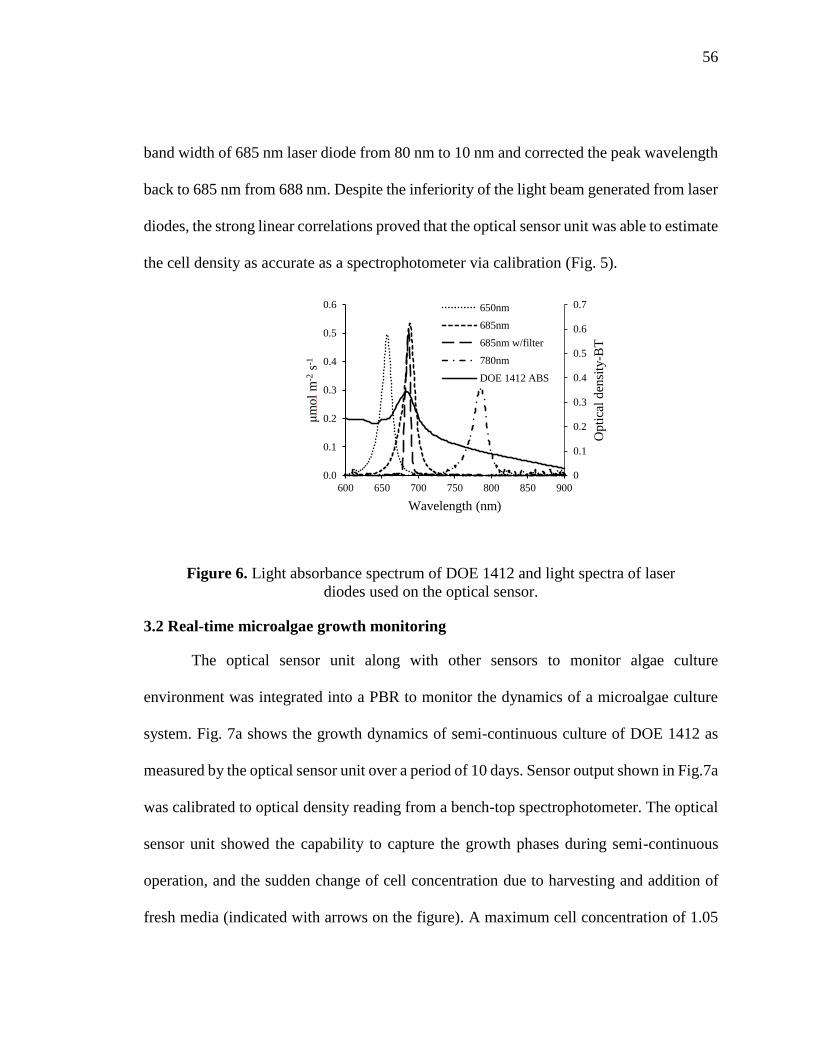
3.2 Real-time microalgae growth monitoring ........................................................... 56
4. Conclusions ............................................................................................................... 62
Acknowledgments......................................................................................................... 64
References and Notes .................................................................................................... 64
APPENDIX B - AUTONOMOUS DETECTION OF AN ABIOTIC AND BIOTIC
DISTURBANCE IN A MICROALGAL CULTURE SYSTEM USING A MULTI-
WAVELENGTH OPTICAL DENSITY SENSOR ...................................................... 69
Abstract ......................................................................................................................... 69
Keywords ...................................................................................................................... 70
1. Introduction ............................................................................................................... 71
2. Material and methods ................................................................................................ 74
2.1 Cultivation conditions and organisms ................................................................. 74
2.2 Offline biomass concentration measurement ...................................................... 75
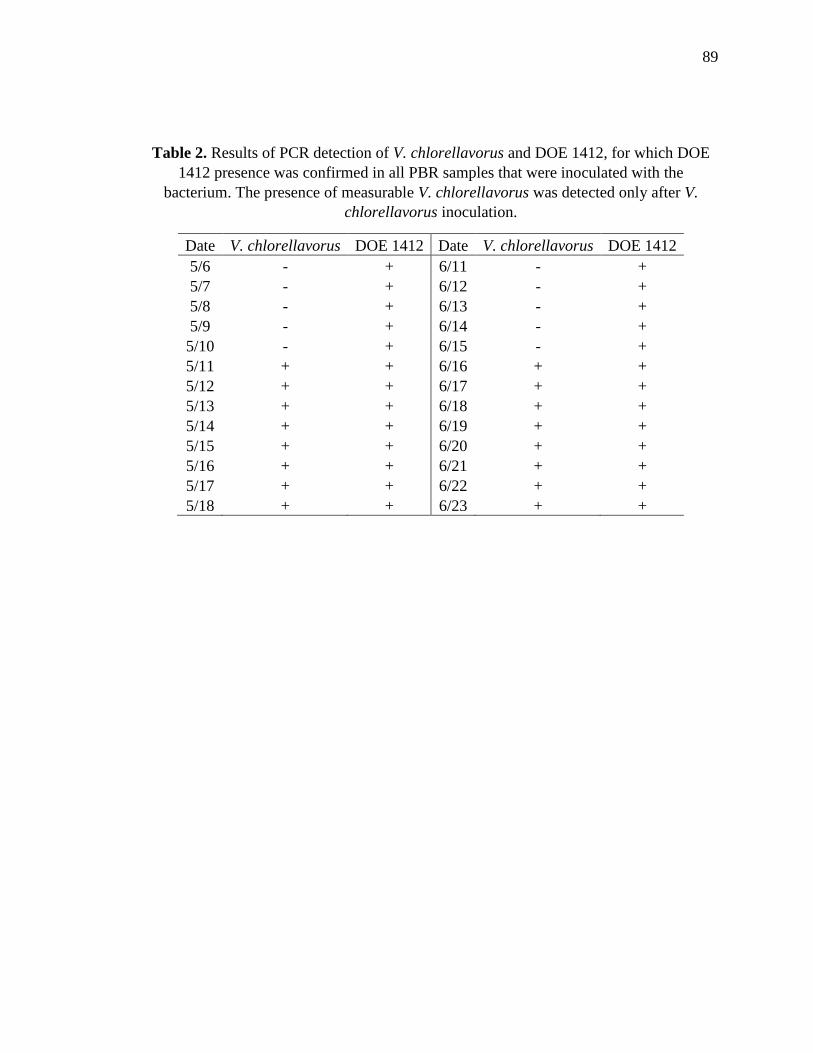
2.3 PCR detection of V. chlorellavorus and C. sorokiniana ..................................... 76
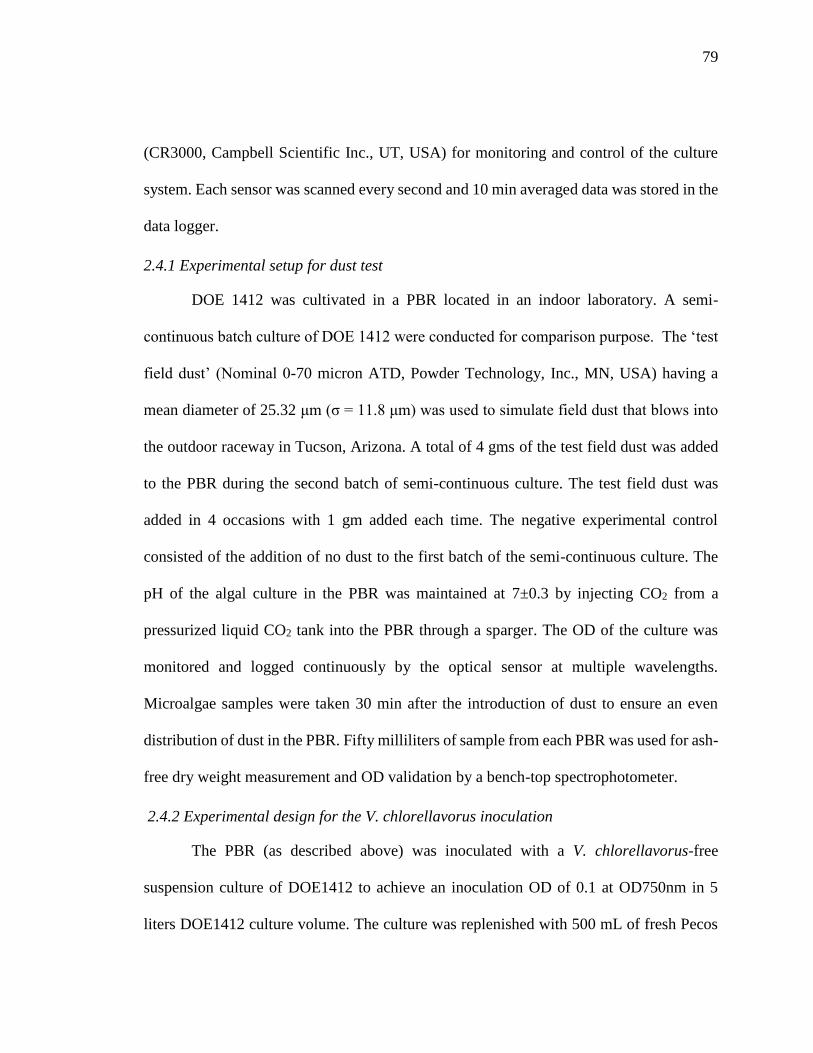
2.4 Real-time monitoring of microalgae growth dynamics ...................................... 78
3. Results and Discussion ............................................................................................. 80
3.1 Dust test .............................................................................................................. 80
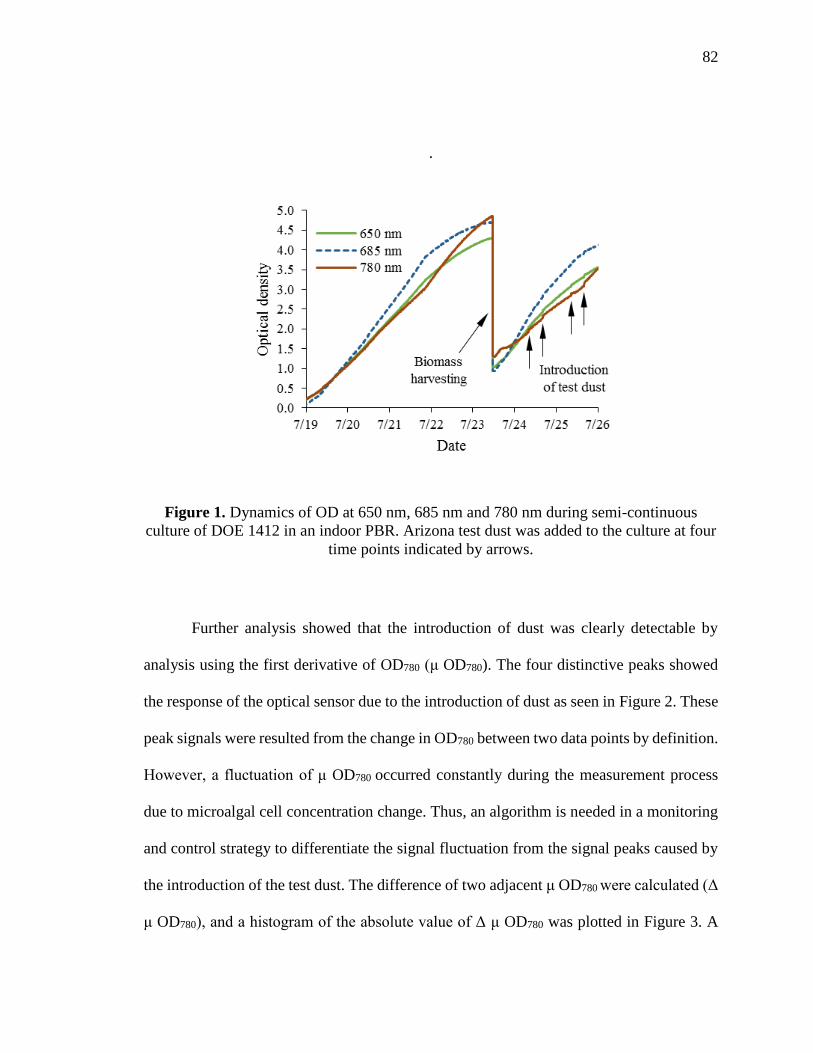
3.2 V. Chlorellavorus test ......................................................................................... 84
4. Conclusions ............................................................................................................... 90
5. References ................................................................................................................. 92
APPENDIX C - AUTONOMOUS MONITORING AND CONTROL OF
MICROALGAE PRODUCTION SYSTEM ................................................................. 96
Abstract ......................................................................................................................... 96
Keywords ...................................................................................................................... 96
1. Introduction ............................................................................................................... 97
2. Material and Methods ............................................................................................... 99
2.1 Cultivation conditions and organisms ................................................................. 99
7
2.2 Open pond raceway monitoring and control ..................................................... 100
2.3 Offline biomass concentration measurement .................................................... 105
3. Results and Discussion ........................................................................................... 105
4. Conclusions ............................................................................................................. 109
5. References ............................................................................................................... 109
8
ABSTRACT
A multi-wavelength laser diode based optical sensor was designed, developed and
evaluated for monitoring and control microalgae growth in real-time. The sensor measures
optical density of microalgae suspension at three wavelengths: 650 nm, 685 nm and 780
nm, which are commonly used for estimating microalgae biomass concentration and
chlorophyll content. The sensor showed capability of measuring cell concentration up to
1.05 g L-1 without sample dilution or preparation. The performance of the sensor was
evaluated using both indoor photobioreactors and outdoor paddle wheel reactors. It was
shown that the sensor was capable of monitoring the dynamics of the microalgae culture
in real-time with high accuracy and durability. Specific growth rate (µ) and ratios of optical
densities (OD ratios) at different wavelengths were calculated and were used as good
indicators of the health of microalgae culture. A series of experiments was conducted to
evaluate the sensor’s capability of detecting environmental disturbances in microalgae
systems, for instance, induced by dust or Vampirovibrio chlorellavorus, a bacteria found
to cause crash of microalgae culture. Optical densities measured from the sensor were
insensitive to the amount of dust that consisted of 59.7% of dry weight of microalgae in
the system. However, the sensor was able to detect multiple events of introduction of dust
timely by µ and OD ratios. The sensor was also capable of detecting subtle changes of
culture in color that leads to a total crash of the culture before it can be differentiated by
naked eye. The sensor was further integrated into an existing outdoor raceway to
demonstrate the sensor’s potential of being a core component to control microalgae
production system. A real-time monitoring and control program along with a graphical user
9
interface (GUI) was developed for a central control station aiming at improving resource
use efficiency for biomass production.
10
1. INTRODUCTION
Microalgae are photoautotrophic microorganisms that convert solar energy into
chemical energy by consuming carbon dioxide and water while release oxygen into the
atmosphere as a byproduct. They have been commercially cultivated to produce
antioxidants, antibiotics and toxins for pharmaceutical applications; long-chain
polyunsaturated fatty acids (PUFAs), polysaccharides, vitamins, β-carotene and pigments
for nutritional supplements and animal feed for decades (Spolaore et al. 2006; Harun et al.
2010). Certain strains of microalgae showed great potential as one of the renewable energy
sources to limit the use of fossil fuels due to their high levels of lipids which can be
extracted and converted into biofuels et al. 2010). The residual biomass after lipid
extraction (lipid extracted algae - LEA) can further be converted to other forms of biofuels
including ethanol, hydrogen and methane (Hernández et al. 2014). Microalgae are also
used in wastewater treatment with their advantages of lower energy demand compared to
conventional wastewater treatment methods and the ability to convert nitrogen and
phosphorous into biomass.
1.1 MICROALGAE PRODUCTION SYSTEMS
1.1.1 Open pond raceways
Large-scale production facilities provide the possibility of delivering a continuous
supply of high quality microalgae. Microalgae cultivation in commercial scales are
conducted in open pond raceways or in closed photobioreactors (PBRs). There are several
types of ponds are used in research and commercial applications including paddle wheel
11
raceways, shallow ponds and circular ponds (Chaumont 1993; Y. Lee 2001). In general,
the physical culture conditions in open pond systems (temperature, lighting intensity and
duration) are climate dependent (Waller et al. 2012). Microalgae are not always growing
under the optimum condition for this reason, which results in a low productivity compare
to the ones grown in closed systems (Richardson et al. 2012). This further increases the
cost of the product by the large volume of culture going through the harvest process
(Danquah et al. 2009; Knuckey et al. 2006). Furthermore, microalgae are more vulnerable
to contaminants and predators because they are exposed to the environment (Soo et al.
2015; Velicer and Mendes-Soares 2009; Carney and Lane 2014; Rego et al. 2015).
Therefore, only a limited range of species that can survive extreme culture conditions are
suitable for production in open pond systems (Rodolfi et al. 2009). However, the initial
investment on construction of open pond systems are significantly lower than that of closed
systems since less expensive materials are being used and simplicity of reactor design. The
operational and maintenance costs are lowered as well since less environmental conditions
need to be controlled (Richardson et al. 2012).
1.1.2. Closed Photobioreactors (PBRs)
Closed PBR systems, on the other hand, have the advantages of higher areal
productivities (3 times higher than that obtained in open pond systems) and wider selection
range of cultivation species compared to open pond systems (Chaumont 1993; Carvalho et
al. 2006). This is attributed to the ability of having total control over the cultivation
condition that is optimal for the production strain including pH, temperature, lighting
intensity, quality and duration (Saeid and Chojnacka 2015; Pirouzi et al. 2014; Huang et
12
al. 2014). The closed systems prevent contaminants and undesirable microorganism from
entering the culture. This helps to improve the control of the quality of final products when
they are highly susceptible to microbial degradation (e.g. amino acids and
polysaccharides), as well as to reduce the possibility of a total crash of the culture.
Furthermore, the close system can reduce the water evaporation and recover the CO2 that
was not used by the microalgae to improve the resource use efficiency. However, the
capital investment and operational cost in of the closed systems are currently high. The
biomass productivity and the value of the final products need to be much higher to offset
the high production cost (Richardson et al. 2012).
1.2 MICROALGAE BIOMASS CONCENTRATION MEASUREMENTS
1.2.1 Ash Free Dry Weight (AFDW)
There are several methods commonly used in laboratory setup to determine
microalgae biomass concentration. Ash free dry weight (AFDW) measurement is a direct
measurement of the amount of dry biomass in a unit culture volume. The measurement of
dry weight involves cell separation, washing and drying steps. Cells are normally separated
from culture medium by filtration, followed by washing with diluted medium or deionized
water for fresh water microalgae or by isotonic solution for marine algae. The wet biomass
is then dried in an oven at a low temperature (60⁰C- 100⁰C) for at least 12 hours. The
weight differential of the filter before and after low temperature drying process is measured
by a high precision balance to determine the dry weight of the sample. The filter with dried
algae is combusted in a furnace at 540⁰C for 4 hours to evaporate all organic matter leaving
only the inorganic matter (ash) on the filter. The filter is transferred to a desiccator to be
13
cooled before making a measurement to avoid absorption of moisture in the air. The weight
of ash is subtracted from the dry weight to obtain the ash-free dry weight (Zhu and Lee
1997). The whole process is laborious and time-consuming. Large quantity of biomass is
necessary for an accurate measurement.
1.2.2 Cell counting
Cell count is a direct measurement method to determine cell concentration in a
suspension. Microalgae cell suspension need to be diluted in order to form a single layer
of cells in a cell counting chamber under a microscope. Then, the number of cells in a
defined volume then is counted by human or image analysis software (Richmond 2004;
Córdoba-Matson et al. 2009).
1.2.3 Spectrophotometry
Spectrophotometry has been widely used to estimate biomass concentration and
chlorophyll content by measuring the absorbance, turbidity or fluorescence of the culture
suspension. When a ray of straight light shined on a medium, fractions of the light can be
absorbed, reflected and scattered by the material and the rest will pass through it. The
absorbance measures the attenuation of the incident light due to absorption, scattering and
reflection from the medium. It is also proportional to the light path length and the
concentration of the material according to Beer - Lambert’s Law (Lee 1999).
𝐴 = 𝛼𝑙𝑐
A = Absorbance
α = Absorptivity of the medium
l = Light path length
14
c = Concentration of the medium
The absorptivity is an intrinsic property of a medium which is a constant. The light
path length is normally fixed during a measurement. Therefore, the concentration of a
medium can be estimated by measuring the absorbance and calculated using the Beer’s
law. However, the linear correlation only holds when the attenuating medium is
homogeneous. Microalgae cell suspension can be considered as homogeneous at low
concentrations. Therefore, the microalgae suspension sample need to be diluted to a low
concentration in order to accurately estimate biomass concentration from absorbance
measurement. Wavelengths of 650 nm, 680 nm and 750 nm are commonly used to estimate
cell concentration of green algae. Measurement of light absorbance at 650 nm and 680 nm
can be correlated to the intensity of green color of the algae which is mainly attributed to
the concentration of chlorophyll (Das et al. 2011; Solovchenko et al. 2011; Nedbal et al.
2008). Light absorbance at 750 nm (Near Infrared) correlates to the total biomass because
color has no effect on light absorbance in that wavelength range (Thomasson et al. 2010;
Yao et al. 2012; Sandnes et al. 2006).
15
Table 1. Commonly used wavelengths for optical density measurements.
Wavelength
(nm) Advantages Disadvantages
550 Minimum absorption by
pigments Does not reflect the viability of
microalgae cells as dead cells have
absorption on these wavelengths
600
630 Decided by extensive
laboratory experimentation
680 Commonly used in lab
analysis,
related to concentration of
pigments
May not reflect the real biomass
concentration due to the change of
pigments concentration in cells
during different growth phase and
culture condition
680
682
682
750
Minimum absorption by
pigments Does not reflect the viability of
microalgae cells as dead cells have
absorption on these wavelengths
750
750
870
880
940 Decided by extensive
laboratory experimentation
1.2.4 Turbidity measurement
Turbidity measures the opaqueness or cloudiness of a liquid suspension by
measuring the amount of light that was scattered by the particles at a certain angle. The
intensity of the scattered light is dependent on the concentration and size of the particles.
There are different standards for turbidity measurement. EPA method 180.1 requires the
light source to be tungsten lamp with a color temperature between 2000 K and 3000 K, and
a photodetector with a spectral peak response at 400-600 nm placed at 90 degree angle to
the incident light (O’Dell 1993). ISO 7027 standard requires a monochromatic light source
within a wavelength range of 830-890 nm, and a photodetector place at 90 degree angle to
the incident light (ISO 1990). Measuring turbidity with a NIR light source has the
16
advantage of reduced error caused by colored particles (ISO 1990). Therefore, ISO 7027
standard becomes a better candidate for biomass concentration measurement of
microalgae.
1.2.5 Chlorophyll fluorescence measurement
Chlorophyll fluorescence measurement is an established tool to estimate
physiological state and photosynthetic rates of microalgae. Chlorophyll fluorescence is
measured by the pulse amplitude modulation (PAM) technique. The efficiency of
photosystem II can be calculated from maximum fluorescence and measured fluorescence
using the equation Φ𝑃𝑆𝐼𝐼 =(𝐹𝑚
′−𝐹)
𝐹𝑚′ , where Fm’ is the fluorescence level of illuminated
sample as induced by saturating pulses which temporarily close all PSII reaction centers
and F is the fluorescence level at the time of measurement (Nedbal et al. 2008; Marxen et
al. 2005; White et al. 2011).
1.2.6 Flow cytometry
Flow cytometry is the measurement of properties of a single cell in a flow system
by measuring scattered light and fluorescence of different wavelengths. The value of this
technique is the ability to make measurements on large numbers of single cells within a
short period of time. Fluorescent chemicals are normally used to label cell components,
such as DNA, directly; others are attached to antibodies against a wide variety of cellular
proteins. A typical flow cytometer is consisted of light source, flow chamber, optical
system, light detectors and computer. The flow chamber has a diameter of about 10 μm to
allow a single cell pass at the point of measurement. When a cell flow through a ray of
measurement light (UV, red or blue), the light scattered from the cell subsequently passes
17
through a series of long pass dichroic filter to be selected out at different wavelengths. The
intensity and duration of the scattered light then is measured by a photodetector. As a high
throughput technology, flow cytometry has been used by researchers in microalgae related
studies. Hyka et al. (2013) used flow cytometric methods to characterize the behavior of
particular microalgal species under different culture conditions, which will provide
valuable information on design and optimize production strategies. Franqueira et al. (2000)
used flow cytometry to analyze stress produced by copper or paraquat in two microalgal
species for toxicity studies. Flow cytometry was also used to detect several common
microalgal toxins that are known to be poisonous to human and wildlife (Fraga et al. 2014).
Although flow cytometry has the advantages described above, the high cost of the
instrument restrained its use in microalgae production applications.
1.3 REAL-TIME MONITORING AND CONTROL
A real-time monitoring system and strategy is desired for the study of microalgae
growth and physiological dynamics under various culture conditions as well as optimizing
resource use efficiency. For microalgae production settings, it is necessary to have accurate
and timely measurement of biomass density, physiological status of the microalgae and use
them as feedback to precisely control the growth of the culture and the quality of the
products. For instance, a real-time monitoring system can be integrated into a microalgae
production setup in order to maintain the cell density of the culture within an optimal range
to maximize the productivity of the system. Too low of a cell density will increase the cost
of harvesting, while cell density being too high can decrease the productivity by reducing
the amount of light available to the culture. Contamination of microalgae by parasites,
18
grazers and pathogenic bacteria has always been an issue for large scale microalgae
production since it can lead to the total crash of a cultivation system that results in a loss
of biomass and desired bioproducts (Carney and Lane 2014). It becomes a main constraint
of species selection for open pond production systems. The detection of microalgal
parasites are currently relying on three technics: microscopy and staining, flow cytometry
and molecular-based detection. However, none of these technics can detect the
contamination event in-situ in real-time whereas effective remedies to parasites
contamination (e.g., salvage harvest, ozone treatment, UVC treatment, abscisic acid and
sonication) need to be executed in a timely manner to minimize the damage. A real-time
sensor that is capable of early detection of microalgal parasites is desirable for large scale
production applications.
1.4 COMMERCIAL MICROALGAE SENSORS
There are sensors designed to measure microalgae concentration exist on the
market. Hydrolab (www.hydrolab.com), OSIL (www.osil.co.uk), YSI (www.ysi.com),
OTT Hydromet (www.ott.com) and EXO (www.exowater.com) all developed blue-green
algae sensors that have the same working principle. The sensors are essentially
fluorometers that measures fluorescence of the chlorophyll a in the living algal cells. Since
they are designed to measure microalgae in environmental levels (0 -- 2 x 10⁶ cell mL-1),
they can’t be used to monitor microalgae concentration in production applications where
high concentration of biomass ( > 1 x 10⁷ cell mL-1) is normally maintained. Thus,
development of an integrated system for monitoring growth parameters is important for
19
commercial viability, providing the growers with valuable information to optimize
production processes and reduce costs.
20
1.5 PROBLEM STATEMENT
Measurements of biological variables, including cell mass concentration, cell size,
cell morphology, population composition (i.e. concerns with contamination), pigments and
lipid content, are especially desirable because they are the direct indicators of the dynamics
of a microalgae culture system. Standard methods developed for measurements of these
variables are either too laborious or destructive to be employed for real-time monitoring
and control purposes (Richmond 2004; Lee et al. 2015). Spectrophotometry has been
widely used to estimate these biological variables by measuring the absorbance, turbidity
or fluorescence of the culture suspension (Chen and Vaidyanathan 2012; Collos et al. 1999;
Held 2011). As a non-destructive and rapid analytical method, spectrophotometry became
a preferable candidate for real-time monitoring and control of microalgae culture systems.
There are some commercialized sensors to monitor microalgae concentration.
However, most of them are designed to monitor microalgae concentration at an
environmental level which is much lower than the cell concentration in microalgae
production applications. Therefore, they are not practical to integrate into outdoor raceway
or photobioreactor (PBR) based algae production systems. Therefore, there is no current
optical sensor design exist in the market for microalgae production that was capable of
measuring multiple biological parameters in real time within a high cell concentration
range and without needing sample preparation (i.e. dilution, washing, filtration) for
measurements. A real-time sensor that is capable of early detection of microalgal parasites
will be desirable for large scale production applications to minimize the damage from
culture crash. Furthermore, for microalgae production settings, it is necessary to have
21
accurate and timely measurement of biomass density, physiological status of the
microalgae and use them as feedback to precisely control the growth of the culture and the
quality of the products.
1.6 RESEARCH OBJECTIVES
There has been interest from research and commercial microalgae production
settings for inexpensive, non-destructive and accurate monitoring system to provide real-
time growth and health information from microalgae directly, and being able to manage
the production system autonomously based on the feedback from the sensors. Therefore,
the overall objective of this study was to develop an in-line multi-wavelength optical sensor
that was capable of measuring dynamics of microalgae growth and health condition, and
integrate it to a given cultivation system for control purposes. The specific objectives of
the study were:
1. To design and develop a multi-wavelength, in-line optical sensor to monitor
microalgae growth and physiological condition dynamics in real-time. Evaluate and
improve the performance of the sensor in indoor PBR and outdoor raceway settings.
2. To evaluate multi-wavelength inline sensor’s capability for autonomous detection
of an abiotic and biotic disturbance in a microalgae culture system.
3. To develop sensor feedback based control strategy for culture condition adjustment
and optimization of resource inputs.
22
2. LITERATURE REVIEW
Optical properties of microalgal cells can be measured by absorbance, turbidity and
fluorescence that correlates to biomass concentration and health status of the culture. A
few studies focused on real-time monitoring and control of microalgae cultivation by
converting these measurement technics to in-line sensors, and utilize the sensors feedback
for control purposes.
Sandnes et al. (2006) developed a near infrared (NIR) light sensor for real-time
monitoring of algal biomass density in growing Nannochloropsis oceanica cultures. An
array of 880 nm wavelength light emitting diode (LED) and photodiode were used as light
source and photodetector respectively. Light transmittance was measured while microalgae
suspension flew through a transparent “biofence” production tube with 10 mm light path
length. The voltage generated from the photodiode, which was proportional to the light
intensity passed through the sample, showed good correlation with biomass with maximum
error of 8% of the total biomass. The sensor was used to monitor growth response from
microalgae to the change of irradiance during 4 days of period. It was also used to monitor
the diurnal patterns of microalgae growth under different culture light scheme in semi-
continuous production mode. Lastly, the sensor was integrated into a microalgae
production system as feedback to maintain the optimal population density of the culture by
automatic injection of fresh growth medium. The study indicated that each sensor, system
and species combination must be individually calibrated.
Briassoulis et al. (2010) developed an automated flow-through sensor for
continuous cell concentration monitoring of Nannochloropsis sp. The LEDs paired with
23
photosensors were used to measure the light transmittance of cell culture at 470 nm (blue),
518 nm (green), 630 nm (red) and 940 nm (infrared). LEDs and photodiodes pairs were
mounted on opposite sides of a tube with 32mm inner diameter where microalgae samples
flew through. A neural network (NN) was employed to estimate biomass by associating a
4 x 1 vector consisted of voltage outputs from each photosensor with the cell concentration
measured by cell count (up to 400x106 cells mL-1). Training of the NN was needed for
different species. The sensor reported has an absolute estimation error below 8x10⁶ cells
mL-1, and a maximum error at 9% within interval of 5 to 145x106 cells mL-1.
Nedbal et al. (2008) described the monitoring of chlorophyll concentration and cell
density of cyanobacteria Cyanothece sp. by a flat-cuvette photobioreactor (PBR) with
built-in fluorometer and densitometer. The optical density of the suspension was measured
at 680 nm and 735 nm with LED and photodiodes installed on opposite side of the cuvette
PBR. Blue LEDs (455 nm) and orange LEDs (627 nm) were used for excitation of
chlorophyll and phycobilins, respectively. The fluorescence emitted from chlorophyll and
phycobilins were measured by the same photodiode with an optical filter that blocks the
exciting lights. Cell counts and chlorophyll concentration were linearly proportional to
optical density (OD) 680 in the range of 0.1–1.2 and to OD 735 in the range of 0.02–0.4
which can be exceeded in microalgae production. A non-linear calibration is necessary
outside this range. They demonstrated the sensors capability of monitoring the dynamics
cyanobacteria in a 6 day batch culture in terms of optical density, OD680/OD735, specific
growth rate and effective quantum yield of photosystem II. They further use the sensor to
compare cyanobacteria diurnal growth pattern in different media.
24
Marxen et al. (2005) developed a bioreactor system for the cultivation of the
microalgae Synechocystis sp. PCC6803 under controlled physiological conditions. An
optical density sensor that measures light absorbance at 870 nm and a fluorescent sensor
was used to measure chlorophyll fluorescence by pulse amplitude modulation (PAM)
technic were placed in a column PBR for inline measurements. A turbidostatic process was
achieved by diluting the algal suspension in the reactor with the feedback from the optical
density sensor to maintain the biomass concentration at a constant level. Furthermore, a
new process strategy, physiostat, was developed aiming at maintaining a physiological
parameter constant by modulating UVB-radiation level using chlorophyll fluorescence as
a control parameter.
Shin et al. (2015) reported the development of a portable and low cost fluorescent
sensing system with a disposable microfluidic chip for on-site detection of a microalgal
sample and its concentration. The sensor system has multiple light emitting diodes (LEDs)
for excitation at 448 nm and a photodetector for measuring a fluorescent signal at 680 nm
from a microalgal sample. The concentration of a microalgal sample is determined by
measuring the fluorescent signal emitted by chlorophyll a. A small volume of microalgal
sample (<10 μL) was carried by a microfluidic chip consists of a glass slide and a PDMS
channel with a vacuum pump. The photocurrent from the photodiode was calibrated to cell
count of Chlorella vulgaris determine by a flow cytometer. A linear correlation between
the two was shown with R2 of 0.96 within cell concentration range of 0 to 1.9 x 10⁷ cell
mL-1. The sensor was also tested with microalgal samples mixed with different turbidity
water to validate its selectivity. Soil samples that consisted of sand, silt and clay with a
25
median grain size of 0.2 mm were used to achieve a turbidity level up to 157 NTU. The
results show that the fluorescent detection of microalgal concentration is not influenced by
the turbidity level of the sample solution. Improvements including signal noise reduction
and integration of a detection circuit system were needed to enable the on-site measurement
capability of the sensor.
Thomasson et al. (2010) developed an opto-electronic sensor for the purpose of in-
situ measuring optical density of microalgae culture in real-time. The sensor system pumps
aqueous algae through the sensor body and measures absorbance in two narrow wavebands
in the red and near-infrared (NIR) regions. No further detail of the design of the sensor was
revealed due to patent application reasons. The sensor was calibrated to a UV/VIS/NIR
spectrophotometer with samples of Nannochloropsis oculata ranging from OD 0.05 to OD
0.5. A good linear correlation was shown with R2 of 0.98. However, the linear correlation
did not hold for measurements taken place in field test. Part of the cause was attributed to
the increase of noise level in the detector signals. It was later reported that it was the
temperature dependency of the sensor unit caused inaccurate measurement of algal biomass
concentration (Yao et al. 2012).
Based on the literature reviewed and summarized above, it is determined that there
is no current optical sensor design for real-time microalgae growth monitoring was capable
of monitoring multiple biological parameters with high accuracy in a high cell
concentration range, without sample preparation (i.e. dilution, washing, filtration) prior to
measurements, and has the flexibility to be integrated to various forms of microalgae
production systems.
26
Several researchers applied colorimetric methods to estimate biomass
concentration, chlorophyll and lipid content of microalgae. The color variation in
microalgae is mainly due to the change in the biochemical composition of the cells. Based
on trichromatic theory, color can be decomposed into the primary colors and the intensity
of an individual color can be represented by the number of pixels of brightness, in a digital
image. Thus, the brightness values of the primary colors can be correlated to biomass
concentration and biochemical contents of the microalgae.
Su et al. (2008) established a method of rapid determination of chlorophyll a and
lipid contents of marine algae Nannochloropsis oculata by evaluating the brightness of the
three primary colors (red, green, blue). A digital camera was used to capture image of
microalgal samples contained in a quartz cuvette that has been diluted to a fixed biomass
concentration (0.5 g L-1). The image was decomposed and the brightness of each primary
color was transformed to a 256 level scale. The brightness values of the three primary
colors are modeled as two linear correlation functions (RGB model) for microalgal
chlorophyll a and lipid contents, respectively with a squared correlation coefficient (R2) of
0.99. The method was further applied to monitor chlorophyll a and lipid content of
microalgae in a real culture system. The time-course chlorophyll a and lipid content change
was observed in a batch culture that lasted 11 days. The manual sampling and sample
preparation procedures were required for this detection method. Further development of
the sensor is needed for use in on-line microalgae cultivation monitoring application.
López et al. (2006) developed methods to characterize Haematococcus pluvialis
culture on both macroscopic and microscopic scales. The CIE-LAB system, the most
27
popular numerical color-space system, was used to extract color features from images taken
by a CM-3500d Minolta spectrophotometer–colorimeter, then correlate color features to
biomass concentration, and the chlorophyll, carotenoid and astaxanthin content of the
biomass. The camera was able to estimate biomass concentration up to 2.0 g L-1 with a
squared correlation coefficient (R2) of 0.93. Image-Pro Plus 4.5.1 image analysis software
was used to identify cell population, average cell size and population homogeneity from
images taken by a CMOS camera (Evolution LC Color from Media Cybernetics) mounted
on the a microscope. The sensors were further applied to monitor biomass concentration,
pigment content and cell density of H. pluvialis in an airlift tubular PBR and a bubble
column PBR for 16 days. The results were used to quantify the influence of design of the
reactors on biomass productivity. All the measurement were taken placed either on a
microscope or custom made cuvette which was not desirable for on-line monitoring
application.
Córdoba-Matson et al. (2009) designed and constructed an inexpensive digital
imaging system for counting microalgal cells. The images of Isochrysis galbana culture in
an Erlenmeyer flask illuminated by an incandescent light bulb was taken by a CCD camera.
All components were fixed in an opaque black enclosure to avoid any interference for
ambient light. A program written in MATLAB converted RGB color images to gray scale
which was further used to correlate to cell numbers of microalgae. It was concluded that I.
galbana cell numbers could be measured with accuracies of less than 10% over the range
of culture densities of 1.52×10⁶ to 8.1×10⁶ cells mL-1. It was also found that precision
values varied depending on cell density concentration. At high cell density concentration,
28
the precision was low (typically <4%), but at low cell concentration precision reached 20%.
The system need to be re-calibrated to specific species of microalgae since the color of
microalgae may vary depending on species.
Benavides et al. (2015) demonstrated the feasibility of a sensor based on an RGB
color generator and a light sensor to detect the biomass concentration of microalgae
Dunaliella tertiolecta. The sensor consisted of a sensor chamber, a data acquisition board
and a computer for data processing. Inside the sensor chamber, a RGB sensor and a mirror
were placed on opposite sides of a flow chamber that contains microalgae sample. A beam
of light emitted from the RGB sensor was reflected back to the sensor by the mirror. The
luminance of the reflected light was calculated as a weighted sum of each color component
following the international standard recommendation ITU-R BT.709. The light absorbance
was subsequently calculated using Beer’s law. The sensor was calibrated against the
biomass concentration of microalgae measured by a bench-top UV spectrophotometer, a
good linear correlation was obtained with R2 of 0.99. The performance of the sensor was
also compared to a commercial NIR absorption probe in a batch culture of D. tertiolecta.
The sensor was only able to accurately estimate biomass concentration up to 0.7 g L-1.
Meireles et al. (2002) demonstrated an on-line optical density measurement system
with flow injection analysis (FIA) device integrated spectrophotometer to monitor biomass
concentration of Pavlova lutheri. The FIA device enabled automated dilution of microalgae
samples to maintain the biomass concentration within the linear zone. The FIA also
featured a washing mechanism that cleans the flow cell each time before and after a
measurement was made. Two FIA loops with different dilution factors (1.88 and 4.56) were
29
used to measure optical density of microalgae in different concentration range. The sensor
system was tested with batch and semi-continuous batch culture of microalgae, and the
results showed good agreement with that from off-line measurements.
The parasites associated with algae has become a great interest and potential
economic impact due to their devastating effect on commercial scale monoculture.
Therefore, detection of microalgal parasites and solutions to parasites contamination
became important to minimize the economic impact on microalgae production from
contamination.
Gerphagnon et al. (2013) proposed a double staining method to assess chytrid
infection rates of cyanobacteria using Calcofluor white and SYTOX green, a nucleic acid
stain. The authors used a combination of UV and blue light to show chytrid zoospores
(green) inside sporangia (blue). However, for some algae Calcofluor white is problematic
when cellulose is the primary cell wall component, such as for Haematococcus pluvialis,
because cellulose can be stained as well as chitin and may obscure detection (Damiani et
al. 2006). However, Calcofluor white cannot stain fungi lacking chitin. As an alternative,
staining chytrid sporangia with nile red, even at very young stages, can be used as an early
detection method for algae (Gutman, Zarka, and Boussiba 2009).
Day et al. (2012) employed a Bench-top VS IV FlowCAM cytometer to detect
grazers (size range 20–80 μm in length) in the presence of microalgae Nannochloropsis
oculata. Detection limits were <10 cells mL-1 for both model grazers, Euplotes
vannus (80 x 45 μm), and an unidentified holotrichous ciliate (∼18 x 8 μm) respectively.
Furthermore, the system can distinguish the presence of ciliates in N. oculata cultures with
30
biotechnologically relevant cell densities; i.e. >1.4 × 10⁸ cells mL-1 (>0.5 g L−1 dry
weight).
31
3. PRESENT STUDY
3.1 OVERALL SUMMARY
Appendix A, B and C of this dissertation present the manuscripts of the methods,
results, and conclusions of objective one, two and three respectively. The following is a
summary of the primary results of the research.
In Appendix A, the design of a multi-wavelength based optical density sensor unit
to monitor microalgae growth in real time was described. The system consisted of five
main components including (1) laser diode modules as light sources (2) photodiodes as
detectors, (3) driver circuit, (4) flow cell and (5) sensor housing temperature controller.
The sensor unit was designed to be integrated into any microalgae culture system for real
time optical density measurements and algae growth monitoring applications. An indoor
photobioreactor (PBR) and an outdoor open pond raceway were used to evaluate the
performance of the optical sensor. Results showed that the optical sensor was capable of
estimating biomass concentration accurately and was able to monitor the physiological
status of the microalgae culture including the changes in growth rate and the change of
chlorophyll content can serve as indicators of the health of the culture. During the outdoor
open pond raceway test, a temperature regulation unit was integrated to maintain a constant
temperature of the sensor housing. This also ensured a constant laser power output. The
sensor was able to record the growth of microalgae in real-time under the dynamic change
of lighting condition and temperature in outdoor environment. The growth rate of
microalgae calculated from the real-time data was highly correlated to the photosynthetic
active radiation (PAR) level. The sensor was able to monitor cell concentration as high as
32
1.05 g L-1 (1.51x10⁸ cells mL-1) during the culture growth without any sample preparation
for the measurements.
The calibration of the optical sensor to environmental disturbances was undertaken
in Appendix B. The capability of the optical sensor was evaluated on the application of
early detection of microalgae culture failure associated with the introduction of the predator
V. chlorellavorus to an experimental PBR. Also, the sensitivity of the sensor to the presence
of dust in the PBR was investigated. In the dust test, field test dust with mean diameter of
25.3 μm, standard deviation of 11.8 μm was used to resemble the size distribution of dust
that falls into the outdoor raceways in Arizona. The optical density didn’t increase
proportionally to the increase of dry mass, considering the amount of test dust added to the
PBR which resulted a 59.7% increase of the total dry mass. Further analysis showed that
the introduction of dust can be clearly indicated by the first derivative of OD780. V.
Chlorellavorus co-cultured with DOE 1412 was used to inoculate a healthy DOE 1412
culture for the bacteria contamination test that was replicated three times. Cell viability
began to decrease two days prior to the rapid decline or ‘crash’ of the culture, the same
time point at which a steep decrease in the OD685/OD780 was also observed. A similar
growth pattern was observed for each of the replicated experiments. Therefore,
OD685/OD780 was found to serve as an indicatory parameter for early detection of the crash
of C. sorokiniana from V. chlorellavorus infection.
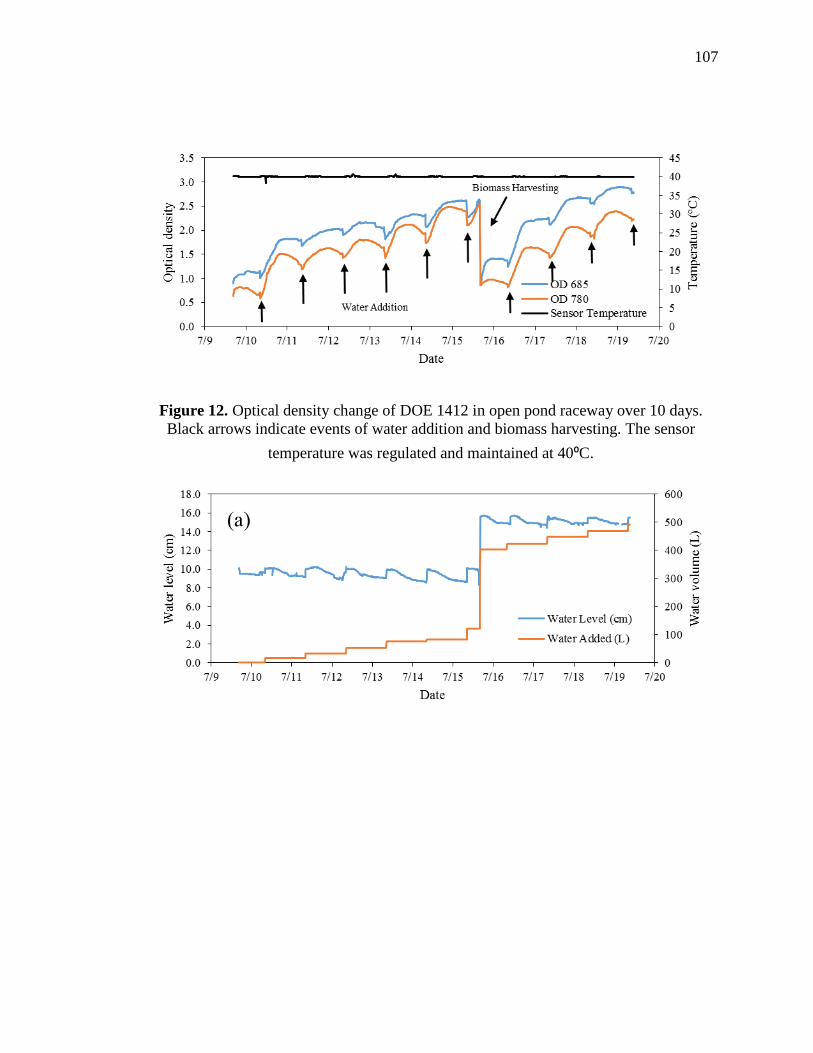
Finally, the optical sensor was integrated into an open pond raceway for the
application of autonomous monitoring and control of microalgae production systems. The
pH, electrical conductivity (EC), temperature (T), dissolved oxygen (DO), water depth
33
(WD), optical density of the culture (OD) and photosynthetic active radiation (PAR) were
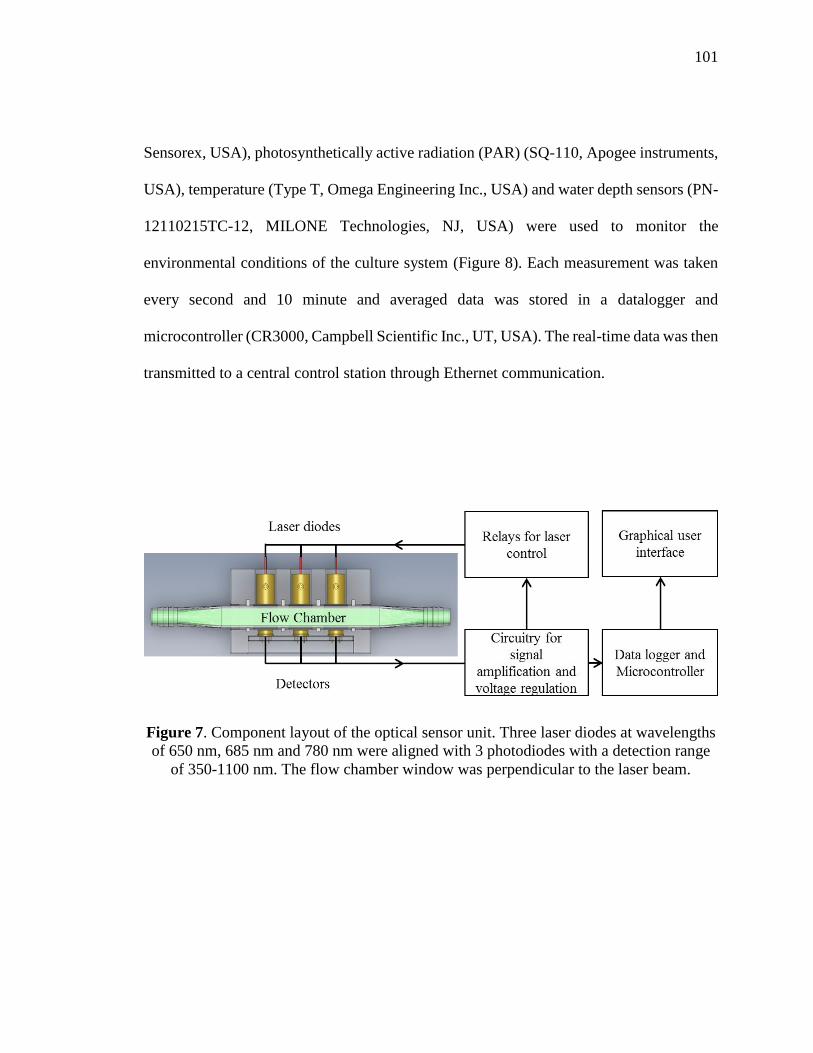
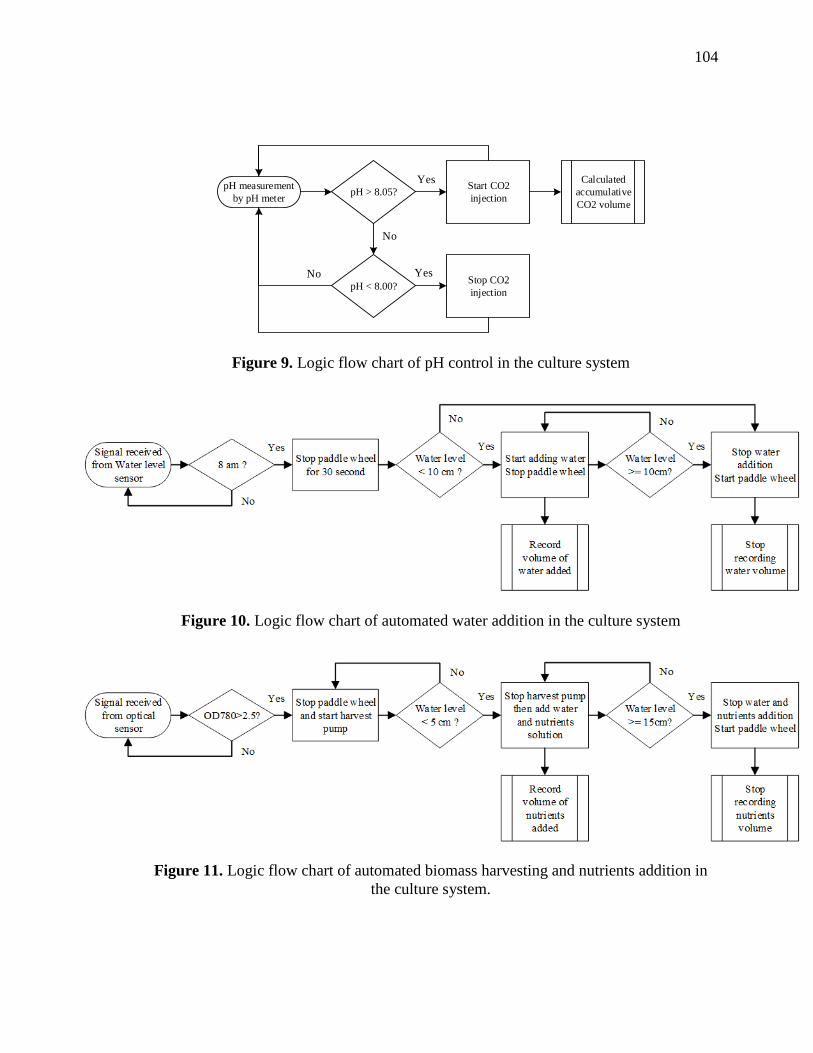
monitored and stored in a data acquisition system. The pH and water level of the system
was control by the microcontroller based on the feedback from pH and water depth sensor
respectively. The automation of harvesting was based on the optical density of the culture
measured by the inline optical sensor. The water and nutrients addition following the
harvest was automated as well. The communication between the data logger and the control
station was established through a local network. Lastly, a graphical user interface (GUI)
was created on the control station for real-time monitoring of the microalgae growth,
resource input and environmental conditions of the culture system. The designed and
developed real-time monitoring and feed-back based control system was capable of
controlling the desired set points and culture conditions established by the operator and
provide information on resource use in the microalgae culture in real-time.
3.2 OVERALL CONCLUSIONS AND RECOMMENDATIONS
A multi-wavelength based optical density sensor was successfully designed,
developed, and evaluated to monitor microalgae growth in real time. Algae biomass
concentration was accurately estimated with optical density measurements at 650, 685 and
780 nm wavelengths used by the sensor. The sensor unit was able to monitor cell
concentration as high as 1.05 g L-1 (1.51x10⁸ cells mL-1) during the culture growth without
any sample preparation for the measurements. Growth rates and ratios calculated from
optical density at each wavelength were good indications for monitoring of microalgae
growth transitions and for detection of disturbances to the culture system (i.e change of
light intensity, water addition, rain, and harvesting). The sensor showed low sensitivity to
34
the amount of dust that’s 60% of the Ash Free Dry Weight (AFDW) of microalgae biomass.
However, the sensor was able to clearly indicate the event of dust introduction to the culture
system. The optical sensor for monitoring growth dynamics of microalgae in real-time
described in this dissertation was capable of early detection of culture crash due to V.
chlorellavorus infection while being insensitive to the dust content in a culture system. The
inline optical sensor was integrated into an open pond raceway for automation of the
biomass production operation. The harvesting, water and nutrients addition were
completely automated based on the feedback from the optical sensor along with other
sensors measuring key variables from the culture growing environment.
The sensor unit was operated continuously for 18 days without any visible
microalgae biofilm deposit observed on the flow chamber of the sensor unit. In this design,
the only sensor hardware part that had contact with culture medium was the flow chamber
which can be easily replaced. For industrial microalgae production, the application of ultra-
hydrophobic material (Hydrophobic glass coating, UltraTech International, Inc., USA) on
the surface of flow chamber can further extend the maintenance interval. A temperature
control device for the sensor is necessary, especially for outdoor applications where the air
temperature can vary significantly, since the output power of laser diodes were temperature
dependent. The light path was 5 mm in the current sensor design. Therefore, the cell
concentration measurement range can be further improved by shortening the light path
length of the flow chamber. Other laser modules and wavelengths of interest can be added
to expand the number of biological variables and culture growth and health conditions
measured by the sensor. With proper calibration, installation and operation, the optical
35
sensor described in this study can be integrated into microalgae culture systems for
monitoring and control purposes at a relative low cost to ultimately help optimize product
quality and quantity, and resource use efficiency.
36
4. REFERENCES
Benavides, Micaela, Johan Mailier, Anne-Lise Hantson, Gerardo Muñoz, Alejandro
Vargas, Jan Van Impe, and Alain Vande Wouwer. 2015. “Design and Test of a Low-
Cost RGB Sensor for Online Measurement of Microalgae Concentration within a
Photo-Bioreactor.” Sensors (Basel, Switzerland) 15 (3). Multidisciplinary Digital
Publishing Institute: 4766–4780.
Briassoulis, D, P Panagakis, M Chionidis, D Tzenos, A Lalos, C Tsinos, K Berberidis,
and A Jacobsen. 2010. “An Experimental Helical-Tubular Photobioreactor for
Continuous Production of Nannochloropsis Sp.” Bioresource Technology 101 (17):
6768–6777.
Carney, Laura T, and Todd W Lane. 2014. “Parasites in Algae Mass Culture.” Frontiers
in Microbiology 5 (January): 278.
Carvalho, Ana P, Luís a Meireles, and F Xavier Malcata. 2006. “Microalgal Reactors: A
Review of Enclosed System Designs and Performances.” Biotechnology Progress 22
(6): 1490–1506.
Chaumont, Daniel. 1993. “Biotechnology of Algal Biomass Production: A Review of
Systems for Outdoor Mass Culture.” Journal of Applied Phycology 5 (6): 593–604.
Chen, Yimin, and Seetharaman Vaidyanathan. 2012. “A Simple, Reproducible and
Sensitive Spectrophotometric Method to Estimate Microalgal Lipids.” Analytica
Chimica Acta 724 (0): 67–72.
Chisti, Yusuf. 2007. “Biodiesel from Microalgae.” Biotechnology Advances 25 (3).
Elsevier Inc.: 294–306.
Collos, Y., F. Mornet, A. Sciandra, N. Waser, A. Larson, and P.J. Harrison. 1999. “An
Optical Method for the Rapid Measurement of Micromolar Concentrations of
Nitrate in Marine Phytoplankton Cultures.” Journal of Applied Phycology 11 (2).
Kluwer Academic Publishers: 179–184.
Córdoba-Matson, Miguel V., Joaquín Gutiérrez, and Miguel Ángel Porta-Gándara. 2009.
“Evaluation of Isochrysis Galbana (clone T-ISO) Cell Numbers by Digital Image
Analysis of Color Intensity.” Journal of Applied Phycology 22 (4): 427–434.
Damiani, María Cecilia, Patricia I. Leonardi, Olga I. Pieroni, and Eduardo J. Cáceres.
2006. “Ultrastructure of the Cyst Wall of Haematococcus Pluvialis (Chlorophyceae):
Wall Development and Behaviour during Cyst Germination.” Phycologia 45 (6).
International Phycological Society: 616–623.
37
Danquah, Michael K., Li Ang, Nyomi Uduman, Navid Moheimani, and Gareth M. Forde.
2009. “Dewatering of Microalgal Culture for Biodiesel Production: Exploring
Polymer Flocculation and Tangential Flow Filtration.” Journal of Chemical
Technology & Biotechnology 84 (7): 1078–1083.
Das, Probir, Wang Lei, Siti Sarah Aziz, and Jeffrey Philip Obbard. 2011. “Enhanced
Algae Growth in Both Phototrophic and Mixotrophic Culture under Blue Light.”
Bioresource Technology 102 (4). Elsevier Ltd: 3883–3887.
Day, John G, Naomi J Thomas, Undine E M Achilles-Day, and Raymond J G Leakey.
2012. “Early Detection of Protozoan Grazers in Algal Biofuel Cultures.”
Bioresource Technology 114 (June): 715–719.
Dixon, Robert K. 2012. “Algae Based Biofuels.” Mitigation and Adaptation Strategies
for Global Change 18 (1): 1–4.
Fraga, María, Natalia Vilariño, M Carmen Louzao, Laura P Rodríguez, Amparo Alfonso,
Katrina Campbell, Christopher T Elliott, et al. 2014. “Multi-Detection Method for
Five Common Microalgal Toxins Based on the Use of Microspheres Coupled to a
Flow-Cytometry System.” Analytica Chimica Acta 850 (November): 57–64.
Franqueira, Dolores, Miguel Orosa, Enrique Torres, Concepción Herrero, and Angeles
Cid. 2000. “Potential Use of Flow Cytometry in Toxicity Studies with Microalgae.”
Science of The Total Environment 247 (2-3): 119–126.
Gerphagnon, Mélanie, Delphine Latour, Jonathan Colombet, and Télesphore Sime-
Ngando. 2013. “A Double Staining Method Using SYTOX Green and Calcofluor
White for Studying Fungal Parasites of Phytoplankton.” Applied and Environmental
Microbiology 79 (13): 3943–3951.
Gutman, Jenia, Aliza Zarka, and Sammy Boussiba. 2009. “The Host-Range of
Paraphysoderma Sedebokerensis , a Chytrid That Infects Haematococcus Pluvialis.”
European Journal of Phycology 44 (4). Taylor & Francis Group: 509–514.
Harun, Razif, Manjinder Singh, Gareth M. Forde, and Michael K. Danquah. 2010.
“Bioprocess Engineering of Microalgae to Produce a Variety of Consumer
Products.” Renewable and Sustainable Energy Reviews 14 (3): 1037–1047.
Held, Paul. 2011. “Monitoring of Algal Growth Using Their Intrinsic Properties.”
http://www.biotek.com/resources/articles/monitoring-of-algal-growth-using-
intrinsic-properties.html.
Hernández, D, M Solana, B Riaño, M C García-González, and A Bertucco. 2014.
“Biofuels from Microalgae: Lipid Extraction and Methane Production from the
38
Residual Biomass in a Biorefinery Approach.” Bioresource Technology 170
(October): 370–378.
Huang, Jianke, Yuanguang Li, Minxi Wan, Yi Yan, Fei Feng, Xiaoxing Qu, Jun Wang, et
al. 2014. “Novel Flat-Plate Photobioreactors for Microalgae Cultivation with Special
Mixers to Promote Mixing along the Light Gradient.” Bioresource Technology 159
(May): 8–16.
Hyka, P, S Lickova, P Přibyl, K Melzoch, and K Kovar. 2013. “Flow Cytometry for the
Development of Biotechnological Processes with Microalgae.” Biotechnology
Advances 31 (1): 2–16.
ISO. 1990. “International Standard ISO 7027 – Water Quality – Determination of
Turbidity.” In International Organization for Standards (ISO), Second edi.
Jones, S B, Y Zhu, D B Anderson, R T Hallen, D C Elliott, A J Schmidt, K O Albrecht,
and T R Hart. 2014. “Process Design and Economics for the Conversion of Algal
Biomass to Hydrocarbons: Whole Algae Hydrothermal Liquefaction and
Upgrading.” Pacific Northwest National Laboratory. Vol. PNNL-23227. Richland,
WA.
Knuckey, Richard M., Malcolm R. Brown, René Robert, and Dion M.F. Frampton. 2006.
“Production of Microalgal Concentrates by Flocculation and Their Assessment as
Aquaculture Feeds.” Aquacultural Engineering 35 (3): 300–313.
Lee, Choul-Gyun. 1999. “Calculation of Light Penetration Depth in Photobioreactors.”
Biotechnology and Bioprocess Engineering 4 (1): 78–81.
Lee, Seog June, Byung-Dae Yoon, and Hee-Mock Oh. 2015. “Rapid Method for the
Determination of Lipid from the Green Alga Botryococcus Braunii.” Biotechnology
Techniques 12 (7). Kluwer Academic Publishers: 553–556.
Lee, Yuan-kun. 2001. “Microalgal Mass Culture Systems and Methods : Their Limitation
and Potential.” Journal of Applied Phycology 13: 307–315.
López, M C García-Malea, E Del Río Sánchez, J L Casas López, F G Acién Fernández, J
M Fernández Sevilla, J Rivas, M G Guerrero, and E Molina Grima. 2006.
“Comparative Analysis of the Outdoor Culture of Haematococcus Pluvialis in
Tubular and Bubble Column Photobioreactors.” Journal of Biotechnology 123 (3):
329–342.
Marxen, Kai, KlausHeinrich Vanselow, Sebastian Lippemeier, Ralf Hintze, Andreas
Ruser, and Ulf-Peter Hansen. 2005. “A Photobioreactor System for Computer
39
Controlled Cultivation of Microalgae.” Journal of Applied Phycology 17 (6).
Springer Netherlands: 535–549.
Mata, Teresa M., António a. Martins, and Nidia. S. Caetano. 2010. “Microalgae for
Biodiesel Production and Other Applications: A Review.” Renewable and
Sustainable Energy Reviews 14 (1): 217–232.
Meireles, Luís A, José L Azevedo, João P Cunha, and F Xavier Malcata. 2002. “On-Line
Determination of Biomass in a Microalga Bioreactor Using a Novel Computerized
Flow Injection Analysis System.” Biotechnology Progress 18 (6). American
Chemical Society: 1387–1391.
Nedbal, Ladislav, Martin Trtílek, Jan Cervený, Ondrej Komárek, and Himadri B Pakrasi.
2008. “A Photobioreactor System for Precision Cultivation of Photoautotrophic
Microorganisms and for High-Content Analysis of Suspension Dynamics.”
Biotechnology and Bioengineering 100 (5): 902–910.
O’Dell, James W. 1993. “Method 180.1 Determination of Turbidity by Nephelometry.”
Pirouzi, Ali, Mohsen Nosrati, Seyed Abbas Shojaosadati, and Saeed Shakhesi. 2014.
“Improvement of Mixing Time, Mass Transfer, and Power Consumption in an
External Loop Airlift Photobioreactor for Microalgae Cultures.” Biochemical
Engineering Journal 87 (June): 25–32.
Rego, D, L M Redondo, V Geraldes, L Costa, J Navalho, and M T Pereira. 2015.
“Control of Predators in Industrial Scale Microalgae Cultures with Pulsed Electric
Fields.” Bioelectrochemistry (Amsterdam, Netherlands) 103 (June): 60–64.
Richardson, James W., Myriah D. Johnson, and Joe L. Outlaw. 2012. “Economic
Comparison of Open Pond Raceways to Photo Bio-Reactors for Profitable
Production of Algae for Transportation Fuels in the Southwest.” Algal Research 1
(1): 93–100.
Richmond, Amos. 2004. “Basic Culturing Techniques.” In Handbook of Microalgal
Culture: Biotechnology and Applied Phycology, edited by Amos Richmond, 1st
Editio:43–45. UK: Blackwell Publishing Ltd.
Rodolfi, Liliana, Graziella Chini Zittelli, Niccolò Bassi, Giulia Padovani, Natascia
Biondi, Gimena Bonini, and Mario R Tredici. 2009. “Microalgae for Oil: Strain
Selection, Induction of Lipid Synthesis and Outdoor Mass Cultivation in a Low-Cost
Photobioreactor.” Biotechnology and Bioengineering 102 (1): 100–112.
40
Saeid, Agnieszka, and Katarzyna Chojnacka. 2015. “Toward Production of Microalgae in
Photobioreactors under Temperate Climate.” Chemical Engineering Research and
Design 93 (January): 377–391.
Sandnes, J M, T Ringstad, D Wenner, P H Heyerdahl, T Källqvist, and H R Gislerød.
2006. “Real-Time Monitoring and Automatic Density Control of Large-Scale
Microalgal Cultures Using near Infrared (NIR) Optical Density Sensors.” Journal of
Biotechnology 122 (2): 209–215.
Shin, Young-Ho, Jonathan Z. Barnett, Edward Song, M. Teresa Gutierrez-Wing, Kelly A.
Rusch, and Jin-Woo Choi. 2015. “A Portable Fluorescent Sensor for on-Site
Detection of Microalgae.” Microelectronic Engineering 144 (August): 6–11.
Solovchenko, Alexei, Inna Khozin-Goldberg, Lee Recht, and Sammy Boussiba. 2011.
“Stress-Induced Changes in Optical Properties, Pigment and Fatty Acid Content of
Nannochloropsis Sp.: Implications for Non-Destructive Assay of Total Fatty Acids.”
Marine Biotechnology 13 (3). Springer-Verlag: 527–535.
Soo, Rochelle M., Ben J. Woodcroft, Donovan H. Parks, Gene W. Tyson, and Philip
Hugenholtz. 2015. “Back from the Dead; the Curious Tale of the Predatory
Cyanobacterium Vampirovibrio Chlorellavorus.” PeerJ 3 (May). PeerJ Inc.: e968.
Spolaore, Pauline, Claire Joannis-Cassan, Elie Duran, and Arsène Isambert. 2006.
“Commercial Applications of Microalgae.” Journal of Bioscience and
Bioengineering 101 (2): 87–96.
Su, Chia-Hung, Chun-Chong Fu, Yet-Chung Chang, Giridhar R Nair, Jun-Liang Ye, I -
Ming Chu, and Wen-Teng Wu. 2008. “Simultaneous Estimation of Chlorophyll a
and Lipid Contents in Microalgae by Three-Color Analysis.” Biotechnology and
Bioengineering 99 (4). Wiley Subscription Services, Inc., A Wiley Company: 1034–
1039.
Thomasson, Alex J., Y. Yao, Y. Ge, and R. Sui. 2010. “Toward On-Line Measurement of
Algal Properties.” American Society of Agricultural and Biological Engineers 6:
4406–4413.
Velicer, Gregory J, and Helena Mendes-Soares. 2009. “Bacterial Predators.” Current
Biology : CB 19 (2): R55–56.
Waller, Peter, Randy Ryan, Murat Kacira, and Peiwen Li. 2012. “The Algae Raceway
Integrated Design for Optimal Temperature Management.” Biomass and Bioenergy
46 (November): 702–709.
41
White, S, A Anandraj, and F Bux. 2011. “PAM Fluorometry as a Tool to Assess
Microalgal Nutrient Stress and Monitor Cellular Neutral Lipids.” Bioresource
Technology 102 (2): 1675–1682.
Yao, Yao, J. Alex Thomasson, Yufeng Ge, and Ruixiu Sui. 2012. “Improvement of an
Optical Density Sensor for Algae Pond Monitoring and Process Control.” American
Society of Agricultural and Biological Engineers.
Zhu, C J, and Y K Lee. 1997. “Determination of Biomass Dry Weight of Marine
Microalgae.” Journal of Applied Phycology 9 (2). Kluwer Academic Publishers:
189–194.
42
APPENDIX A - MULTI-WAVELENGTH BASED OPTICAL DENSITY
SENSOR FOR AUTONOMOUS MONITORING OF MICROALGAE
F. Jia, M. Kacira, K. L. Ogden
In submission: Sensors
ABSTRACT
A multi-wavelength based optical density sensor unit was designed, developed, and
evaluated to monitor microalgae growth in real time. The system consisted of five main
components including (1) laser diode modules as light sources (2) photodiodes as detectors,
(3) driver circuit, (4) flow cell and (5) sensor housing temperature controller. The sensor
unit was designed to be integrated into any microalgae culture system for both real time
and non-real time optical density measurements and algae growth monitoring applications.
It was shown that the sensor unit was capable of monitoring the dynamics and
physiological changes of the microalgae culture in real-time. Algae biomass concentration
was accurately estimated with optical density measurements at 650, 685 and 780 nm
wavelengths used by the sensor unit. The sensor unit was able to monitor cell concentration
as high as 1.05 g L-1 (1.51x10⁸ cells mL-1) during the culture growth without any sample
preparation for the measurements. Since high cell concentrations do not need to be diluted
using the sensor unit, the system has the potential to be used in industrial microalgae
cultivation systems for real time monitoring and control applications that can lead to
improved resource use efficiency.
KEYWORDS
Optical density; multi-wavelength; microalgae; real-time monitoring and control
43
1. INTRODUCTION
Microalgae have been successfully used as feedstock for the production of
pharmaceutical products, nutritional supplements and chemicals [1-4]. Certain species of
microalgae are candidates for the production of biofuels due to their high productivity and
high oil content [5-7]. Producing sufficient amounts of biomass with controlled quality is
the premise of production of microalgae derived products. Optimizing resource inputs and
maintaining high productivity are the key components to control the quantity and cost of
the algae production.
Real-time monitoring and control provides the platform to acquire the
environmental and physiological dynamics of a microalgae culture system. For large scale
microalgae production systems, effective decision making and overall production system
management in terms of optimal resource use, harvesting and culture condition
optimization (media composition, lighting, temperature, pH, dissolved oxygen levels etc.)
is crucial in order to achieve maximum profit and to prevent or reduce economic losses in
case of contamination [8].
Measurements of biological variables, including cell mass concentration, cell size,
cell morphology, population composition (i.e. concerns with contamination), pigments and
lipid content, are especially desirable because they are the direct indicators of the dynamics
of a microalgae culture system. Standard methods developed for measurements of these
variables are either too laborious or destructive to be employed for real-time monitoring
and control purposes [9, 10]. Spectrophotometry has been widely used to estimate these
biological variables by measuring the absorbance, turbidity or fluorescence of the culture
44
suspension [11-13]. As a non-destructive and rapid analytical method, spectrophotometry
became a preferable candidate for real-time monitoring and control of microalgae culture
systems.
There are some commercialized sensors to monitor microalgae concentration [14-
17]. However, most of them are designed to monitor microalgae concentration at an
environmental level which is much lower than the cell concentration in microalgae
production applications. Furthermore, these sensors are too expensive for low added value
product applications. Therefore, they are not practical to integrate into outdoor raceway or
photobioreactor based algae production systems.
There have been only few studies on development and evaluation of self-
constructed optical sensors for microalgae monitoring and control applications [18-25]. For
instance, Sandes et al. (2006) [23] focused on measuring the intensity of light transmitted
through a transparent production tube with a 10 mm light path length containing a
microalgae suspension using a LED (880 nm) and photodiode pair mounted on the opposite
side of the tube. The sensor was able to estimate the cell concentration of Nannochloropsis
oceanica and correlated both with dry weight (up to 2.0 g L-1) and cell count. Briassoulis
et al. (2010) [18] developed an automated flow-through density sensor and harvesting
system for Nannochloropsis sp. The LEDs paired with photosensors were used to measure
the light transmittance of cell culture at 470, 518, 630 and 940 nm. A neural network was
employed to estimate biomass concentration by associating the voltage readings from each
photosensor with the cell concentration measured by cell count. The sensor reported has
an absolute estimation error below 8x10⁶ cells mL-1, and a maximum error at 9% within
45
interval of 5 to 145x106 cells mL-1. Nedbal et al. (2008) [22] described the monitoring of
chlorophyll concentration and cell density of a cyanobacterial suspension by a flat-cuvette
photobioreactor with a built-in fluorometer and densitometer. Blue LEDs (455 nm) and
orange LEDs (627 nm) were used for excitation of blue absorption and phycobilins,
respectively. The optical density of the suspension was measured at 680 nm and 735 nm.
Cell count and chlorophyll concentration were linearly proportional to optical density (OD)
680 in the range 0.1–1.2 and to OD 735 in the range 0.02–0.4; these values of OD or cell
density are typically exceeded in microalgae production systems. Furthermore, the sensor
unit was designed for a specific PBR, re-configuration and re-calibration of the sensor will
be necessary if it were to be integrated into other culture systems. Marxen et al. (2005) [20]
developed a bioreactor system for the cultivation of Synechocystis sp. PCC6803. Dry mass
of microalgae was estimated by the measurement of optical density of the suspension at
870 nm. Chlorophyll concentration was determined by the pulse amplitude modulation
(PAM) technique. Yao et al. (2012) [25] developed and tested an optical density based
sensor using a LED and photodiode based unit at two wavelengths (Red and NIR) to
monitor algae growth. The sensor was able to estimate biomass concentration ranging from
0.05 to 0.50 OD in indoor conditions. The study reported temperature dependency of the
sensor unit that caused inaccurate measurement of algal biomass concentration when tested
in outdoor conditions.
To our knowledge, there is no current optical sensor design that exists in the market
for measuring multiple biological parameters in real time both in an indoor PBR and
outdoor raceway system within a high cell concentration range and without needing sample
46
preparation (i.e. dilution, washing, filtration) prior to measurements. Therefore, we
describe here the design, development and evaluation of a relatively low cost multi-
wavelength laser diode-photodiode based sensor applicable for use both in an indoor
photobioreactor system and an outdoor raceway system to monitor optical density and
growth of microalgae in real time.
2. MATERIAL AND METHODS
2.1. Optical density measurement sensor
The growth dynamics of the microalgae culture was measured using the real-time
optical density sensor (Fig. 1.) developed in this study. Light absorbance of microalgae
suspensions at multiple wavelengths correlate to different characters of microalgae cells.
The 650 (650nm-10mW, US-Lasers Inc., USA), 685 (HL6750MG, Oclaro Inc., USA) and
780 (780nm-10mW, US-Lasers Inc., USA) laser diodes were used in the developed sensor
unit for this study. These three wavelengths have been commonly used to estimate the cell
concentration of microalgae suspension [11-13]. Light absorbance at 780 nm estimates the
turbidity of the suspension since the color of microalgae has no effect on the absorbance,
whereas, light absorbance at 650 and 685 nm correlates to both intensity of the color (i.e.
chlorophyll content) and cell concentration.
47
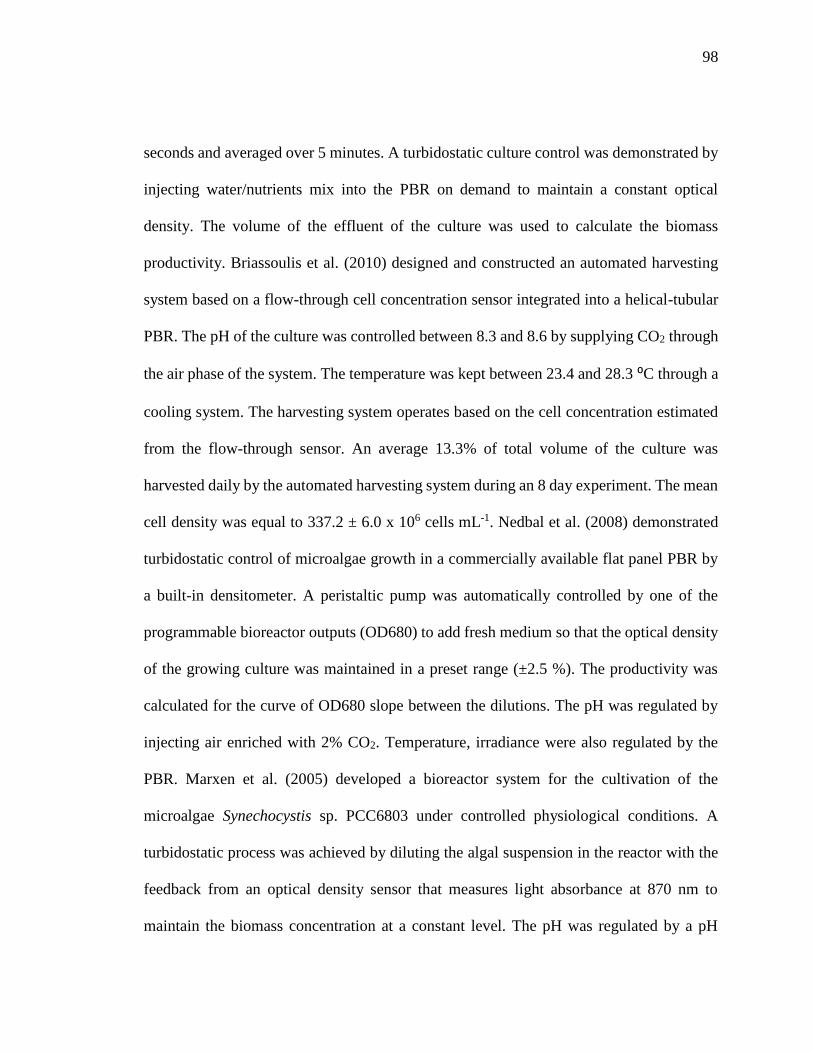
Figure 1. Component layout of the optical sensor unit. Three laser diodes at
wavelengths of 650 nm, 685 nm and 780 nm were aligned with 3 photodiodes with a
detection range of 350-1100 nm. The flow chamber window was perpendicular to the
laser beam.
The optical sensor unit consisted of laser diode modules as light sources, a
photodiode as a detector and custom-made fixtures to house them. Laser diode modules
consisted of laser diodes, driver circuit (iC-WK BMST WK2D, iC Haus LLC., USA) and
brass housing with adjustable optical lenses (10.4mm Module Housing Kit, US-Lasers Inc.,
USA). An optical filter (86734, Edmund Optics Inc., USA) was placed in front of the 685
nm laser diode to allow only the light with wavelength from 680 to 690 nm to pass through.
The system design enabled adjustment of the output power of the modules by a
potentiometer connected to a 5 VDC power source. The photodiodes (FDS100, Thorlabs
Inc., USA) with a detection range of 350-1100 nm were connected to a zero-bias
amplification circuit. Three pairs of laser diode modules and photodiodes were placed in a
linear pattern in the fixture. Each pair was aligned and placed 15 mm apart. The diameter
of the circular light beam from the laser diode modules was adjusted to be slightly smaller
than the size of detection window on the photodiode. The optical sensor unit was designed
48
to enable measurements from either standard cuvettes or custom made flow chambers with
a light path length of 5 mm. Cuvettes and flow chambers were placed perpendicular to the
laser beam and 1 mm away from the window of photodiodes. When used for real-time
monitoring, laser diodes were powered sequentially by the data logger’s control module to
avoid light noise from individual laser light sources. The voltage generated from the
photodiodes was amplified and recorded by a data logger and controller (CR3000,
Campbell Scientific Inc., UT, USA). The entire sensor unit was mounted in a weather proof
enclosure enabling connection of tubes for algae flow through the sensor flow cell and
signal cables for the laser diodes and photo diodes.
The voltage output of the photodiode is proportional to the intensity of incident
light. According to Beer-Lambert law, the light absorbance of the sample was determined
by,
𝐴𝑏𝑠 = −𝑙𝑛(𝑉𝑠 𝑉𝑏⁄ )
Abs = Light absorbance
Vb = Output of the photodiode from growth media (mV)
Vs = Output of the photodiode from a sample (mV)
2.2. Cultivation conditions and organisms
2.2.1 Indoor photobioreactor (PBR) cultivation
Chlorella sorokiniana Beijerinck, 1890 (DOE 1412) received from Pacific
Northwest National Laboratory, WA, USA [26] was cultivated in local well water enriched
with Peters professional 20-20-20 general purpose water soluble fertilizer 0.26 g L-1
49
(E99290, Peters Professional, USA), Citraplex 20% iron 0.053 g L-1 (Citraplex 20% Iron,
Loveland Products, Inc., USA) and trace elements solution (H3BO3 0.0029 g L-1,
MnCl2•4H2O 0.0018 g L-1, ZnSO4•H2O 0.00014 g L-1, Na2MoO4•2H2O 0.00039 g L-1,
CoCl2•6H2O 0.000055 g L-1) under illumination intensity of 200 µmol m-2 s-1 or 400 µmol
m-2 s-1 in rectangular air lift photo bioreactors (PBRs). The algae culture temperature was
light intensity dependent and was stabilized at 30±2 ⁰C. The pH of the medium was
controlled at 7±0.3 by injecting CO2 from a pressurized liquid CO2 tank into PBRs.
2.2.2 Outdoor open pond raceway cultivation
Scenedesmus obliquus was used in the outdoor open pond raceway cultivation
experiments. Scenedesmus obliquus was received from Texas A&M AgriLife Research
(Texas, USA) and was cultivated in local well water enriched with Pecos medium, trace
metal solution and 5g L-1 NaCl. The Pecos medium contained 0.1 g L-1 urea ((NH2)2CO),
0.012 g L-1 MgSO4•7H2O, 0.035 g L-1 NH4H2PO4, 0.175 g L-1 Potash (KCl), 0.0054 g L-1
FeCl3 and 0.02 g L-1 Na2CO3. The culture was maintained in an open pond paddle wheel
raceway with a surface area of 3 m2 located in Tucson, Arizona, USA. The culture depth
was maintained at 10 cm and increased to 15 cm later in the experiment. The pH of the
medium was controlled at 8±0.05 by injecting 95% CO2 through an air sparger.
2.3 Offline biomass concentration measurement
Biomass concentration of microalgae was determined by both cell counting and
ash-free dry weight (AFDW) measurements. Cell suspension was diluted to a concentration
between 106 and 107 cells mL-1 for cell counting by a neubauer chamber hemocytometer
(Hy-Lite Ultra-plane, Clayadams, USA) under a microscope (XSZ-138, AOK International
50
Group Ltd., China). The AFDW of the cells was measured following the method described
by Zhu and Lee (1997) [27]. The light absorbance of the cells suspension was measured at
650, 685, 750 and 780 nm by a spectrophotometer (DR 3800, HACH, USA) using a 10
mm light path length cuvette. Samples were diluted with deionized water when necessary
to keep the absorbance reading below 0.5.
2.4 Real-time monitoring of microalgae growth dynamics
2.4.1 Indoor PBR cultivation
The microalgae culture system consisted of an air lift flat panel PBR illuminated
by a fluorescent lighting system. The pH (HI1001, Hanna Instruments, USA), electrical
conductivity (HI3001, Hanna Instruments, USA), dissolved oxygen (DO1200/T, Sensorex,
USA) and thermocouple temperature probes (Type T, Omega Engineering Inc., USA) were
placed in the PBR for monitoring and control by a CR3000 datalogger. Each sensor was
scanned every second and 10 minute averaged data was stored in the datalogger.
Flat panel PBRs with dimensions of 61 (H) x 61 (L) x 7.6 cm (W) were built using
6.35 mm thick clear acrylic panels (ACRYCLR0.250PM48X48, Plexiglas, USA). Air was
constantly injected into the PBR via a 45.7 cm long air sparger mounted at the bottom of
PBR for aeration and to achieve proper mixing of the microalgae culture. Carbon dioxide
injection was controlled by the datalogger to maintain a desired pH level (7±0.3) in the
PBR. The lighting system consisted of sixteen 61 cm 17-watt fluorescent light tubes
(F17T8/741, Litetronics International, Inc., Illinois, USA) mounted on a supporting
structure. Two levels of light intensity (200 and 400 µmols m-2 s-1) were achieved by
adjusting the number of lights used. The light remained on 24 hours per day, no dark period
51
was used. A small centrifugal pump (Seltz 20, Hydor, CA, USA) was used to recirculate
cell suspension through the inline optical density measurement unit for the PBR. The
optical density sensor was connected to the PBR system for continuous monitoring of OD
and microalgae growth (Fig. 2).
Figure 2. Multi wavelength optical sensor integrated into air-lift flat panel
photobioreactors for real-time microalgae growth monitoring.
2.4.2 Outdoor open pond raceway cultivation
The optical density sensor was also integrated into an outdoor raceway system for
continuous monitoring of microalgae growth (Fig. 3). Since sensor electronics maybe
sensitive to environmental conditions, the optical sensor with its housing and the datalogger
were placed in a location at the outdoor raceway site to minimize direct exposure to
sunlight. The laser output is also temperature dependent (5-15 mV/ oC, vary with lasers).
Therefore a temperature control unit was installed and consisted of a small heater plate
(HT24S, Thorlabs, NJ, USA) and heat sink (55 mm Fan Heatsink, USA) to maintain a
constant temperature (25±0.1 ⁰C )inside the sensor box. This also ensured a constant laser
52
power output. The paddle wheel in the raceway system was operated 24 hours a day for
continuous culture mixing. The CO2 injection was turned off during night time. In addition
to the measurement data collected for the indoor experiment, photosynthetically active
radiation (PAR) was also measured using a quantum sensor (SQ-110, Apogee instruments,
USA) at the level of the raceway system. All variables were recorded at the same frequency
for sensor scanning and data averaging as described for the indoor cultivation experiment.
The experiment occurred from 2/25 to 3/15 for a total of 18 days.
Figure 3. Optical sensor integrated into an open pond raceway for real-time
microalgae growth monitoring.
3. RESULTS AND DISCUSSION
3.1 In situ calibration of the optical density measurement unit
Light absorbance from a flowing cell suspension can be different from static
samples due to cell movement and potentially the presence of fine air bubbles. Therefore,
a calibration of the unit using flowing microalgae culture is necessary. In order to achieve
in-line real-time monitoring, sample preparation needs to be eliminated or automated.
53
Cuvettes with 10 mm path length has been commonly used for optical density
measurement. However, the OD does not increase proportionally to the increase of biomass
concentration beyond a certain point. Therefore, dilution of the sample is necessary to keep
the measurement within the linear correlation range for high concentration microalgae
samples. According to Beer’s law, the same results can be achieved by shortening the light
path length of the measurement chamber. A preliminary experiment was conducted to
prove this theory (Fig 4). Linear correlation between OD and AFDW held from the
measurements made in shortened light path length flow chamber (5 mm). In contrast, OD
started to saturate as biomass concentration increase when using 10 mm flow chamber. In
this study, flow chambers with light path lengths of 5 mm were used to extend the
measurement range of the unit without requiring sample dilution.
Figure 4. Correlation between OD measured by the inline optical density and AFDW
using two flow chambers with 10 mm and 5 mm light path length respectively.
The optical sensor unit (Fig. 1) developed in this study (referred as IOS hereafter)
was calibrated by comparing the reading from the sensor unit to that from a bench-top
0
1
2
3
4
5
6
0 0.5 1 1.5
OD
-In
lin
e o
pti
cal
sen
sor
Ash free dry weight (g L-1)
OD 650 10mm
OD 650 5mm
54
spectrophotometer (referred as BT hereafter) at 650, 685 and 780 nm. The bench-top
spectrophotometer (DR3800, Hach, CO, USA) was calibrated to both ash-free dry weight
(AFDW) and cell count (CC) for C. sorokiniana at all three wavelengths: AFDW=
0.188*OD650+0.0453 g L-1 (R2=0.96), AFDW= 0.161*OD685+0.0292 g L-1 (R2=0.96),
AFDW= 0.205*OD780+0.0546 g L-1 (R2=0.95), CC=(28.6* OD650+1.13) 106 cells mL-1
(R2=0.91), CC=(26.8* OD685-3.92) 106 cells mL-1 (R2=0.95), CC=(29.8* OD780+3.96) 106
cells mL-1 (R2=0.90). The optical density readings measured from the spectrophotometer
using standard 10 mm cuvettes were compared to the results obtained from optical sensor
unit using 5 mm flow cell. Strong linear correlations between the two measurement units
were obtained at all wavelengths examined (Fig. 5). A linear correlation was tightly
followed (R2=0.99) between the optical density measurements obtained from IOS and BT
units at 780 nm with cell concentration up to 1.05 g L-1 (1.51x10⁸ cells mL-1). Linear
correlations hold for OD650 (R2=0.98) and OD685 (R
2=0.99) for cell concentrations below
0.592 g L-1. However, beyond this range while below 1.05 g L-1, different linear
correlations were observed for these two wavelengths (Fig. 5). Compared to the results
from Nedbal et al. (2008) [22], the optical sensor unit showed the capability of measuring
cell concentration over a wide range without dilution of the samples. The same calibration
procedure was performed for S. obliquus during outdoor testing.
55
Figure 5. (a) Correlation between the optical densities of DOE 1412 in the
PBR measured by a bench-top spectrophotometer (BT) and by the inline
optical sensors (IOS). OD650 (BT) = 1.82 x OD650 (IOS) + 0.056 (AFDW < 0.592
g L-1), OD685 (BT) = 1.70 x OD685 (IOS) + 0.11 (AFDW < 0.592 g L-1), OD650 (BT)
= 3.54 x OD650 (IOS) – 2.51 (0.592 g L-1 < AFDW < 1.05 g L-1), OD685 (BT) =
3.72 x OD685 (IOS) – 3.88 (0.592 g L-1 < AFDW < 1.05 g L-1), OD780 (BT) = 3.71
x OD780 (IOS) – 0.2445 (AFDW < 1.05 g L-1). (b) Correlation between optical
density (IOS) and AFDW, AFDW = 0.96 x OD780 (IOS) – 0.12 (R2 = 0.99);
AFDW = 0.40 x OD650 (IOS) + 0.032 (R2 = 0.98); AFDW = 0.30 x OD685 (IOS) +
0.061 (R2 = 0.96).
The OD readings from the optical sensor unit measured using 5 mm path length
flow cell should be half of that from the spectrophotometer using a standard 10 mm cuvette
in theory. However, the results did not show an exact correlation between the two units.
This was because of the light quality from the laser diodes wasn’t the same as that in a
spectrophotometer where a monochromatic light was generated. Fig. 6 shows the spectra
of the laser diodes used in the developed sensor unit, measured by a spectroradiometer (PS-
300, Apogee Instruments, UT, USA) and the optical density spectra of DOE 1412. The
peak wavelengths of each laser diode were slightly shifted from what was claimed by the
manufacturers. An optical filter (86734, Edmund Optics, NJ, USA) was used to narrow the
56
band width of 685 nm laser diode from 80 nm to 10 nm and corrected the peak wavelength
back to 685 nm from 688 nm. Despite the inferiority of the light beam generated from laser
diodes, the strong linear correlations proved that the optical sensor unit was able to estimate
the cell density as accurate as a spectrophotometer via calibration (Fig. 5).
Figure 6. Light absorbance spectrum of DOE 1412 and light spectra of laser
diodes used on the optical sensor.
3.2 Real-time microalgae growth monitoring
The optical sensor unit along with other sensors to monitor algae culture
environment was integrated into a PBR to monitor the dynamics of a microalgae culture
system. Fig. 7a shows the growth dynamics of semi-continuous culture of DOE 1412 as
measured by the optical sensor unit over a period of 10 days. Sensor output shown in Fig.7a
was calibrated to optical density reading from a bench-top spectrophotometer. The optical
sensor unit showed the capability to capture the growth phases during semi-continuous
operation, and the sudden change of cell concentration due to harvesting and addition of
fresh media (indicated with arrows on the figure). A maximum cell concentration of 1.05
0
0.1
0.2
0.3
0.4
0.5
0.6
0.7
0.0
0.1
0.2
0.3
0.4
0.5
0.6
600 650 700 750 800 850 900
Op
tica
l d
ensi
ty-B
T
μm
ol
m-2
s-1
Wavelength (nm)
650nm
685nm
685nm w/filter
780nm
DOE 1412 ABS
57
g L-1 (1.51x10⁸ cells mL-1) was observed during the cultivation experiment without any
sample preparation and dilution for the measurements.
Growth dynamics of the microalgae was quantified by the growth rate. The growth
rate was determined by the following equation with Δt of 2 hours (0.08 days).
µ = 𝑙𝑛(𝑂𝐷2)𝜆 − 𝑙𝑛(𝑂𝐷1)𝜆
𝛥𝑡
µ = Growth rate (day-1)
OD = Optical density of microalgae at different time points (=780 nm)
Δt = Difference between the two time points (day)
The change of growth rate was clearly demonstrated by plotting the growth rate (µ)
of DOE 1412 over time (Fig. 7b). The initial lag phase was followed by an increase in cell
growth. Microalgae culture reached maximum growth rate soon after the lag phase when
there is no light limitation. The growth rate then gradually decreases as the culture becomes
light limited. When the illumination intensity was increased from 200 µmol m-2 s-1 to 400
µmol m-2 s-1 on 3/2/2014 an increase in growth rate was observed (Fig 7b). The growth rate
dropped down to the level prior the alternation of light intensity as the culture again became
light limited. These events were detected by the optical sensor unit (Fig. 7a and Fig. 7b).
Although real time growth rate is not required for microalgal biomass production purposes,
data with such high resolution provided a great tool for studying the fast response of
microalgae to sudden change of the environmental conditions.
58
Figure 7. (a) Dynamics of optical density at 650 nm, 685 nm and 780 nm
during semi-continuous culture of DOE 1412 run for 10 days. Illumination
intensity was increased from 200 µmol m-2 s-1 to 400 µmol m-2 s-1 during the
first batch on 3/2, it was then reduced to 200 µmol m-2 s-1 by the end of the
batch. (b) Growth rate of DOE 1412 at 650, 685 and 780 nm and (c) ratios of
optical densities at 650/780nm and 685/780nm.
Monitoring not only the cell concentration change, but also the dynamic
physiological status of the microalgae culture including the changes in growth rate and the
change of chlorophyll content can serve as indicators of the health of the culture. This is
59
important for cultivation of microalgae production when it is desirable to control conditions
to produce a product of interest. For example, some microalgae produce more lipids when
nutrients such as nitrogen are limiting. The ratios of optical densities at different
wavelengths (685/780nm and 650/780nm) are shown in Fig. 7c. The ratios remained
constant during lag phase, followed by a rapid increase during the exponential growth
phase and stabilized at a higher level throughout the linear growth phase. The ratios then
started to decrease as the growth of cells slowed down which indicated the transition from
linear to stationary phase. The pattern of the ratio change occurred repeatedly over the time
course of the experiment regardless of the growth pattern change induced by increased
light intensity during the first batch. Signaling of this transition indicated that there is a
decrease of chlorophyll content which absorbs most of the red light during the period
indicated by the decreasing optical density ratios [29]. This might have been due to nitrogen
limitation, since nitrogen is often rapidly consumed by algal cells during exponential
growth according to López et al. (2006) [19]. Similar results for the change of OD 680/
OD 735 was reported by Nedbal et al. (2008) [22].
The optical sensor unit was also integrated into an outdoor open pond raceway for
stability testing under highly dynamic outdoor weather conditions such as large
temperature variations between daytime and nighttime periods. For instance, a 20 oC
temperature difference were measured inside sensor box from daytime to nighttime when
the temperature control system was not activated (Fig 8). The resulted inaccurate OD
measurement by the inline optical sensor was shown in figure 8. The actual OD of the
60
culture was determined by a bench-top spectrophotometer. The steep decrease of OD
during the nighttime was due to the increase in laser diode power that corresponded to the
decrease of temperature. This did not reflect the actual OD dynamic of the microalgae
culture in outdoor conditions. Thus, it is necessary to integrate a temperature control unit
into the optical sensor for accurate OD measurements.
Figure 8. Optical density change of S. obliquus in open pond raceway over 5 days
without temperature control unit on the inline sensor.
After the implementation of the temperature control unit, the temperature of the
optical sensor was maintained at a constant level that ensured a consistent level of power
output from the laser diodes. The optical density of the culture of S. obliquus during a
period of 18 days recorded by the optical sensor is shown in Fig.9. The real-time optical
density shows repeatedly an increase OD reading indicating the biomass increase during
the day time due to photosynthesis. A small decrease in optical density was observed during
the nighttime since photosynthetic microorganisms metabolize intracellular carbohydrate
to sustain their metabolic activity as described by Ogbonna and Tanaka (1996) [28].
0
10
20
30
40
50
60
0.0
0.4
0.8
1.2
1.6
2.0
2/6 2/7 2/8 2/9 2/10 2/11 2/12
Tem
per
atu
re (
⁰C)
Op
tica
l D
ensi
ty
Date
BenchTop OD 780 Calibrated OD 780 Sensor Temperature
61
Sudden decreases of optical density of the culture due to water addition, precipitation (rain)
and biomass harvesting were clearly shown in the figure labeled by arrows.
The growth rate of S. obliquus was compared to photosynthetic active radiation
(PAR) measured at the raceway (Fig. 10). The growth rate of S. obliquus was dependent
on the PAR level except during the water addition time period. This set of high resolution
data enables one to evaluate in detail about how S. obliquus responds to solar radiation
level in a sunny day. The correlation between PAR and growth rate can be used for the
prediction of biomass production rate based on historical weather data for a given region.
Figure 9. Optical density change of S. obliquus in open pond raceway over
18 days. Black arrows indicate events of water addition, precipitation and
biomass harvesting.
62
Figure 10. (a) Photosynthetic active radiation (PAR) of a sunny day in
Tucson, AZ, USA. (b) Growth rate (µ) of S. obliquus in open pond raceway
of the same day. (c) Scattered plot of PAR and µ from the data presented in
(a) and (b).
4. CONCLUSIONS
The multi-wavelength laser diode based optical sensor unit was designed,
developed and evaluated for the monitoring of microalgae culture dynamics in real-time
both in a PBR and in an outdoor raceway system. The optical sensor unit prototype
demonstrated the capability of estimating cell concentration and changes of the
physiological status of the microalgae culture in real-time. The sensor unit was operated
continuously for 18 days without any visible microalgae biofilm deposit observed on the
flow chamber of the sensor unit. In this design, the only sensor hardware part that had
contact with culture medium was the flow chamber which can be easily replaced. For
industrial microalgae production, the application of ultra-hydrophobic material
63
(Hydrophobic glass coating, UltraTech International, Inc., USA) on the surface of flow
chamber can further extend the maintenance interval. Biomass concentration was
accurately estimated by optical density measurement at 650, 685 and 780 nm wavelengths.
The sensor was capable of measuring maximum optical density of 5.41, 5.86 and 4.88
without sample preparation at 650 nm, 685 nm and 780 nm respectively. Growth rates and
ratios calculated from optical density at each wavelength were good indications for
monitoring of microalgae growth transitions and for detection of disturbances to the culture
system (i.e change of light intensity, water addition, rain, and harvesting). A temperature
control device for the sensor is necessary, especially for outdoor applications where air
temperature can vary significantly, since the output power of laser diodes were temperature
dependent. The cell concentration measurement range can be further improved by
shortening the light path length of the flow chamber. Other laser modules and wavelengths
of interest can be added to expand the number of biological variables measured by the
sensor which is our focus for future studies. The real-time monitoring data from the optical
sensor can be valuable for microalgae modeling studies both for PBR and outdoor raceway
based production systems. With proper calibration, installation and operation, the optical
sensor described in this study can be integrated into microalgae culture systems for
monitoring and control purposes at a relative low cost to ultimately help optimize product
quality and quantity.
64
ACKNOWLEDGMENTS
This research was supported by research grant no DE-EE0006269 from The United
States of America Department of Energy.
REFERENCES AND NOTES
1. Harun, R.; Singh, M.; Forde, G.M.; Danquah, M.K. Bioprocess engineering of
microalgae to produce a variety of consumer products. Renew Sust Energ Rev. 2010,
14(3), 1037-1047.
2. Perez-Garcia, O.; Escalante, F.M.E.; de-Bashan, L.E.; Bashan, Y. Heterotrophic
cultures of microalgae: Metabolism and potential products. Water Res. 2011, 45(1),
11-36.
3. Wiltshire, K.; Boersma, M.; Möller, A.; Buhtz, H. Extraction of pigments and fatty
acids from the green alga scenedesmus obliquus (chlorophyceae). Aquat Ecol. 2000,
34(2), 119-126.
4. Barclay, W.R.; Meager, K.M.; Abril, J.R. Heterotrophic production of long chain
omega-3 fatty acids utilizing algae and algae-like microorganisms. J Appl Phycol.
1994, 6(2), 123-129.
5. Chisti, Y. Biodiesel from microalgae. Biotechnol Adv. 2007, 25(3), 294-306.
6. Mata, T.M.; Martins, A.A.; Caetano, N.S. Microalgae for biodiesel production and
other applications: A review. Renew Sust Energ Rev. 2010, 14(1), 217-232.
65
7. Radakovits, R.; Jinkerson, R.E.; Darzins, A.; Posewitz, M.C. Genetic engineering of
algae for enhanced biofuel production. Eukaryot Cell. 2010, 9(4), 486-501.
8. Richmond, A.; Zhang, C.W. Optimization of a flat plate glass reactor for mass
production of nannochloropsis sp. outdoors. J Biotechnol. 2001, 85(3), 259-269.
9. Lee, S.; Yoon, B.; Oh, H. Rapid method for the determination of lipid from the
green alga botryococcus braunii. Biotechnol Tech. 1998, 12(7), 553-556.
10. Richmond, A. Basic culturing techniques. In Handbook of microalgal culture:
Biotechnology and applied phycology, 1st ed.; Richmond, A., Eds.; Blackwell
Publishing Ltd Publisher: UK, 2004; pp. 43-45.
11. Chen, Y.; Vaidyanathan, S. A simple, reproducible and sensitive
spectrophotometric method to estimate microalgal lipids. Anal Chim Acta. 2012,
724(0), 67-72.
12. Collos, Y.; Mornet, F.; Sciandra, A.; Waser, N.; Larson, A.; Harrison, P.J. An
optical method for the rapid measurement of micromolar concentrations of nitrate in
marine phytoplankton cultures. J Appl Phycol. 1999, 11(2), 179-184.
13. Held P. Monitoring of algal growth using their intrinsic properties. Available
online: http://www.biotek.com/resources/articles/monitoring-of-algal-growth-using-
intrinsic-properties.html (Accessed on 11 July 2011).
14. AlgaeTorch - chlorophyll and cyanobacteria measurement. Available online:
http://www.bbe-moldaenke.de/chlorophyll/algaetorch/ (Accessed on 12 July 2013).
15. Unique design of EXO total algae sensor combines chlorophyll and blue-green
algae for greater accuracy. Available online:
66
http://www.exowater.com/blognow/blogDetail.php?Unique-Design-of-EXO-Total-
Algae-Sensor-Combines-Chlorophyll-and-Blue-green-Algae-for-Greater-Accuracy-
3 (Accessed on 12 July 2013).
16. 6131 and 6132 blue-green algae sensors (6-series). Available online:
http://www.ysi.com/accessoriesdetail.php?6131-and-6132-Blue-Green-Algae-
Sensors-6-Series-91. (Accessed on 12 July 2013).
17. Blue-green algae by sensor turner designs. Available online:
http://www.hachhydromet.com/web/ott_hach.nsf/id/pa_blue-
green_algae_by_turner_designs.html (Accessed on 10 Feb 2012).
18. Briassoulis, D.; Panagakis, P.; Chionidis, M.; et al. An experimental helical-tubular
photobioreactor for continuous production of nannochloropsis sp. Bioresour
Technol. 2010, 101(17), 6768-6777.
19. López, M.C.G.; Sánchez, E.D.R.; López, J.L.C.; et al. Comparative analysis of the
outdoor culture of haematococcus pluvialis in tubular and bubble column
photobioreactors. J Biotechnol. 2006, 123(3), 329-342.
20. Marxen, K.; Vanselow, K.; Lippemeier, S.; Hintze, R.; Ruser, A.; Hansen, U. A
photobioreactor system for computer controlled cultivation of microalgae. J Appl
Phycol. 2005, 17(6), 535-549.
21. Meireles, L.A.; Azevedo, J.L.; Cunha, J.P.; Malcata, F.X. On-line determination of
biomass in a microalga bioreactor using a novel computerized flow injection
analysis system. Biotechnol Prog. 2002, 18(6), 1387-1391.
67
22. Nedbal, L.; Trtílek, M.; Červený, J.; Komárek, O.; Pakrasi, H.B. A photobioreactor
system for precision cultivation of photoautotrophic microorganisms and for high-
content analysis of suspension dynamics. Biotechnol Bioeng. 2008, 100(5), 902-910.
23. Sandnes, J.M.; Ringstad, T.; Wenner, D.; Heyerdahl, P.H.; Källqvist, T.; Gislerød,
H.R. Real-time monitoring and automatic density control of large-scale microalgal
cultures using near infrared (NIR) optical density sensors. J Biotechnol. 2006,
122(2), 209-215.
24. Su, C.; Fu, C.; Chang, Y.; et al. Simultaneous estimation of chlorophyll a and lipid
contents in microalgae by three-color analysis. Biotechnol Bioeng. 2008, 99(4),
1034-1039.
25. Yao, Y.; Thommasson, J.A.; Ge, Y.; Sui, R. Improvement of an optical density
sensor for algae pond monitoring and process control. 2012 ASABE Paper No. 12-
1338431, St. Joseph, Mich.: ASABE.
26. Jones, S.B.; Zhu, Y.; Anderson, D.B.; Hallen, R.T.; Elliott, D.C.; Schmidt, A.J.; et
al. Process Design and Economics for the Conversion of Algal Biomass to
Hydrocarbons: Whole Algae Hydrothermal Liquefaction and Upgrading. PNNL-
23227, Pacific Northwest National Laboratory, Richland, WA. 2014.
27. Zhu, C.J.; Lee, Y.K. Determination of biomass dry weight of marine microalgae. J
Appl Phycol. 1997, 9(2), 189-194.
28. Ogbonna, J.C.; Tanaka, H. Night biomass loss and changes in biochemical
composition of cells during light/dark cyclic culture of Chlorella pyrenoidosa.
Journal of Fermentation and Bioengineering. 1996, 82 (6), 558–564.
68
29. Solovchenko, A.; Khozin-Goldberg, I.; Recht, L.; Boussiba, S. Stress-induced
changes in optical properties, pigment and fatty acid content of nannochloropsis sp.:
Implications for non-destructive assay of total fatty acids. Mar Biotechnol. 2011,
13(3), 527-535.
69
APPENDIX B - AUTONOMOUS DETECTION OF AN ABIOTIC AND
BIOTIC DISTURBANCE IN A MICROALGAL CULTURE SYSTEM
USING A MULTI-WAVELENGTH OPTICAL DENSITY SENSOR
F. Jia, M. Kacira, L. An, C. C. Brown, K. L. Ogden, J. K. Brown
Journal TBD
ABSTRACT
The development and calibration of an autonomous detection of environmental
(abiotic and biotic) disturbances in an experimental microalgal culture system was
undertaken using a multi-wavelength laser diode optical sensor. The goal was to develop a
sensor capable of real time detection of fluctuations in algal cell number (density)
indicative of the physiological (growth) status of a suspension culture of the microalga
Chlorella sorokiniana (isolate DOE 1412). The rapid decline of a DOE 1412 culture
infected by V. chlorellavorus was detected 2 days prior to the rapid death of the culture by
parameters such as ratios of OD685 and OD780 indicating color features of microalgae
culture. The sensitivity of the sensor to the presence of particulates in an indoor
experimental continuous, temperature and light-controlled cultivation system was tested
by introducing test ‘field dust’ like that from agricultural land in Arizona. The sensor
showed relatively low sensitivity to a microalgal suspension containing particulates
comprising 60% of the AFDW of microalgae biomass, however, it clearly indicated the
field dust introduction ‘event’ to the culture system. Both types of ‘invasions’ were
detectable using this early detection system.
70
KEYWORDS: Chlorella sorokiniana, early detection, multi-wavelength optical density
sensor, real-time monitoring, Vampirovibrio chlorellavorus
71
1. INTRODUCTION
Microalgae have been commercially cultivated to produce protein, poly-unsaturated fatty
acids (PUFAs), pigments and chemicals mainly for human nutrition and animal feed
application since 1960s (Spolaore et al. 2006; Harun et al. 2010; A. Carlsson et al. 2007).
Because certain microalgae species can achieve high productivity and moderate to high
oil content compared to terrestrial oil crops, they are good candidates as raw material for
biofuel production (Y. Li et al. 2008; Chisti 2007; Mata et al. 2010). Microalgae
cultivated at commercial scales are typically grown in open pond raceways or closed
photobioreactors (PBRs). Many commercial production settings have adopted open pond
raceways because the financial feasibility has been shown to be substantially greater than
that of PBRs (Richardson et al. 2012). In general, the physical culture conditions in open
pond systems, including temperature, lighting intensity, and duration are climate
dependent (Waller et al. 2012), and when conditions are not optimal, microalgal
productivity can be negatively affected (Richardson et al. 2012). Sub-optimal
productivity increases the cost of the product because large volumes of water must be
processed to harvest to sufficient biomass (Danquah et al. 2009; Knuckey et al. 2006).
However, the most prominent drawback of open pond raceway systems is cultivation
failure due to the vulnerability of microalgae to biotic disturbances caused by the
invasion of grazers, predators, and pathogens (Soo et al. 2015; Velicer and Mendes-
Soares 2009; Carney and Lane 2014; Rego et al. 2015).
The fluorescence excitation of chlorophyll a molecules associated with microalgal
cells grown in suspension cultures is commonly monitored to assess microalgal density in
72
near real-time because optical density (OD) is linear with cell number, and can be used to
rapidly assess cell growth, and to estimate time of harvest and potential yield. Also, because
measurements can be obtained for a very small sample size, the process is minimally
destructive (Briassoulis et al. 2010; Sandnes et al. 2006; Thomasson et al. 2010; Marxen
et al. 2005; Nedbal et al. 2008).
Dust and dirt suspended in microalgae cultures can cause inaccurate estimations of biomass
concentration by increasing light absorption and alternating color profile of the culture
suspension. This becomes a concern for microalgae production located in arid and semi-
arid regions where a considerable amount of dust and dirt can fall into the cultivation
raceways carried by dust storms or other causes of air disturbance.
Contamination of microalgae by parasites, grazers and pathogenic bacteria has
always been an issue for large-scale microalgae production since it can lead to a rapid death
of a culture that results in a loss of biomass and desired bioproducts. It also became a main
constraint of species selection for open pond production systems. The detection of
microalgal parasitic microorganisms such as bacteria rely on either microscopy and
staining, flow cytometry, and molecular detection (Day et al. 2012; Gerphagnon et al.
2013). However, none of these approaches can detect the bacteria or the timing of the
contaminating event in-situ in real-time. Several effective approaches for contending with
parasite contamination have been tested, including salvage harvesting, ozone and UVC
treatments, the addition of abscisic acid, and sonication. However, early detection is
required for any abatement measure(s) to minimize damage (Webb et al. 2012; Benderliev
et al. 1993; Shurin et al. 2013; Woo and Kamei 2003; Rego et al. 2015). Feasibly, real-time
73
sensors (Jia et al., 2015) that are capable of detecting ‘contamination events’, including
predators, parasites, and pathogens, could be applied to their early detection and potentially
result in rapid response time for abatement, particularly in large-scale production facilities.
The microalgal, Chlorella sorokiniana isolate 1412, is one of several robust
candidate algae identified for use in lipid-based biofuel feedstock production (Lammers, P.
et al. 2015). However, the bacterium, Vampirovibrio chlorellavorus
(Gromov&Mamkaeva, 1972) (class Melainabacteria; Cyanobacteria), is a damaging,
microbial predator of C. sorokiniana, and also of the related species, C. vulgaris and C.
kessleri (Coder and Goff 1986). V. chlorellavorus is thought to destroy the host microalgal
by adhering to and penetrating the cell, and utilizing its cellular contents by implementing
a Type IV secretion system (T4SS), to deliver two conjugative plasmids that integrate into
the genome (where they replicate and express essential pathogenicity proteins, such as an
efflux pump) through the channel in the T4SS apparatus, along with proteins and
hydrolytic enzymes made by the bacterium that digest the cell contents (Soo et al., 2015).
Although Chlorella cells remain intact after V. chlorellavorus attack for about one week,
the color of the cells fades due to the absence of pigments (Soo et al. 2015; Velicer and
Mendes-Soares 2009).
Monitoring microalgal biomass concentration can be monitored using light
scattering measurements based on the diffraction of incident light. Light scattering is
measured using optical density, which increases as the number of cells increase. Optical
density measurements at various wavelengths offers a rapid approach for assessing algal
74
growth and health in bioreactors and outdoor cultivation systems (Das et al. 2011;
Solovchenko et al. 2011; Nedbal et al. 2008).
In this study, a multi-wavelength optical sensor was developed and tested for its
ability to monitor microalgal performance in a near real-time capacity, and specifically,
prior to the result of such disturbances being detectable by visual inspection. Two kinds of
‘contamination’ experiments were carried out to investigate the use of the sensor to perform
real-time ‘smart’ monitoring of a C. sorokiniana suspension culture grown in a temperature
and light-controlled bioreactor. The first involved the intentional application of ‘field dust’
to the bioreactor containing algal culture, and the second utilized the inoculation of the
algal culture with the predator, V. chlorellavorus.
2. MATERIAL AND METHODS
2.1 Cultivation conditions and organisms
The DOE 1412 culture of Chlorella sorokiniana Beijerinck, 1890 was obtained
from Pacific Northwest National Laboratory, WA, USA was used in all experiments (Jones
et al. 2014). DOE1412 was cultivated in indoor experimental photobioreactors (PBRs)
under illumination at 200 µmol m-2 s-1, and the pH of the medium was controlled at 7±0.3
by injecting CO2 from a pressurized liquid CO2 tank into PBRs for both experiments.
For the ‘field dust’ experiment, DOE 1412 was cultivated in water pumped from a
local well, enriched with Peters general purpose water soluble fertilizer (20-20-20) at a
concentration of 0.26 g L-1 (E99290, Peters Professional, USA), Citraplex 20% iron 0.053
g L-1 (Citraplex 20% Iron, Loveland Products, Inc., USA), and a trace element solution
75
(H3BO3 0.0029 g L-1, MnCl2•4H2O 0.0018 g L-1, ZnSO4•H2O 0.00014 g L-1,
Na2MoO4•2H2O 0.00039 g L-1, CoCl2•6H2O 0.000055 g L-1). The temperature of the DOE
1412 suspension culture in the PBR was held constant at 30±1 ⁰C. The purpose of the field
dust experiment was to simulate the cultivation condition of microalgae in an open pond
cultivation system, such as the DOE RAFT project ARID raceway at the University of
Arizona (Waller et al. 2012). To this end, soluble fertilizer was used at the same rate in the
experimental PBR system to simulate the open pond conditions for the ‘field dust’
experiment.
For the Vampirovibrio chlorellavorus inoculation test, the DOE 1412 was
cultivated in local well water enriched with Pecos medium and the trace metal solution, per
above, to simulate the laboratory conditions under which the V. chlorellavorus culture was
maintained. The Pecos medium contained 0.1 g L-1 urea ((NH2)2CO), 0.012 g L-1
MgSO4•7H2O, 0.035 g L-1 NH4H2PO4, 0.175 g L-1 Potash (KCl), 0.0054 g L-1 FeCl3 and
0.02 g L-1 Na2CO3. The temperature of the media was maintained at 34 ± 0.1 oC. DOE
1412 was inoculated to the algal culture at this temperature because observations by our
group demonstrated that it was most susceptible to attack and rapid decline by V.
chlorellavorus (Park et al., in preparation).
2.2 Offline biomass concentration measurement
The biomass concentration of DOE 1412 was determined by cell counts, and by
determining the ash-free dry weight. The algal cell suspension was diluted to different cell
concentrations ranging from 106 and 108 cells mL-1, and the number of total cells and live
76
cells was determined using an automated cell counter (Cellometer Vision, Nexcelom
Bioscience, MA, USA). The ash-free dry weight of the cells was determined, following the
method described by Zhu & Lee (1997). The OD of the cell suspension was measured at
650, 685, 750 and 780 nm by a bench-top spectrophotometer (DR 3800, HACH, CO, USA)
using a 10 mm light path length cuvette. Samples were diluted with deionized water (as
necessary) to achieve an absorbance reading of approximately 0.5 or less, to be within the
range of measurable biomass density, which is expected to be linearly proportional to the
OD concentration based on Beer’s law (Lee 1999).
2.3 PCR detection of V. chlorellavorus and C. sorokiniana
The V. chlorellavorus infected DOE 1412 biomass pellet collected daily from the
experimental PBRs was stored in -80 ⁰C freezer prior to DNA extraction. Total DNA was
isolated from the pellet using the CTAB method (Doyle and Doyle 1987) with slight
modifications, as described below. . One milliliter of microalgae suspension was pelleted
and resuspended in 1 mL of CTAB. A quantity of glass beads (G-8772, Sigma Chemical
Co., St. Louis, MO, USA) sufficient to fill the conical portion of the centrifuge tube was
added, and the tube was agitated on a bead beater (Mini-Beadbeater, BioSpec, OK, USA)
for 5 min. The mixture was centrifuged, and supernatant was extracted with an equal
volume of chloroform: isoamyl alcohol (24:1). The preparation was centrifuged in a
benchtop microcentrifuge (5415C, Eppendorf, Germany) at 9000 RPM (6611 x g) for 10
min. The upper aqueous phase was removed and mixed with 2/3 volume cold isopropanol,
and held a t -20⁰C for a minimum of 20 min. The DNA was precipitated with 1 mL of 70%
77
ethanol and collected by microcentrifugation at 9000 RPM (6611 x g) for 10 min. The
pellet was washed with 70% ethanol and resuspended in low TE (10 mM Tris-EDTA
buffer, pH 8.0) (Maniatis et al. 1982), and held at -20 ⁰C until used for polymerase chain
reaction (PCR) amplification(Mullis et al. 1986).
The presence of V. chlorellavorus in the inoculated PBR suspension culture of DOE
1412 was detected by polymerase chain reaction (PCR) amplification (Mullis et al. 1986)
using the isolate-specific forward (F) primer, F5’- GCCAGAGTGGGACTGAGA–3’, with
the reverse (R) primer, R-5’- GGGTTCGATTCCGGAGAG-3’ to amplify a fragment of
the V. chlorellavorus 16S subunit of the ribosomal DNA gene (rDNA) to yield an expected
size product of 543 base pairs (bp). The following primers were used to detect the presence
of DOE 1412 by PCR-amplification of a fragment of the 16S chloroplast rDNA gene:
F16SW-5’- AGAGTTTGATCMTGGCTCAG-3’ and R16SW-5’- ACGGTTACCTTGT
TACGACTT -3’, yielding an expected amplicon of 1500 bp. (Park et al., in preparation).
The reactions were carried out in a final volume of 25 μL, containing 12.5 μL of JumpStart
RED Taq ReadyMix Reaction Mix (P0982, Sigma-Aldrich, MO, USA), 0.2 μL of 20 μM
each primer (forward and reverse), nuclease-free water, and 1 μL of DNA template.. The
analogous DOE 1412 and V. chlorellavorus 16S rDNA fragments cloned separately into
the pGEM-T Easy plasmid vector were used as the positive control, respectively, to test for
DNA integrity. The addition of double distilled water to the reaction, instead of the DNA
template, was used as a negative control for the PCR reaction. PCR parameters consisted
of the initial denaturation at 95 °C for 10 min, followed by 25 cycles of amplification at
94 °C for 30 s (denaturation), hybridization at 58 °C for 45 s, and elongation at 72 °C for
78
90 s, and a final extension step at 72 °C for 10 min. PCR amplification reactions were
carried out in a cycler (Mastercycler EP, Eppendorf, Germany). The PCR products were
electrophoresed in a 0.8% (w/v) agarose gel in 1 X TAE buffer (40 mM Tris-OH, 20 mM
acetic acid and 1 mM of EDTA; pH 8.0) at 80 V for 40 min.. A 1-kbp DNA ladder (Cat
No.10787-026, Invitrogen, NY, USA) was used as an internal marker for determining the
size(s) of amplicons. Amplicons and the bands of the ladder were stained using an inert red
dye contained in the JumpStart RED Taq ReadyMix Reaction Mix, and visualized using a
UV imager (Gel Doc XR+, BIO-RAD, CA, USA) with Image Lab software.
2.4 Real-time monitoring of microalgae growth dynamics
The growth dynamics of the DOE 1412 culture were measured using a real-time
OD sensor described in a previous study (Jia et al., 2015, submitted). The absorbance of
the DOE 1412 cells in the algal suspension was measured at the wavelengths, 650 nm, 685
nm, and 780 nm. The absorbance at 780 nm was used to estimate the turbidity of the
suspension, because the green chlorophyll pigment of the microalgal cells does not
absorbance light at this wavelength. Absorbance at 650 and 685 nm was used to measure
the intensity of color associated with the algal chlorophyll (Solovchenko et al. 2011), and
determine algal cell concentration (Das et al. 2011).
The pH (HI1001, Hanna Instruments, USA), electrical conductivity (HI3001,
Hanna Instruments, USA), dissolved oxygen (DO1200/T, Sensorex, USA) and
thermocouple temperature sensors (Type T, Omega Engineering Inc., USA) were placed
in the indoor experimental photobioreactor (PBR), and connected to a data logger
79
(CR3000, Campbell Scientific Inc., UT, USA) for monitoring and control of the culture
system. Each sensor was scanned every second and 10 min averaged data was stored in the
data logger.
2.4.1 Experimental setup for dust test
DOE 1412 was cultivated in a PBR located in an indoor laboratory. A semi-
continuous batch culture of DOE 1412 were conducted for comparison purpose. The ‘test
field dust’ (Nominal 0-70 micron ATD, Powder Technology, Inc., MN, USA) having a
mean diameter of 25.32 μm (σ = 11.8 μm) was used to simulate field dust that blows into
the outdoor raceway in Tucson, Arizona. A total of 4 gms of the test field dust was added
to the PBR during the second batch of semi-continuous culture. The test field dust was
added in 4 occasions with 1 gm added each time. The negative experimental control
consisted of the addition of no dust to the first batch of the semi-continuous culture. The
pH of the algal culture in the PBR was maintained at 7±0.3 by injecting CO2 from a
pressurized liquid CO2 tank into the PBR through a sparger. The OD of the culture was
monitored and logged continuously by the optical sensor at multiple wavelengths.
Microalgae samples were taken 30 min after the introduction of dust to ensure an even
distribution of dust in the PBR. Fifty milliliters of sample from each PBR was used for ash-
free dry weight measurement and OD validation by a bench-top spectrophotometer.
2.4.2 Experimental design for the V. chlorellavorus inoculation
The PBR (as described above) was inoculated with a V. chlorellavorus-free
suspension culture of DOE1412 to achieve an inoculation OD of 0.1 at OD750nm in 5
liters DOE1412 culture volume. The culture was replenished with 500 mL of fresh Pecos
80
medium on the 4th day of the culture to ensure nutrients were not a limiting factor on
microalgae growth. The culture was inoculated with 200 mL of V. chlorellavorus infected
DOE1412 culture on the 5th day of the culture. Half of the biomass was harvested and
replenished with fresh media to the original volume on the 6th day of the culture. The
culture was maintained in the PBR until the biomass (OD reading) decreased by 25% in
cell number was observed. The culture was sampled daily and tested for cell viability using
chlorophyll fluorescent imaging method by the cellometer, which used an excitation
wavelength of 470 nm and an emission wavelength at 535 nm, and the OD was measured
using an off-line bench top spectrophotometer at 650 nm, 685 nm and 780 nm. Both
instruments are described in section 2.2. An aliquot (1 mL) of algal suspension culture was
collected daily from the PBRs and subjected to DNA isolation as described above, and
tested for the presence of V. chlorellovorus by PCR analysis. Three experiment replicates
were conducted.
3. RESULTS AND DISCUSSION
3.1 Dust test
Optical density readings can be affected by the presence of abiotic factors,
including particulates that enter the system, such as dust and other suspended solids,
including algal cells themselves, based on the absorption and/or the scattering of light (Lee
1999). Outdoor raceway systems are more problematic than closed PBRs because dust can
readily be deposited by blowing wind and other local disturbances into the algal suspension
culture system, especially in arid or semi-arid regions of the world.
81
To investigate the sensitivity of the in-line optical sensor to the presence of dust in
an outdoor raceway system, 4 gms of Arizona test dust were added to microalgae cultured
in an indoor PBR in 4 occasions shown in Figure 1. Error! Reference source not found.
listed the percentage of dry mass increase in the PBR due to the addition of test dust and
the increase of OD780. The OD did not increase proportionally to the increase of dry mass,
considering the amount of test dust added to the PBR resulted a 59.7% increase of the total
dry mass. An OD change associated with the introduction of dust was expected that would
be comparable to changes caused by the inadvertent introduction of dust or other
particulates that could cause cell density fluctuations in a natural system. Thus, the
introduction of the test field dust had no apparent effect on the OD reading measured by
the optical sensor.
Table 1. The increase of dry mass in the PBR and corresponding increase of OD 780 due
to the accumulation of field test dust
Test dust in the
PBR (g)
AFDW of DOE
1412 (g L-1)
Test dust
concentration (g L-1)
Increase of
dry mass
Increase
of OD780
1.0 0.386 0.088 22.8% 2.8%
2.0 0.460 0.176 38.3% 3.0%
3.0 0.542 0.264 48.7% 2.1%
4.0 0.590 0.352 59.7% 2.3%
82
.
Figure 1. Dynamics of OD at 650 nm, 685 nm and 780 nm during semi-continuous
culture of DOE 1412 in an indoor PBR. Arizona test dust was added to the culture at four
time points indicated by arrows.
Further analysis showed that the introduction of dust was clearly detectable by
analysis using the first derivative of OD780 (μ OD780). The four distinctive peaks showed
the response of the optical sensor due to the introduction of dust as seen in Figure 2. These
peak signals were resulted from the change in OD780 between two data points by definition.
However, a fluctuation of μ OD780 occurred constantly during the measurement process
due to microalgal cell concentration change. Thus, an algorithm is needed in a monitoring
and control strategy to differentiate the signal fluctuation from the signal peaks caused by
the introduction of the test dust. The difference of two adjacent μ OD780 were calculated (Δ
μ OD780), and a histogram of the absolute value of Δ μ OD780 was plotted in Figure 3. A
83
total of 527 data points were taken during the 2-day period, as shown in Figure 2(b). The
Δ μ OD780 had an average of 0.51 and standard deviation of 0.53. There were 91.8% of Δ
μ OD780 had the value less or equal to 1.2, and 98.1% of Δ μ OD780 had the value less or
equal to 1.6.
Figure 2. (a) First derivative of OD780 during 2 semi-continuous batch culture of DOE
1412. The first batch of culture served as a negative control with no field test dust
introduced. The introduction of field test dust was detectable as 4 distinctive peaks, post-
harvest. (b) The enlarged portion of the 4 peaks in (a) from 7/24 to 7/26.
84
Figure 3. Histogram and cumulative frequency of Δ μ OD780 , which represents the
change of two adjacent μ OD780 from 7/24-7/26.
3.2 V. Chlorellavorus test
A field isolate of V. chlorellavorus was obtained from naturally-infected DOE 1412
cells from an outdoor culture system in Tucson, Arizona (Park et al., in preparation). It
was maintained in a laboratory culture by mixing it with live cells of DOE 1412 maintained
in BG-11 media at 24 ºC with a 12:12 light cycle (Park et al., in preparation). After
confirmation of V. chlorellavorus presence in the culture by polymerase chain reaction
(PCR) (Park et al., in preparation), was used to inoculate a healthy DOE 1412 culture at
late linear growth phase. The culture was replenished with fresh media prior to the
inoculation to eliminate the stress on microalgae from lack of nutrients (Figure 4). The
growth of DOE 1412 immediately slowed down after the V. chlorellavorus inoculation.
85
The presence of V. chlorellavorus presence in the culture after inoculation of the
suspension culture growing in the PBR was confirmed by PCR (
86
Table 2). To reduce the effect of light attenuation on the growth of DOE 1412 due
to high cell density, 50% of the culture was harvested on day 6, post-inoculation, and
replaced with fresh media one day after the V. chlorellavorus inoculation. The suspension
culture remained growing (based on increasing OD of live cells) for 5 days before the algal
population rapidly declined. During that period, the CO2 supply was interrupted for 14
hours from 5/13 to 5/14, which resulted in the decrease of algal cell density, as shown in
Figure 4. To confirm that the attenuated CO2 supply was a possible cause of the rapid
decline of the algal culture, instead of to attack by V. chlorellovorus, the experiment was
repeat 3 times. A similar growth pattern of DOE 1412 was observed for each of the
replicated experiments, based on the assessment of algal cell viability, which was measured
as the percentage of live cells and the OD685/OD780 ratio were plotted together with OD780,
as shown in Figure 5. The concentration of live DOE 1412 cells reached 99.4% on the
second day of the culture and continued to drop throughout the first the batch.
Concentration of live cells was reduced by 8% after the harvest, but recovered to 90% two
days thereafter. This pattern is thought to reflect the re-resuspension of dead cells from the
bottom of the PBR during harvesting of DOE 1412, a scenario that is supported by a sudden
decrease in the OD685/OD780 ratio at the time of harvest. Concentration of live cells began
to decrease two days prior to the rapid death of the culture, the same time point at which a
steep decrease in the OD685/OD780 ratio also was observed, as is shown in (Figure 5). This
observation suggested the occurrence of decreasing chlorophyll content of the algae cells,
and is reminiscent of a similar pattern reported by Nedbal et al. (2008).
87
Accordingly, the predatory life cycle of V. chlorellavorus, as described by Soo et
al. (2015), involves the utilization of cytoplasmic contents, including the chlorophyll, and
its depletion is indicative of the cell contents having been released and/or consumed by the
bacteria, prior to leaving the destroyed but intact cell as a large vacuolated area and
membranous structures 5 to 7 days after V. chlorellavorus attachment. The dead cells
however contribute to the light absorbance at 780 nm (NIR), but not at 685 nm (red).
Therefore, the sudden decrease of the OD685/OD780 ratio was found to serve as an indicator
of the impending destruction of the suspension culture of DOE 1412 associated with V.
chlorellavorus predation.
88
Figure 4. OD at 650 nm, 685 nm and 780 nm of semi-continuous growth of the
DOE1412 suspension culture inoculated with V. chlorellavorus in the indoor
experimental PBR system. Events of fresh media addition, V. chlorellavorus inoculation,
harvesting, and the interruption of CO2 supply are indicated by an arrow.
89
Table 2. Results of PCR detection of V. chlorellavorus and DOE 1412, for which DOE
1412 presence was confirmed in all PBR samples that were inoculated with the
bacterium. The presence of measurable V. chlorellavorus was detected only after V.
chlorellavorus inoculation.
Date V. chlorellavorus DOE 1412 Date V. chlorellavorus DOE 1412
5/6 - + 6/11 - +
5/7 - + 6/12 - +
5/8 - + 6/13 - +
5/9 - + 6/14 - +
5/10 - + 6/15 - +
5/11 + + 6/16 + +
5/12 + + 6/17 + +
5/13 + + 6/18 + +
5/14 + + 6/19 + +
5/15 + + 6/20 + +
5/16 + + 6/21 + +
5/17 + + 6/22 + +
5/18 + + 6/23 + +
90
Figure 5. Cell viability and OD685/OD780 trend change during the semi-continuous culture
of DOE 1412 inoculated with V. chlorellavorus in the indoor, experimental PBR system.
4. CONCLUSIONS
A multi-wavelength laser diode based optical sensor was evaluated for its ability to
detect an abiotic and a biotic environmental disturbance, before it was possible to detect
such disturbances by visual inspection. A microalgal suspension culture of C. sorokiniana
isolate DOE 1412 was cultivated in a controlled PBR system and experimentally perturbed
by the addition of ‘test field dust’ (abiotic) and a highly virulent predator of DOE 1412 and
several other Chlorella spp., V. chlorellavorus. The optical sensor was capable of
91
estimating cell concentration and changes in the physiological status of the microalgae
culture in real-time. The sensitivity of the sensor to the presence of dust and dirt in a culture
system was tested using test field dust that resembles the size distribution of dust from
agriculture lands in Arizona. The sensor showed low sensitivity to the presence of the test
dust when the test dust comprised approximately 60% of the AFDW of microalgae
biomass. However, the sensor was able to clearly detect (indicate, based on the first
derivative output) the event of the introduction of the test dust to the culture system. The
decline and death of the DOE 1412 culture associated with the introduction of the predator
V. chlorellavorus to the PBR, was detected (indicated) repeatedly by a decrease in the
OD685/OD780 ratio, and by concentration of live cells 2 days prior to the rapid decline, or
‘crash’ of the suspension culture. The parameters measured in this study were found to
serve as effective indicators for the early detection of an impending loss of a microalgal
culture due to the invasion and subsequent predation by V. chlorellavorus, a scenario that
was confirmed by molecular detection of the predator using V. chlorellavorus-specific PCR
primers. This optical sensor described here, and designed to monitor the growth dynamics
of microalgae in real-time, was capable of the early-detection of the impending rapid
decline of the culture due to biotic invasion e.g. by V. chlorellavorus, while at the same
time, it was much less sensitive to the abiotic dust introduced into the experimental PBR
culture system used here. This is possibly due to a different optical absorption property of
the abiotic dust from that of microalgae cells.
92
5. REFERENCES
Benderliev, K. M., I. D. Pouneva, and N. I. Ivanova. 1993. “Fungicide Effect of Triton-N
on Phlyctidium.” Biotechnology Techniques 7 (5): 335–38.
Briassoulis, D, P Panagakis, M Chionidis, D Tzenos, A Lalos, C Tsinos, K Berberidis,
and A Jacobsen. 2010. “An Experimental Helical-Tubular Photobioreactor for
Continuous Production of Nannochloropsis sp.” Bioresource Technology 101 (17):
6768–77.
Carlsson, A., J. Beilen van, R. Möller, D. Clayton, and D. Bowles. 2007. Micro- and
Macro-Algae: Utility for Industrial Applications : Outputs from the EPOBIO
Project. Edited by Anders S. Carlsson. CPL Press.
Carney, Laura T, and Todd W Lane. 2014. “Parasites in Algae Mass Culture.” Frontiers
in Microbiology 5 (January): 278.
Chisti, Yusuf. 2007. “Biodiesel from Microalgae.” Biotechnology Advances 25 (3).
Elsevier Inc.: 294–306.
Coder, David M., and Lynda J. Goff. 1986. “The Host Range of the Chlorellavorous
Bacterium (‘Vampirovibrio chlorellavorus’).” Journal of Phycology 22 (4): 543–46.
Danquah, Michael K., Li Ang, Nyomi Uduman, Navid Moheimani, and Gareth M. Forde.
2009. “Dewatering of Microalgal Culture for Biodiesel Production: Exploring
Polymer Flocculation and Tangential Flow Filtration.” Journal of Chemical
Technology & Biotechnology 84 (7): 1078–83.
Das, Probir, Wang Lei, Siti Sarah Aziz, and Jeffrey Philip Obbard. 2011. “Enhanced
Algae Growth in Both Phototrophic and Mixotrophic Culture under Blue Light.”
Bioresource Technology 102 (4). Elsevier Ltd: 3883–87.
Day, John G, Naomi J Thomas, Undine E M Achilles-Day, and Raymond J G Leakey.
2012. “Early Detection of Protozoan Grazers in Algal Biofuel Cultures.”
Bioresource Technology 114 (June): 715–19.
Gerphagnon, Mélanie, Delphine Latour, Jonathan Colombet, and Télesphore Sime-
Ngando. 2013. “A Double Staining Method Using SYTOX Green and Calcofluor
White for Studying Fungal Parasites of Phytoplankton.” Applied and Environmental
Microbiology 79 (13): 3943–51.
Harun, Razif, Manjinder Singh, Gareth M. Forde, and Michael K. Danquah. 2010.
“Bioprocess Engineering of Microalgae to Produce a Variety of Consumer
Products.” Renewable and Sustainable Energy Reviews 14 (3): 1037–47.
93
Jia, Fei, Murat Kacira, and Kimberly L. Ogden. 2015. “Multi-Wavelength Based Optical
Density Sensor for Autonomous Monitoring of Microalgae.” Sensors.(submitted)
Jones, S B, Y Zhu, D B Anderson, R T Hallen, D C Elliott, A J Schmidt, K O Albrecht,
and T R Hart. 2014. “Process Design and Economics for the Conversion of Algal
Biomass to Hydrocarbons: Whole Algae Hydrothermal Liquefaction and
Upgrading.” Pacific Northwest National Laboratory. Vol. PNNL-23227. Richland,
WA.
Knuckey, Richard M., Malcolm R. Brown, René Robert, and Dion M.F. Frampton. 2006.
“Production of Microalgal Concentrates by Flocculation and Their Assessment as
Aquaculture Feeds.” Aquacultural Engineering 35 (3): 300–313.
Lammers, P., M. Huesemann, W. Boeing, D.B. Anderson, R.G. Arnold, X. Bai, M.
Bohle, et al. 2015. “Review of the Cultivation Program within the National Alliance
for Advanced Biofuels and Bioproducts.” Algal Research.(submitted)
Lee, Choul-Gyun. 1999. “Calculation of Light Penetration Depth in Photobioreactors.”
Biotechnology and Bioprocess Engineering 4 (1): 78–81.
Li, Yanqun, Mark Horsman, Nan Wu, Christopher Q Lan, and Nathalie Dubois-calero.
2008. “Biofuels from Microalgae.” Biotechnology Progress 24 (4): 815–20.
Maniatis, Thomas, Edward F. Fritsch, and Joseph Sambrook. 1982. Molecular Cloning:
A Laboratory Manual. Cold Spring Harbor, NY: Cold Spring Harbor Laboratory
Press.
Marxen, Kai, KlausHeinrich Vanselow, Sebastian Lippemeier, Ralf Hintze, Andreas
Ruser, and Ulf-Peter Hansen. 2005. “A Photobioreactor System for Computer
Controlled Cultivation of Microalgae.” Journal of Applied Phycology 17 (6).
Springer Netherlands: 535–49.
Mata, Teresa M., António a. Martins, and Nidia. S. Caetano. 2010. “Microalgae for
Biodiesel Production and Other Applications: A Review.” Renewable and
Sustainable Energy Reviews 14 (1): 217–32.
Mullis, K, F Faloona, S Scharf, R Saiki, G Horn, and H Erlich. 1986. “Specific
Enzymatic Amplification of DNA in Vitro: The Polymerase Chain Reaction.” Cold
Spring Harbor Symposia on Quantitative Biology 51 Pt 1 (January): 263–73.
Nedbal, Ladislav, Martin Trtílek, Jan Cervený, Ondrej Komárek, and Himadri B Pakrasi.
2008. “A Photobioreactor System for Precision Cultivation of Photoautotrophic
Microorganisms and for High-Content Analysis of Suspension Dynamics.”
Biotechnology and Bioengineering 100 (5): 902–10.
94
Park, Sang-Hyuck, Seth Alan Steichen, Xuehui Li, Kimberly Ogden, and Judith K.
Brown. “Vampirovibrio Chlorellavorous Detection and Association with Rapid
Decline of Chlorella Sorokoriana in an Open Algal Cultivation System.”(in
progress)
Rego, D, L M Redondo, V Geraldes, L Costa, J Navalho, and M T Pereira. 2015.
“Control of Predators in Industrial Scale Microalgae Cultures with Pulsed Electric
Fields.” Bioelectrochemistry (Amsterdam, Netherlands) 103 (June): 60–64.
Richardson, James W., Myriah D. Johnson, and Joe L. Outlaw. 2012. “Economic
Comparison of Open Pond Raceways to Photo Bio-Reactors for Profitable
Production of Algae for Transportation Fuels in the Southwest.” Algal Research 1
(1): 93–100.
Sandnes, J M, T Ringstad, D Wenner, P H Heyerdahl, T Källqvist, and H R Gislerød.
2006. “Real-Time Monitoring and Automatic Density Control of Large-Scale
Microalgal Cultures Using near Infrared (NIR) Optical Density Sensors.” Journal of
Biotechnology 122 (2): 209–15.
Shurin, Jonathan B, Rachel L Abbott, Michael S Deal, Garfield T Kwan, Elena Litchman,
Robert C McBride, Shovon Mandal, and Val H Smith. 2013. “Industrial-Strength
Ecology: Trade-Offs and Opportunities in Algal Biofuel Production.” Ecology
Letters 16 (11): 1393–1404.
Solovchenko, Alexei, Inna Khozin-Goldberg, Lee Recht, and Sammy Boussiba. 2011.
“Stress-Induced Changes in Optical Properties, Pigment and Fatty Acid Content of
Nannochloropsis Sp.: Implications for Non-Destructive Assay of Total Fatty Acids.”
Marine Biotechnology 13 (3). Springer-Verlag: 527–35.
Soo, Rochelle M., Ben J. Woodcroft, Donovan H. Parks, Gene W. Tyson, and Philip
Hugenholtz. 2015. “Back from the Dead; the Curious Tale of the Predatory
Cyanobacterium Vampirovibrio Chlorellavorus.” PeerJ 3 (May). PeerJ Inc.: e968.
Spolaore, Pauline, Claire Joannis-Cassan, Elie Duran, and Arsène Isambert. 2006.
“Commercial Applications of Microalgae.” Journal of Bioscience and
Bioengineering 101 (2): 87–96.
Thomasson, Alex J., Y. Yao, Y. Ge, and R. Sui. 2010. “Toward On-Line Measurement of
Algal Properties.” American Society of Agricultural and Biological Engineers 6:
4406–13.
Velicer, Gregory J, and Helena Mendes-Soares. 2009. “Bacterial Predators.” Current
Biology : CB 19 (2): R55–56.
95
Waller, Peter, Randy Ryan, Murat Kacira, and Peiwen Li. 2012. “The Algae Raceway
Integrated Design for Optimal Temperature Management.” Biomass and Bioenergy
46 (November): 702–9.
Webb, Rebecca, Annie Philips, Rick Speare, Joanne Connolly, and Lee Berger. 2012.
“Controlling Wildlife Fungal Disease Spread: In Vitro Efficacy of Disinfectants
against Batrachochytrium Dendrobatidis and Mucor Amphibiorum.” Diseases of
Aquatic Organisms 99 (2): 119–25.
Woo, J-H, and Y Kamei. 2003. “Antifungal Mechanism of an Anti-Pythium Protein
(SAP) from the Marine Bacterium Streptomyces Sp. Strain AP77 Is Specific for
Pythium Porphyrae, a Causative Agent of Red Rot Disease in Porphyra spp.”
Applied Microbiology and Biotechnology 62 (4): 407–13.
Zhu, C J, and Y K Lee. 1997. “Determination of Biomass Dry Weight of Marine
Microalgae.” Journal of Applied Phycology 9 (2). Kluwer Academic Publishers:
189–94.
96
APPENDIX C - AUTONOMOUS MONITORING AND CONTROL OF
MICROALGAE PRODUCTION SYSTEM
F. Jia, M. Kacira
Journal TBD
ABSTRACT
An automated monitoring and control system for microalgae production application
was developed and tested on an open pond raceway. The key component of the system was
an inline optical sensor that measures the biomass concentration in real-time.
Environmental parameters such as pH, electrical conductivity (EC), dissolved oxygen
(DO), temperature (T) and photosynthetic active radiation (PAR) were monitored and
recorded. The harvesting procedure was fully automated through feedbacks from the
optical sensor and water depth sensors. Resource inputs including water, nutrients, CO2
and electrical power were accounted for resource management purposes. Internet
connectivity was enabled on the microcontroller so that the microalgae production system,
key culture growing and aerial environmental conditions, and resources used can be
remotely monitored and controlled.
KEYWORDS:
Real-time monitoring and control, automation of microalgae production, inline
optical sensor, resource management
97
1. INTRODUCTION
Large scale microalgae production is costly and laborious (Lee 2001). In order to
maximize the productivity of a microalgae cultivation system, the resource and labor input
need to be minimized while the cultivation conditions need to be maintained at an optimum
level to achieve the maximum biomass production rate. Automation of the cultivation
system can significantly reduce the operational cost of the production that includes
harvesting, fertilizing and culture volume maintenance. Harvesting is an important
procedure to maintain the biomass concentration in an optimum range for rapid microalgae
growth and to prevent or reduce economic losses in case of contamination. Real-time
monitoring and control provides the platform to acquire the environmental and
physiological dynamics of a microalgae culture system that will be used for control and
decision making purposes. Measurements of biological variables, including biomass
concentration, cell size, population composition (i.e. concerns with contamination),
pigments and lipid content, are especially desirable because they are the direct indicators
of the dynamics of a microalgae culture system.
There have been few applications of microalgae harvesting control based on the
feedback from real-time biomass concentration sensors. Sandnes et al. (2006)
demonstrated automatic density control of microalgae culture using a custom made near
infrared (NIR) optical density sensor. Three tubular photobioreactor (PBR) biofence
systems were used to cultivate Nannochloropsis oceanica in a climate-regulated
greenhouse. The pH of the culture was regulated between 7.3 and 7.8 by a controller unit
that records the pH as well. Temperature and solar radiation were also measured every 15
98
seconds and averaged over 5 minutes. A turbidostatic culture control was demonstrated by
injecting water/nutrients mix into the PBR on demand to maintain a constant optical
density. The volume of the effluent of the culture was used to calculate the biomass
productivity. Briassoulis et al. (2010) designed and constructed an automated harvesting
system based on a flow-through cell concentration sensor integrated into a helical-tubular
PBR. The pH of the culture was controlled between 8.3 and 8.6 by supplying CO2 through
the air phase of the system. The temperature was kept between 23.4 and 28.3 ⁰C through a
cooling system. The harvesting system operates based on the cell concentration estimated
from the flow-through sensor. An average 13.3% of total volume of the culture was
harvested daily by the automated harvesting system during an 8 day experiment. The mean
cell density was equal to 337.2 ± 6.0 x 10⁶ cells mL-1. Nedbal et al. (2008) demonstrated
turbidostatic control of microalgae growth in a commercially available flat panel PBR by
a built-in densitometer. A peristaltic pump was automatically controlled by one of the
programmable bioreactor outputs (OD680) to add fresh medium so that the optical density
of the growing culture was maintained in a preset range (±2.5 %). The productivity was
calculated for the curve of OD680 slope between the dilutions. The pH was regulated by
injecting air enriched with 2% CO2. Temperature, irradiance were also regulated by the
PBR. Marxen et al. (2005) developed a bioreactor system for the cultivation of the
microalgae Synechocystis sp. PCC6803 under controlled physiological conditions. A
turbidostatic process was achieved by diluting the algal suspension in the reactor with the
feedback from an optical density sensor that measures light absorbance at 870 nm to
maintain the biomass concentration at a constant level. The pH was regulated by a pH
99
controller. Irradiance intensity and irradiance quality were adjustable through the process
control system. However, none of the control applications listed above were carried out in
an open pond raceway system. There were studies focused on the control of environmental
conditions of microalgae cultivation in raceways. San Pedro et al. (2015) found that
dilution rate has a high impact on maximum productivity of microalgae in raceway ponds.
Pawlowski et al. (2014) utilized a Generalized Predictive Controller (GPC) aiming to
improve the pH control accuracy and save control resources for a raceway reactor.
However, there was no harvesting control strategies implemented that was based on the
biomass concentration.
In this study, a novel multi-wavelength based inline optical sensor that measures
biomass concentration in real-time along with sensors that measure key parameters for
microalgae production were integrated into an open pond raceway for automation of
operation as well as resource input management.
2. MATERIAL AND METHODS
2.1 Cultivation conditions and organisms
Chlorella sorokiniana Beijerinck, 1890 (DOE 1412) received from Pacific
Northwest National Laboratory, WA, USA (Jones et al. 2014) was cultivated in local well
water enriched with Pecos medium, trace metal solution and 5g L-1 NaCl. The Pecos
medium contained 0.1 g L-1 urea ((NH2)2CO), 0.012 g L-1 MgSO4•7H2O, 0.035 g L-1
NH4H2PO4, 0.175 g L-1 Potash (KCl), 0.0054 g L-1 FeCl3 and 0.02 g L-1 Na2CO3. The
culture was maintained in an open pond paddle wheel raceway (Figure 6) with a surface
100
area of 3 m2 located at Algae Research Facility in University of Arizona, Tucson, Arizona,
USA. The pH of the culture was maintained at 8±0.05.
Figure 6. An open pond raceway with integration of inline optical sensors for real-time
microalgae growth monitoring and control application.
2.2 Open pond raceway monitoring and control
The growth dynamics of the microalgae culture was measured using a real-time
optical density sensor (Figure 7) developed in a previous study (Jia et al., 2015). The device
measured light absorbance of microalgae cells at 650 nm, 685 nm and 780 nm. Since
sensor electronics maybe sensitive to environmental conditions, the optical sensor with its
housing and the datalogger were placed in a location at the outdoor raceway site to
minimize direct exposure to sunlight. The laser output is also temperature dependent (5-15
mV/ oC, vary with lasers). Therefore a temperature control unit was installed and consisted
of a small heater plate (HT24S, Thorlabs, NJ, USA) and heat sink (55 mm Fan Heatsink,
USA) to maintain a constant temperature (40±0.1 ⁰C )inside the sensor box. This also
ensured a constant laser power output. Electrical conductivity (HI3001, Hanna
Instruments, USA), pH (HI1001, Hanna Instruments, USA), dissolved oxygen (DO1200/T,
101
Sensorex, USA), photosynthetically active radiation (PAR) (SQ-110, Apogee instruments,
USA), temperature (Type T, Omega Engineering Inc., USA) and water depth sensors (PN-
12110215TC-12, MILONE Technologies, NJ, USA) were used to monitor the
environmental conditions of the culture system (Figure 8). Each measurement was taken
every second and 10 minute and averaged data was stored in a datalogger and
microcontroller (CR3000, Campbell Scientific Inc., UT, USA). The real-time data was then
transmitted to a central control station through Ethernet communication.
Figure 7. Component layout of the optical sensor unit. Three laser diodes at wavelengths
of 650 nm, 685 nm and 780 nm were aligned with 3 photodiodes with a detection range
of 350-1100 nm. The flow chamber window was perpendicular to the laser beam.
102
Figure 8. Schematic diagram of the open pond raceway monitoring and control system.
The pH, electrical conductivity (EC), temperature (T), dissolved oxygen (DO), water
depth (WD), optical density of the culture (OD) and photosynthetic active radiation
(PAR) are monitored and stored in the data acquisition system. The microcontroller
regulates CO2 injection base on pH value. Optical density values measured from the
inline OD sensor controls the harvesting. The holding tank temporarily contains the
harvested microalgae for further processing. Water and nutrients injection were
controlled by water depth and optical density of the culture. The data acquisition and
microcontroller communicates with the control station through a local network.
The operation of the raceway was automated in terms of pH control, water level
control and biomass harvesting. The control of pH was achieved by controlling the
injection of 95% CO2 by the microcontroller based on the instantaneous pH value feedback
from the pH sensor (Figure 9). The CO2 injection was turned off during night time. The
CO2 usage was measured by a CO2 mass flow meter in liters and accumulated amount was
monitored and recorded by the monitoring algorithm and the datalogger. Water depth of
the culture was controlled by a liquid level sensor through a feedback control loop shown
Harvest pump
PAR
Data acquisition and
microcontroller
pH EC T DO WD
CO2
Water
Nutrients
OD
Holding tank
Router
Control station
Open pond raceway
103
in Figure 10. The water level was compared to the set point (10 cm / 15 cm) at 8 am every
morning. The water was added to the desired level through a solenoid valve when the level
was lower than the set point. The harvesting of the culture was automated by the feedback
from OD780 of the microalgae measured by the inline optical sensor (Figure 11). A harvest
pump placed in the raceway was activated when OD780 of the culture exceeded 2.5
corresponding to AFDW of 0.57 g L-1. The harvest was deactivated when water level in
the raceway was less than 5 cm (50 % of the culture volume is harvested) followed by
addition of nutrients solution concentrated and water simultaneously. Both were shut off
once water level reached to the set point of 15 cm mark based on the sensor feedback.
Water and nutrients usage were calculated by multiplying the time of addition and the flow
rates of each in liters. The amount of biomass harvested in grams was calculated by
multiplying the biomass concentration (g L-1) before the harvest and the harvest volume
(L). The paddle wheel in the raceway system was operated 24 hours a day for continuous
culture mixing except for the duration of water addition and harvesting. This was for an
accurate water level reading from the water level sensor. The energy usage for the paddle
wheel was calculated based on the power consumption from the driving motor in kWh. The
experiment was conducted on 7/9/2015 for a total of 10 days.
104
Figure 9. Logic flow chart of pH control in the culture system
Figure 10. Logic flow chart of automated water addition in the culture system
Figure 11. Logic flow chart of automated biomass harvesting and nutrients addition in
the culture system.
pH measurement
by pH meterpH > 8.05?
Start CO2
injection
pH < 8.00?Stop CO2
injection
No
Yes
YesNo
Calculated
accumulative
CO2 volume
105
2.3 Offline biomass concentration measurement
Biomass concentration of microalgae was determined by both cell counting and
ash-free dry weight (AFDW) measurements. Cell suspension was diluted to a concentration
between 106 and 107 cells mL-1 for cell counting by a neubauer chamber hemocytometer
(Hy-Lite Ultra-plane, Clayadams, USA) under a microscope (XSZ-138, AOK International
Group Ltd., China). The AFDW of the cells was measured following the method described
by Zhu & Lee (1997). The light absorbance of the cells suspension was measured at 650,
685, 750 and 780 nm by a spectrophotometer (DR 3800, HACH, USA) using a 10 mm
light path length cuvette. Samples were diluted with deionized water when necessary to
keep the absorbance reading below 0.5.
3. RESULTS AND DISCUSSION
The cultivation of DOE 1412 in an open pond raceway was monitored and
automated by the control system. The optical density dynamics of the culture at 685 nm
and 780 nm were shown in Figure 12. The real-time optical density shows repeatedly an
increase of optical density indicating the biomass increase during the day time due to
photosynthesis. A small decrease in optical density was observed during the nighttime
since photosynthetic microorganisms metabolize intracellular carbohydrate to sustain their
metabolic activity as described by Ogbonna and Tanaka (1996). Sudden decreases of
optical density of the culture due to water addition at 8 am daily and one biomass harvesting
performed on 7/15 were clearly shown in the figure. The temperature of the sensor was
controlled at 40±0.1 ⁰C to ensure a constant laser power output (Figure 12). The
accumulated water and CO2 input and the corresponding water level and pH change were
106
shown in Figure 13(a) and 8(b) respectively. Water consumption due to evaporation
averaged 70 L m-2 day-1 excluding the amount of water added after the harvest which was
280 L. CO2 consumption averaged 53.3 L m-2 day-1 during the culture except for the
interruption of CO2 supply on 7/11 and 7/12. This resulted in unregulated pH and a decrease
of productivity due to no CO2 supply during the 2 days. Twenty liters of 15X concentrated
nutrient solution was added to replenish the culture medium. The electrical energy
consumption due to operation of paddle wheel was 0.21 kWh per day. The total amount of
dry biomass produced during the 10 day period was 306.7 g. This resulted in a productivity
of 10.2 g m-2 day-1 dry biomass in an open pond raceway system. The CO2 consumption
was 6.86 L per gram of microalgal dry mass produced. The dynamic change of
environmental parameters were measured and presented in Figure 14. The temperature of
the raceway fluctuated from 20 to 35 ⁰C daily. The concentration of dissolved oxygen
increased in the daytime as a result of photosynthesis. The automated microalgae
production monitoring and control system was able to operate the raceway with no labor
input on water maintenance and harvesting procedures. All resource inputs were accounted
for further calculation of overall productivity of the raceway.
Table 1. Summary of resource use for DOE 1412 cultivation in open pond raceway.
Average water
consumption
( L m-2 day-1 )
Average CO2
consumption
( L m-2 day-1 )
Average
electrical power
consumption
(kWh m-2 day-1 )
Productivity
( g m-2 day-1 )
CO2
consumption
(L g dry
biomass-1)
70 53.3 0.69 10.2 6.86
107
Figure 12. Optical density change of DOE 1412 in open pond raceway over 10 days.
Black arrows indicate events of water addition and biomass harvesting. The sensor
temperature was regulated and maintained at 40⁰C.
108
Figure 13. (a) Water level of the raceway and the cumulative water usage over 10 days.
The initial water level was set at 10 cm and increased to 15 cm after the harvest. (b) pH
of the culture and the cumulative CO2 usage over 10 days. There CO2 supply was
interrupted for 2 days from 7/11 to 7/13, resulted in an unregulated pH during that time
period.
Figure 14. Photosynthetic active radiation (PAR), raceway temperature and dissolved
oxygen dynamic of the system over 10 days.
109
4. CONCLUSIONS
The inline optical sensor integrated microalgae production monitoring and control
system successfully monitored the dynamics of microalgae growth, key environmental
parameter (pH, EC, DO, T, PAR) and automated the operation of an open pond raceway.
The system regulated the volume of the raceway by using a water depth sensor. Being able
to measure the biomass concentration of microalgae in real-time, the harvesting procedure
was fully automated by utilizing the feedback from the optical sensor and the water depth
sensor. All the resource input for the raceway operation were monitored, recorded,
controlled, and the continuous data and key culture environment and aerial data were made
available for users to account and determine the productivity of the system in real-time and
to better manage the resource input for further improvement of the raceway.
5. REFERENCES
Briassoulis, D, P Panagakis, M Chionidis, D Tzenos, A Lalos, C Tsinos, K Berberidis,
and A Jacobsen. 2010. “An Experimental Helical-Tubular Photobioreactor for
Continuous Production of Nannochloropsis sp.” Bioresource Technology 101 (17):
6768–77.
Jia, Fei, Murat Kacira, and Kimberly L. Ogden. 2015. “Multi-Wavelength Based Optical
Density Sensor for Autonomous Monitoring of Microalgae.” Sensors.(submitted)
Jones, S B, Y Zhu, D B Anderson, R T Hallen, D C Elliott, A J Schmidt, K O Albrecht,
and T R Hart. 2014. “Process Design and Economics for the Conversion of Algal
Biomass to Hydrocarbons: Whole Algae Hydrothermal Liquefaction and
Upgrading.” Pacific Northwest National Laboratory. Vol. PNNL-23227. Richland,
WA.
Lee, Yuan-kun. 2001. “Microalgal Mass Culture Systems and Methods : Their Limitation
and Potential.” Journal of Applied Phycology 13: 307–15.
110
Marxen, Kai, KlausHeinrich Vanselow, Sebastian Lippemeier, Ralf Hintze, Andreas
Ruser, and Ulf-Peter Hansen. 2005. “A Photobioreactor System for Computer
Controlled Cultivation of Microalgae.” Journal of Applied Phycology 17 (6).
Springer Netherlands: 535–49.
Nedbal, Ladislav, Martin Trtílek, Jan Cervený, Ondrej Komárek, and Himadri B Pakrasi.
2008. “A Photobioreactor System for Precision Cultivation of Photoautotrophic
Microorganisms and for High-Content Analysis of Suspension Dynamics.”
Biotechnology and Bioengineering 100 (5): 902–10.
Ogbonna, James C., and Hideo Tanaka. 1996. “Night Biomass Loss and Changes in
Biochemical Composition of Cells during Light/dark Cyclic Culture of Chlorella
Pyrenoidosa.” Journal of Fermentation and Bioengineering 82 (6): 558–64.
Pawlowski, A, J L Mendoza, J L Guzmán, M Berenguel, F G Acién, and S Dormido.
2014. “Effective Utilization of Flue Gases in Raceway Reactor with Event-Based
pH Control for Microalgae Culture.” Bioresource Technology 170 (October): 1–9.
San Pedro, A., C.V. González-López, F.G. Acién, and E. Molina-Grima. 2015. “Outdoor
Pilot Production of Nannochloropsis Gaditana: Influence of Culture Parameters and
Lipid Production Rates in Raceway Ponds.” Algal Research 8 (March): 205–13.
Sandnes, J M, T Ringstad, D Wenner, P H Heyerdahl, T Källqvist, and H R Gislerød.
2006. “Real-Time Monitoring and Automatic Density Control of Large-Scale
Microalgal Cultures Using near Infrared (NIR) Optical Density Sensors.” Journal of
Biotechnology 122 (2): 209–15.
Zhu, C J, and Y K Lee. 1997. “Determination of Biomass Dry Weight of Marine
Microalgae.” Journal of Applied Phycology 9 (2). Kluwer Academic Publishers:
189–94.