33
Multivariate Mx Exercise D Posthuma Files: \\danielle\Multivariate
| Date post: | 14-Dec-2015 |
| Category: |
Documents |
| Upload: | samir-norland |
| View: | 242 times |
| Download: | 1 times |
Multivariate Mx Exercise
D PosthumaFiles: \\danielle\Multivariate
TC 19 - Boulder 2006
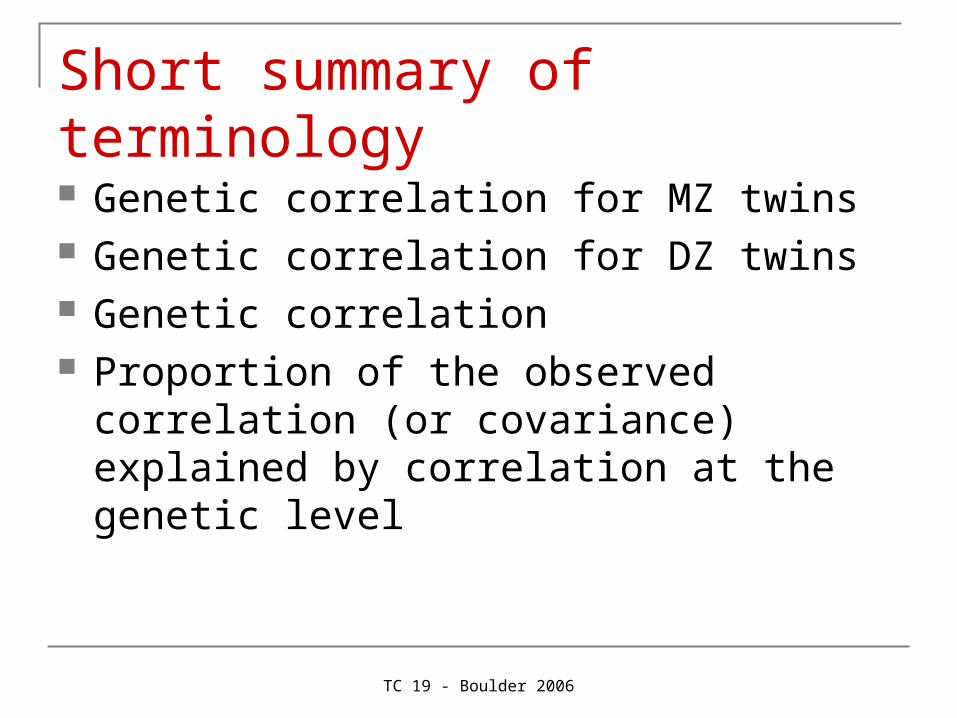
Short summary of terminology Genetic correlation for MZ twins Genetic correlation for DZ twins Genetic correlation Proportion of the observed correlation (or
covariance) explained by correlation at the genetic level
TC 19 - Boulder 2006
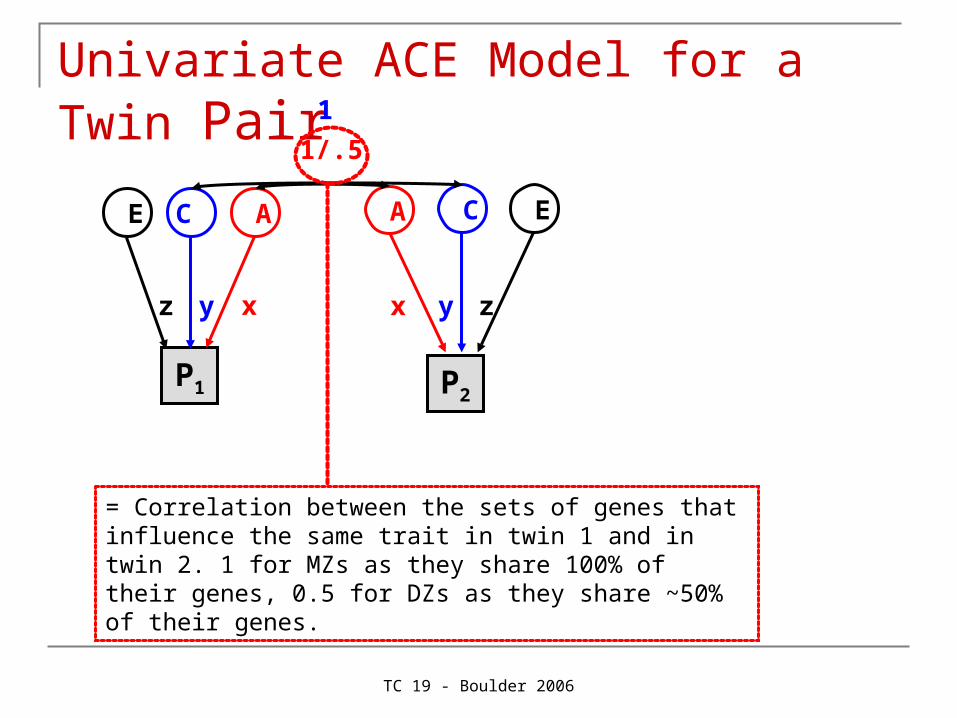
Univariate ACE Model for a Twin Pair
P2
1
P1
A AC C E E
1/.5
xy zyxz
= Correlation between the sets of genes that influence the same trait in twin 1 and in twin 2. 1 for MZs as they share 100% of their genes, 0.5 for DZs as they share ~50% of their genes.
TC 19 - Boulder 2006
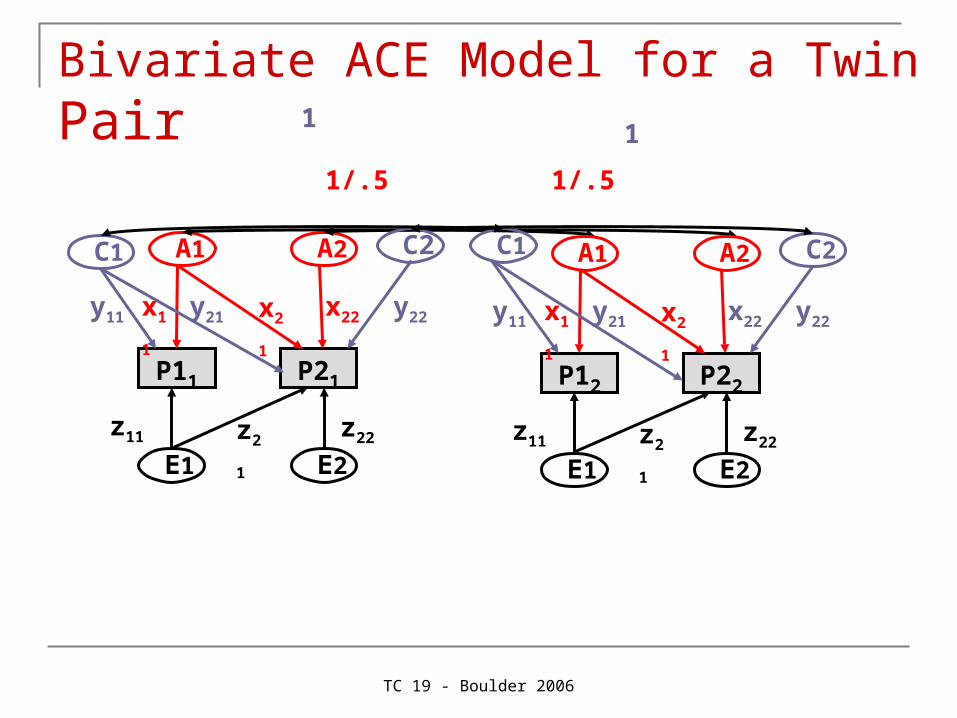
y22
1/.5 1/.5
A1 A2
y21
P11 P21
x22x21
E1 E2
z11 z21z22
C1 C2
y11 y22x11
A1 A2
y21
P12 P22
x22x21
E1 E2
z11 z21z22
C1 C2
y11 x11
1 1
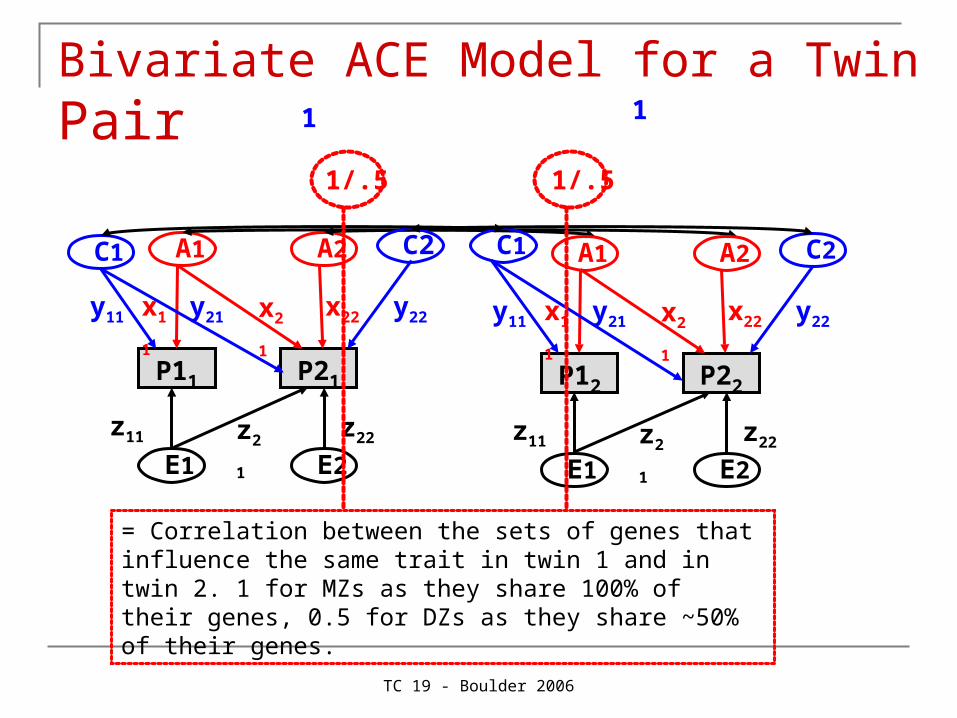
= Correlation between the sets of genes that influence the same trait in twin 1 and in twin 2. 1 for MZs as they share 100% of their genes, 0.5 for DZs as they share ~50% of their genes.
Bivariate ACE Model for a Twin Pair
TC 19 - Boulder 2006
y22
1/.5 1/.5
A1 A2
y21
P11 P21
x22x21
E1 E2
z11 z21z22
C1 C2
y11 y22x11
A1 A2
y21
P12 P22
x22x21
E1 E2
z11 z21z22
C1 C2
y11 x11
11
Bivariate ACE Model for a Twin Pair
TC 19 - Boulder 2006
1/.5 1/.5
A1 A2
x11
P11 P21
x22x21
A1 A2
x11
P12 P22
x22x21
Twin 1 Twin 2
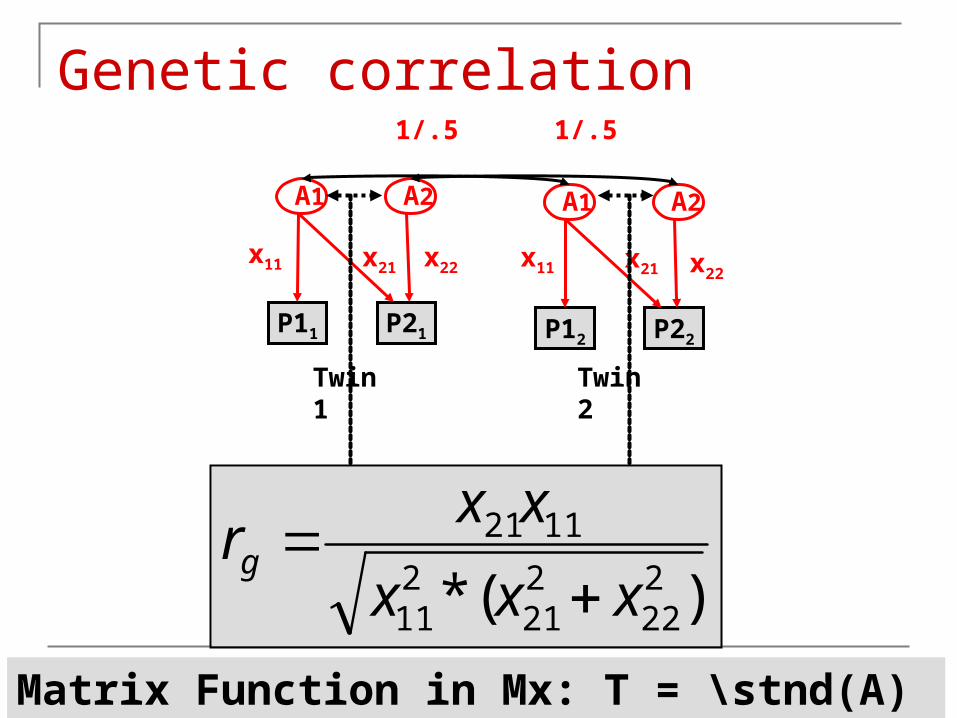
)(* 222
221
211
1121
xxx
xxrg
Genetic correlation
Matrix Function in Mx: T = \stnd(A)
TC 19 - Boulder 2006
1/.5 1/.5
A1 A2
x11
P11 P21
x22
A1 A2
x11
P12 P22
x22
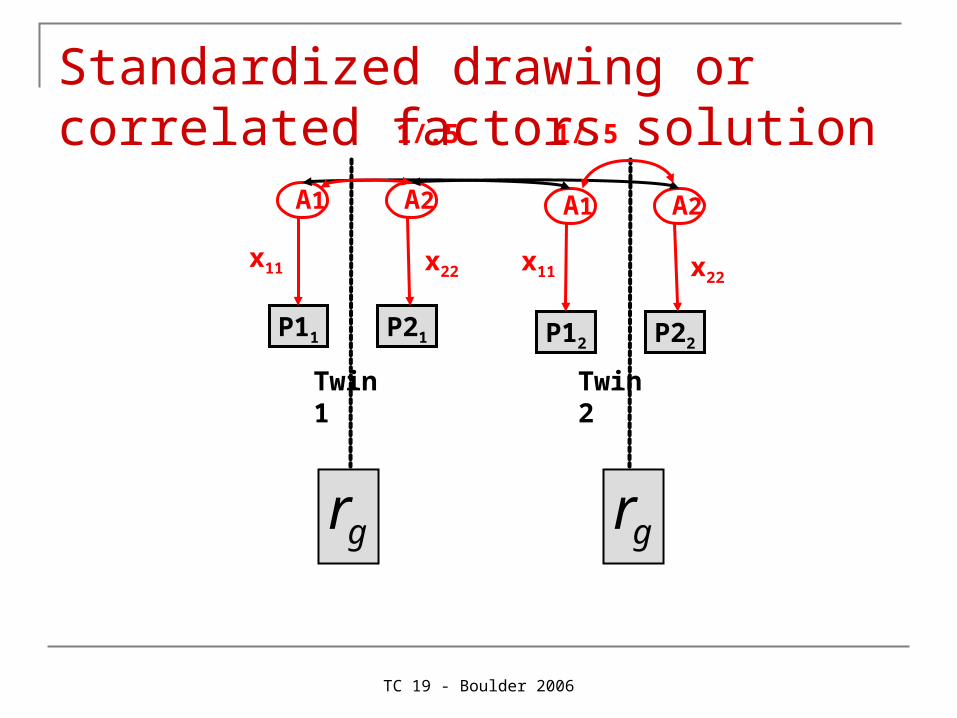
Twin 1 Twin 2
gr
Standardized drawing or correlated factors solution
gr
TC 19 - Boulder 2006
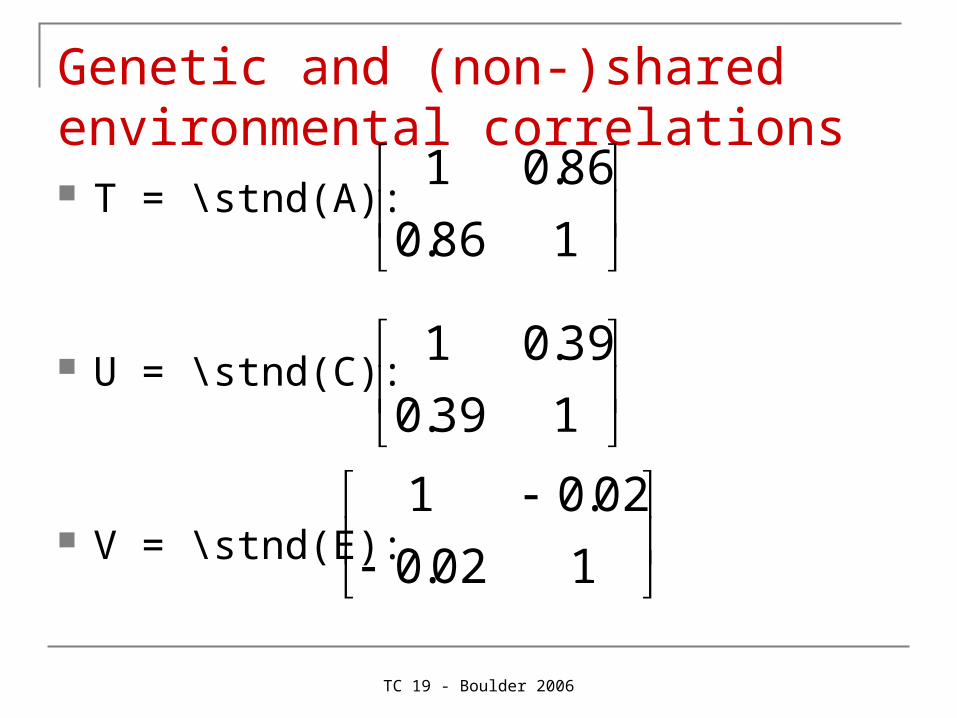
Genetic and (non-)shared environmental correlations T = \stnd(A):
U = \stnd(C):
V = \stnd(E):
186.0
86.01
139.0
39.01
102.0
02.01
TC 19 - Boulder 2006
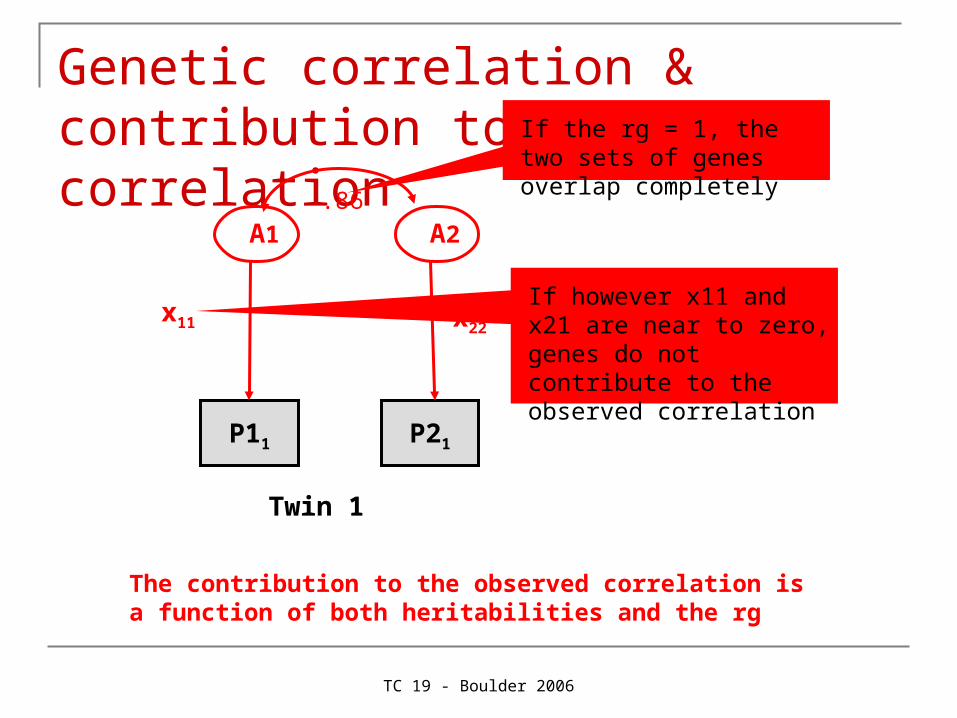
Genetic correlation & contribution to observed correlation
A1 A2
x11
P11 P21
x22
Twin 1
.86
If the rg = 1, the two sets of genes overlap completely
If however x11 and x21 are near to zero, genes do not contribute to the observed correlation
The contribution to the observed correlation is a function of both heritabilities and the rg
TC 19 - Boulder 2006
Proportion of the observed correlation explained by correlation at the genetic level
Observed correlation is the result of correlation at
The genetic level Common environmental level Unique environmental level
TC 19 - Boulder 2006
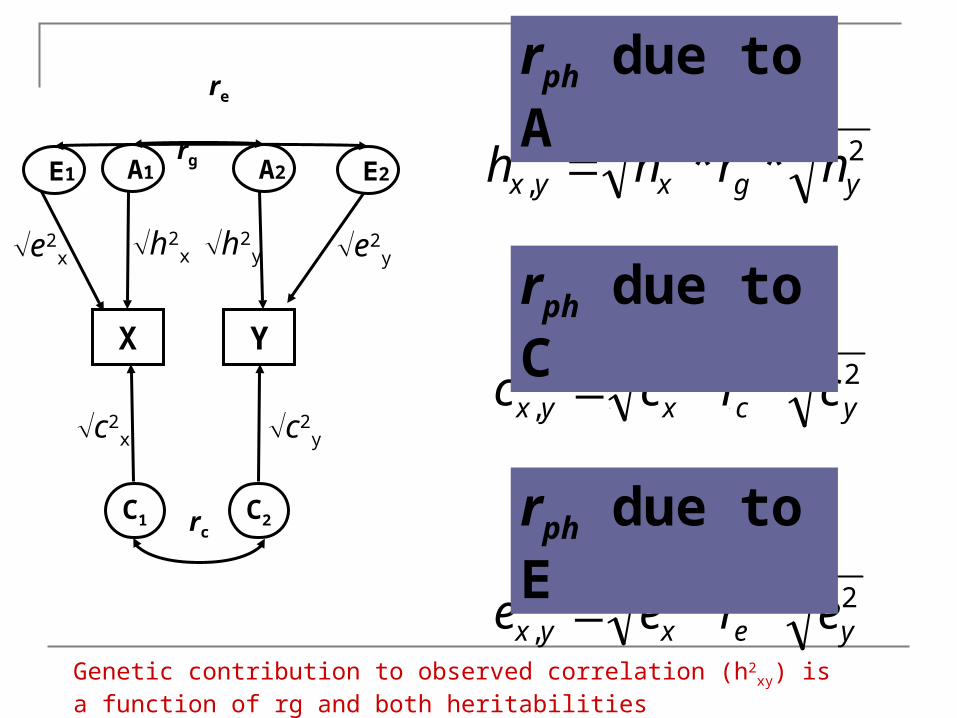
222, ** ygxyx hrhh rg
X Y
h2x
A1 A2
h2y
C1 C2rc
c2x c2
y
222, ** ycxyx crcc
222, ** yexyx eree
rph due to A
rph due to C
rph due to E
Genetic contribution to observed correlation (h2xy) is a function of rg and
both heritabilities
re
e2x
E1 E2
e2y
TC 19 - Boulder 2006
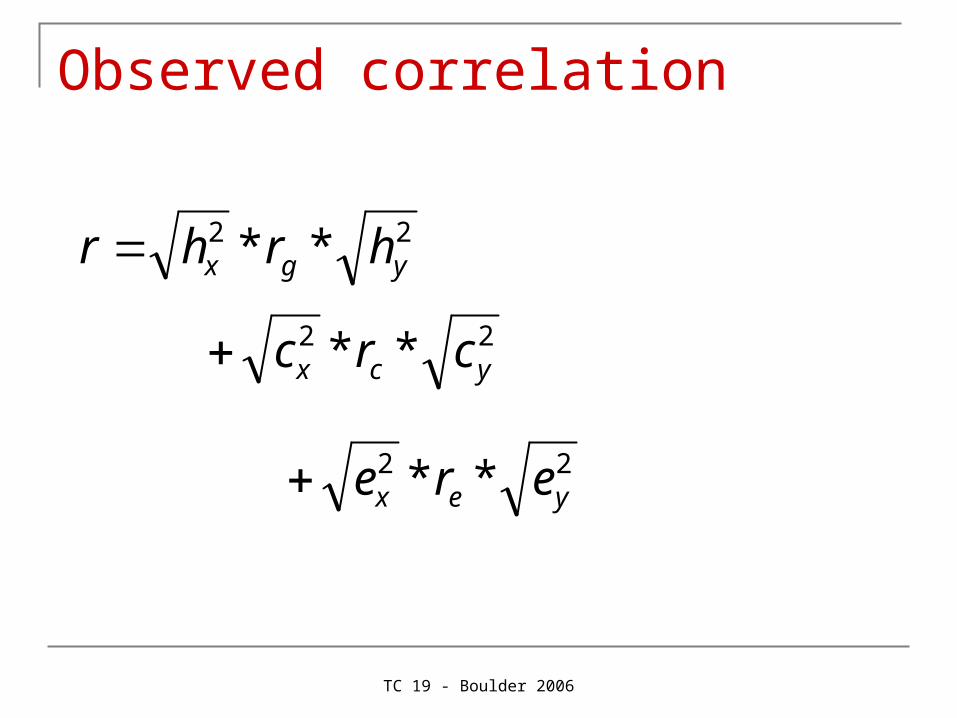
Observed correlation
22 ** ygx hrhr
22 ** ycx crc
22 ** yex ere
TC 19 - Boulder 2006
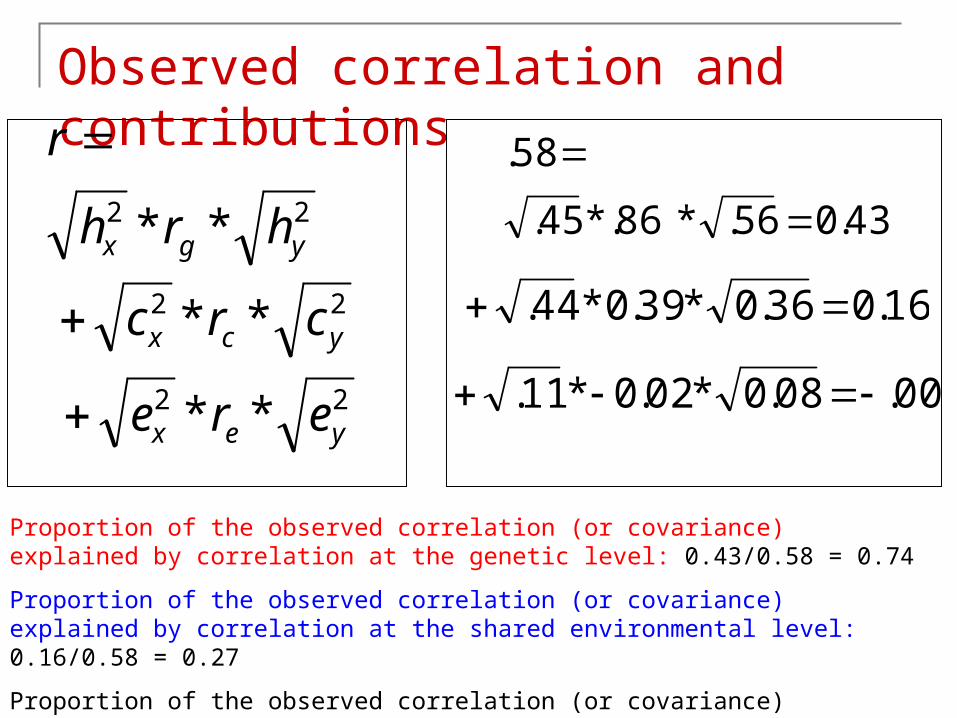
Observed correlation and contributions
22 ** ygx hrh
r
22 ** ycx crc22 ** yex ere
43.056.*86.*45.
58.
16.036.0*39.0*44.
00.08.0*02.0*11.
Proportion of the observed correlation (or covariance) explained by correlation at the genetic level: 0.43/0.58 = 0.74
Proportion of the observed correlation (or covariance) explained by correlation at the shared environmental level: 0.16/0.58 = 0.27
Proportion of the observed correlation (or covariance) explained by correlation at the non-shared environmental level: 0/0.58 = 0
TC 19 - Boulder 2006
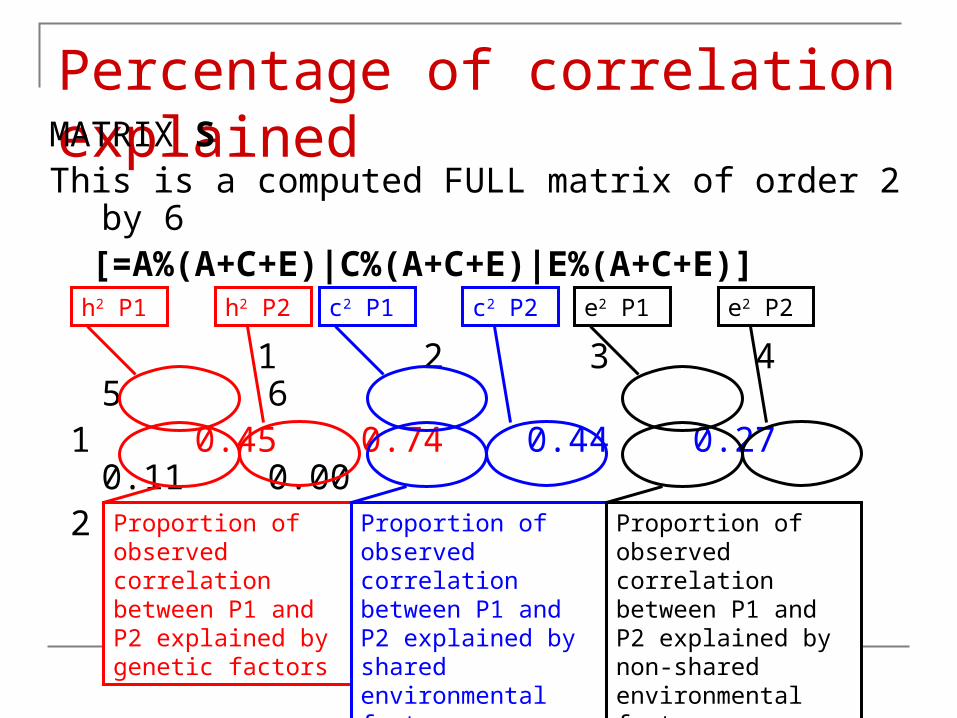
Percentage of correlation explainedMATRIX SThis is a computed FULL matrix of order 2 by 6 [=A%(A+C+E)|C%(A+C+E)|E%(A+C+E)]
1 2 3 4 5 6 1 0.45 0.74 0.44 0.27 0.11 0.00 2 0.74 0.56 0.27 0.36 0.00 0.08
h2 P1 h2 P2
Proportion of observed correlation between P1 and P2 explained by genetic factors
c2 P1 c2 P2
Proportion of observed correlation between P1 and P2 explained by shared environmental factors
e2 P1 e2 P2
Proportion of observed correlation between P1 and P2 explained by non-shared environmental factors
TC 19 - Boulder 2006
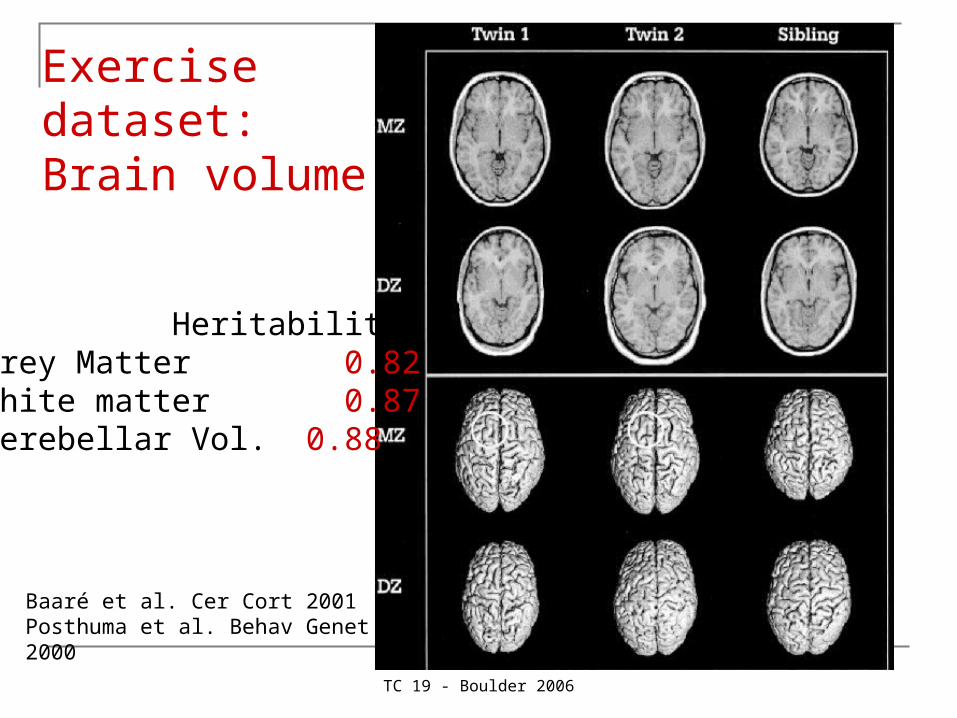
Baaré et al. Cer Cort 2001Posthuma et al. Behav Genet 2000
Exercise dataset: Brain volume
Heritability Grey Matter 0.82White matter 0.87Cerebellar Vol. 0.88
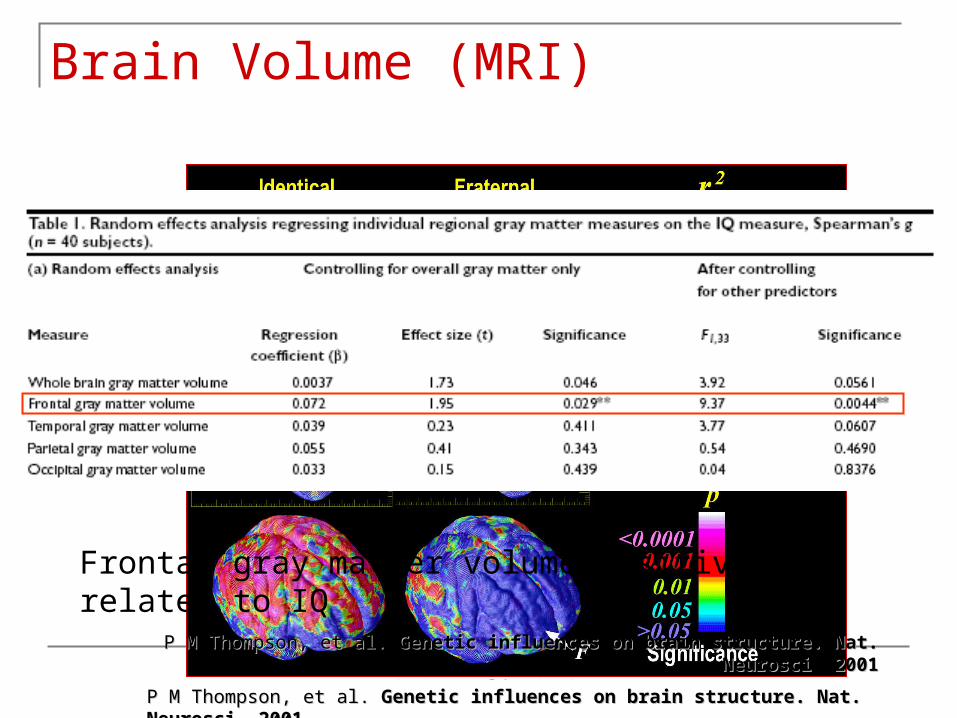
TC 19 - Boulder 2006P M Thompson, et al. P M Thompson, et al. Genetic influences on brain structure. Nat. Neurosci 2001Genetic influences on brain structure. Nat. Neurosci 2001
Brain Volume (MRI)
Frontal gray matter volume positively related to IQP M Thompson, et al. P M Thompson, et al. Genetic influences on brain structure. Nat. Neurosci 2001Genetic influences on brain structure. Nat. Neurosci 2001
TC 19 - Boulder 2006
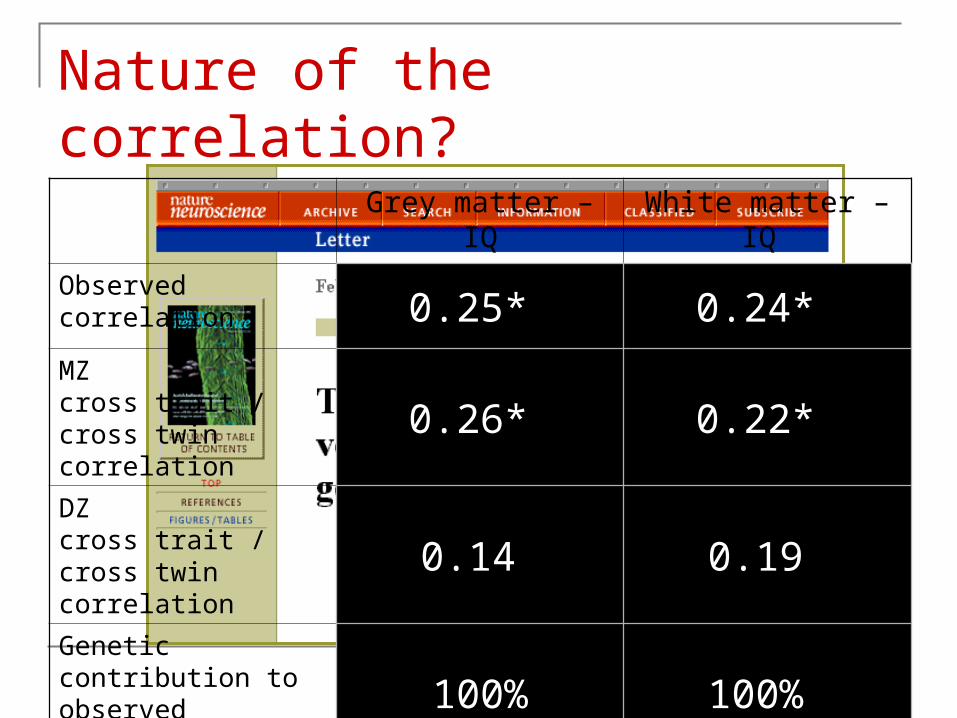
Nature of the correlation?
Grey matter – IQ White matter – IQ
Observedcorrelation 0.25* 0.24*
MZcross trait / cross twincorrelation
0.26* 0.22*
DZcross trait / cross twin correlation
0.14 0.19
Genetic contribution to observed correlation 100% 100%
TC 19 - Boulder 2006
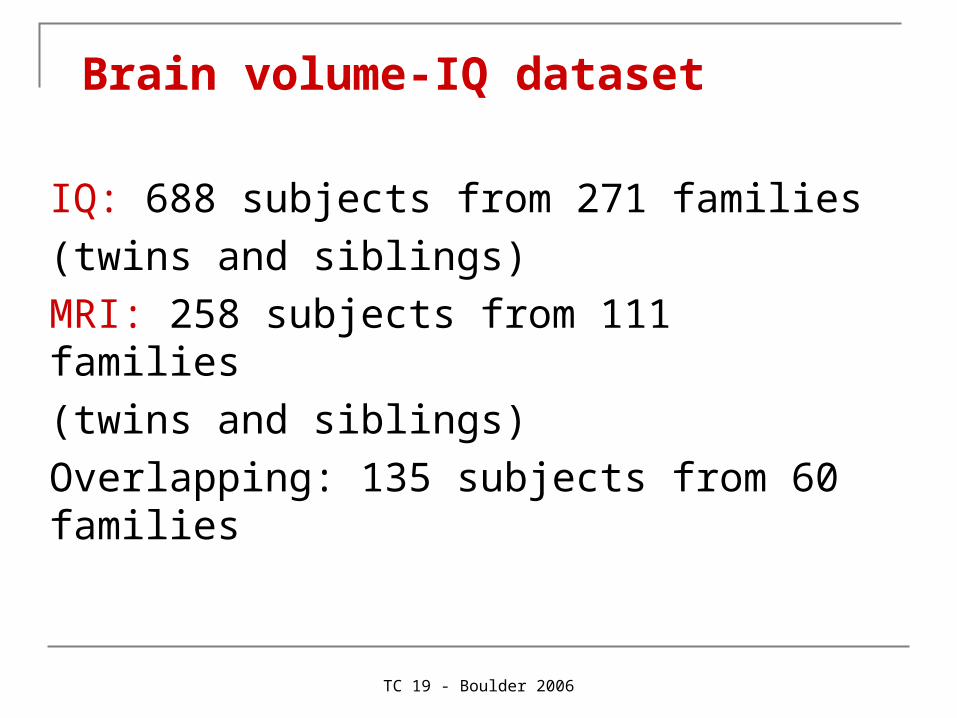
Brain volume-IQ dataset
IQ: 688 subjects from 271 families
(twins and siblings)
MRI: 258 subjects from 111 families
(twins and siblings)
Overlapping: 135 subjects from 60 families
TC 19 - Boulder 2006
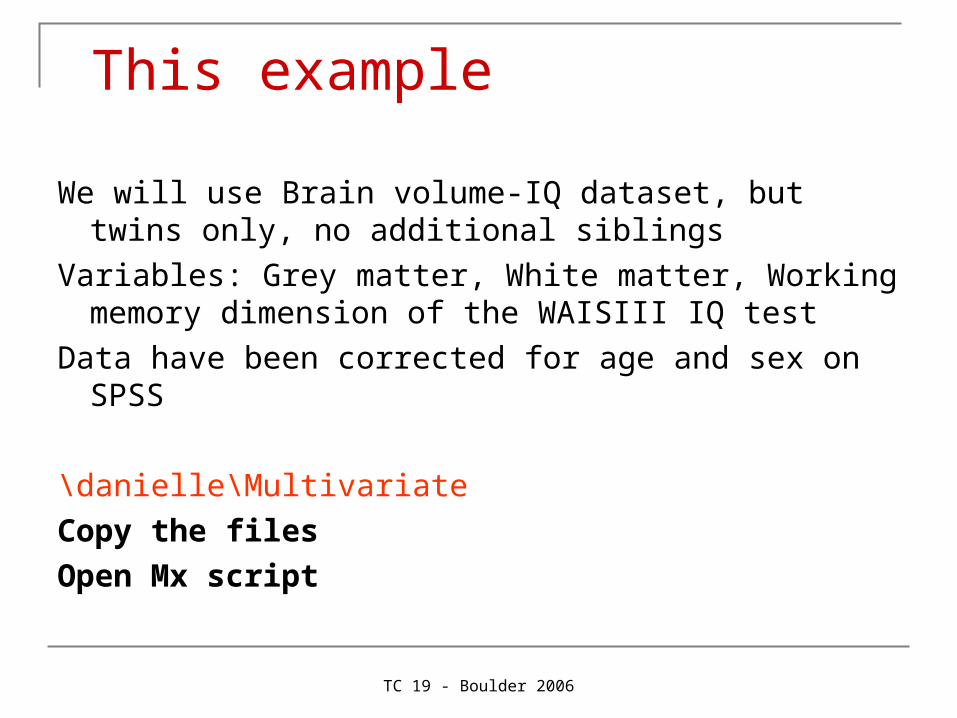
This example
We will use Brain volume-IQ dataset, but twins only, no additional siblings
Variables: Grey matter, White matter, Working memory dimension of the WAISIII IQ test
Data have been corrected for age and sex on SPSS
\danielle\Multivariate
Copy the files
Open Mx script
TC 19 - Boulder 2006
Now run it and open the output
TC 19 - Boulder 2006
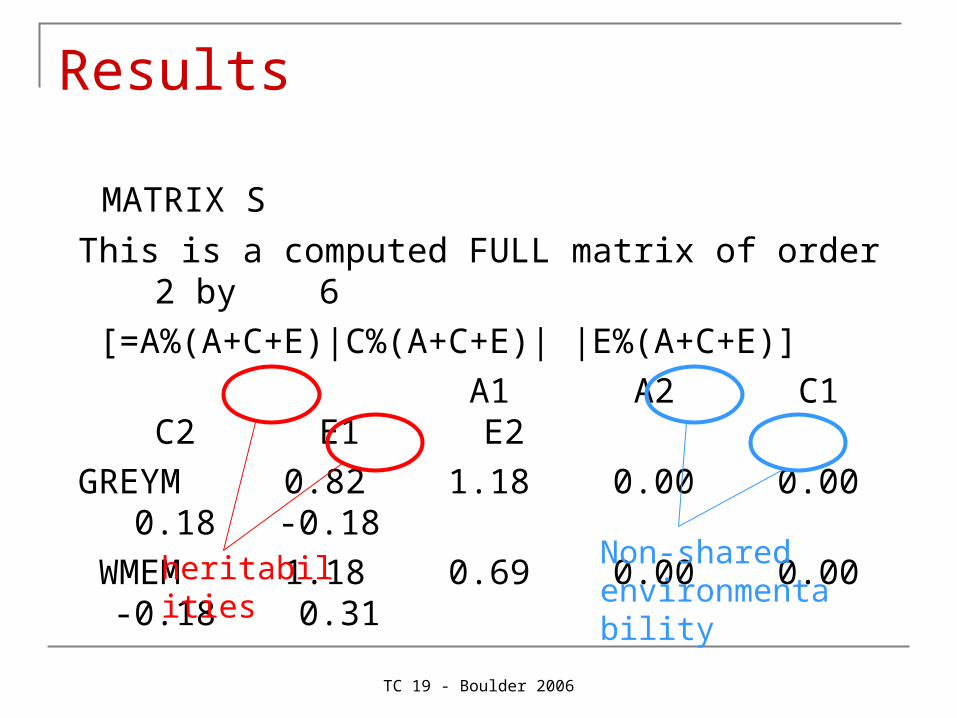
Results
MATRIX S
This is a computed FULL matrix of order 2 by 6
[=A%(A+C+E)|C%(A+C+E)| |E%(A+C+E)]
A1 A2 C1 C2 E1 E2
GREYM 0.82 1.18 0.00 0.00 0.18 -0.18
WMEM 1.18 0.69 0.00 0.00 -0.18 0.31
heritabilities Non-shared environmentability
TC 19 - Boulder 2006
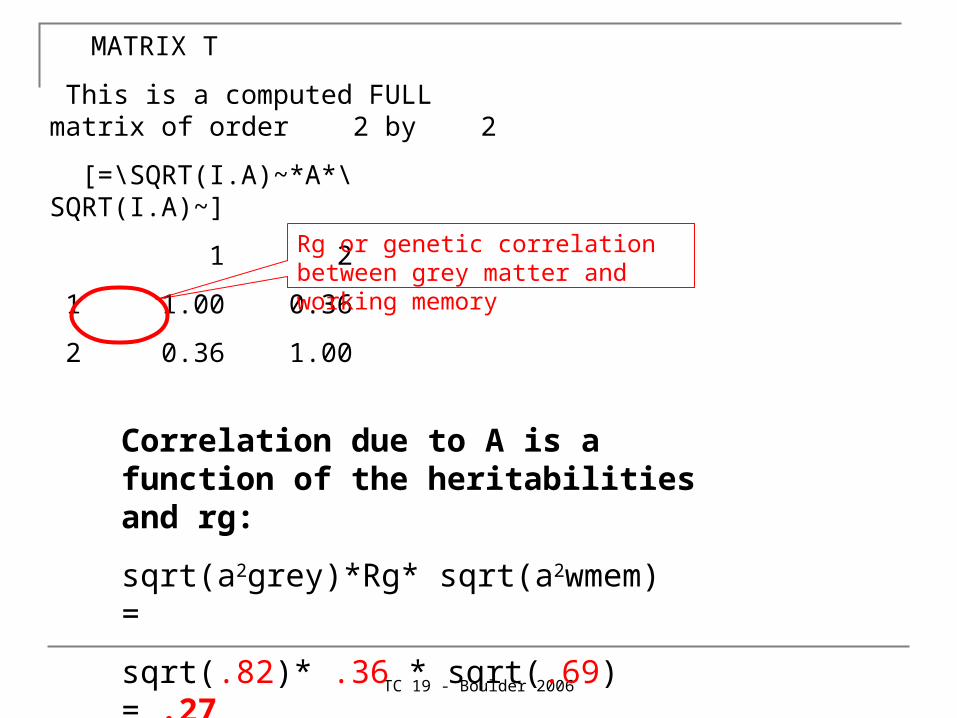
MATRIX T
This is a computed FULL matrix of order 2 by 2
[=\SQRT(I.A)~*A*\SQRT(I.A)~]
1 2
1 1.00 0.36
2 0.36 1.00
Correlation due to A is a function of the heritabilities and rg:
sqrt(a2grey)*Rg* sqrt(a2wmem) =
sqrt(.82)* .36 * sqrt(.69) = .27
Rg or genetic correlation between grey matter and working memory
TC 19 - Boulder 2006
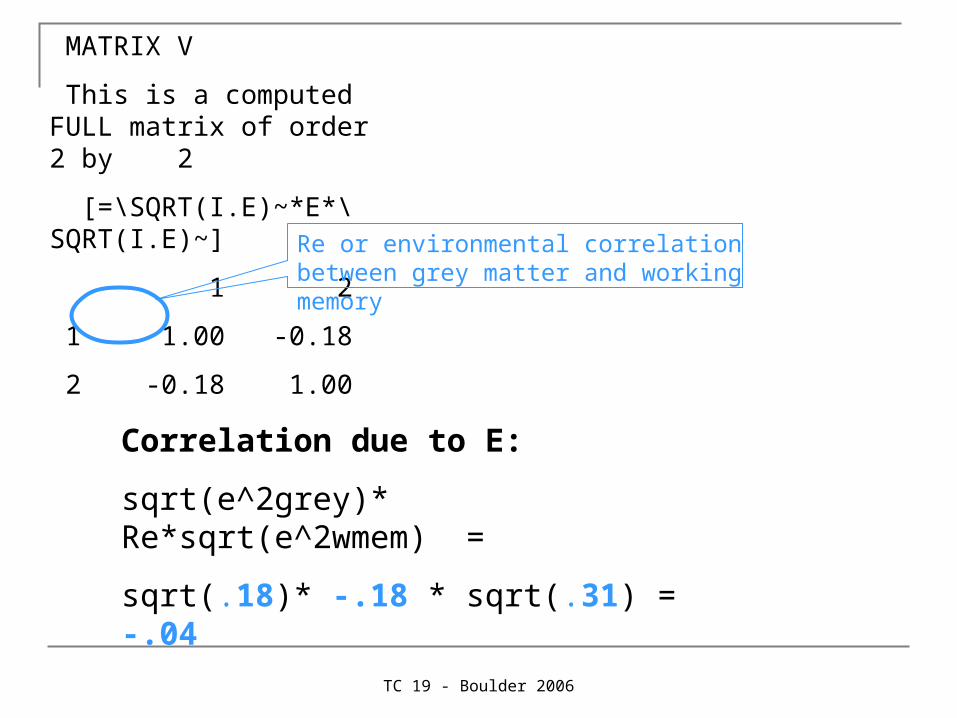
MATRIX V
This is a computed FULL matrix of order 2 by 2
[=\SQRT(I.E)~*E*\SQRT(I.E)~]
1 2
1 1.00 -0.18
2 -0.18 1.00
Correlation due to E:
sqrt(e^2grey)* Re*sqrt(e^2wmem) =
sqrt(.18)* -.18 * sqrt(.31) = -.04
Re or environmental correlation between grey matter and working memory
TC 19 - Boulder 2006
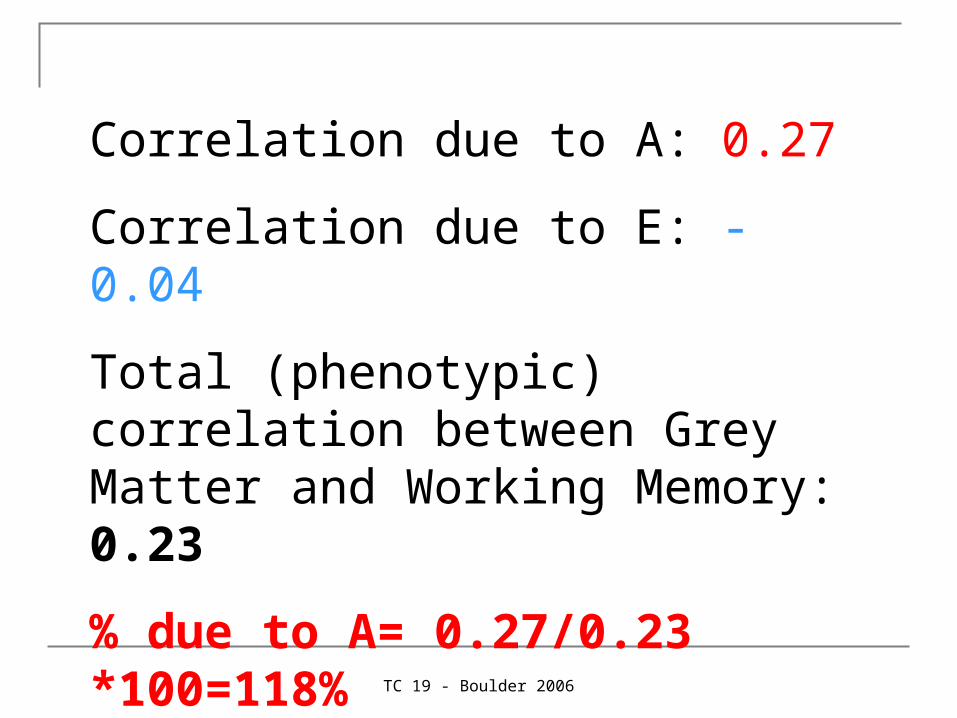
Correlation due to A: 0.27
Correlation due to E: -0.04
Total (phenotypic) correlation between Grey Matter and Working Memory: 0.23
% due to A= 0.27/0.23 *100=118%
% due to E= -.04/0.23 *100= -18%
TC 19 - Boulder 2006
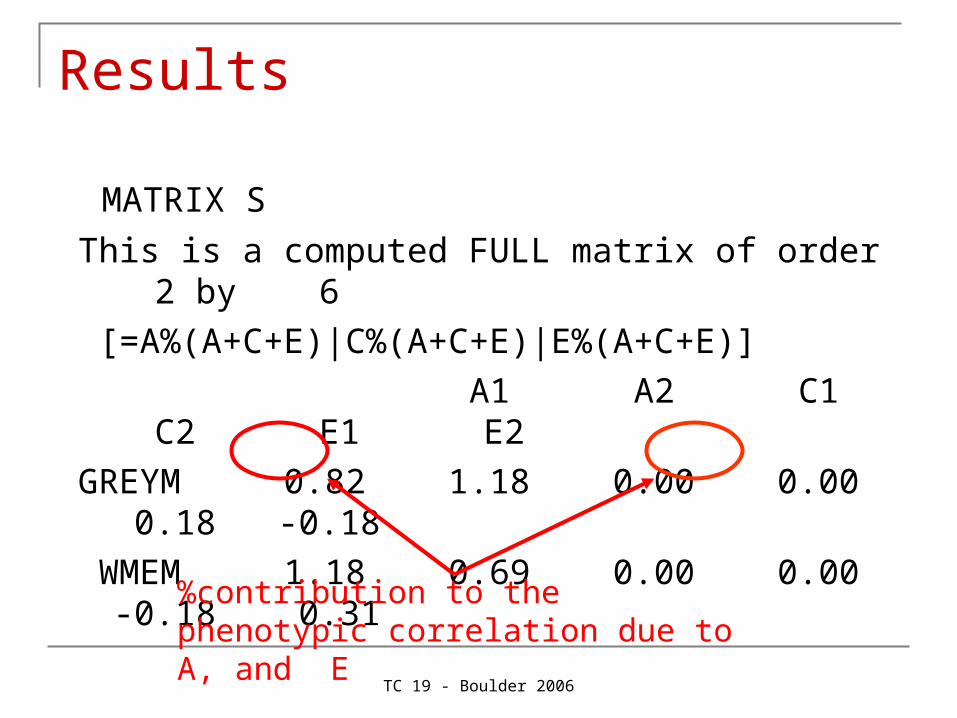
Results
MATRIX S
This is a computed FULL matrix of order 2 by 6
[=A%(A+C+E)|C%(A+C+E)|E%(A+C+E)]
A1 A2 C1 C2 E1 E2
GREYM 0.82 1.18 0.00 0.00 0.18 -0.18
WMEM 1.18 0.69 0.00 0.00 -0.18 0.31
%contribution to the phenotypic correlation due to A, and E
TC 19 - Boulder 2006
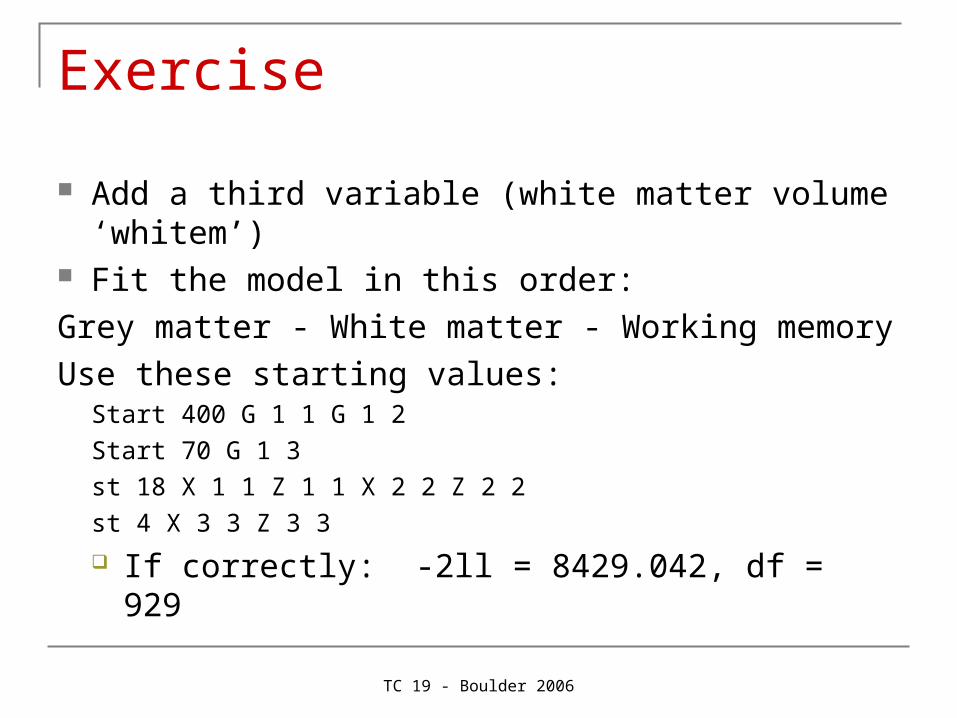
Exercise
Add a third variable (white matter volume ‘whitem’) Fit the model in this order:
Grey matter - White matter - Working memory
Use these starting values:Start 400 G 1 1 G 1 2
Start 70 G 1 3
st 18 X 1 1 Z 1 1 X 2 2 Z 2 2
st 4 X 3 3 Z 3 3
If correctly: -2ll = 8429.042, df = 929
TC 19 - Boulder 2006
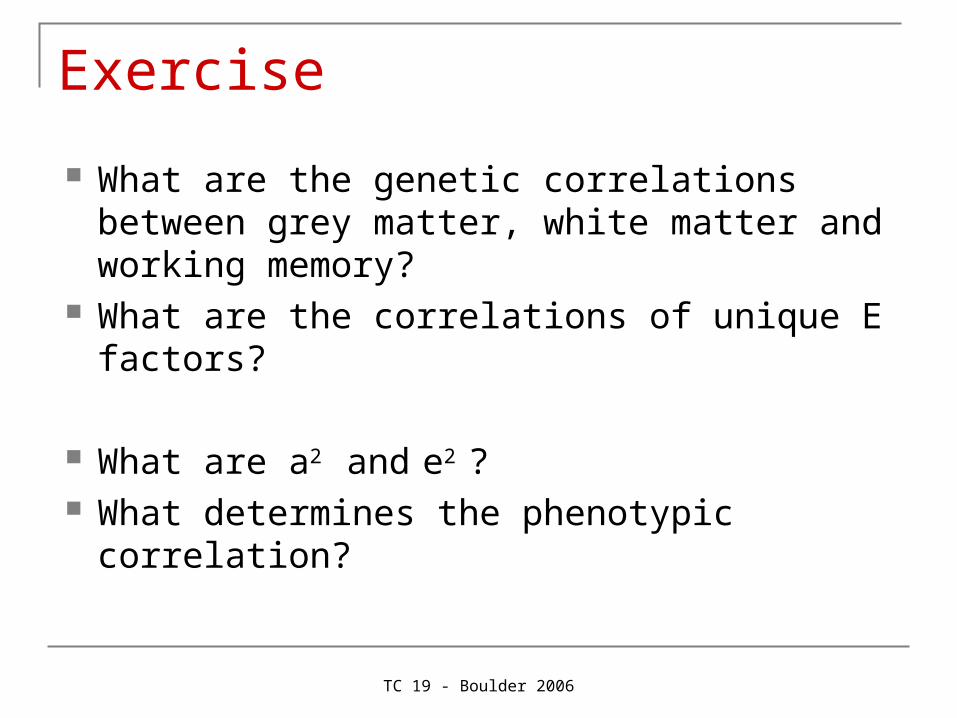
Exercise
What are the genetic correlations between grey matter, white matter and working memory?
What are the correlations of unique E factors?
What are a2 and e2 ? What determines the phenotypic correlation?
TC 19 - Boulder 2006
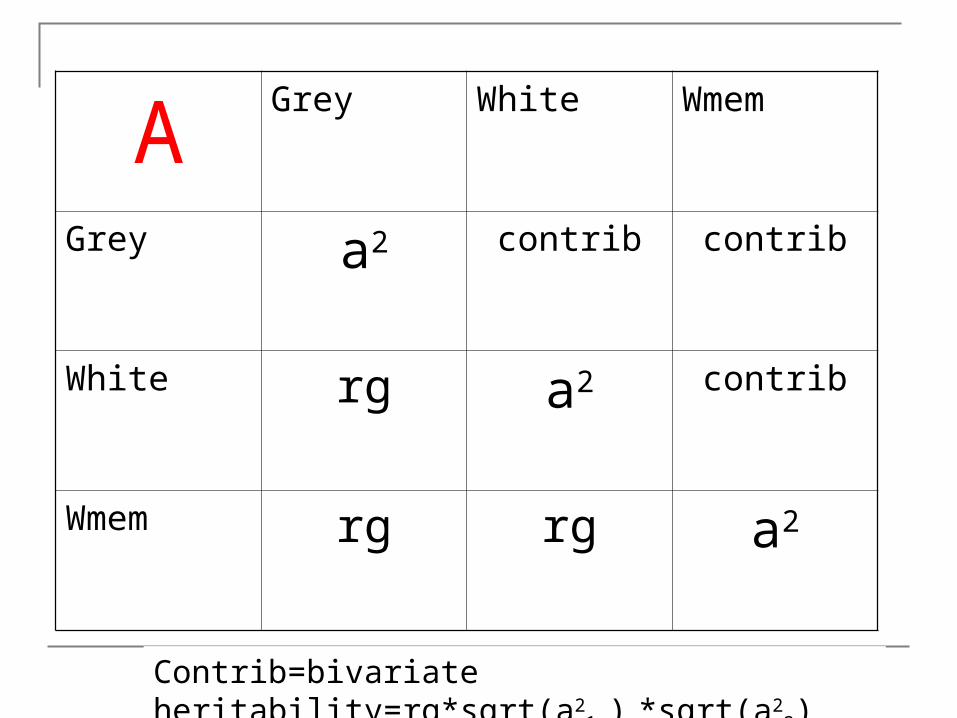
AGrey White Wmem
Grey a2 contrib contrib
White rg a2 contrib
Wmem rg rg a2
Contrib=bivariate heritability=rg*sqrt(a21 ) *sqrt(a2
2)
TC 19 - Boulder 2006
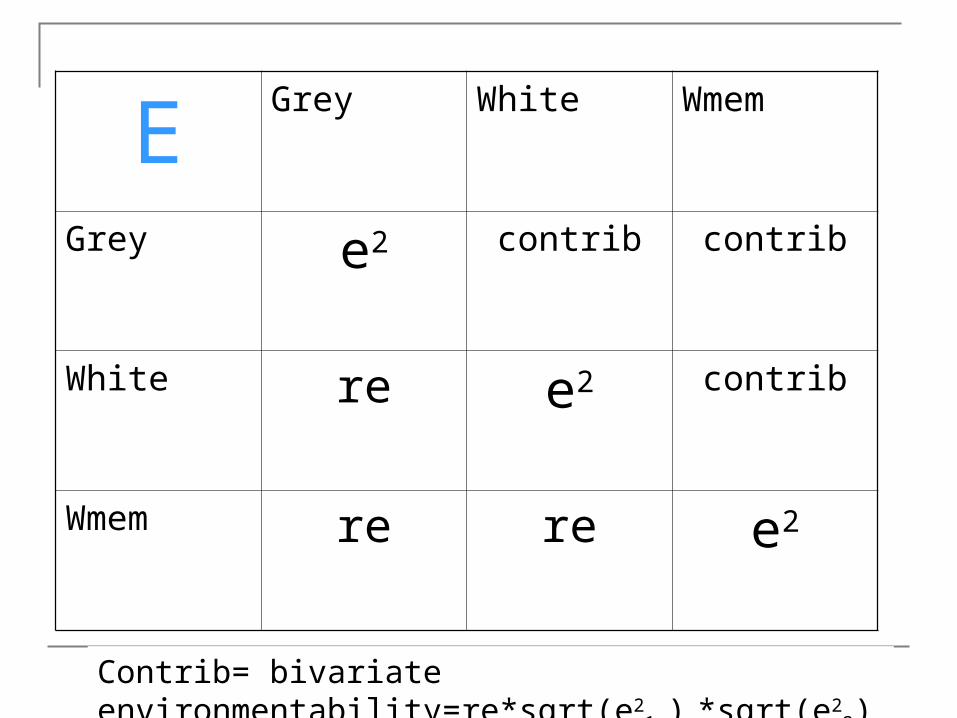
EGrey White Wmem
Grey e2 contrib contrib
White re e2 contrib
Wmem re re e2
Contrib= bivariate environmentability=re*sqrt(e21 ) *sqrt(e2
2)
TC 19 - Boulder 2006
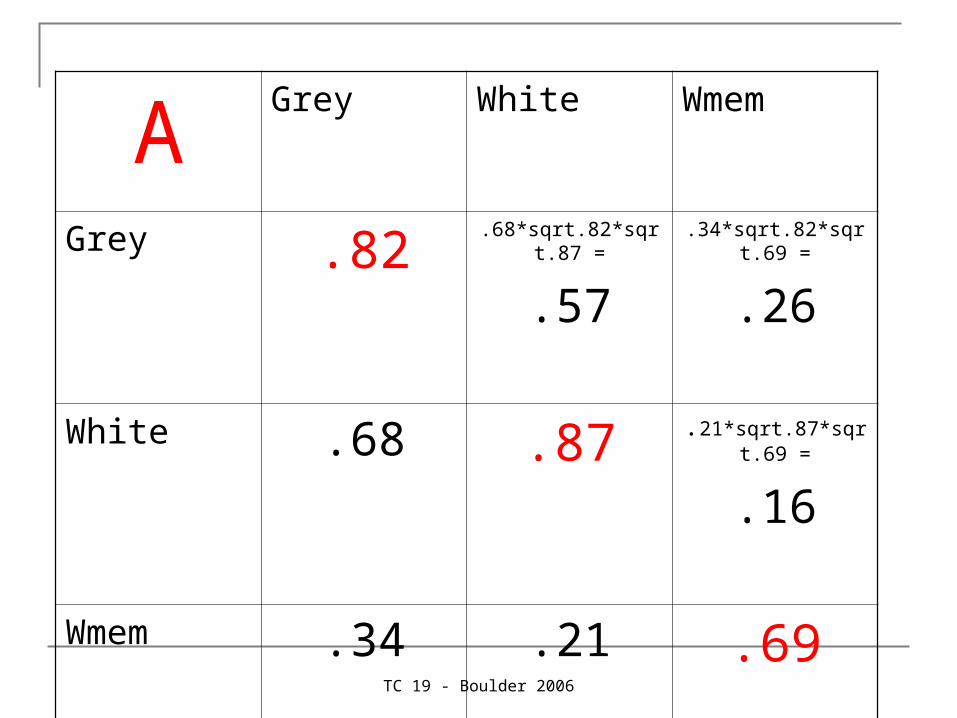
AGrey White Wmem
Grey .82.68*sqrt.82*sqrt.87 =
.57.34*sqrt.82*sqrt.69 =
.26
White .68 .87 .21*sqrt.87*sqrt.69 =
.16
Wmem .34 .21 .69
TC 19 - Boulder 2006
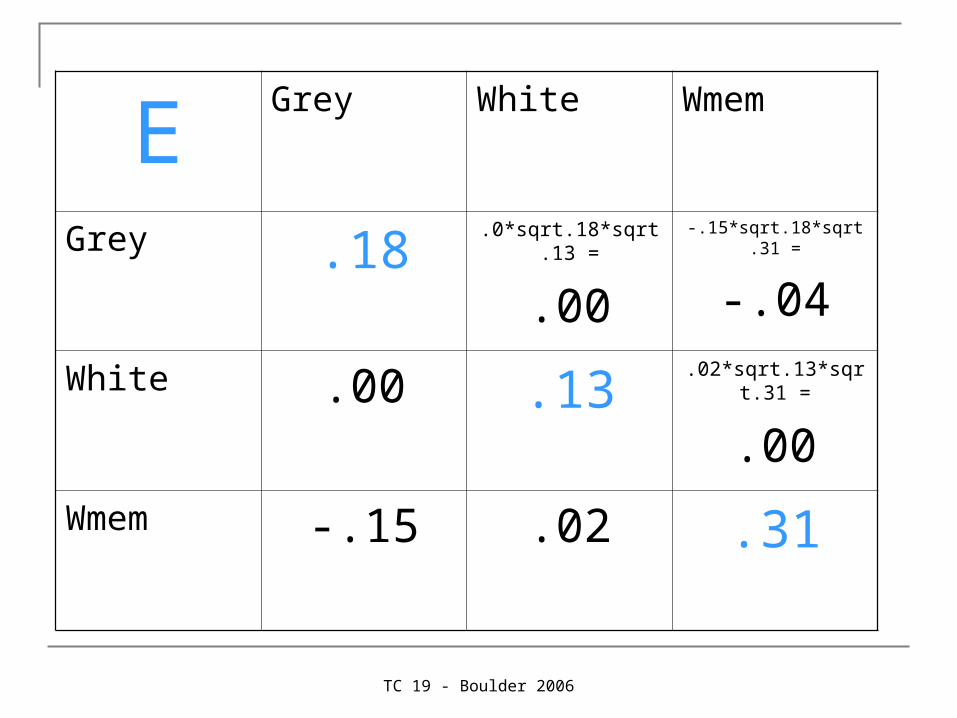
EGrey White Wmem
Grey .18.0*sqrt.18*sqrt.13 =
.00-.15*sqrt.18*sqrt.31 =
-.04
White .00 .13.02*sqrt.13*sqrt.31 =
.00
Wmem -.15 .02 .31
TC 19 - Boulder 2006
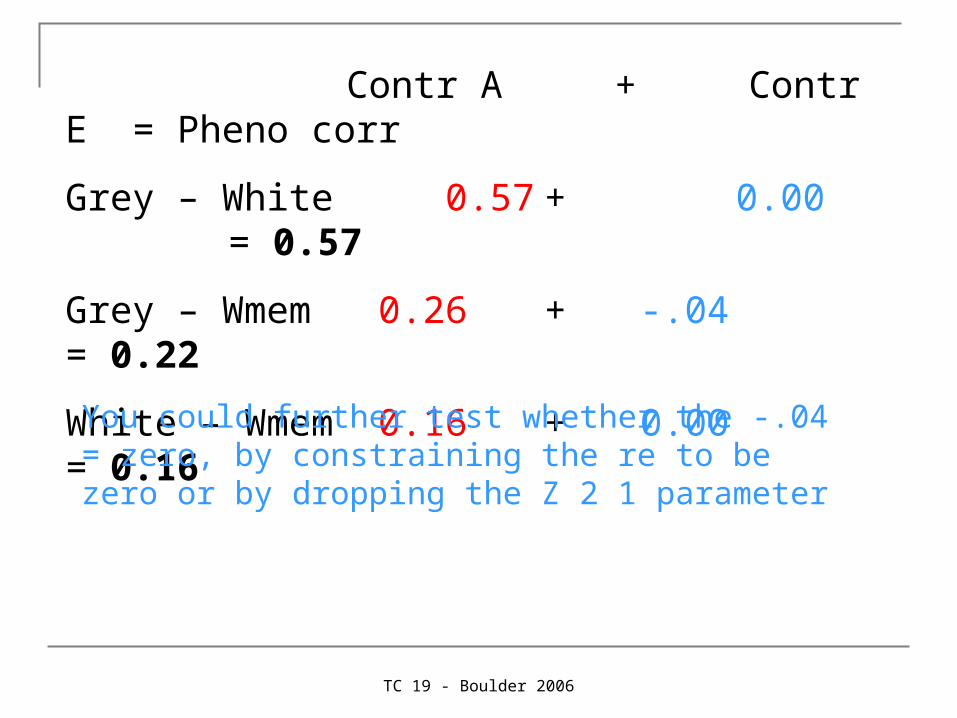
Contr A + Contr E = Pheno corr
Grey – White 0.57 + 0.00 = 0.57
Grey – Wmem 0.26 + -.04 = 0.22
White – Wmem 0.16 + 0.00 = 0.16
You could further test whether the -.04 = zero, by constraining the re to be zero or by dropping the Z 2 1 parameter

TC 19 - Boulder 2006
Central place for Mx scripts genetic analyses
http://www.psy.vu.nl/mxbib
Funded by the GenomEUtwin project
(European Union Contract No. QLG2-CT-2002-01254).


