22
Multivariate Nonparametric Tests Christof Seiler Stanford University, Spring 2016, Stats 205
Multivariate Nonparametric Tests
Christof Seiler
Stanford University, Spring 2016, Stats 205
Overview
I So far, we have seen only univariate nonparametric testsI Today, we’ll cover multivariate generalizationsI Two-sample tests
I Data depth-based: Tukey depth functionI Graph-based: Friedman and Rafsky test
Data Depth-Based Two-Sample Tests
I In univariate nonparametric analysis, we relied heavily on ranksI Ranks are straightforward in the univariate caseI We just use the natural ordering of observations along the real
lineI Moving from univariate to multivariate setting, we need to
make some more considerationsI In Rd there is no natural orderingI Just a straightforward extension of the median to define a
center can failI A Rd coordinate-wise median can lie outside the convex hull of
the data
Data Depth-Based Two-Sample Tests
I The usual ranks:I We ranked n observations in ascending orderI From that we constructed test statisticsI For instance, the median is defined as the order statistics of
rank (n + 1)/2 (when n is odd)I The median can be computed in O(n) timeI The problem is that generalizing this to higher dimension is
straightforward
I So we consider a different ranking systemI We rank observations as assigning
I the most extreme observation depth 1I the second smallest and second largest observations depth 2I Until we end up with the deepest observation, the median
I This can be extended to higher dimensions more easily
Data Depth-Based Two-Sample Tests
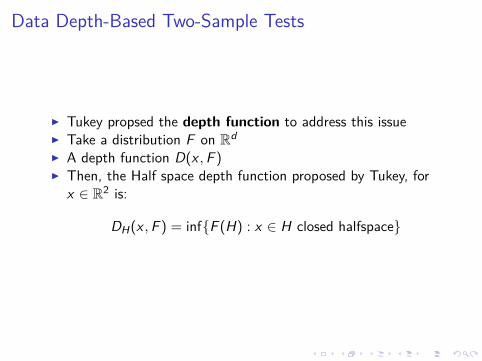
I Tukey propsed the depth function to address this issueI Take a distribution F on Rd
I A depth function D(x ,F )I Then, the Half space depth function proposed by Tukey, for
x ∈ R2 is:
DH(x ,F ) = inf{F (H) : x ∈ H closed halfspace}
Data Depth-Based Two-Sample Tests
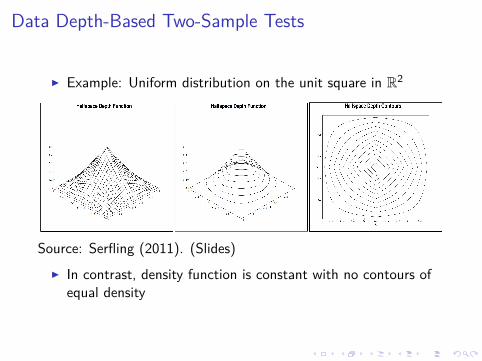
I Example: Uniform distribution on the unit square in R2
Source: Serfling (2011). (Slides)I In contrast, density function is constant with no contours of
equal density
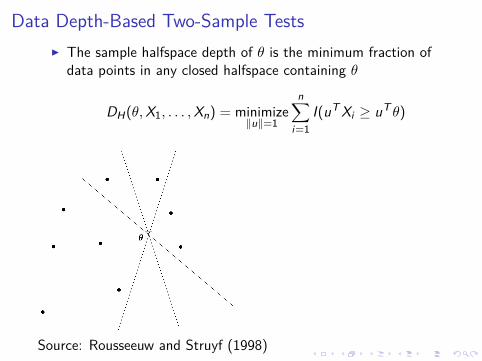
Data Depth-Based Two-Sample TestsI The sample halfspace depth of θ is the minimum fraction of
data points in any closed halfspace containing θ
DH(θ,X1, . . . ,Xn) = minimize‖u‖=1
n∑i=1
I(uT Xi ≥ uT θ)
Source: Rousseeuw and Struyf (1998)
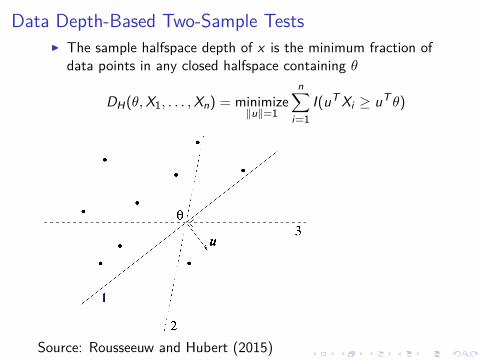
Data Depth-Based Two-Sample TestsI The sample halfspace depth of x is the minimum fraction of
data points in any closed halfspace containing θ
DH(θ,X1, . . . ,Xn) = minimize‖u‖=1
n∑i=1
I(uT Xi ≥ uT θ)
Source: Rousseeuw and Hubert (2015)
Data Depth-Based Two-Sample Tests
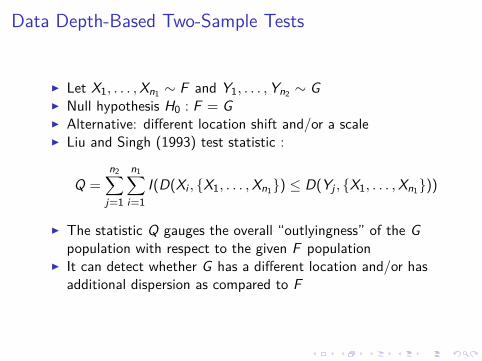
I Let X1, . . . ,Xn1 ∼ F and Y1, . . . ,Yn2 ∼ GI Null hypothesis H0 : F = GI Alternative: different location shift and/or a scaleI Liu and Singh (1993) test statistic :
Q =n2∑
j=1
n1∑i=1
I(D(Xi , {X1, . . . ,Xn1}) ≤ D(Yj , {X1, . . . ,Xn1}))
I The statistic Q gauges the overall “outlyingness” of the Gpopulation with respect to the given F population
I It can detect whether G has a different location and/or hasadditional dispersion as compared to F
Data Depth-Based Two-Sample Tests
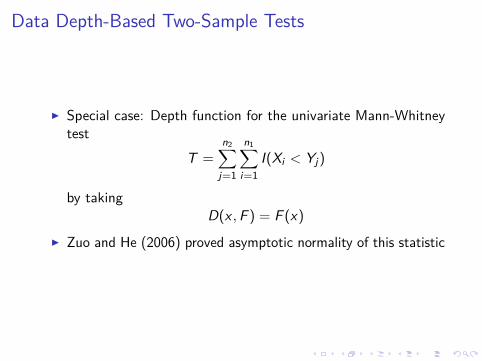
I Special case: Depth function for the univariate Mann-Whitneytest
T =n2∑
j=1
n1∑i=1
I(Xi < Yj)
by takingD(x ,F ) = F (x)
I Zuo and He (2006) proved asymptotic normality of this statistic
Data Depth-Based Two-Sample Tests
2000 2500 3000 3500
100
150
200
250
300
Weight
Dis
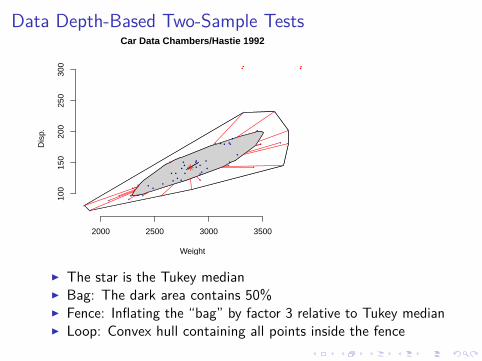
p.Car Data Chambers/Hastie 1992
I The star is the Tukey medianI Bag: The dark area contains 50%I Fence: Inflating the “bag” by factor 3 relative to Tukey medianI Loop: Convex hull containing all points inside the fence
Data Depth-Based Two-Sample Tests
I Gets increasingly difficult to compute in high dimensionsI Computation time is polynomial in n but exponential in dI Rousseeuw and Struyf (1998) proposed an approximationI They compute m random directions out of all
(nd)directions
perpendicular to hyperplanes through d data points
Data Depth-Based Two-Sample Tests
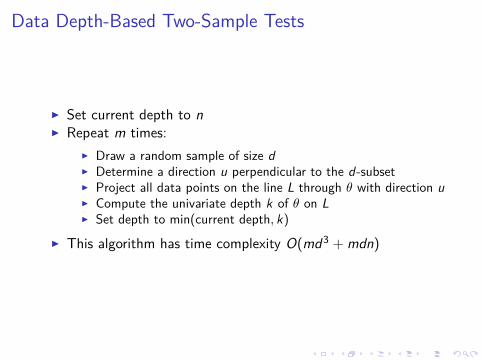
I Set current depth to nI Repeat m times:
I Draw a random sample of size dI Determine a direction u perpendicular to the d-subsetI Project all data points on the line L through θ with direction uI Compute the univariate depth k of θ on LI Set depth to min(current depth, k)
I This algorithm has time complexity O(md3 + mdn)
Graph-Based Two-Sample Tests
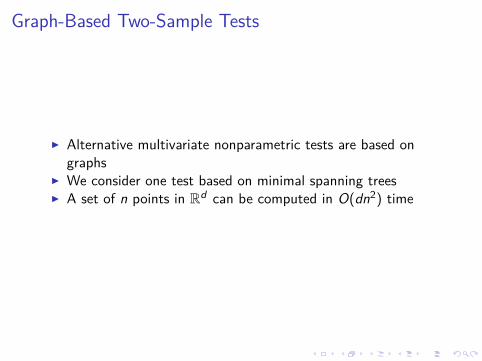
I Alternative multivariate nonparametric tests are based ongraphs
I We consider one test based on minimal spanning treesI A set of n points in Rd can be computed in O(dn2) time
Graph-Based Two-Sample Tests
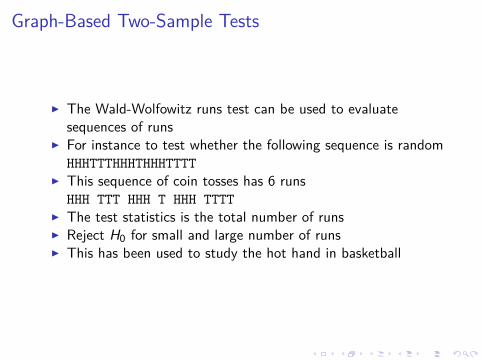
I The Wald-Wolfowitz runs test can be used to evaluatesequences of runs
I For instance to test whether the following sequence is randomHHHTTTHHHTHHHTTTT
I This sequence of coin tosses has 6 runsHHH TTT HHH T HHH TTTT
I The test statistics is the total number of runsI Reject H0 for small and large number of runsI This has been used to study the hot hand in basketball
Graph-Based Two-Sample Tests
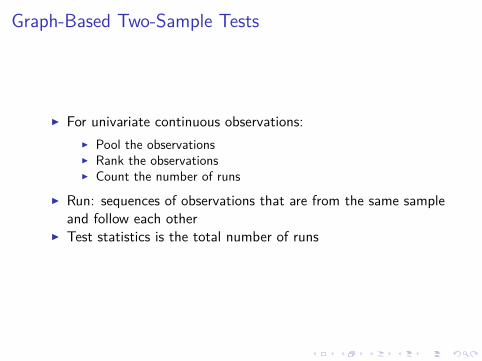
I For univariate continuous observations:I Pool the observationsI Rank the observationsI Count the number of runs
I Run: sequences of observations that are from the same sampleand follow each other
I Test statistics is the total number of runs
Graph-Based Two-Sample Tests
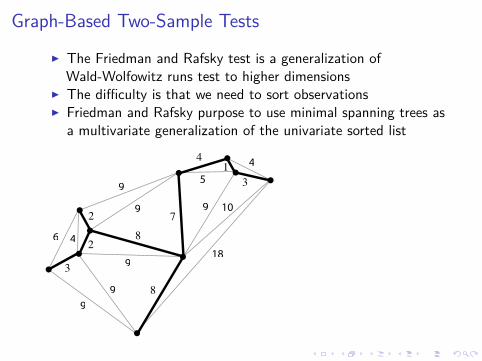
I The Friedman and Rafsky test is a generalization ofWald-Wolfowitz runs test to higher dimensions
I The difficulty is that we need to sort observationsI Friedman and Rafsky purpose to use minimal spanning trees as
a multivariate generalization of the univariate sorted list
8
3
87
2
2
4
31
Graph-Based Two-Sample Tests
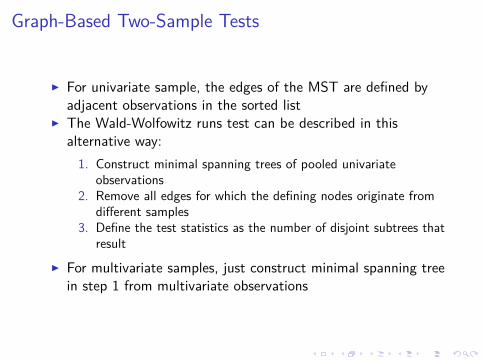
I For univariate sample, the edges of the MST are defined byadjacent observations in the sorted list
I The Wald-Wolfowitz runs test can be described in thisalternative way:1. Construct minimal spanning trees of pooled univariate
observations2. Remove all edges for which the defining nodes originate from
different samples3. Define the test statistics as the number of disjoint subtrees that
result
I For multivariate samples, just construct minimal spanning treein step 1 from multivariate observations
Graph-Based Two-Sample Tests
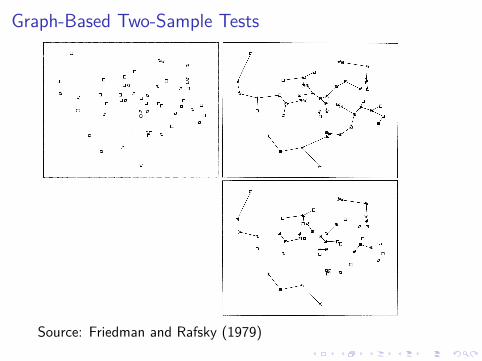
Source: Friedman and Rafsky (1979)
Graph-Based Two-Sample Tests
I Reject H0 for small and large number of subtrees (runs)I The null distribution of the test statistics can be computed
using permutation testsI fix treeI permute labels
I Good power in finite samples for multivariate data (againstgeneral alternatives: location, spread, and shape)
Graph-Based Two-Sample Tests
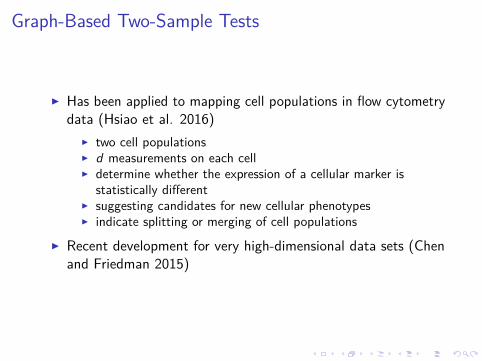
I Has been applied to mapping cell populations in flow cytometrydata (Hsiao et al. 2016)
I two cell populationsI d measurements on each cellI determine whether the expression of a cellular marker is
statistically differentI suggesting candidates for new cellular phenotypesI indicate splitting or merging of cell populations
I Recent development for very high-dimensional data sets (Chenand Friedman 2015)
References
I Tukey (1974). Mathematics and the Picturing of DataI Friedman and Rafsky (1979). Multivariate Generalizations of the Wolfowitz
and Smirnov Two-Sample TestsI Liu and Singh (1993). A Quality Index Based on Data-Depth and
Multivariate Rank TestsI Holmes (1997). Lecture Notes on Computer Intensive Methods in StatisticsI Rousseeuw and Struyf (1998). Computing Location Depth and Regression
Depth in Higher DimensionsI Zuo and He (2006). On the Limiting Distributions of Multivariate
Depth-Based Rank Sum Statistics and Related TestsI Serfling (2012). Depth (pdf preprint)I Rousseeuw and Hubert (2015). Statistical Depth Meets Computational
Geometry: A Short SurveyI Bhattacharya (2015). Power of Graph-Based Two-Sample TestsI Chen and Friedman (2015). A New Graph-Based Two-Sample Test for
Multivariate and Object DataI Hsiao, Liu, Stanton, McGee, Qian, and Scheuermann (2016). Mapping
Cell Populations in Flow Cytometry Data for Cross-Sample Comparisonusing The Friedman-Rafsky Test Statistic as a Distance Measure


