66
Multiwavelength Ranging/Streak Cameras
| Date post: | 01-Apr-2018 |
| Category: |
Documents |
| Upload: | truongnhan |
| View: | 220 times |
| Download: | 2 times |
Multiwavelength
Ranging/Streak Cameras

N94-15580
OPTIMUM WAVELENGTHS FOR TWO COLOR RANGING
John J. Degnan
Code 901/ Crustal Dynamics Project
NASA Goddard Space Flight Center
Greenbelt, MD 20771
ABSTRACT
The range uncertainties associated with the refractive atmosphere
can be mitigated by the technique of two color, or dual wave-
length, ranging. The precision of the differential time of flight
(DTOF) measurement depends on the atmospheric dispersion between
the two wavelengths, the received pulsewidths and photoelectron
counts, and on the amount of temporal averaging. In general, the
transmitted wavelengths are not independently chosen but instead
are generated via nonlinear optics techniques (harmonic crystals,
Raman scattering, etc.) which also determine their relative pul-
sewidths. The mean received photoelectrons at each wavelength are
calculated via the familiar radar link equation which contains
several wavelength dependent parameters. By collecting the vari-
ous wavelength dependent terms, one can define a wavelength fig-
ure of merit for a two color laser ranging system.
In this paper, we apply the wavelength figure of merit to the
case of an extremely clear atmosphere and draw several conclu-
sions regarding the relative merits of fundamental-second har-
monic, fundamental-third harmonic, second-third harmonic, and
Raman two color systems. We find that, in spite of the larger
dispersion between wavelengths, fundamental-third harmonic sys-
tems have the lowest figure of merit due to a combination of poor
detector performance at the fundamental and poor atmospheric
transmission at the third harmonic. Fundamental-second harmonic
(-700 nm and 350 nm) have the highest figure of merit, but
second-third harmonic systems, using fundamental transmitters
near i000 nm, are a close second. Raman-shifted transmitters
appear to offer no advantage over harmonic systems because of (i)
the relatively small wavelength separation that can be achieved
in light gases such as hydrogen and (2) the lack of good ultra-
short pulse transmitters with an optimum fundamental wavelength
near 400 nm.
7-1
1 INTRODUCTION
With the subcentimeter precisions available from modern satellite
laser ranging (SLR) hardware [Degnan, 1985], atmospheric refrac-tion is a dominant error source in the absolute determination of
the geometric range from the station to the satellite. While
atmospheric modelling is believed to reduce the systematic errors
to roughly one centimeter or less, future progress toward milli-meter absolute accuracy ranging will rely on the technique of two
color, or dual wavelength, ranging.
In the present paper, we attempt to define optimum wavelengths
for two color ranging. In order to accomplish this, we must takeinto account all of the wavelength dependent parameters which
influence our ability to make an accurate differential time of
flight (DTOF) measurement. As we will see in the ensuing sec-
tions, a proper accounting of wavelength dependent terms will
include atmospheric dispersion, atmospheric transmission as a
function of sea level visibility, transmit antenna and target
gains, detector responsivities, transmitter availability and pul-
sewidth, and the detailed characteristics of the available non-
linear optics techniques for achieving the necessary optical
frequency translations.
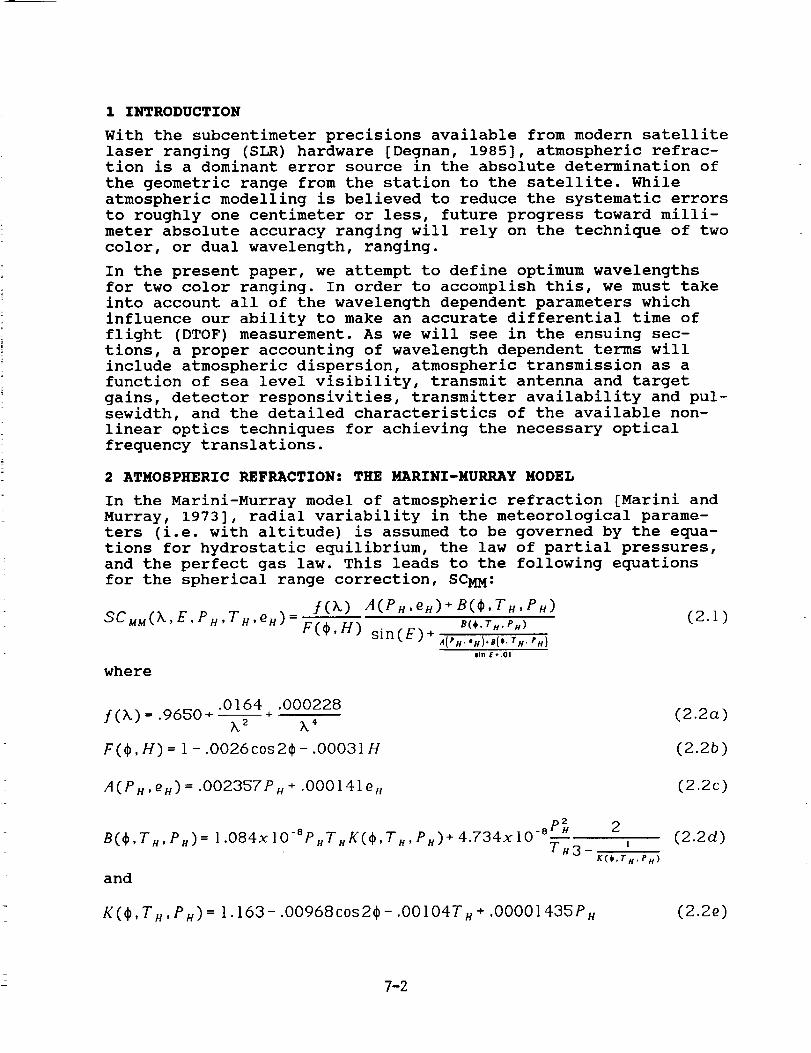
2 ATMOSPHERIC REFRACTION: THE MARINI-MURRAY MODEL
In the Marini-Murray model of atmospheric refraction [Marini and
Murray, 1973], radial variability in the meteorological parame-
ters (i.e. with altitude) is assumed to be governed by the equa-
tions for hydrostatic equilibrium, the law of partial pressures,
and the perfect gas law. This leads to the following equations
for the spherical range correction, SCMM:
f(k) A(Pu,eu)+ B(¢,Tu,Pu)' B(,.r.,e.) (2.1)
SC uu ( X, E, P u T u, e u ) = F ( _, H ) si n ( E ) + ,(,,..,1.,(,. r.. ,,)lin £*,01
where
/(k)=.9650+ -.0164 .000228
+
k 2 A.4
F(¢.H)=l-.OO26cos2¢-.OOO31H
(2.2ct)
(2.2b)
A(Pt-z,eH) = .002357Pu + .000141e u (2.2c)
B(},Tu,PH) = 1.084x]O-SPuTuK(_,Tu,Pu)+4.734x]O -SPzuT,3
21
K(t,Ts.P . )
and
(2.2d)
K(#,T u,PH) = 1.163-.O0968cos2¢-,OOlO4T u + .00001435P u (2.2e)
7-2

where k is the laser wavelength in microns, E is the true eleva-
tion angle of the satellite in degrees, _ is the station lati-
tude, H is the station height above mean sea level, and PH, TH
and e H are the surface pressure, temperature, and water vapor
pressure at the station. The water vapor pressure e H is related
to the surface percent relative humidity R H and surface tempera-
ture T H by the equation
( T,273,5R n 7.s
eH(RH,TH)=._6.11xl 0 237.3.(T.-273.,S)) (2.3)
The wavelength dependence of the range correction is contained in
the dispersion term /(k) which is plotted in Figure i. It was
arbitrarily chosen by Marini and Murray to have a value of unity
at the ruby laser wavelength of .6943 microns.
_.2I I I I I I I - I -].....
1.1
_(,,,)
1.0
0.9 .............. l .I.3 .6 .9 1.2
_,(_)
Figure i. Atmospheric dispersion in a standard atmosphere as a
function of wavelength from the near ultraviolet to the nearinfrared.
3 TWO-COLOR LASER RANGING
By measuring the pulse times-of-flight at two colors and multi-
plying the results by the velocity of light in vacuum, c, we
obtain a measure of the optical path lengths through the
atmosphere at the two wavelengths. Thus, the atmospheric refrac-
tion correction is given by
7-3
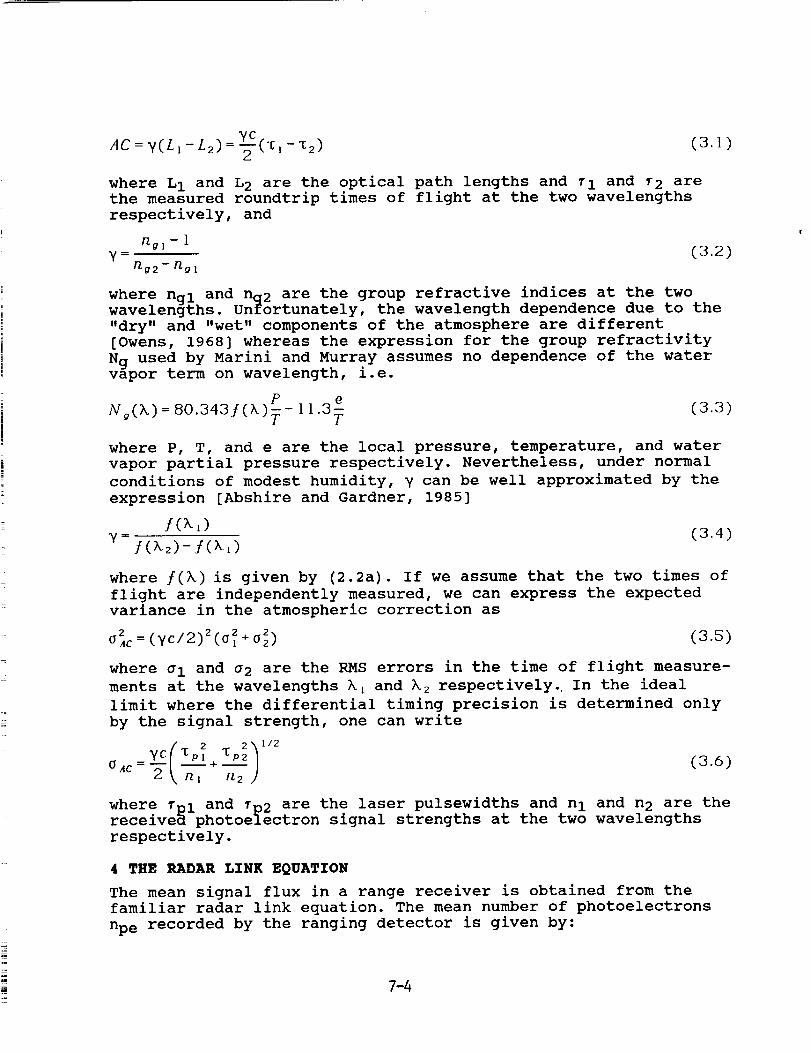
yc --%2)AC = y( L1- L2) = -_('_! (3.])
where L1 and L 2 are the optical path lengths and rI and r2 arethe measured roundtrip times of flight at the two wavelengths
respectively, and
_ol - 1¥ = (3.2)
_g2--_gl
where nal and nq2 are the group refractive indices at the twowavelengths. Unfortunately, the wavelength dependence due to the
"dry" and "wet" components of the atmosphere are different
[Owens, 1968] whereas the expression for the group refractivity
Ng used by Marini and Murray assumes no dependence of the watervapor term on wavelength, i.e.
P 3£No(k ) = 80.343j(k) - ] 1. T (3.3)
where P, T, and e are the local pressure, temperature, and water
vapor partial pressure respectively. Nevertheless, under normal
conditions of modest humidity, ¥ can be well approximated by the
expression [Abshire and Gardner, 1985]
f(x )7= (3.4)
f(x2)-f(x,)
where /(k) is given by (2.2a). If we assume that the two times of
flight are independently measured, we can express the expectedvariance in the atmospheric correction as
oAcz =(yc/2)2(o21 +°§) (3.5)
where aI and a 2 are the RMS errors in the time of flight measure-
ments at the wavelengths k I and k z respectively. In the ideal
limit where the differential timing precision is determined only
by the signal strength, one can write
_( 2 211/2+ (3.6)
OAC= _1 n2
where fpl and rp2 are the laser pulsewidths and n I and n2 are thereceivea photoelectron signal strengths at the two wavelengths
respectively.
4 THE RADAR LINK EQUATION
The mean signal flux in a range receiver is obtained from the
familiar radar link equation. The mean number of photoelectrons
npe recorded by the ranging detector is given by:
7-4

(i)2np_=1-1,7 Er qtG,o 4TtR z A_rI_T]T_(4.1)
where q_ is the detector quantum efficiency, ET is the laser
pulse energy, k is the laser wavelength, h is Planck's constant,
c is the velocity of light in vacuum, _e is the transmit optics
efficiency, Gt is the transmitter gain, a is the satellite opti-cal cross-section, R is the slant range to the target, A r is the
effective area of the telescope receive aperture, _r is the
efficiency of the receive optics, Ta is the one-way atmospheric
transmission, Tc is the one way transmissivity of cirrus clouds
(when present), and R is the slant range between the station and
the target.
In discussing the link equation, we are primarily concerned with
those terms which exhibit a wavelength dependence. While optical
coatings certainly exhibit a wavelength dependence thereby
affecting the transmit and receive optical efficiencies _e and Ur,
coatings can generally be designed to give approximately equal
performance once the operating wavelengths are chosen and hence
will not be included in our discussion. Similarly, experimentalstudies of cirrus cloud transmission have shown no significant
dependence on wavelength over the band from 0.317 to 12 microns.
Other terms in (4.1) do have a wavelength dependence which wewill now discuss.
4.1 TRANSMITTER GAIN
A general expression for the transmitter gain is given by
4_At
G t- k z gt(_,,_,¥t,X) (4.2)
where At = na 2 is the area of the transmitting aperture and
gt(_t,_,¥t,X) is a geometric factor independent of wavelength
[Klein and Degnan, 1974]. Note that, for a given transmit
aperture and a well-collimated system, the transmitter gain is
inversely proportional to the wavelength squared.
4.2 TARGET OPTICAL CROSS-SECTION
The optical cross-section of an unspoiled retroreflector is
given by [Degnan, 1992]
(4_Acc_ (4.3)oc_=pAc_ kz j
where p is the cube corner reflectivity, Acc= nR_c is the light
collecting area of the corner cube, and 4KAcc/k z is the on-
axis retroreflector gain. Even in the presence of complicating
factors such as velocity aberration and retroreflector
7-5

spoiling, an array of retroreflectors designed to operate atboth wavelengthswould be expected to retain the same inverse
square law dependence on wavelength exhibited by (4.3).
4.3 ATMOSPHERIC ATTENUATION
In the near-ultraviolet to visible spectral band between 0.3
and 0.7 _, atmospheric attenuation is dominated by aerosol
(Mie) scattering but molecular (Rayleigh) and ozone absorption
also play a role [RCA, 1968]. In the near infrared beyond0.7_, the plot of atmospheric transmission versus wavelength
(see Figure 2) is modulated by strong absorption features ofvarious molecular constituents in the atmosphere, notably
water vapor, oxygen, and carbon dioxide.
1.0
0.8
d 0.6.
0.4
0.2
I///I I I / I I I I
.3 .4 .5 .6 .7 .8 .9 1.0 1.1
Figure 2. Atmospheric transmission as a function of wavelength
under extremely clear conditions with 2 cm of precipitable
water vapor at zenith angles of 0, 50, and 70 ° (corresponding
to I, 2, and 3 air masses) respectively.
The transmission curve presented in Figure 2 corresponds to
excellent "seeing" conditions (80 Km visibility) and 2 cm of
precipitable water vapor. It should be noted that atmospheric
seeing conditions vary widely from day to day and from site tosite and are usually characterized by "sea level visibility"
expressed in kilometers. Plots of the sea level attenuationcoefficient versus wavelength (from 0.4 to 4 _) as a function
of sea level visibility can be found in the RCA Electro-Optics
7-6
Handbook [RCA, 1968]. For the purpose of this analysis, how-
ever, we will consider only the extremely clear atmosphere
depicted in Figure 2.
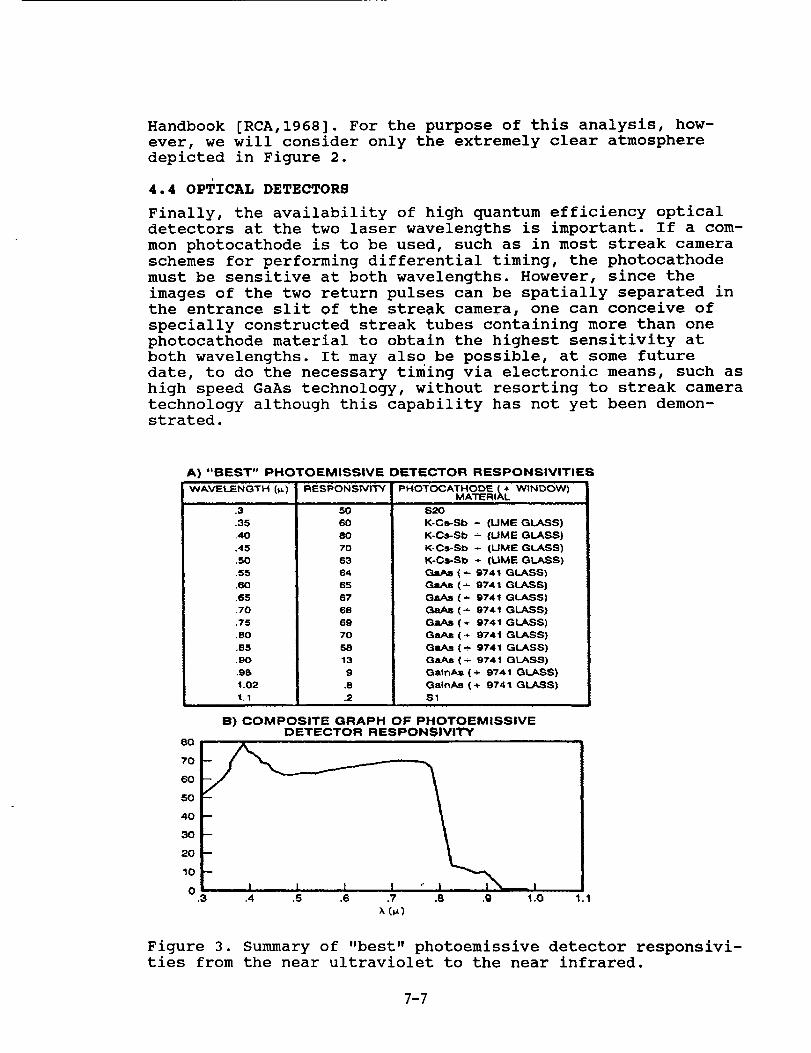
4.4 OPTICAL DETECTORS
Finally, the availability of high quantum efficiency optical
detectors at the two laser wavelengths is important. If a com-
mon photocathode is to be used, such as in most streak camera
schemes for performing differential timing, the photocathode
must be sensitive at both wavelengths. However, since the
images of the two return pulses can be spatially separated in
the entrance slit of the streak camera, one can conceive of
specially constructed streak tubes containing more than one
photocathode material to obtain the highest sensitivity at
both wavelengths. It may also be possible, at some future
date, to do the necessary timing via electronic means, such as
high speed GaAs technology, without resorting to streak camera
technology although this capability has not yet been demon-strated.
80
70
60
A) "BEST" PHOTOEMISSIVE DETECTOR RESPONSIVITIES
WAVELENGTH {t-,-)
50
40 --
30 --
20 --
10 --
0.3
.3
.35
.40
.45
.50
.55
.60
.65
.70
.75
.B0
.B5
.90
.gB
1.02
1.1
RESPON SIVtTV
5O
60
80
70
63
64
65
67
6S
69
70
58
13
9
.8
.2
PHOTOCATHODE (+ WINDOW)MATERIAL
S20
K-C_Sb - (UME GLASS)
K-C_Sb - (UME GLASS)
K-C_Sb -- (UME GLASS)
K-CIPSb ÷ (LIME GLASS)
GaAS (_ 9741 GLASS)
GI_Jz (- 9741 GLASS)
GBAs (- 9741 GLASS)
GaAs (- 9741 GLASS)
OaAs (._ 9741 GLASS)
Ga/M_ (+ 9741 GLASS)
GmAs (+ 9741 GLASS)
Gi_DI%B( _- 9741 GLASS)
Ga.tnA._ (+ 9741 GRASS)
GalnAs (+ 9741 GLASS)
Sl
B) COMPOSITE GRAPH OF PHOTOEMISSIVEDETECTOR RESPONSIVITY
I .L I , , I.4 .S .e .7 .8 .9 1.0
), (_.)1.1
Figure 3. Summary of "best" photoemissive detector responsivi-ties from the near ultraviolet to the near infrared.
7-7
Detector sensitivity at a particular wavelength is usually
expressed as "spectral responsivity" in milliamperes/Watt. It
is related to quantum efficiency by the equation
where R(k) is the detector spectral responsivity at wavelength
k, h is Planck's constant, and c is the velocity of light. A
composite responsivity curve, which is the envelope of indi-
vidual responsitivity curves for some common visible and near
infrared photoemissive detectors[Slater, 1980; Zwicker, 1977]
is illustrated in Figure 3.
5 "OPTIMUM" WAVELENGTHS FOR TWO COLOR SLR
In choosing "optimum" candidate wavelengths for successful two
color ranging, there are a variety of technical issues the engi-
neer must consider. These will be discussed in the ensuing sub-
sections. As we shall now see, equation (3.6) for the RMS error
in the atmospheric correction for the photon-limited case,
combined with the radar link equation (4.1), points the way to
the selection of a set of optimum wavelengths. Since we want to
minimize aAC, the inverse of (3.6) can serve as an overall system
figure of merit.
5.1 ATMOSPHERE
The dependence of (3.6) on the atmospheric dispersive function
/(k) illustrates the need for adequate atmospheric dispersion
between the two wavelengths in order to reduce the severity of
the timing requirements. The atmospheric dispersion curve in
Figure 1 strongly suggests that one wavelength be chosen to
lie in the near ultraviolet. On the other hand, atmospheric
attenuation in the spectral band between 0.3 and 0.7 microns,
resulting from the combined effects of molecular (Rayleigh)
and aerosol (Mie) scattering and ozone absorption, also
increases rapidly in the near ultraviolet as shown in Figure
2. This will negatively impact the timing precision by lower-
ing the photoelectron count at the UV wavelength. Furthermore,
in choosing a laser wavelength, it is probably wise to avoid
the strong water absorption lines in the spectral regions
between 0.7 and 1.0 microns and beyond i.i micron. The high
variability of water vapor total burden would impact both the
day-to-day signal strength and cause the pulse group velocity
to vary via the anomalous dispersion effect near an absorbing
feature.
5.2 LASER TRANSMITTER
The availability of lasers capable of generating high peak
powers and ultrashort pulsewidths on the order of 35 picosec-
onds or less is also a consideration. Preference is generally
given to solid state lasers because of the practical
difficulties of using liquid dye lasers in the field. Over the
7-8
past decade, much progress has been made in the development ofhighly tunable solid state lasers such as Alexandrite (700 to
810 nm) and Titanium-doped sapphire (600 to 900 nm). The widebandwidths of these new materials are capable of supporting
subpicosecond pulsewidths whereas today's workhorse, Nd:YAG,
is limited to about I0 picoseconds by it's relatively narrow
linewidth (120 GHz). However, high bandwidth comes at a price
- i.e. lower gain - making the construction of high peak power
Ti:Sapphire and Alexandrite devices more difficult.
Generally, the wavelengths in two color systems are generated
from the fundamental wavelength k I via nonlinear optical tech-
niques such as harmonic generation in crystals or Raman shift-
ing in gases. This assures simultaneity of emission and
eliminates (thankfully) the need to synchronize the firings of
two separate lasers with picosecond precisions. However,
reliance on nonlinear teqhniques implies that the two wave-
lengths cannot be chosen independently of each other. In the
case of harmonic generation, the second and third harmonic
wavelengths are given by
respectively.
In Raman shifting, a portion of the incident radiation at
input frequency, v o is shifted by some fixed amount v s (the
"Stokes shift") toward longer wavelengths relative to the fun-
damental. One also obtains frequencies at longer ("Stokes")
and shorter ("Anti-Stokes") wavelengths, but these are
generally too weak to supply sufficient energy for satellite
ranging. Large Stokes frequency shifts, and hence high disper-sion between wavelengths, are obtained by Raman shifting in
light gases. Hydrogen produces the largest shift of 4155 cm -I,
and photon conversion efficiencies as high as 80% have been
reported. For example, one proposed two color SLR system usesthe second harmonic of Nd:YAG (532 nm) in hydrogen to obtain a
second wavelength output at 680 nm [Gaignebet et al, 1986].
A second consequence of harmonic or Raman generation is that
the pulsewidth of the secondary wavelength is generally
shorter than the pulsewidth of the fundamental. From the
theory of harmonic generation [Degnan, 1979], the harmonic
pulsewidths are approximately given by
TI T 1
for low to moderate energy conversion efficiencies (< 50% -the usual case). Raman generation depends on third order non-
linear processes, and the pulsewidth dependence is identical
to that of third harmonic generation.
7-9

5.3 WAVELENGTH FIGURE OF MERIT
In order to treat all potential system configurations on an
equal basis, some assumptions are in order. We will assume
that the fundamental laser, from which all other wavelengths
are derived, is characterized by an energy E and a pulsewidth
7p which is constant for all wavelengths. Thus, Equation (3.6)becomes
_/ 1 1 (5.3)
where 81 and 82 are pulsewidth scale factors which depend on
the nonlinear process used to generate them as in (5.2). In
addition, we recognize that wavelengths derived via nonlinear
processes are obtained with some typical energy efficiency
which we will denote by q_ and q2 respectively. If the funda-
mental wavelength is used as one of the two wavelengths, we
will assign values of _f = 1 and U/= I. For second and third
harmonic generation in the ultrashort pulse regime, typical
conversion efficiencies are _sh = .5 and qth =.2 respectively.
In order to derive a wavelength figure of merit, we must now
bring together all of the wavelength dependent terms in equa-
tions (4.1) and (3.5). We obtain for the figure of merit
!
(5.4)
where /(k) is the wavelength dispersion term in the Marini-
Murray atmospheric correction formula, q_ and _z and 81 and _2
are the energy conversion efficiencies and pulsewidth
reduction factors respectively for the relevant nonlinear pro-
cess, R(A) is the spectral responsivity, and Ta(k.E) is the
one way atmospheric transmission as a function of wavelength
and elevation angle. The factor of k 4 comes from the combined
inverse square law dependence of the transmitter and target
(retroreflector) gains on wavelength. The additional factor of
k associated with converting detector quantum efficiency to
spectral responsivity cancels with a similar factor in (4.1)
which converts transmitter laser energy to the number of
transmitter photons. In plotting (5.4), we will use the enve-
lope of the individual photoemitter responsivity curves in
Figure 3 so that we present each wavelength in its most
favorable light.
7-10

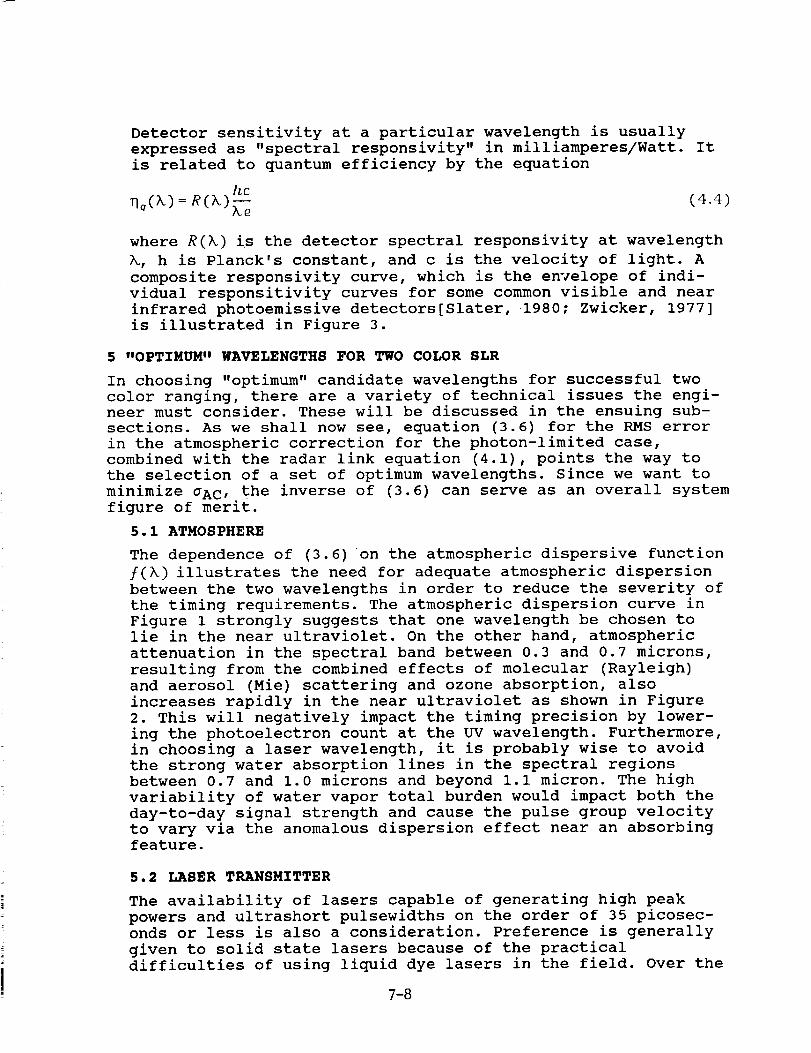
6 CONCLUSIONS
Figure 4 provides plots of the wavelength figure of merit as a
function of the fundamental (laser) wavelength and elevation
angle for the extremely clear atmosphere depicted in Figure 2.
Parts (a), (b), and (c) correspond to elevation angles of 90, 45,
and 20 degrees respectively. The three curves within each plot
compare systems which use: (1) the fundamental and second har-
monic wavelengths; (2) the fundamental and third harmonic wave-
lengths; and (3) the second and third harmonic wavelengths.
In spite of their greater dispersion, fundamental-third harmonic
systems have the lowest figure of merit at all elevation angles
due to a combination of poor detector performance at the funda-
mental and poor atmospheric transmission at the third harmonic.
The performance of these systems peaks at a fundamental
wavelength of about .97 microns independent of elevation angle.
At zenith, fundamental-second harmonic systems, operating at
wavelengths of 670 and 335 nm, have the highest figure of merit
(F = 1.75) but second-third harmonic systems, operating at wave-
lengths of 525 and 350 nm (fundamental = 1050 nm), are almost as
good (F = 1.6). As one progresses to smaller elevation angles,
atmospheric attenuation in the ultraviolet begins to dominate and
the optimum fundamental wavelength is shifted toward longer wave-
lengths with a corresponding reduction in the wavelength figure
of merit. Thus, the Nd:YAG laser, with a fundamental wavelength
of 1064 nm and a very mature technology, is a near-optimum choice
for a second-third harmonic system. However, a fundamental-second
harmonic system which utilizes a Ti:Sapphire laser operating inthe near infrared beyond 670 nm is a possible alternative.
Figure 5 suggests that a fundamental wavelength of about 400 nm
is optimum for a hydrogen Raman-shifted laser and that these sys-
tems offer no real advantage over harmonic systems because of
their lower wavelength figure of merit. Thls conclusion is
further supported by the fact that there are no high power solid
state lasers operating in the near ultraviolet. The principle
short wavelength devices are excimer ("excited dimer") gas dis-
charge lasers. At present, excimers cannot achieve ultrashort
pulsewidths on the order of picoseconds, typically operate in the
high atmospheric attenuation region of the spectrum below 360 nm,
and are operationally less desirable than high power solid state
lasers. Doubling or tripling solid state lasers to achieve a near
ultraviolet wavelength prior to Raman shifting only decreases the
overall wavelength figure of merit further by reducing the values
for the energy efficiency factors _i and _2- However, this effect
is partially offset by the slight reduction in pulsewidth (in-
creased _ values) resulting from nonlinear generation.
7-11
(A) E = 90 _2
0.6 .7 .8 .9 1.0 1.1 1.2
FUNDAMENTAL WAVELENGTH. X. (i¢)(B) E = 45 °
2
0,6 .7 .8 .9 1.0 1.1 1.2
FUNDAMENTAL WAVELENGTH. X. (p,)
(C) E = 20"
2t_ - ] I ] I I I I I ! I I
& I--- FUND-2ND __1
0.6 .7 .8 .9 1.0 1.1 1.2
FUNDAMENTAL WAVELENGTH. X (p,)
Figure 4. Two color wavelength figure of merit for fundamental-second harmonic, fundamental-third harmonic, and second-third
harmonic systems operating in an extremely clear atmosphere at
elevation angles of (a) 90 ° , (b) 45 ° and (c) 20 ° respectively.
7-12

1.0
0.8
0.6
--- 0.4U_
0.2
I I I I I I I I
/., RAMAN
.3 .4 ,5 .6 .7
FUNDAMENTAL WAVELENGTH, X(_)
m
.8
Figure 5. Two color wavelength figure of merit for Raman systems
operating in an extremely clear atmosphere at elevation angles of
90 ° , 45 ° and 20 ° .
7 REFERENCES
Abshire, J. B. and C.S. Gardner, "Atmospheric refractivity cor-rections in satellite laser ranging", IEEE Trans. on Geoscience
and Remote Sensing, GE-23, pp. 414-425, 1985.
Degnan, J. J., "Physical processes affecting the performance of
high-power, frequency-doubled short pulse laser systems: analy-sis, simulation, and experiment", Ph.D. Dissertation, University
of Maryland, College Park, MD, May 1979.
Degnan, J. J., "Satellite Laser Ranging: Current Status andFuture Prospects", IEEE Trans. on Geoscience and Remote Sensing,
GE-23, pp. 398-413, 1985.
Degnan, J. J., "Millimeter Accuracy Satellites for Two Color
Ranging", these proceedings (1992).
Gaignebet, J., F. Baumont, J. L. Hatat, K. Hamal, H. Jelinkova,
and I. Prochazka, "Two wavelength ranging on ground target using
Nd:YAG 2HG and Raman 0.68 _m pulses", Proceedings of the Sixth
International Workshop on Laser Ranging Instrumentation, Antibes-
Juan Les Pins, France, September 22-26, 1986.
Klein B. J., and J. J. Degnan, "Optical antenna gain. 1. Trans-
mitting antennas", Applied Optics, 13, pp. 2134-2140, 1974.
7-13

Marini, J. W. and C. W. Murray, "Correction of laser range track-
ing data for atmospheric refraction at elevations above i0
degrees", NASA Report X-591-73-351, Goddard Space Flight Center,
1973.
Owens, J. C., "Optical refractive index of air: Dependence on
pressure, temperature, and composition", Applied Optics, 6,51-58,
1967.
RCA Electro-optics Handbook, Technical Series EOH-10, RCA Commer-
cial Engineering, Harrison, NJ, 1968.
Slater, P. N., Remote Sensing: Optics and Optical Systems, Chap-
ter 13, Addison-Wesley Publishing Co., Reading, Massachusetts,
1980.
Zwicker, H. R., "Photoemissive Detectors", in Optical and
Infrared Detectors, Ed. R. J. Keyes, Springer Verlag, New York,
1977.
7-14
N94-15581
Two Color Satellite Laser Ranging Upgrades
At Goddard's 1.2m Telescope Facility
Thomas W. ZagwodzkiJan F. McGarryJohn J. Degnan
NASA/Goddard Space Flight CenterGreenbelt, Maryland 20771
Thomas K. Varghese
Bendix Field Engineering CorporationSeabrook, Maryland 20706
Abstract
The ranging laboratory at Goddard°s 1.2m telescope trackingfacility has recently been upgraded to include a singlephotoelectron sensitive Hamamatsu streak camera-based rangereceiver which uses doubled and tripled Nd:YAG frequencies forsatellite laser ranging. Other ranging system upgrades include anew Continuum laser, which will deliver up to 30 millijoules (mJ)at both 532 and 355 nm at a pulsewidth of 30 picoseconds(FWHM), and replacement of both ranging and tracking computerswith COMPAQ 386 based systems. Preliminary results using aphotomultiplier tube based receiver and waveform digitizerindicate agreement within the accuracy of the measurement withthe theoretical Marini and Murray model for atmospheric refraction.Two color streak camera measurements will be used to further
analyze the accuracy of these and other atmospheric refractionmodels.
7-15
INTRODUCTION
Satellite laser ranging efforts at the 1.2m tracking telescope at
Goddard's Geophysical and Astronomical Observatory (GGAO) have
evolved over the past few years in response to the demand for more
accurate SLR data. This includes a frequency-tripled Nd:YAG laser
system and a streak camera based range receiver. The laboratorywhich houses the Experimental Satellite Laser Ranging System
(ESLRS) adjoins a azimuth-elevation mount multi-user facilitydesigned to support the scientific community at the Goddard Space
Flight Center. Two of six facility experimenter port locations arededicated to the laser transmitter and the streak camera based
receiver for ranging applications. The ESLRS is a ranging laboratory
where new instrumentation, hardware and software are investigated
and characterized for planning and developing next generation
systems. The SLR data gathered by the ESLRS is considered
engineering data and is not archived as is other NASA laser trackingnetwork data. The end users of the ESLRS data are the
experimenters and their goal is to use this information to better
understand system problems and to help transition laboratory
systems more efficiently to field SLR operations. Other system
upgrades include a new 386 based tracking computer, a new 386
based ranging computer, and physical plant upgrades at the facility.
The ESLRS has been operational since 1983 except for periods in
which high priority flight programs within the Instrument Electro-
Optics Branch left the facility without crew support. The initial
SLR system [McGarry et al, 1986] included a Quantel YG 402 DP
frequency-doubled Nd:YAG laser, a two stage ITT F4128
microchannel plate photomultiplier tube (MCP-PMT), Ortec 934 andlater Tennelec TC 453 constant fraction discriminators (CFD's), and
a developmental time interval unit (TIU) built by Lawrence Berkeley
Laboratory. This system operated at a 5 hertz rate at the doubled
YAG wavelength (532nm) and yielded data at the 1 to 2 centimeter
level on LAGEOS with a very high return-to-fire ratio.
7-16
PROGRAMGOALS
Goddard Laser Tracking Network (GLTN) systems currently operatingat or below the 1 cm level RMS must still rely on models ofatmospheric range correction which assume certain altitude profilesfor temperature, pressure, and possible gradient effects. Knowledgeof atmospheric range correction on a shot-to-shot basis is thereforeuncertain, and must be addressed to eliminate atmospheric concerns.
The best way of accounting for the atmospheric range correction isto measure it on a shot-to-Shot basis. The time of flight
measurement is made in the conventional manner with a MCP based
receiver using the 532nm pulse, while a differential time of flightbetween the 532nm and 355nm pulses is made with a streak camera
based receiver. In making a streak camera differential measurement
accurate at the few picosecond level, the atmospheric rangecorrection can be recovered at the few millimeter level. Work in
improving ground-based SLR accuracies closely parallel work on
planned next generation space-based laser ranging systems. Efforts
in the ranging laboratory at the 1.2m facility have been
concentrating on both programs in this parallel effort.
SYSTEM UPGRADES
The extension from single color to two color operation at the 1.2m
facility required significant system upgrades, one being an
improvement in low mirror reflectivities in the UV. Recoating of all
telescope mirror surfaces was required since previous coatingsrevealed mirror reflectivities in the UV of typically 50 to 60% andone as low as 40%. For a 6 mirror coude focus system used in
common optics configuration, UV operation was prohibitive. Newaluminum mirror coatings with an SiOx overcoating (peaked at
355nm) improved surface reflectivities to typically 92% at 355nmand 88% at 532nm while maintaining broadband characteristics
required by other experimenters at the facility.
Return signal levels from LAGEOS are not adequate for two colorstreak camera-based operation with the present system. Therefore
we have opted to use low earth orbiting satellites such asSTARLETTE, AJISAI, and ERS-1 for two color data collection. As an
acquisition aid for sunlit passes, two TV camera systems have beenadded to the mount, and a third low light level RCA silicon
intensified target (SIT) camera has been used in the system primefocus.
7-17

Facility upgrades include the replacement of the PDP 11/24 tracking
computer with a COMPAQ 386/20 based system, and new
meteorological instruments including air pressure, temperature, and
relative humidity. The ranging computer, a LSI 11/23 (MINC), was
also replaced with a COMPAQ 386/20 system.
Ranging instrumentation upgrades include both laser transmitter andreceiver. The laser available for use at the 1.2m facility for ranging
from 1983 to March of 1992 was a Quantel passively mode locked
Nd:YAG system model number YG402 DP. This laser system generated
up to 60 mJ of doubled YAG at 532nm and about 15 mJ of tripled YAG
at 355 nm in a 140 picosecond pulse (FWHM). To make differential
measurements accurate at the picosecond level laser pulsewidths
must be narrowed considerably, and target satellites with low pulse
spreading must be used. The Quantel laser was replaced with aContinuum model PY-62 YAG with doubling and tripling capability.
The new Continuum laser outputs 30 picosecond pulses with about
30 mJ of energy at both 532nm and 355nm. The laser fire rate is
currently 4 hertz, with work underway to increase it to 10 hertz.
The laser is housed in a clean room approximately 10 meters fromthe base of the mount. The output beam is coupled into the telescope
system with a negative lens (negative focal length matching the F28
ray bundle of the 1.2m system) and a 45 degree aperture sharing
'holey' mirror just inside the system focal plane. The outgoing laserbeam is translated approximately 1.25 cm from the optical axis of
the telescope to avoid the shadowing by the central obscuration
(secondary mirror) in the telescope. The output beam is
approximately .4m in diameter, exits the system cleanly between
the primary and secondary mirror, and travels around that annulus as
the system tracks in azimuth. This configuration results in theleast amount of loss in the outgoing beam. In the common optics
mode the return path at the 45 degree mirror is folded across an NRC
table top to another mirror, splitter, and receiver package. In the
prime focus of the system is a field stop, to limit the receiver field
of view, and a high speed shutter.
The receive signal is split between a two stage ITT model F4128MCP PMT and a Hamamatsu streak camera. Shown in Figure 1 is a
simplified block diagram of the system that was used for bothaircraft and Relay Mirror experiments as well as current SLR
activities. The streak camera in use up until the Spring of 1992 was
7-18

7-19
a 2 picosecond resolution Hamamatsu model 1370. This unit was
integrated into the system in support of two color experimentswhich included both aircraft and the NASA/Air Force Relay Mirror
Experiment (RME) programs. The signal threshold for the Hamamatsu1370 streak camera is estimated at several thousand photoelectrons
and could be used only for ground work, aircraft, and the RME
program where signal levels were extremely high. The Hamamatsu1370 streak camera has since been replaced with a newer
Hamamatsu model 2909 which has an additional internal
microchannel plate intensifier giving the unit single photoelectron
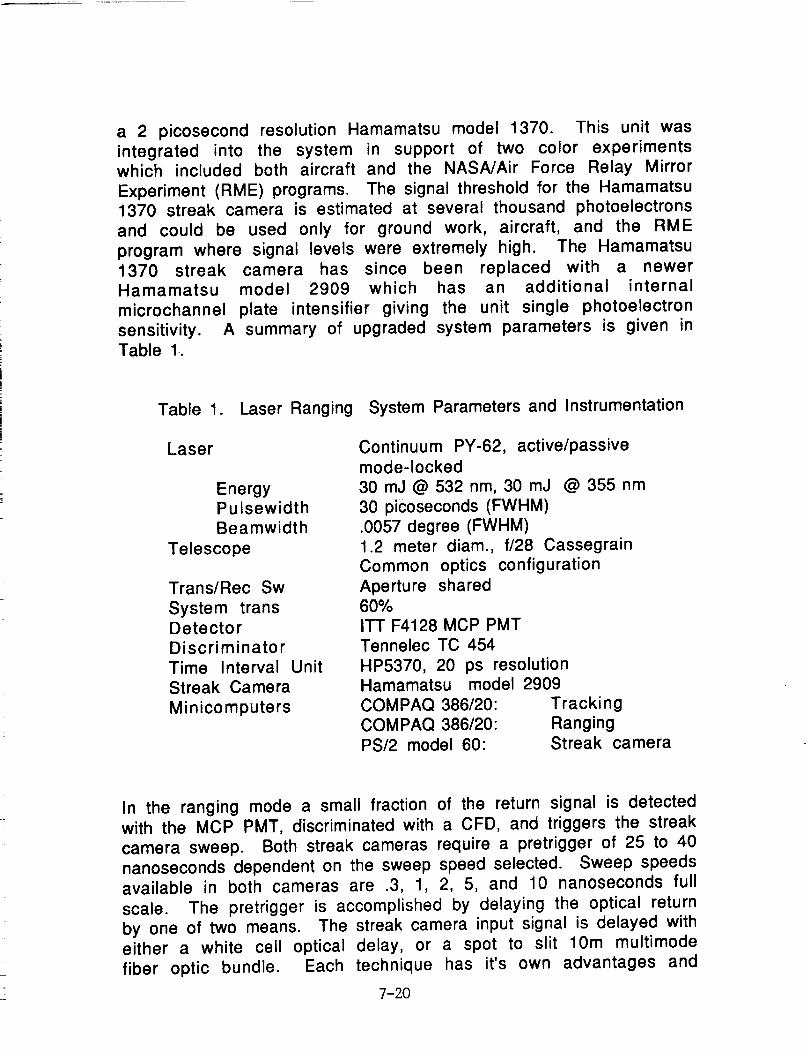
sensitivity. A summary of upgraded system parameters is given inTable 1.
Table 1. Laser Ranging
Laser
EnergyPulsewidth
Beamwidth
Telescope
Trans/Rec Sw
System transDetector
Discriminator
Time Interval Unit
Streak Camera
Minicomputers
System Parameters and Instrumentation
Continuum PY-62, active/passive
mode-locked
30 mJ@532nm, 30 mJ @355nm
30 picoseconds (FWHM)
.0057 degree (FWHM)1.2 meter diam., f/28 Cassegrain
Common optics configuration
Aperture shared60%
ITT F4128 MCP PMTTennelec TC 454
HP5370, 20 ps resolutionHamamatsu model 2909
COMPAQ 386/20: Tracking
COMPAQ 386/20: Ranging
PS/2 model 60: Streak camera
In the ranging mode a small fraction of the return signal is detectedwith the MCP PMT, discriminated with a CFD, and triggers the streak
camera sweep. Both streak cameras require a pretrigger of 25 to 40nanoseconds dependent on the sweep speed selected. Sweep speeds
available in both cameras are .3, 1, 2, 5, and 10 nanoseconds full
scale. The pretrigger is accomplished by delaying the optical return
by one of two means. The streak camera input signal is delayed witheither a white cell optical delay, or a spot to slit 10m multimode
fiber optic bundle. Each technique has it's own advantages and
7-20
disadvantages. The fiber optic bundle is easy to align and has the
largest field of view, but introduces pulse spreading, while thewhite cell has the best throughput, no pulse spreading, but is
difficult to align. To maintain the best differential timing
capability at the receive end an artificial delay on the 532nm pulseis introduced at the laser transmitter. This delay is a dogleg optical
path into a total internal reflection (TIR) cube corner on a
Compumotor linear motor stage. The linear translation stage
provides the differential delay control from -.5 to 10 nanoseconds
additional optical path length for the 532nm pulse so that both
return pulses can be maintained within the 1 nanosecond sweep
window. The linear motor stage under computer control uses the
differential delay predicted by differencing the Marini & Murray
model delays at 355nm and 532nm The optical delay is adjusted so
that the two spatially separated pulses are incident in the streak
camera slit at approximately the same time. This minimizes
nonlinearity problems in the streak camera sweep. To resolve
simultaneous pulses in the PMT based receiver using the waveform
digitizer two PMT'S must be used.
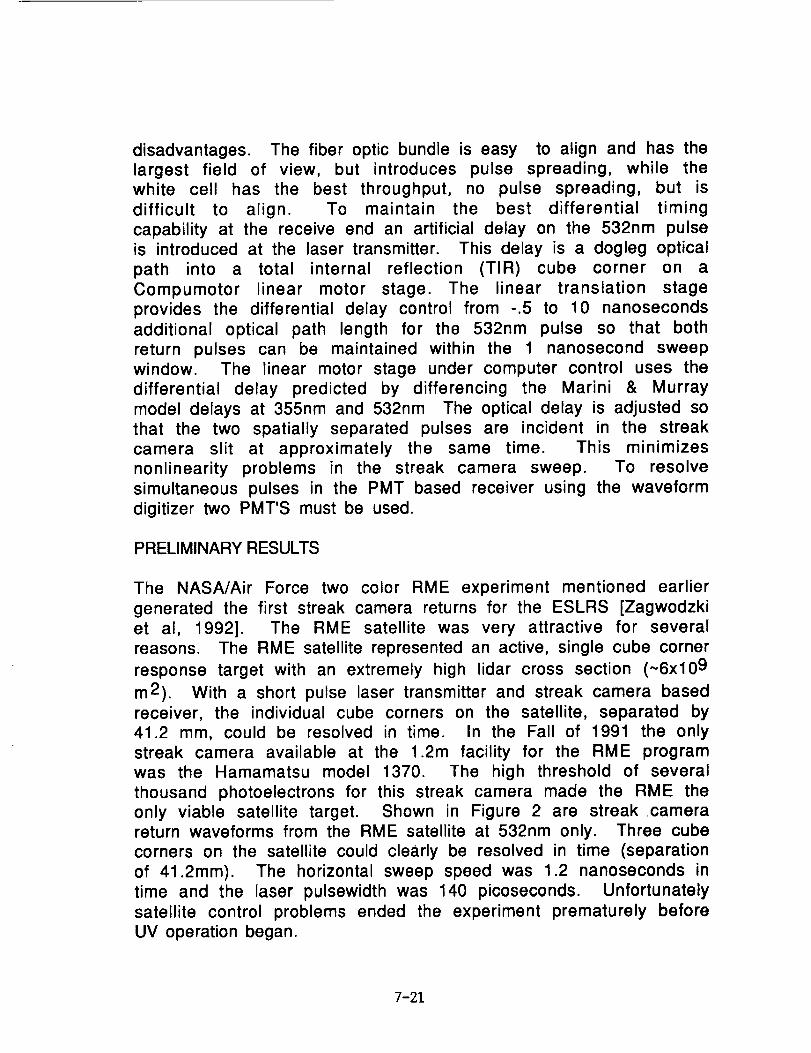
PRELIMINARY RESULTS
The NASA/Air Force two color RME experiment mentioned earlier
generated the first streak camera returns for the ESLRS [Zagwodzki
et al, 1992]. The RME satellite was very attractive for several
reasons. The RME satellite represented an active, single cube corner
response target with an extremely high lidar cross section (~6x10⁹
m2). With a short pulse laser transmitter and streak camera based
receiver, the individual cube corners on the satellite, separated by
41.2 mm, could be resolved in time. In the Fall of 1991 the only
streak camera available at the 1.2m facility for the RME programwas the Hamamatsu model 1370. The high threshold of several
thousand photoelectrons for this streak camera made the RME the
only viable satellite target. Shown in Figure 2 are streak camerareturn waveforms from the RME satellite at 532nm only. Three cube
corners on the satellite could clearly be resolved in time (separation
of 41.2mm). The horizontal sweep speed was 1.2 nanoseconds in
time and the laser pulsewidth was 140 picoseconds. Unfortunately
satellite control problems ended the experiment prematurely before
UV operation began.
7-21
EL0
O
3:=
D
c_
0
o ..o
. -
* ._ o
,<.::'.
" °-,....
.°;°"
-..0..-.-
!o.
E
0C_
apn1!IdwV aA!IDla_l
°s " * "
.,.-
°.
c_
- c,,,J
]8
-_r_,J
'_0 r.,."lI_C_ CL
8 _._,r_
_o
o
8
o__
C_)
cn
c_-Q.
:N
E
0
o
orY
o
8
o
- .'._; :" :"i8
-c,.,;
a."
°.° ,.|
o ° %...- o
; :." ioo
. :".: , -.
"_... oo
0o
I
I-1
apn1!IdwV aA!IDla_
o
_J
..,
"°a,":_-o o
o"-;-".
.
°'- ..,.
' ..... iN
_r . i, .. i I .... i .... i,.,. I .... _. i I .... i .... i . .
o
L
u_.)
os,_
o
I.I.I
n-
i-
EoI,--
"4--
r-I....
I,-
E
o
0_
"4'--'
E
c_
11.-
IJ.
apn1!IdwV aA!IDla_l apnl!ldwV aA[IOla_l
7-22

The loss of the RME as a target meant satellite streak camera workhad to wait for the installation of the more sensitive Hamamatsu
2909 unit. In the interim, two color efforts have continued at the
1.2m facility using the MCP PMT based receiver with a 1 Ghzbandwidth Tektronix model 7912 waveform digitizer. The ranging
system can be configured with two PMT's (one each for 532nm and
355nm) or a single PMT (usually the 355nm). For night time
operation, when no bandpass filters are required, a single PMT isused. Since the UV link is the weakest, the PMT with peaked
quantum efficiency at 355nm is used. To resolve two distinct
pulses with the single UV PMT the differential delay at thetransmitter is set to allow at least two nanoseconds offset between
the peaks of the two pulses. This assures adequate separation of
return pulses at the receiver, but reduces the temporal resolution of
the differential time-of-flight measurement.
Figure 3 shows a comparison plot of the theoretical differential
delay versus the measured delay calculated from the two color
returns as seen by the Tektronix 7912. The theoretical differential
delay was calculated by differencing the 355nm and 532nm delays
computed using the Marini and Murray model. The Marini and Murraycalculations used the weather conditions from the log file taken
during the pass. This weather information was taken in real-time,
so the actual temperature and pressure were not constant. The
pressure changed minimally (1006.27 to 1006.31 millibars) as did
the temperature (14.24 to 14.48 C). The gaps (thinner lines) in the
Marini and Murray curve represent times that no weatherinformation was available, and so the data had to be interpolated for
those regions.
For this pass the linear translator was fixed at 6 nanoseconds. This
necessitated a slow sweep setting on the 7912 waveform digitizer
in order to capture both frequency's return waveforms during the
entire pass. Setting the green delay at 6 nanoseconds always placedthe 355nm return ahead of the 532nm return and caused the UV
pulses to move toward the green as the elevation decreased.
The measured differential delay was computed by taking the
inverted raw 7912 waveforms (no smoothing) and computing the
pixel locations of the highest two peaks. The location of these two
pixels was differenced, converted to nanoseconds, and subtracted
from the fixed 6 nanosecond green delay. This was a "quick-look" atthe data so no interpolation was performed between pixels, and
7-23

X
XX
XxXx
X
X
X
X
X
X
X
X
[_asu] IV7-:1(]
00
c:__0:3
0
0
0
"7_
Eo_
c_
oI_
_- 0
"I0 (n
0--
O0O--
c6
0L=.
w--
i,
7-24
there was no 7912 calibration data used to
nonlinearities in the sweep.correct any
The calibration of the linear translator was not performed as
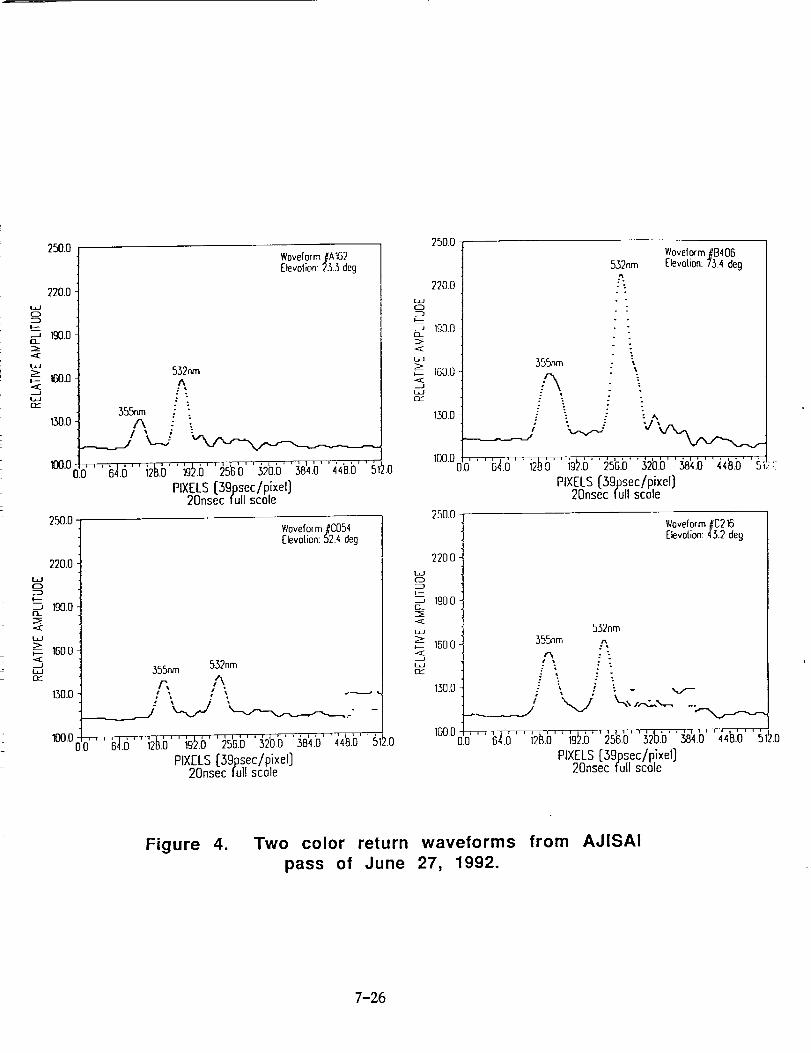
accurately as it will be for streak camera data. The actual zero
point of the translator for the 7912 data was good to approximately+/- 200 picoseconds. Actual raw 7912 return waveforms at
different elevations are shown in Figure 4. In these plots the 7912
data is inverted, but not smoothed in any way.
FUTURE WORK
Two color laser ranging activities will continue at the 1.2m facility
to complete the installation of the streak camera based receiver
with single photoelectron sensitivity. This will enable tracking of
all low earth orbit satellites in two colors and will yield a good
data set for atmospheric model comparisons. Investigative work
will begin in the areas of system automation, and optical time
interval units. [Degnan, 1985]
ACKNOWLEDGEMENTS
The authors wish to thank the Strategic Defense Initiative
Organization Office of Directed Energy for use of the Relay Mirror
Experiment satellite, the Phillips Laboratory of Albuquerque, NewMexico for their coordinating efforts, and the Consolidated Space
Test Center of Sunneyvale, California for their work in providing
NASA the satellite maneuvers for optical engagements.
We would like to thank Arnie Abbott of NASA for his services in
maintaining the 1.2m facility, and Tammy Bertram for her
operational support. We would also like to thank Bendix Field
Engineering Corporation crew members Dick Chabot, Jim Fitzgerald,Dave Grolemund, Mike Seldon, Tom Oldham, and Jack Cheek of
Hughes- STX for their continued effort in support of this program.
REFERENCES
J.J. Degnan, "Satellite Laser Ranging: Current Status and Future
Prospects", IEEE Trans. on Geoscience and Remote Sensing, GE-23, pp.
398-413, July, 1985.
7-25
250.0
220.0
0
_o_o
_- 160.0
130.0
100.0
250.0-
220.0
LJO
-_ IgO.O0_
_- 160.0
Woveform #A1G2[levotion: 233 dog
532nmA
.355nm
A '" :%
' ' ' _.6' ' i2_.b' ' b_.6' ' _5g.b'' i2b.b' 'g'4.b' 'i4'a.b' ' _lkOPIXELS [39psec/pixel]
20nsec full scole
130.0
Woveform#C054[levotion: 52.4deg
355nm 532nm
_loo.o0.0'' ' _.6' ' i213.b'' b_.6' ' _5'6.b'' g2bb' '_8'4.b'' 4_.b' 'g_.o
PIXELS[39psec/pixel]20nsec full scole
250.0-
2200
LJCb
IgOO
_- 1G0.0
LJQE
130.0
532nm
._
WoveformNB406[levotion: 73.4 deg
355nm :
A ":. : :
,; ._.v..j V 'x/A_,k, _
PIXELS [39psec/pixel]20nsec full stole
250.0
220.0
_oo
w
150.0.<
bJ
1300
Woveform#C216Elevotion:43.2 deg
532nm355nm w,
,_, :-• _ ." :
- : :- :_ ; _ _ ,.!--
_.6' ' bt_.b'' b_.o' ' _5'o.b'' _2b._;'' ]8_.b' '_.b' ' _100.00.0
PIXELS[39psec/pixel]20nsec full scole
!.0
Figure 4. Two color return waveforms from AJISAI
pass of June 27, 1992.
7-26
J. L. McGarry, T. W. Zagwodzki, J. J. Degnan, "Large aperture high
accuracy satellite laser tracking," in Proc. of S.P.I.E. Acquisition,
Tracking, and Pointing, Orlando, Florida, April, 1986.
T.W. Zagwodzki, J.F. McGarry, A. Abbott, J.W. Cheek, R.S. Chabot, J.D.
Fitzgerald, D.A. Grolemund, "Laser Ranging to the Relay Mirror
Experiment (RME) Satellite from Goddard Space Flight Center's 1.2m
Telescope Facility", to be published in the Journal of GeophysicalResearch.
7-27
N94-15582
Measuring Atmospheric Dispersion With WLRS
In Multiple Wavelength Mode
U. Sehreiber 1
Forschungseinricht ung SatelhtengeodaesieFundamentalstation Wettzell
D - 8493 Koetzting
K. H. Haufe R. Dassing,
Institut fuer Angewandte GeodaesieFundamentalstation Wettzell
D - 8493 Koetzting
Abstract
The WLRS (Wettzell Laser Ranging System) allows the simultaneous tracking ofsatellites on two different wavelengths. These are the fundamental frequency of Nd :YAGat 1.064 pm and the second harmonic at 532 nm. Range measurements to the satelliteLAGEOS were carried out with different experimental set- ups, after developing a de-tector unit based on a silicon avalanche photodiode in Geiger mode, which is sufficientlysensitive in the infrared domain. An approach towards a quantitative interpretation of
the data is suggested and discussed briefly.
1 The effect of atmospheric dispersion on satellite ranges
The varying index of refraction of the atmosphere can be considered one of the most impor-
tant contributions to the error sources for satellite ranges. Following a model of Marini and
Murray [1], the additional time for the laser pulse passing through the atmosphere under an
elevation angle of 90 degrees is as much as 8 as. This model assumes rotational symmetric
atmospheric layers with respect to the geocenter and has been established with the help
of ballon experiments. Inputs to to this model are atmospheric pressure, temperature and
humidity, which are measured around the ranging station. In general it can be said that
the calculated corrections are very precise, so that the requirements for an experimental im-
provement are extremly high [2]. However, orbit fitting procedures on the basis of complex
programs often show a small systematic error, depending on the pointing elevation of the
ranging station. Therefore a better determination of the atmospheric influence is desirable.
2 The experimental set- up
2.1 The ttwo-' detector experiment
When the WLRS telescope was designed [3], care had been taken to optimise the signal path
for the fundamental (1.064/_m) and second harmonic (532 nm) wavelength of the Nd:YAG
1Techn. Universitaet Muenchen, Arcisstr. 21 D - 8000 Muenchen 2
7-28
laser. The remaining optical components of the ranging equipment were replaced to allow
transmission and reception of these 2 frequencies. In the beginning it was not known if
the second harmonic generating crystal (KD*P) would laterally displace the pulses of the
2 frequencies so far, that there would not be a sufficient overlap of the two signals at
the location of the satellite. During the experiments a weak dependance of the return
rate of each detector with respect to the pointing was noticed. However, the overlap was
found to be acceptable. The WLRS- system uses the same telescope for transmitting and
receiving, therefore the photodetector was placed behind the transmit/receive- switch inside
the thermocontrolled laboratory. This gives the advantage of high signal stability and an
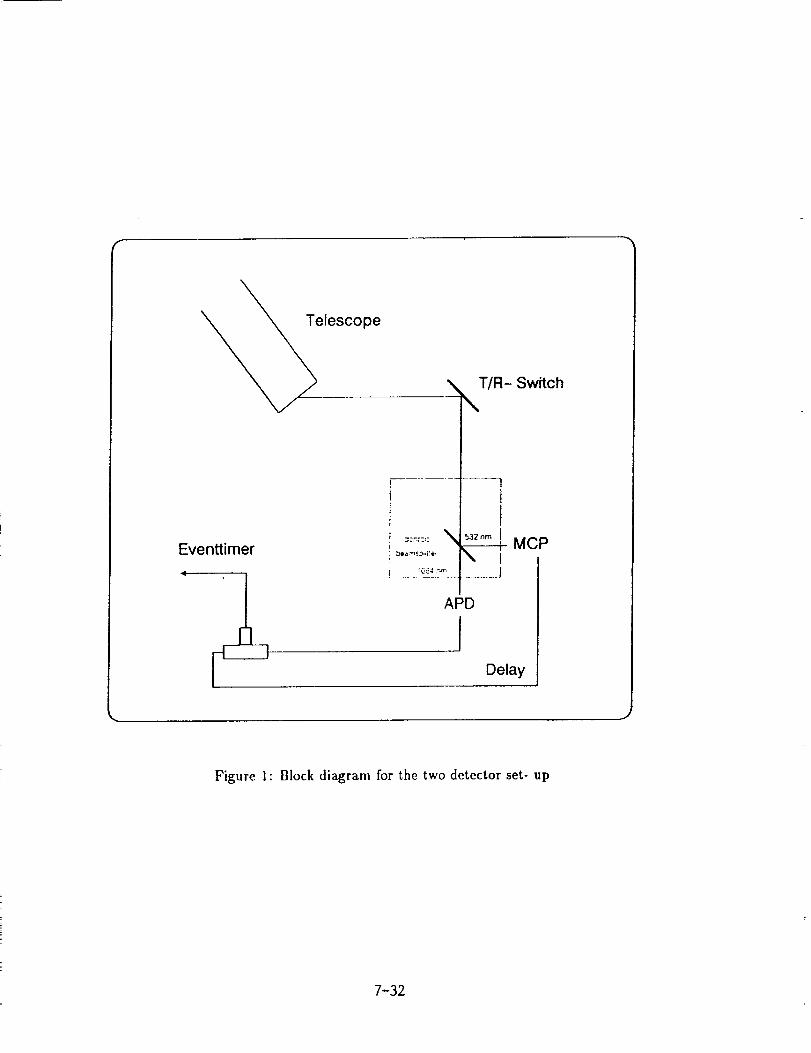
easily accessible working enviroment. Figure 1 outlines the experimental set- up. The receive
signal is split into its two different frequency components at a dichrolc mirror. The signs2
with a wavelength of 532 nm is reflected towards a microchannel plate (MCP), while the
infrared part of the satellite echo is focused onto the active area of an avalanche photodiode
(APD: SPll4) placed in Geiger mode. In its present state, the WLRS is capable of recording
one stop event per outgoing laser pulse only. This causes the detection of either an event
from the MCP or the APD. To achieve a high number of echos from both channels, a constant
delay- line of 44.9 ns was added to the MCP output, before recombining both signal lines at
an impedance matched T - junction and feeding them to the eventtimer. There are two stops
for each measured roundtrip possible, only one of them will be recorded, as the electronics
gets disactivated after processing one event. The delayline places the less favourable signal
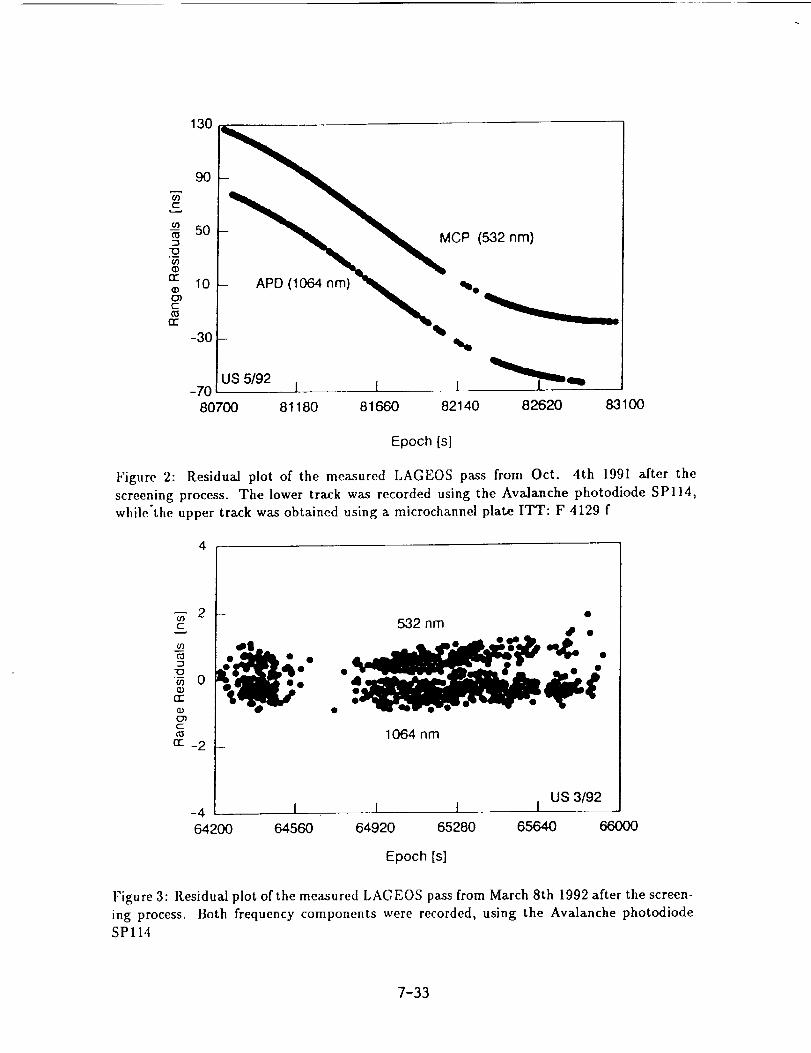
channel to be detected first. When the measured return residuals axe plotted versus time
one can see two signal tracks (fig. 2) separated in range by the delay of the additional
cable. This can be noticed during tracking and indicates, if there are enough recordings for
both laser frequencies. The contribution to each wavelength has to be separated during the
analysis, as all the range information goes to one datafile.
2.2 The 'one-' detector experiment
A slowly varying instability (i.e. drift) in the detector characteristics would be indicated
during the ranging run, as a shot by shot calibration to a fixed target is carried out. To
exclude such effects generally, the experiment was altered to use just one detector. The
dichroic mirror (ref. fig. 1) was removed and the APD recorded both frequencies. The
sensitivity of the diode is higher on 532 nm than on 1.064 #m but, because of the dispersion
of the atmosphere, the infrared signal reaches the detector first. Therefore, a sufficient
amount of data for both signal frequencies can be obtained. For the present this kind
of experiment is restricted to the night hours, as there are no suitable spectral filters for
this application. During tracking, the operator notices the formation of one track only, as
both satellite tracks axe separated by their differential atmospheric dispersion delay only,
which contributes as much as 0.6 to 1.8 ns. In figure 3 there is a residual plot for such
a measurement. In the analysis the two tracks also have to be seperated. To calibrate
this measurement a circuit has been developed, which detects the starting oscillation in the
laser after the fire command and forms a trigger signal to gate the APD into the Geiger
mode before the calibration return hits the diode. This process is extremly time critical.
Measurements to the local ground target demonstrate the proper operation of this set- up.
7-29
3 Analysing the satellite data
In this approach the question of wether the simultaneous use of different laser frequencies
would result in the same satellite range information and, under the condition that a large
amount of ranges have been measured, whether the measurements would Mlow for a correc-
tion of the employed atmospheric model were of interest. Therefore the analysis is limited
to the differences in the range residuals of the two spectral components. In the following,
the measurements obtained at a wavelength of 532 nm are taken as a reference to correct for
other satellite ranging side effects; a non linear least squares fitting procedure is employed
to fit a polynomial up to the order of 12 to the reference data. In the second step, the range
residuals of the measurement in the infrared spectral domain are analysed. It was assumed
that this data can be represented by the same polynomial when the additional contribution
by the atmospheric dispersion and, if applicable, the extra cable delay is taken into account.Under the condition that the model of Marini and Murray gives a good representation of
the atmospheric influence, so that there can be a minor modification to it only, it is:
= - -
where _4 represents the contribution of the difference of the atmospheric dispersion of
the two used laser frequencies depending on the elevation angle w. _ is a dimensionsless
scaling factor around the value of 1 and/_ yields the constant value of the introduced extra
delay. The measured range depending on the epoch is given by r. A curve fitting result of
= l gives the exact representation of the Marini- Murray model. It is a known i'act that a
possible range correction for this pair of frequencies contributes with a value of only a few
ps to the difference between the two used laser frequencies at a given pointing elevation (i.e.
a fixed pathlength through the dispersive medium). This can not be taken from the rangeresidual distribution. However, the characteristic elevation dependence of the difference of
the ranges of the two laser frequencies places a constraint on the model, such that it might
allow an interpretation of the ranging results, especially when a wide range of elevation
angles has been spanned by the measurements. At low elevation angles, the separation
of the two frequency components is largest, so it is desirable to range down to very low
elevation angles. The model has been tested by creating a data set, introducing _ = 1.05
to an arbitrarily chosen data set of ranges artificially. After running through the evaluation
procedure a = 1.05002 was obtained as a result. This shows, that a small additionally
introduced effect could be well extracted by this procedure. However, this can not be taken
as sufficient proof for the applicability of the suggested model modification.
4 The experimental results
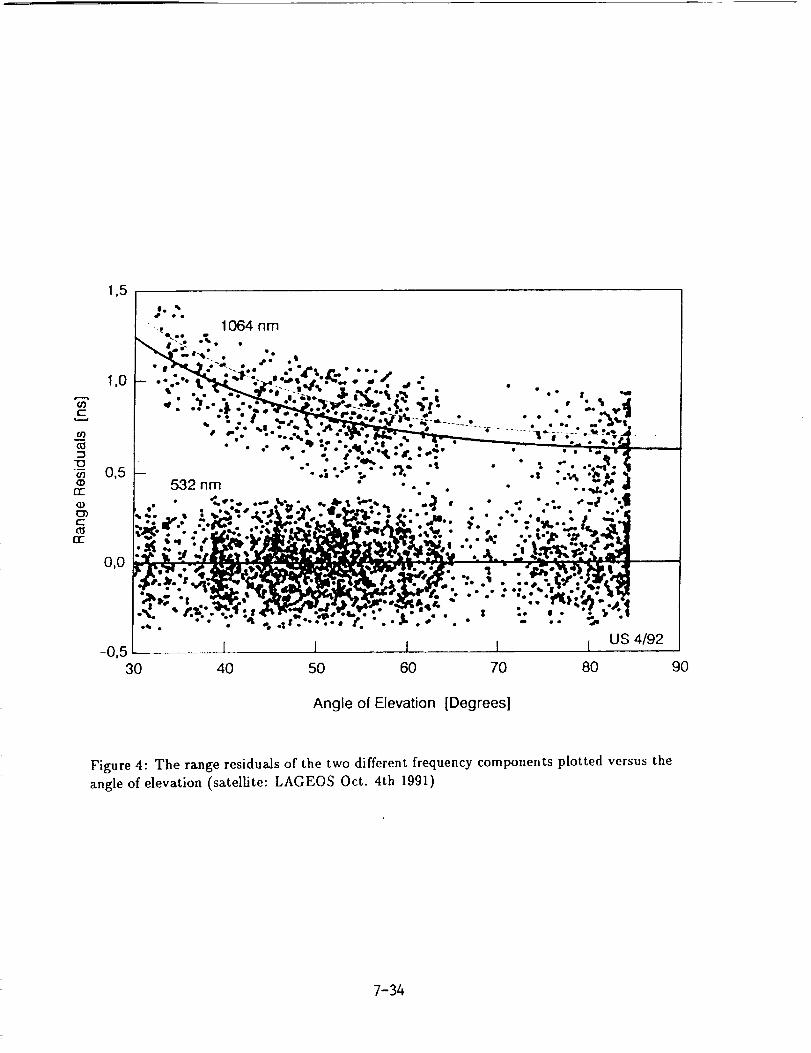
Up to now there are two series of measurements, one for each experimental set- up. In
figures 4 and 5 the obtained range residuals are plotted versus the angle of elevation. Inthe lower part of each diagram the fitted data of the reference wavelength (A = 532 nm) is
displayed, while the upper half shows the satellite returns taken at the other laser frequency.
In all cases a satisfying residual distribution around the fitted curve was obtained. As a side
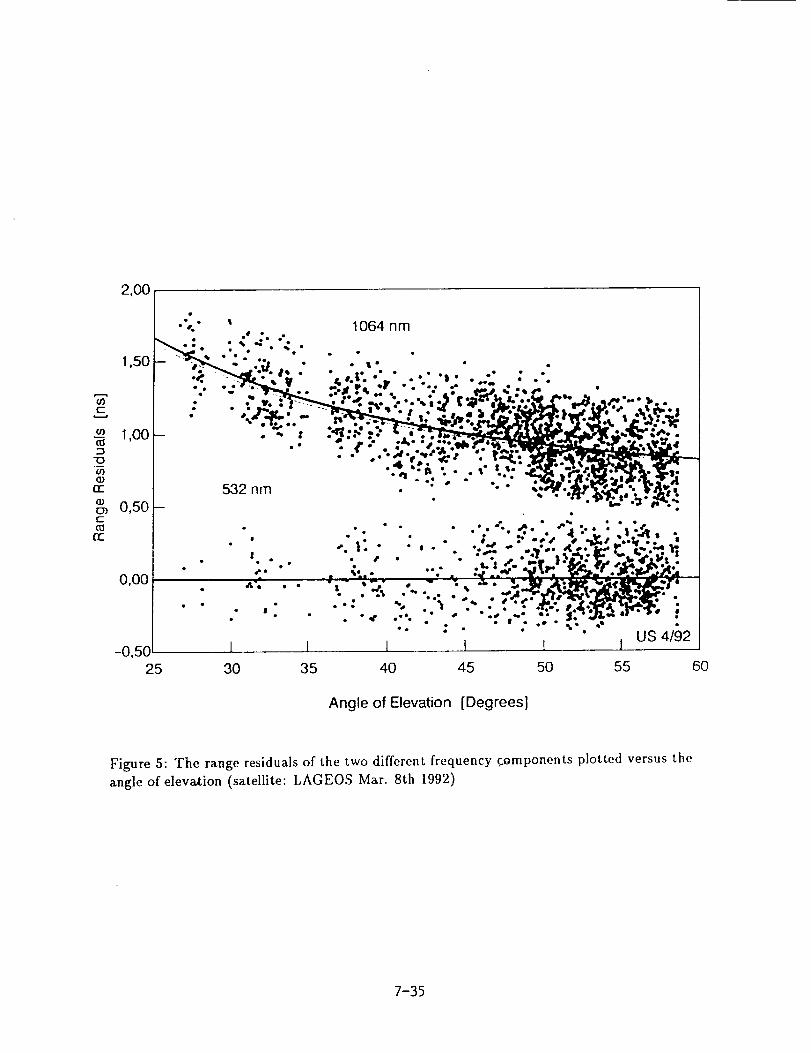
effect, figure 5 shows a higher sensitivity of the photodiode in the infrared spectral range.
This was unexpected because the system is at least one order of magnitude more sensitivearound 532 nm. The results are summarized in table 1:
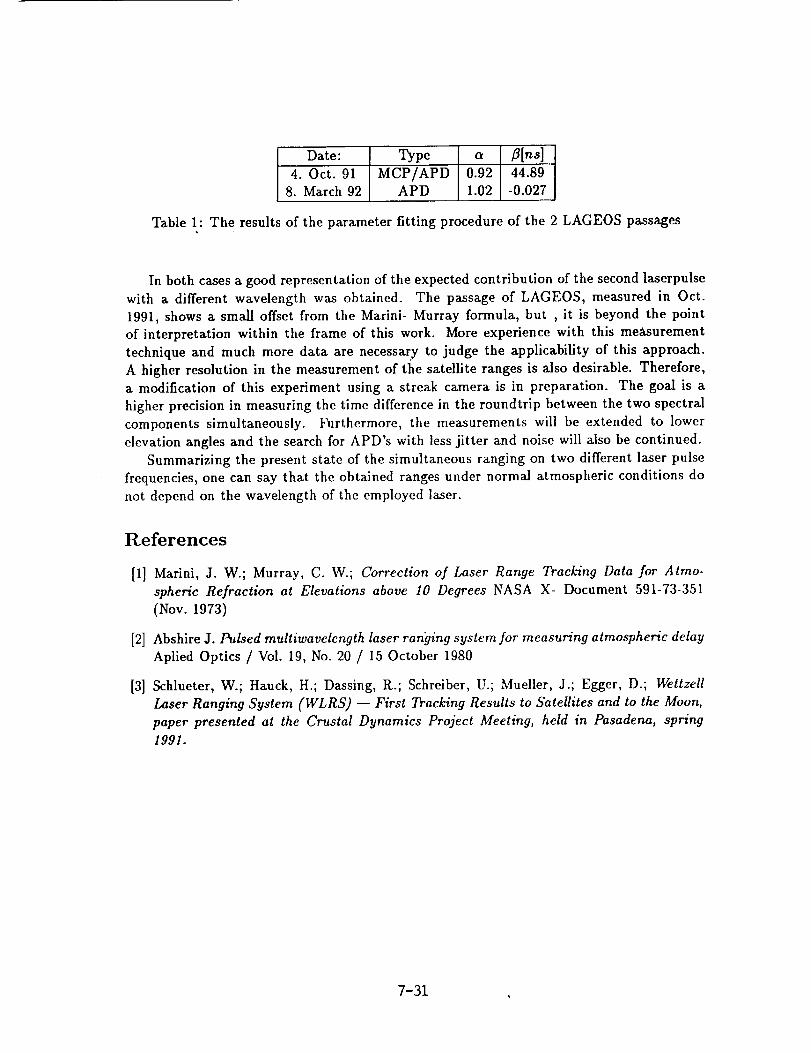
Date: Type4. Oct. 91 MCP/APD8. March92 APD
0.92 44.89
1.02 -0.027
Table 1: The results of the parameter fitting procedure of the 2 LAGEOS passages
In both cases a good representation of the expected contribution of the second laserpulse
with a different wavelength was obtained. The passage of LAGEOS, measured in Oct.
1991, shows a small offset from the Marini- Murray formula, but , it is beyond the point
of interpretation within the frame of this work. More experience with this measurement
technique and much more data are necessary to judge the applicability of this approach.
A higher resolution in the measurement of the satellite ranges is also desirable. Therefore,
a modification of this experiment using a streak camera is in preparation. The goal is a
higher precision in measuring the time difference in the roundtrip between the two spectral
components simultaneously. Furthermore, the measurements will be extended to lower
elevation angles and the search for APD's with less jitter and noise will also be continued.
Summarizing the present state of the simultaneous ranging on two different laser pulse
frequencies, one can say that the obtained ranges under normal atmospheric conditions do
not depend on the wavelength of the employed laser.
References
[1] Marini, J. W.; Murray, C. W.; Correction of Laser Range Tracking Data for Atmo-
spheric Refraction at Elevations above I0 Degrees NASA X- Document 591-73-351
(Nov. 1973)
[2] Abshire J. Pulsed multiwavelength laser ranging system for measuring atmospheric delay
Aplied Optics / Vol. 19, No. 20 / 15 October 1980
[3] Schlueter, W.; Hauck, H.; Dassing, R.; Schreiber, U.; Mueller, J.; Egger, D.; Wettzell
Laser Ranging System (WLRS) -- First Tracking Results to Satellites and to the Moon,
paper presented at the Crustal Dynamics Project Meeting, held in Pasadena, spring
1991.
7-31
lescope
,_ T/R- Switch
\
Eventtimer
' !
II
:£,64 ".,'_ j
.......... n-- t ............. J
I
APD
I
MCP
Delay
Figure l: Block diagram for the two detector set- up
7-32
130
t-
"O
(Dtr
OCDt-
12:
90
5O
10
-3O
MCP (532 nm)
- APD (1064 nm] _,
%,
US 5/92-70 1 1 1
80700 81180 81660 82140 82620 83100
Epoch [s]
Figure 2: Residual plot of the measured LAGEOS pass from Oct. 4th 1991 after the
screening process. The lower track was recorded using the Avalanche photodiode SPII4,
while'the upper track was obtained using a microchannel plate ITT: F 4129 f
532 nmell • •co • •• •
_, , •_'r''e'ql r'-•II_
CcO
(:l:_2l_4nm
US 3/92-4 1 I I I64200 64560 64920 65280 65640 66000
Epoch[s]
Figure 3: Residual plot of the measured LAGEOS pass from March 8th 1992 after the screen-
ing process. Both frequency components were recorded, using the Avalanche photodiode
SPll4
7-33
1,5
._ 1064 nm
1.oL .'. i..,_;_i,'._.,.:;,t.'.._-_: :"<, - . II ¢- .'. _'_.J'f;_,'---""" _- '-" .... " • " •. • --, J
I --: • F" _ "_rt*,s _-_,%- ,' .... "%: J II • • ,_ •..?.,- _ ,.,1,,.11_1,.o_.._v -% i,--,,- ...... • .......... • .," ._"S. I
_ 0,5rr 5.32 n
_ .i *4*
gn,-
0,0 f'_ " "' _
-0,5 i l 1 i US 4/92
30 40 50 60 70 80 90
Angle of Elevation [Degrees]
Figure 4: The range residuals of the two different frequency components plotted versus the
angle of elevation (satellite: LAGEOS Oct. 4th 1991)
7-34
Or)c"
--_ 1,00
I3
(I)rr"
13)a} 0,50c
rr
2,00 1 "-;." _ .° ".. 1064 nm
r-_-_:. :%4. ,_. I• • • • • •1,5ol- _" ." ..:, • . ,. • .
l 532 am "" '_' _'"___:'_'_:_
",'2" ;;" "
• • . .o; %• • • •o • • • •eP _o e•
I I I .° " _ " [ " " I US4192
0,00
-0,5025 30 35 40 45 50 55 60
Angle of Elevation [Degrees]
Figure 5: The range residuals of the two different frequency components plotted versus the
angle of elevation (satellite: LAGEOS Mar. 8th 1992)
7-35

N94-1558
MILLIMETER ACCURACY SATELLITES FOR TWO COLOR RANGING
John J. Degnan
Code 901
NASA Goddard Space Flight Center
Greenbelt, MD 20771 USA
ABSTRACT
The principal technical challenge in designing a millimeter accu-
racy satellite to support two color observations at high alti-
tudes is to provide high optical cross-section simultaneously
with minimal pulse spreading. In order to address this issue, we
provide, in this paper, a brief review of some fundamental prop-
erties of optical retroreflectors when used in spacecraft target
arrays, develop a simple model for a spherical geodetic
satellite, and use the model to determine some basic design cri-
teria for a new generation of geodetic satellites capable of sup-
porting millimeter accuracy two color laser ranging. We find that
increasing the satellite diameter provides: (i) a larger surface
area for.additional cube mounting thereby leading to higher
cross-sections; and (2) makes the satellite surface a better
match for the incoming planar phasefront of the laser beam.
Restricting the retroreflector field of view (e.g. by recessing
it in its holder) limits the target response to the fraction of
the satellite surface which best matches the optical phasefront
thereby controlling the amount of pulse spreading. In surveying
the arrays carried by existing satellites, we find that European
STARLETTE and ERS-I satellites appear to be the best candidates
for supporting near term two color experiments in space.
7-36

1 INTRODUCTION
A companion article in these proceedings [Degnan, 1992] demon-strates the benefits of utilizing and maintaining ultrashort pul-
sewidths in performing two color ranging measurements tosatellites. Unfortunately, even if one starts with a very short
pulsewidth (e.g. 35 psec), most of the existing satellites willbroaden the pulse significantly thereby degrading the precision
of the differential time-of-flight measurement. This is espe-
cially true for the high altitude satellites, such as LAGEOS and
ETALON, which are the primary targets for space geodesy
applications. The principal technical challenge in designing amillimeter accuracy satellite to support two color observations
at high altitudes is to provide high optical cross-section simul-
taneously with minimal pulse spreading. In order to address this
issue, we provide, in this paper, a brief review of some
fundamental properties of optical retroreflectors when used in
spacecraft target arrays, develop a simple analytical model for
spherical geodetic satellites, and use the model to determine
some basic design criteria for a new generation of geodetic sat-
ellites capable of supporting millimeter accuracy two color laser
ranging.
2 RETROREFLECTOR CHARACTERISTICS
For normally incident light, a single unspoiled retroreflector
has a peak (on-axis) optical cross-section Ucc defined by
f4nAcc)oct--=p (2.1)
where P is the cube corner reflectivity, A_=nR 2_ is the light
collecting area of the corner cube, and 4nA_/k 2 is the on-axis
retroreflector gain. For a circular entrance aperture, the far
field diffraction pattern (FFDP) of the reflected wave is the
familiar Airy function given by [Born and Wolf, 1975]
o(x) =_ (2.2a)
where
x = kR¢_sin(O l) (2.2b)
The Airy pattern consists of a main central lobe surrounded byweak rings. The angular half-width from the beam center to the
first null is given by the first nonzero root of the Bessel func-
tion Jl which, with (2.2b), yields the formula
= 1.22--k (2.3)O"'tt Dec
where k is the wavelength and Dcc = 2 Rcc is the diameter of the
retroreflector.
7-37
At arbitrary incidence angle, the area in (2.1) is reduced by the
factor [Minott, 1974]
2 -l t-_l_ tan er,t) cos e,._rl(O,._)=_(sin p- (2.4)
where Oi.c is the incident angle and Orof is the refracted angle
determined by Snell's law, i.e.
Or_j=sin -1 sin (2.5)n
where n is the cube index of refraction. The quantity B is given
by the formula
_= _l-2tane0r_! (2.6)
Thus the peak optical cross-section in the center of thereflected lobe falls off as
o_t t (0_._) = .q2(0,._) o _ (2.7)
1.0
t',t"
£0I..IJ_Zu-oOV-rr oI- I..1..ILUe 0.5n-
rncOm 0N_rr_.1<O
0Z
FUSEDSILICA
HOLLOW CUBE
0 .... I0 10 20 30 40 50 60
INCIDENCEANGLE, DEGREES
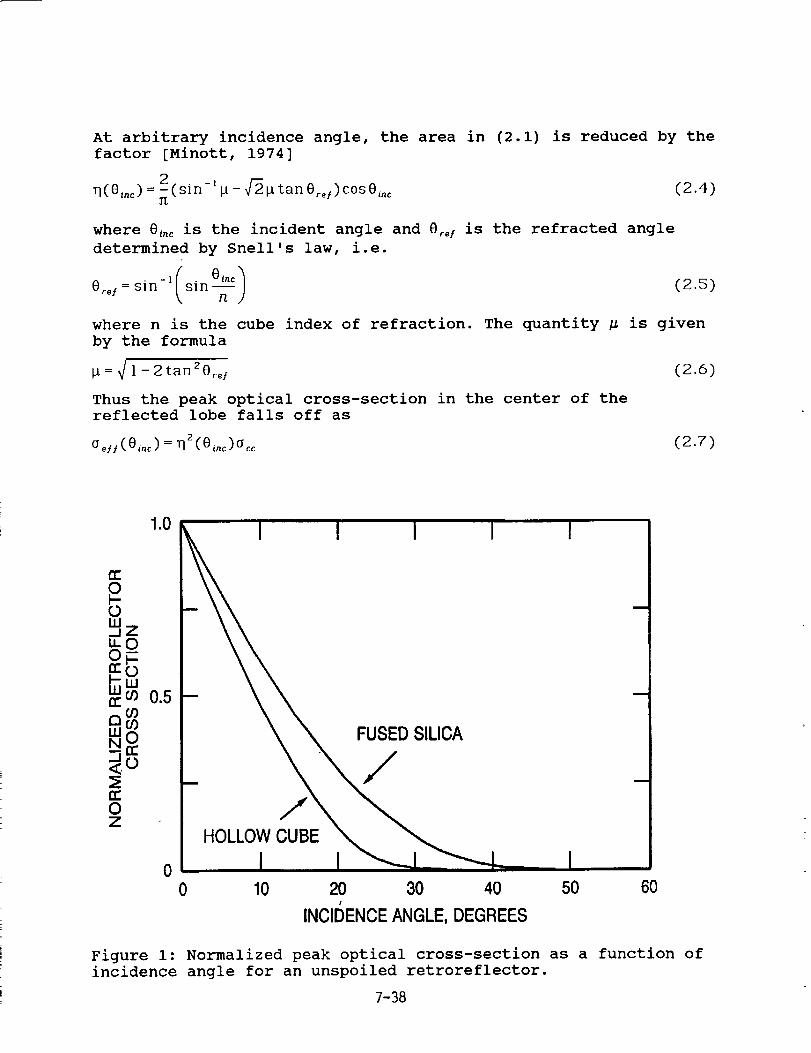
Figure i: Normalized peak optical cross-section as a function of
incidence angle for an unspoiled retroreflector.
7-38
Figure 1 shows the falloff of optical cross-section with inci-
dence angle for the two most common retroreflectors - hollow
(n=l) and quartz (n=1.455). Note that, for a solid quartz cube,
the optical cross-section falls to half its on-axis value at
roughly 13 ° incidence angle and is effectively zero beyond about40 ° . The cross-section for a hollow cube corner falls to half its
normal incidence value at about 9° and is effectively zero beyond
about 30 ° .
One can further limit the effective incidence angle over which
the retroreflector responds by recessing the reflector in its
holder. It can be easily shown that the incidence angle at which
the retroreflector response is zero is given by
Omax=COt-l(D_c ) (2.8)
where d is the depth of the recess.
3 VELOCITY ABERRATION
AS mentioned previously, the far field diffraction pattern (FFDP)
of a cube corner with a circular entrance pupil function corre-
sponds to the familiar Airy pattern consisting of a single main
lobe surrounded by low intensity rings. If there were no relative
motion between the satellite and the target, the center of the
FFDP would fall on the instantaneous line of sight between the
target and satellite. However, due to the relative velocity
between the satellite and the target, the coordinates of the FFDP
are translated. The magnitude of the angular displacement in the
FFDP is given by the equation [Minott, 1976]:
_(hs,e_.,co)= ama×(h_)_cosZco+Fz(hs,e_.)sin2co (3.1)
where the maximum value, amax, is given by the expression
I R_gamax( h,) =_2,1
C %/ RE+h_(3.2)
and
R Esin Oz_,
F(h_, O=_.) = 1 - RE+hs(3.3)
and R E is the Earth radius, g = 9.8 m/sec 2 is the gravitational
acceleration at the surface, hs is the satellite height above sea
level, c is the velocity of light, and the angle
co = cos-' [(r* Xl_ )" 0] (3.4)
7-39

where P, p, and u are all unity length vectors corresponding to
the satellite position vector (relative to the Earth center), the
line-of-sight vector between station and satellite, and the sat-
ellite velocity vector respectively. Since F(hs.8_,) is always
less than unity, equation (3.1) has an effective "minimum" value
for a given 8z_n, when _ = n/2. Thus,
Ot rain ( h s, 0 zo,_) = Ot max (_h s) 1F (h s, 0 zo,_) (3.5)
The maximum and minimum angular displacements of the FFDP are
plotted as a function of satellite height in Figure 2 assuming a
maximum 0ze. of 70 ° . It should be noted from the figure that the
angular displacement decreases with altitude and that the maximumand minimum values converge for high satellites. At ETALON alti-
tudes (19,000 Km), for example, the angular displacement is
roughly constant at about 26 _rad.
6O
5O
40
ot(_.rad)30
20
I' t I I I I''1 I I
C[ma X
F;| 0_11
I I ! I6, 8 10 12
h, (103kin)
10
0 I I2 4
,,,i14 16 18 20
Figure 2: Maximum and minimum angular displacements in the retro-reflector far field diffraction pattern caused by the velocityaberration effect as a function of satellite altitude above the
Earth's surface.
If the target FFDP is angularly narrow relative to the size of
the velocity aberration displacement, the receiver will lie on
the low signal edge of the FFDP or even lie outside the FFDP
entirely. For example, consider a moving retroreflector whoseface is normal to the ranging system line-of-sight. The cross-
section is given by (2.2a) with x=kRccSin(_)-kRcca where alpha is
the instantaneous angular displacement caused by velocity
7-40

aberration. If a << a,u m the reduction in cross-section is negli-
gible. However, if a is large, the reflected beam will "miss" the
receiver and low or nonexistent signal levels will result. For
non-normal incidence angles, the reflected FFDP is no longer cir-
cularly symmetric since the collecting (and transmitting) aper-
ture of the retroreflector appears as an ellipse to the range
receiver. The FFDP peak is again along the instantaneous receiver
line-of-sight, but the FFDP is now given by the two-dimensional
Fourier transform of the elliptic entrance aperture of the corner
cube. The velocity aberration causes the retroreflector response
to be reduced relative to the peak value given by (2.7). This
reduction is greater for velocity vectors which are parallel to
the long axis of the ellipse because of the faster falloff of the
FFDP with angle in this direction.
4 RETROREFLECTOR "SPOILING"
TO reduce the effects of velocity aberration in large retrore-
flectors, the retroreflector is often "spoiled". The goal of
"spoiling" is to concentrate more reflected energy into the
annular region bordered by ama X and ami .. Ideally, one would like
to uniformly spread the energy within the annular ring yielding
an optimum cross-section given by
max -- _ m|n
where the quantity in parentheses is the effective target gain
and _cc is the solid angle subtended by the annular ring of
interest. However, conventional spoiling techniques generally
result in average optical cross-sections which agree only within
an order of magnitude with the ideal limit described by (4.1).
Spoiling is usually accomplished by introducing slight variations
into the cube corner dihedral angles (typically less than two
arcseconds). This creates a complicated FFDP which, for an inci-
dent beam normal to the cube face, breaks the initial single main
Airy lobe into 2N lobes (where N = 1 to 3 is the number of
spoiled dihedral angles) distributed within an angular annulus.
The mean angular radius of the annulus increases linearly with
the dihedral offset angle from a perfect cube and, from diffrac-
tion theory [see (2.3)], one expects the effective width of the
various lobes to depend inversely on cube diameter.
Each of the 2N lobes originates from a different sector of the
retroreflector entrance aperture. In fact, the FFDP of each lobe
is determined by the two-dimensional Fourier transform of the
projection of the 180°/2N sector of the (assumed) circular retro-
reflector entrance aperture into a plane perpendicular to the
line-of-sight between the satellite and the station. The
distribution of energy within this "annulus" is therefore highly
nonuniform. Furthermore, the effective area for each lobe isreduced to:
7-41

Ace (4.2)d.H=_(O_.c)2N
Substituting the latter expression into (2.1), we obtain an
approximate expression for the peak optical cross-section at thecenter of one of the 2N lobes for the spoiled retroreflector at
arbitrary incidence angle
oc_ (4.3)Opeak(Oi.c.N)=qZ(O_.c)i2N)Z
One can also "spoil" the retroreflector by placing or grinding aweak lens onto the entrance face. This approach retains the
single central lobe of the unspoiled cube corner while reducing
its peak amplitude and spreading the energy over a wider solid
angle, _. This yields a peak cross-section given by
o_. _pAcc _ (4.4)
and can be an effective approach when velocity aberrations are
sufficiently small.
5 SATELLITE OPTICAL CROSS-SECTION
As noted previously, the optical cross-section which can be
achieved with a single retroreflector is limited by the need to
compensate for velocity abberation effects. Received SLR signalscan only be enhanced by summing the contributions of several
retroreflectors. Modern geodetic target satellites (e.g., STAR-
LETTE, LAGEOS, and ETALON) are all designed to be spherical in
shape in order to avoid the large pulse spreading caused byearlier flat panel arrays when viewed at non-normal incidence.
The spherical shape also simplifies the modelling of nonconserva-
tive forces acting on the satellite.
Satellite array size is largely determined by the satellite alti-tude since more retroreflectors are required to achieve reason-
able signal-to-noise ratios over longer slant ranges. Thus,
STARLETTE (960 Km), LAGEOS (5900 Km), and ETALON (19,200 Km) have
diameters of 12, 60, and 129.4 cm and average optical cross-
sections of .65, 7, and 60 million square meters respectively.
Let us consider a spherical satellite which is uniformly coveredwith retroreflectors. The density of cube corners, as a function
of incidence angle, is easily seen to be
N(Oi,_)d0i, =_sin0_,_d0,n_ (5.1)2
where N is the total number of reflectors on the satellite. To
obtain a simple expression for the overall target cross-section
_, we approximate the sum over all of the retroreflectors within
the allowed range of incidence angle by the following integral
7-42

R
(s.2)
where we have used (2.7). If the retroreflectors are not recessed
in their holders, q(Stnc) is given by (2.4). If their angular
response is limited by the recess, the variation can be well-
approximated by the expression
Otnc
q(O_._) = 1--- (5.3)rflaX
where Omax is given by (2.8). Actually, (5.3) is an excellent
approximation to (2.4) as well provided we choose ema × equal to
.54 rad (31 ° ) for hollow cubes or .75 rad (43 ° ) for solid cubes
respectively (see Figure i). Substituting (5.2) and (5.3) into
(5.2) and evaluating the resulting integrals yields
occN 1
V=-'_ (___) 2 (S.4)
Let us now examine the validity of (5.4) by substituting LAGEOS
values. The LAGEOS Satellite has a radius R = 29.8 cm and is
imbedded with 426 retroreflectors (422 fused quartz and 4 germa-
nium) with a clear aperture diameter Dcc of 3.81 cm. Ignoring the
fact that four cubes are germanium, we choose N = 426 and a value
of ema × = .75 rad for solid quartz cubes. We now use a value _cc =
2.834 x 10⁶ in agreement with the input values to the RETRO com-
puter program as determined during LAGEOS testing and evaluation
[Fitzmaurice et al, 1977]. Substituting the latter values into
(5.4) yields
OtAcEos = 9.8Vcc=2.78xlOZm 2 (5.5)
This is roughly equal to the peak value computed by the much more
detailed RETRO program which showed a range of values between .54
and 2.7 x 10⁷ m 2. Equation (5.4) tends to overestimate the actual
cross-section because it includes only geometric, and not veloc-
ity aberration, effects. Equation (5.5) also implies that the
LAGEOS array cross-section is roughly 9.8 times that of a single
cube corner at normal incidence.
7-43

OPTICAL
PHASEFRONTS
//
REFLECTION"POINTS"
"CONVENTIONAL"
GEODETIC SATELLrrE
Rs=>> Ra
MILLIMETER
SATELLITE
Figure 3: Diagram of a spherical geodetic satellite defining the
variables used in the analysis.
6 SATELLITE IMPULSE RESPONSE AND TARGET SPECKLE
An individual retroreflector responds as a point source and hence
does not spread the laser pulse in time. However, with a typical
array of retroreflectors, the laser pulse arrives at the "reflec-tion center" of each retroreflector at a slightly different time
leading to a broadening of the received pulse [Degnan, 1985]. Thelocation of the "reflection center" for an individual solid cube
corner reflector is given by [Fitzmaurice et al, 1977; Arnold,
1978]
si _,cAR(Oi.c)= nL 1 - = nLcosOre/ (6.1)
where AR(0i,c) is measured from the center of the front face of
the cube corner to the reflection point, L is the vertex to front
face dimension, n is the refractive index of the corner cube
material, 0_.c is the angle of incidence, and 0re/ is the corre-
sponding refraction angle. From Figure 3, it can be seen that a
7-44
cube at an angle 0i,c to the incident wave produces a time delay,
relative to the surface of the satellite closest to the ranging
station (0inc = 0), given by
At(0inc)=_{R-[Rs-_R(Oinc)]cosOinc}= l--c0s0in e l--EC0S0re I (6.2)C s
where Rs is the satellite radius. It should also be noted that
the differential delay between target reflection points also
introduces a random phase delay between individual reflectors.
Thus, if the temporal profiles from multiple cubes overlap at the
range receiver, the electric fields will interfere with each
other in a random way from shot to shot resulting in target
"speckle". On average, however, the return waveform from the sat-ellite should behave as if each of the retroreflectors is an
incoherent source. This was an implicit assumption in our
derivation of target optical cross-section in Section 5.
In the same spirit, the time-averaged satellite impulse response
can be estimated by summing the weighted (incoherent) returns
from each of the retroreflectors. Using the simple model for a
spherical satellite introduced in Section 5, the impulse responsecan be shown to be
dO,._ sin O,..q2 (O,._)6[t - At(O,._)] (6 3)
where the geometric weighting factor is given by (2.4) or
(5.3),A/(0_,c) is given by (6.2), and the delta function
5[t-_/(0Lnc) ] represents an infinitely short laser pulse waveform
incident on the satellite. From (6.2), we see that the delta
function is nonzero only when the condition
I-TcosO( , ,n) =
, [co,oc c,°,]21 -6 1 -_+ .
(6.4)
holds where we have defined the new variables
ctT -- 6 < T < T max
2Rs
nL 1 + COS max (6.5)6 -- R s T max = I- C0S0ma x i-6 I -_
The variable • is a normalized time, expressed in units of the
roundtrip transit time from the surface of the satellite to the
center and back, and e is the ratio of the optical depth of the
cube to the satellite radius. The minimum and maximum values of
7-45
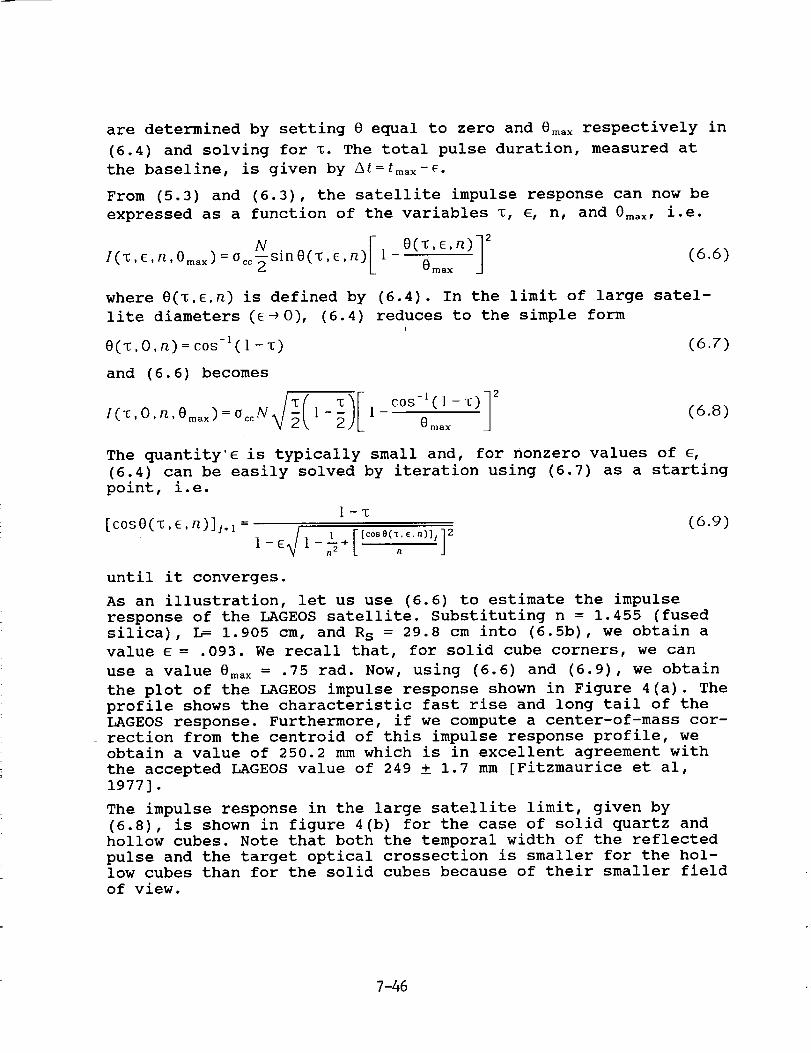
are determined by setting 8 equal to zero and 8ma × respectively in
(6.4) and solving for _. The total pulse duration, measured at
the baseline, is given by At=tmax-6.
From (5.3) and (6.3), the satellite impulse response can now be
expressed as a function of the variables _, e, n, and @max, i.e.
N [ 0('_, 6,n)72
l('_'6'n'Oma×)=°cc-2sinO(_'6'n)L 1 0--m_x J (6.6)
where 8(T.6.n) is defined by (6.4). In the limit of large satel-
lite diameters (6 _ 0), (6.4) reduces to the simple forml
O(_,O,n)=cos-l(1-_) (6.7)
and (6.6) becomes
2'(T,0,/'_,0max) = 0ceNt/2(1 -_)[ 1 - cos-'(1-,)] 2Omax (6.8)
The quantity'e is typically small and, for nonzero values of e,
(6.4) can be easily solved by iteration using (6.7) as a starting
point, i.e.
I-T
[COS0(T'6'/_)]i÷I = ]-6_ l-nzl--+[[c°se(x'E'n)]J]2--n
(6.9)
until it converges.
As an illustration, let us use (6.6) to estimate the impulse
response of the LAGEOS satellite. Substituting n = 1.455 (fused
silica), L = 1.905 cm, and R s = 29.8 cm into (6.5b), we obtain a
value 6 = .093. We recall that, for solid cube corners, we can
use a value 0ma x = .75 rad. Now, using (6.6) and (6.9), we obtain
the plot of the LAGEOS impulse response shown in Figure 4(a). The
profile shows the characteristic fast rise and long tail of the
LAGEOS response. Furthermore, if we compute a center-of-mass cor-
rection from the centroid of this impulse response profile, we
obtain a value of 250.2 mm which is in excellent agreement with
the accepted LAGEOS value of 249 ± 1.7 mm [Fitzmaurice et al,
1977].
The impulse response in the large satellite limit, given by
(6.8), is shown in figure 4(b) for the case of solid quartz and
hollow cubes. Note that both the temporal width of the reflected
pulse and the target optical crossection is smaller for the hol-
low cubes than for the solid cubes because of their smaller field
of view.
7-46

1.0 I
08
N_ 06
0.4
0.2
0 J0 100
I I I _
L I I I _d_--_
200 300 400 500 600 700
t (PICOSECONDS)
0.06
uJo9z 0.04OO..o9 0.03W
nr"w 0.02o9....I
0.01O..
-- 0
0
i I i I i
_OUAR_cuBE_
i I_l I
0.1 0.2
Z=_2R
0.3
Figure 4: (a) Impulse response of the LAGEOS satellite as com-
puted by our simple analytical model. (b) Impulse response in thelarge satellite limit for both hollow and solid quartz cubes.
7 FEASIBILITY OF MILLIMETER ACCURACY SATELLITES
We will now demonstrate that, in order to achieve high optical
cross-section simultaneously with minimal pulse spreading with aspherical satellite, we must increase the satellite diameter
and/or retroreflector density and simultaneously restrict the
response to retroreflectors within a relatively small solid angle
on the satellite surface about the station line o5 sight.
7-47
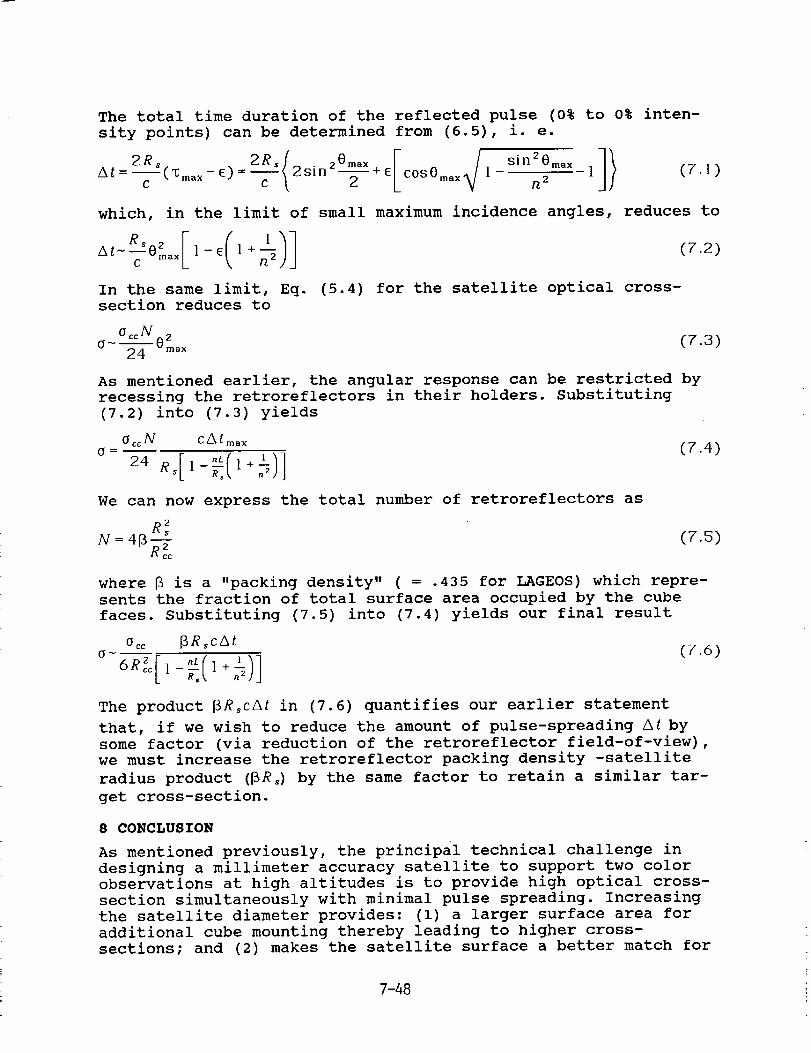
The total time duration of the reflected pulse (0% to 0% inten-
sity points) can be determined from (6.5), i. e.
At = --('_max- E)=C _ t2sin --+62 COS Omax 1 n2 1 (7 .1)
which, in the limit of small maximum incidence angles, reduces to
-R'0 [- e(l+
In the same limit, Eq.section reduces to
(7.2)
(5.4) for the satellite optical cross-
0"co N
o'- -_- O_,,, (7.3)
As mentioned earlier, the angular response can be restricted by
recessing the retroreflectors in their holders. Substituting
(7.2) into (7.3) yields
OccN CAtmax0 = (7.4)
24 R,[1-"_(I+_)]
We can now express the total number of retroreflectors as
8 2
N=4p_ (7.5)
where _ is a "packing density" ( = .435 for LAGEOS) which repre-sents the fraction of total surface area occupied by the cube
faces. Substituting (7.5) into (7.4) yields our final result
0_ [3R_cAt(7.6)
6Ri
The product _RscAt in (7.6) quantifies our earlier statement
that, if we wish to reduce the amount of pulse-spreading At by
some factor (via reduction of the retroreflector field-of-view),we must increase the retroreflector packing density -satellite
radius product (_Rs) by the same factor to retain a similar tar-
get cross-section.
8 CONCLUSION
As mentioned previously, the principal technical challenge in
designing a millimeter accuracy satellite to support two color
observations at high altitudes is to provide high optical cross-
section simultaneously with minimal pulse spreading. Increasing
the satellite diameter provides: (i) a larger surface area for
additional cube mounting thereby leading to higher cross-
sections; and (2) makes the satellite surface a better match for
7-48
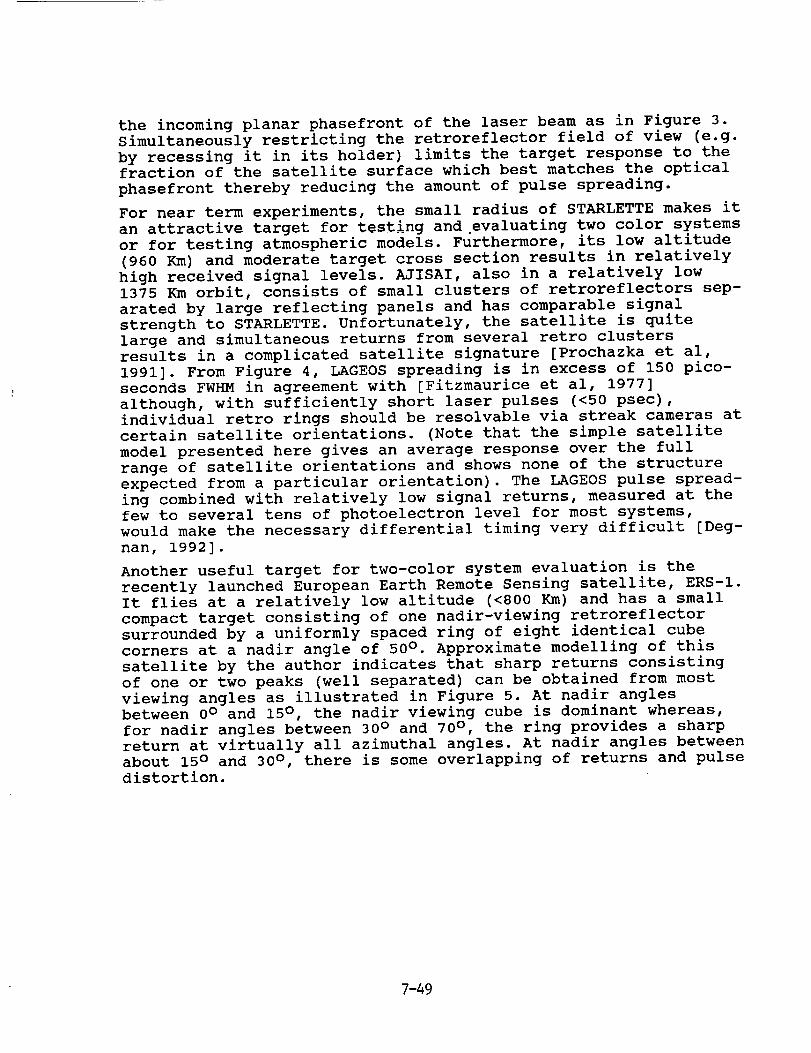
the incoming planar phasefront of the laser beam as in Figure 3.
Simultaneously restricting the retroreflector field of view (e.g.
by recessing it in its holder) limits the target response to the
fraction of the satellite surface which best matches the optical
phasefront thereby reducing the amount of pulse spreading.
For near term experiments, the small radius of STARLETTE makes it
an attractive target for testing and.evaluating two color systems
or for testing atmospheric models. Furthermore, its low altitude
(960 Km) and moderate target cross section results in relatively
high received signal levels. AJISAI, also in a relatively low
1375 Km orbit, consists of small clusters of retroreflectors sep-
arated by large reflecting panels and has comparable signal
strength to STARLETTE. Unfortunately, the satellite is quite
large and simultaneous returns from several retro clusters
results in a complicated satellite signature [Prochazka et al,
1991]. From Figure 4, LAGEOS spreading is in excess of 150 pico-
seconds FWHM in agreement with [Fitzmaurice et al, 1977]
although, with sufficiently short laser pulses (<50 psec),
individual retro rings should be resolvable via streak cameras at
certain satellite orientations. (Note that the simple satellite
model presented here gives an average response over the full
range of satellite orientations and shows none of the structure
expected from a particular orientation). The LAGEOS pulse spread-
ing combined with relatively low signal returns, measured at the
few to several tens of photoelectron level for most systems,
would make the necessary differential timing very difficult [Deg-
nan, 1992].
Another useful target for two-color system evaluation is the
recently launched European Earth Remote Sensing satellite, ERS-I.
It flies at a relatively low altitude (<800 Km) and has a small
compact target consisting of one nadir-viewing retroreflector
surrounded by a uniformly spaced ring of eight identical cube
corners at a nadir angle of 50 ° . Approximate modelling of this
satellite by the author indicates that sharp returns consisting
of one or two peaks (well separated) can be obtained from most
viewing angles as illustrated in Figure 5. At nadir angles
between 0 ° and 15 ° , the nadir viewing cube is dominant whereas,
for nadir angles between 30 ° and 70 ° , the ring provides a sharp
return at virtually all azimuthal angles. At nadir angles between
about 15 ° and 30 ° , there is some overlapping of returns and pulse
distortion.
7-49
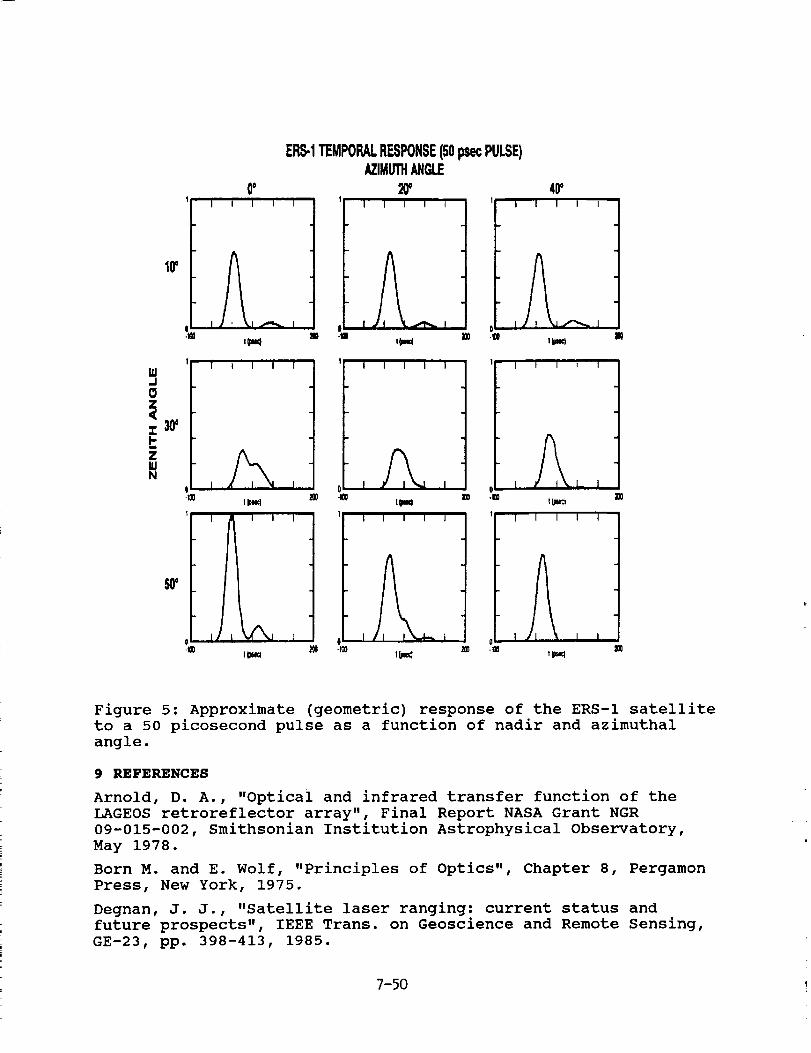
ir
ERS-1TEMPORALRESPONSE(50psecPULSE)AZIMUTHANGLE
0o 20' 41_I I I I I I I I 't I I i I I
I I i I I I I I I I I''1 1
i°2,,
t I , J o I o
5r
40tlml
I I
11 _I
200 -_0 im .ran Z
1 I I I I I I I I I I
0
Ilw,_
I . I
Figure 5: Approximate (geometric) response of the ERS-I satellite
to a 50 picosecond pulse as a function of nadir and azimuthal
angle.
9 REFERENCES
Arnold, D. A., "Optical and infrared transfer function of the
LAGEOS retroreflector array", Final Report NASA Grant NGR
09-015-002, Smithsonian Institution Astrophysical Observatory,
May 1978.
Born M. and E. Wolf, "Principles of Optics", Chapter 8, Pergamon
Press, New York, 1975.
Degnan, J. J., "Satellite laser ranging: current status and
future prospects", IEEE Trans. on Geoscience and Remote Sensing,
GE-23, pp. 398-413, 1985.
7-50

Degnan, J. J., "Optimum wavelengths for two color ranging", these
proceedings, May 1992.
Fitzmaurice, M. W., P. O. Minott, J. B. Abshire, and H. E. Rowe,
"Prelaunch testing of the Laser Geodynamic Satellite (LAGEOS)",
NASA Technical Paper 1062, October 1977.
Minott, P. O., "Design of retrodirector arrays for laser ranging
of satellites", NASA TM-X-723-74-122, Goddard Space Flight Cen-
ter, March, 1974.
Minott, P. O., "Reader's Guide to the RETRO Program Output", NASA
TM-X-722-76-267, Goddard Space Flight Center, September, 1976.
Prochazka, I., K. Hamal, G. Kirchner, M. Schelev, and V. Postova-
lov, "Circular streak camera application for satellite laser
ranging", presented at SPIE Conference on Electronic Imaging, SanJose, California, Feb. 24-27, 1991.
7-51
TWO WAVELENGTH SATELLITE LASER RANGING USING SPAD
M94-15584I.Prochazka, K.Hamal, H.Jelinkova
Faculty of Nuclear Science and Physical Engineering,Czech Technical University
Brehova 7, 115 19 Prague 1, Czechoslovakia
phone/fax +42 2 848840, tlx 121254, bitnet [email protected]
G.Kirchner, F.Koidl
Lustbuehel Observatory,Lustbuehel str. 46,A-8042 Graz, Austria
phone +43 316 472231, fax +43 316 462678
GENERAL
When ranging to satellites with lasers, there are several principal contributions
to the error budget : from the laser ranging system on the ground, from the satellite retro
array geometry and from the atmosphere. Using a single wavelength we have been routinely
achieved a ranging precision of 8 millimeters when ranging to the ERS-1 and Starlette
satellites. The systematic error of the atmosphere, assuming the existing dispersion models,
is expected to be of the order of 1 cm. Multiple wavelengths ranging might contribute to the
refinement of the existing models. Taking into account the energy balance, the existing
picosecond lasers and the existing receiver and detection technology, several pairs or multiple
wavelengths may be considered. To be able to improve the atmospheric models to the
subcentimeter accuracy level, the Differential Time Interval (DTI) has to be determined
within a few picoseconds depending on the selected wavelength pair [1].
There exist several projects, based on picosecond lasers as transmitters and on two
types of detection techniques : one is based on a photo detectors like photomultipliers or
photodiodes connected to the time interval meters [5]. Another technique is based on the use
of a streak camera as a echo signal detector,temporal analyzer and time interval vernier. The
temporal analysis at a single wavelength using the streak camera showed the complexity of
the problem [2].
EXPERIMENT SETUP
We are reporting on the novel concept of ranging to satellites at two wavelengths
using a single solid state photon counter. The block scheme is plotted on Figure 1. The
receiver package is based on the Silicon avalanche photodiode [4] capable of single photon
detection. The receiver and detector is common for both wavelengths, the different color
returns are separated in time due to the atmospheric dispersion. In principle, the use of
common detector for both Wavelengths results in system simplicity, stability and accuracy,
as well. Most of the DTI measurement error contributions cancel out by averaging. The
system calibration is simple and straightforward.
The experiment has been accomplished at the Satellite Laser Ranging Station Graz,
Austria, employing the 0.5 meter aperture Contraves tracking telescope. Considering the
available laser technology, the satellite laser telescope transmitter and receiver optics, namely
7-52

the Coude path dielectric coatings, and the detector sensitivity, we have chosen the
wavelength pair of 0.532 #m and 0.683_,m proposed by J.Galgnebet [3]. The laser
transmitter consists of the passively mode locked Quantel Nd:AG laser including the second
harmonic generator, modified by inserting a Raman cell filled by Hydrogen at 25 Bars,
delivering 15 mJ/35 psec at 0.532/_m and 5 ml/25 psec at the 0.683/tin Stokes waves.
Additionally, the anti Stokes radiation at 0.45 _,m having the energy of 1-3 rnJ is generated.
TELESCOPE COUDE PATH TW LASER
iSTARTI
isPADi_. l co! JNTERiFILTER
RECEIVERi
Figure 1 Two wavelengths laser ranging system setup using SPAD
RESULTS
Ranging to several ground targets we obtained a ranging precision of 42 picoseeonds
at 0.532 ttm and 56 picoseconds at 0.683_m. The detector quantum efficiency at both these
wavelengths reaches 20 %. The 6 kilometer distant ground target ranging results is shown
on Figure 2. The first peak corresponds to 0.683 _tm echoes, the second one to the 0.532/_m
echoes. The measured DTI was 303.3 picoseconds. Taking into account the data of the
atmosphere at this time, the calculated value is 299.4 picoseconds. The precision estimate
of our DTI measurement is 4 picoseconds, if 400 returns per color are accumulated.
The first results of two wavelength laser ranging to the Ajisai satellite is on Figure
3, where the range residuals to the fitted orbit are plotted.The lower trace corresponds to the
0.683/_m echoes, the upper one to the 0.532/zm echoes. The DTI value variation along the
pass is caused by changes in the satellite elevation and hence the atmospheric path difference.
Up to now the satellites Lageos, ERS-1 and Ajisai have been ranged with two wavelengths.
Typically a few hundreds of returns per pass and per wavelength have been collected when
the system has been operating at 2.5 Hz. Averaging the two wavelengths data over the whole
pass, the two wavelengths differential time interval has been determined with the precision
typically 7 picoseconds.
7-53
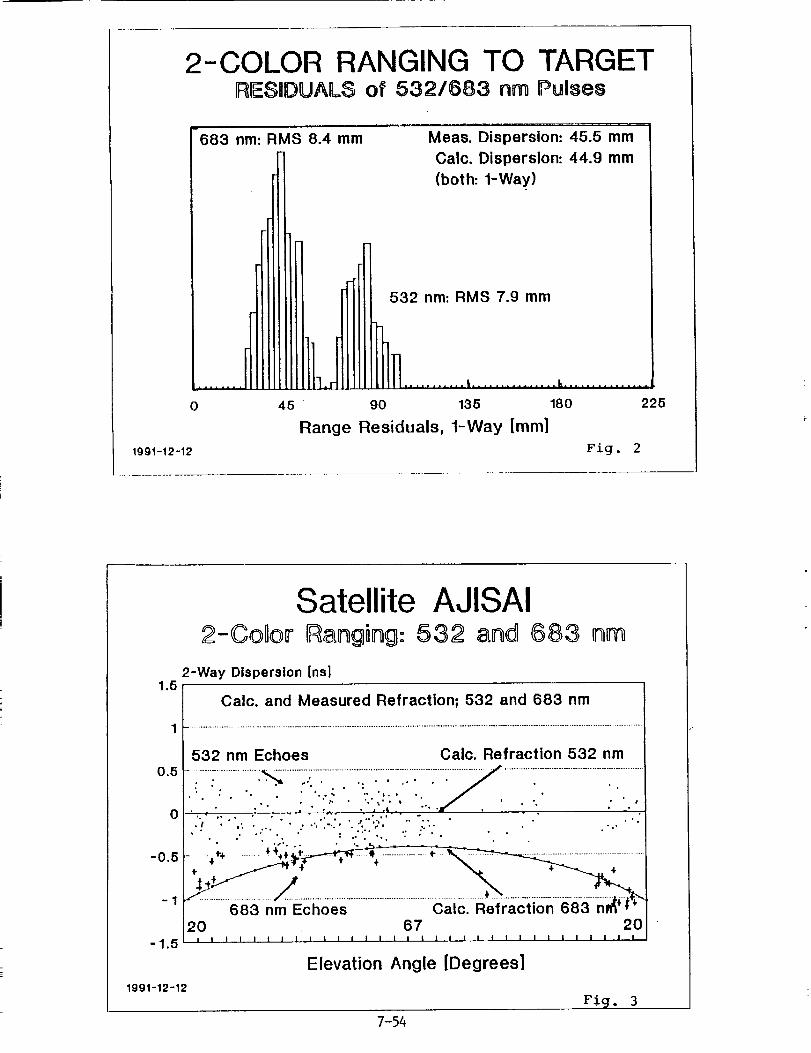
2-COLOR RANGING TO TARGETIRESnDUAL$ of 532/883 nm Pulses
[-6'83 nm: RMS 8.4 mm
I ........
0
1991-12-12
Meas. Dispersion: 45.5 mm I
Calc. Dispersion: 44.9 mmI
(both: 1-Way)
532 nm: RMS 7.9 mm
45 90
Range Residuals, 1-Way [ram]
I
hi
......... | ............... It ...............
135 180 225
Fig. 2
Satellite AJISAI2-Colorr IRanging: 532 and 683 nm
2-Way Dispersion Ins]1.6
0.5
0
-0.5
-1
-1.5
Calc. and Measured Refraction; 532 and 683 nm
............................................................................................................................................................................................................................................................
532 nm Echoes Calc. Refraction 532 nm
....i::i ............i'_ ..........7:::-:::::i:::::_ .................:.......................................:i............... , ." " ".. : .".':: • ;",_:_'i":../ . ' - -." ." :.''". :":. :..::.::.:""::J::..:i:!':':.; _-::.. ..- . ."".... ;+ ........, <,:_-__ .............................................................
683 nm Echoes Calc. Refraction 683 nl_ ÷
2O 67 20I I I I I I I I I I ! I I I I I I I I I I I I I I I I I i I I I
Elevation Angle [Degrees]
1991-12-12
F i9 . 3
7-54

The energy budget, the number of returns per wavelength and hence the differential
time interval precision has been limited by the system ranging repetition rate of 2.5 Hz,
which is determined by the station ranging electronics. Additional limitation is the chromatic
aberration of the transmitter refracting telescope, which limits the minimal divergence
achievable simultaneously on both wavelengths. These two limitations are expected to be
resolved within 1992.
CONCLUSION
Taking into account the energy budget when ranging to a satellite, assuming the data
rate requested for two minute burst averaging and the ground target ranging results, one may
conclude, that the picosecond accuracy of the two wavelength time difference interval is
achievable using this technique. Comparing to the other two wavelengths ranging techniques,
the simplicity, stability and the simple calibration is obvious. Some other wavelengths pairs,
namely the Raman Stokes and anti Stokes, resulting in a considerably higher value of DTI
may be considered. However, the telescope transmitter beam delivering optics has to be
reconstructed.
References
1. J.B. Abshire, Applied Optics, Vol. 19,No.20,1980, p34-36
2. I. Prochazka,K.Hamal,G. Kirchner, M. Schelev, V. Lozovoi,V. Postovalov, SPIE 1449-40
3. J.Gaignebet et al, Technical Digest of the Conference on Lasers and Electro Optics,
CLEO 89, Baltimore, MD, 1989
4. I.Prochazka et al, technical Digest of the Conference on Lasers and Electro Optics, CLEO
90, Anaheim, CA, May 1990
5. B.Greene,proc.of the 6th International Workshop on Laser Ranging Instrumentation,
Antibes,France, 1986
7-55

N94-15585
NEW PERSPECTIVES FOR HIGH ACCURACY SLIt WITH SECONDGENERATION GEODESIC SATELLITES
Glenn LUND
Optical Department
AEROSPATIALE - Space & Defense Division
100 Boulevard du Midi
06322 CANNES LA BOCCA
FRANCE
ABSTRACT
This paper reports on the accuracy limitations imposed by geodesic
satellite signatures, and on the potential for achieving millimetric
performances by means of alternative satellite concepts and an optimised 2-
colour system tradeoff. .
Long distance laser ranging, when performed between a ground
(emitter/receiver) station and a distant geodesic satellite, is now reputed
to enable short arc trajectory determinations to be achieved with an
accuracy of I to 2 centimeters. This state-of-the-art accuracy is limited
principally by the uncertainties inherent to single-colour atmospheric
pathlength correction. MDtivated by the study of phencmena such as post-
glacial rebound, and the detailed analysis of small-scale volcanic and
strain deformations, the drive towards millimetric accuracies will
inevitably be felt.
With the advent of short pulse (< 50 ps) dual wavelength ranging, cc_bined
with adequate detection equipment (such as a fast-scanning streak camera or
ultra-fast solid-state detectors) the atmospheric uncertainty could
potentially be reduced to the level of a few millimeters, thus exposing
other less significant error contributions, of which by far the most
significant will then be the morphology of the retroreflector satellitesthemselves.
Existing geodesic satellites are simply dense spheres, several I0' s of cm
in diameter, encrusted with a large number (426 in the case of LAGEOS) of
small cube-corner reflectors. A single incident pulse thus results in a
significant number of randomly phased, quasi-simultaneous return pulses.
These _ine coherently at the receiver to produce a convolved interference
waveform which cannot, on a shot to shot basis, be accurately and
unambiguously correlated to the satellite center of mass.
The present paper proposes alternative geodesic satellite concepts, based
on the use of a very small number of cube-corner retroreflectors, in which
the above difficulties are eliminated whilst ensuring, for a given emitted
pulse, the return of a single clean pulse with an adequate cross-section.
7-56

I RECENT AND IMMINENT ADVANCES IN SLR ACCURACY
Many SLR groups have reported, during the course of the present workshop,
considerable progress in their laser station equipment, as well as in the
performance of data reduction and orbital modeling.
Laser technology has made considerable progress since the days of the first
ruby lasers, and most stations are now equipped with a doubled Nd:YAG. Pulse
widths down to 50 ps, with an output power of - 30 mJ and a repeat rate of -
10 Hz are now being reported and can be expected to become routine
performances in many stations. The temporal width of such pulses is now
responsible for much less of the return signal duration than th.e optical
depth of the satellite itself.
The technology of ultra-fast SPAD (Silicon Photo Avalanche Diode) detectors
would seem very promising for picosecond event timing. Streak cameras,
despite the considerable expense involved in their exploitation, are
recognised not only for their single picosecond capacity but also for their
ability to record single or multiple waveforms (eg. for 2-colour
differential flight time measurements). K. Hamal has reported streak camera
satellite signature recordings from AJISAI and STARLEITE.
The accuracy of atmospheric models, used to correct for the delay in pulse
flight time, is considered to be limited by the small amount of
meteorological data exploited and frc_ which the entire atmospheric profile
is implicitly defined. Although single-colour SLR makes use of a single /n
situ measurement of temperature pressure and water vapour pressure, 2-colour
ranging is expected to enable a considerable improvement to be achieved by
virtue of differential flight time correction. The residual error with this
technique lies in the range of 2 to 3 n_n.
Although several authors have reported improvements in the modeling used to
take into account both gravitational and non-gravitational (radiation,
thermal, drag) orbital influences, the residual bias in the determination of
LAGEOS' orbit is estimated as 2 to 3 cm for I month of data and I cm for a
year of data (R. Eanes). Many sophiticated data reduction and collation
procedures have been elaborated, but the limit in rms baseline accuracy
nevertheless appears to saturate at the level of I cm.
2 RETURN SIGNAL CONVOLUTION BY MULTIPLE ECHOS
The time domain behaviour of a round-trip SLR pulse can be thought of as an
initially narrow Gaussian pulse which is convolved successively by the
atmospheric transfer function (due to refractive index dispersion -
typically - 10 ps), the "forest" of Diracs corresponding to each of thesatellite reflectors "visible" at the ranging instant, the atmospheric
transfer function for a second time, and finally the detector transfer
function. Whereas the emission, detection and atmospheric functions could
well provide a global received pulse FWHM of - 50 ps (7.5 n_n), the satellite
signature, determined by the overlapping reflector echos within its apparent
optical depth, is typically an order of magnitude greater in duration.
The practically indeterminant and undeconvoluable nature of the resulting
signature imposes a practical lim/t in residual range uncertainty varying
between I and 5 cm (depending on the size and characteristics of the ranged
satellite), even after several months of data accumulation. This uncertainty
is represented by _2sat (- > 100 ps) in expression (I) of _3.
7-57
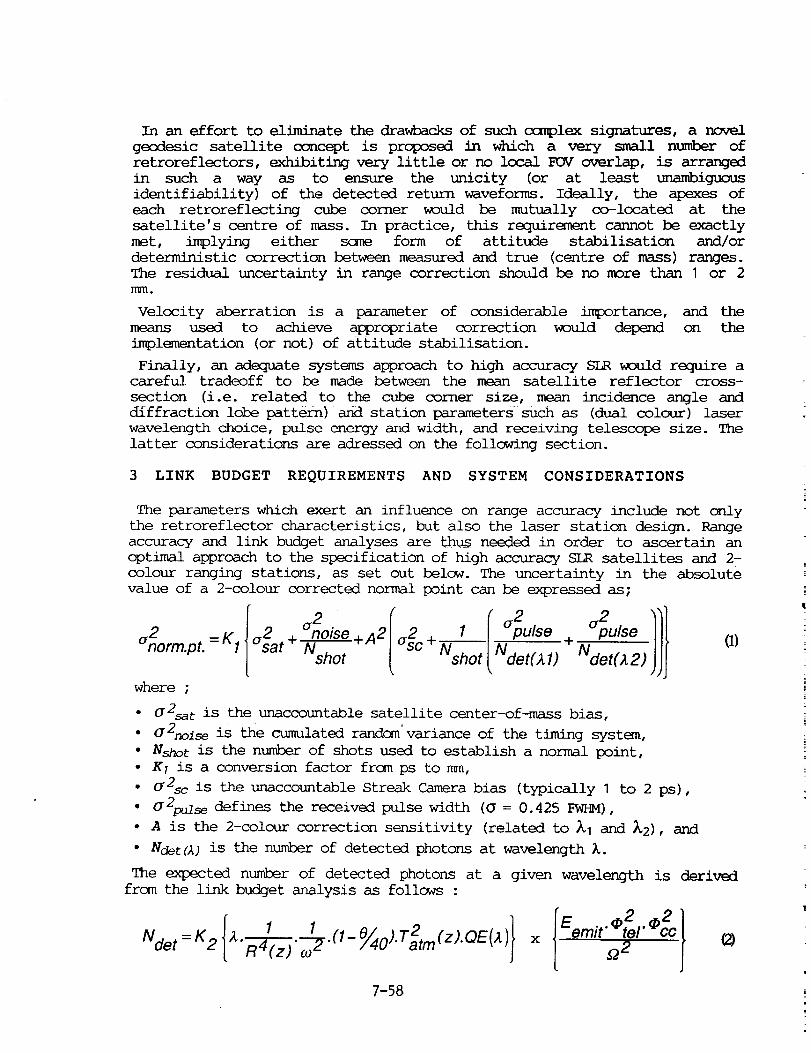
In an effort to eliminate the drawbacks of such complex signatures, a novelgeodesic satellite concept is proposed in which a very small number ofretroreflectors, exhibiting very little or no local FOVoverlap, is arranged
in such a way as to ensure the unicity (or at least unambiguous
identifiability) of the detected return waveforms. Ideally, the apexes of
each retroreflecting cube corner would be mutually co-located at the
satellite's centre of mass. In practice, this requirement cannot be exactly
met, implying either sane form of attitude stabilisation and/or
deterministic correction between measured and true (centre of mass) ranges.
The residual uncertainty in range correction should be no more than I or 2
_I.
Velocity aberration is a parameter of considerable importance, and the
means used to achieve appropriate correction would depend on the
implementation (or not) of attitude stabilisation.
Finally, an adequate systems approach to high accuracy SLR would require acareful tradeoff to be made between the mean satellite reflector cross-
section (i.e. related to the cube corner size, mean incidence angle and
diffraction lobe pattern) and station parameters such as (dual colour) laser
wavelength choice, pulse energy and width, and receiving telescope size. The
latter considerations are adressed on the following section.
3 LINK BUDGET REQUIREMENTS AND SYSTEM CONSIDERATIONS
The parameters which exert an influence on range accuracy include not only
the retroreflector characteristics, but also the laser station design. Range
accuracy and link budget analyses are thus needed in order to ascertain an
optimal approach to the specification of high accuracy SLR satellites and 2-
colour ranging stations, as set out below. The uncertainty in the absolute
value of a 2-colour corrected normal point can be expressed as;
a2 - I ap%lse apulsea 2 = K 1 a2at 4 nois.__et_A2 O2c + 1 +
norm.pt. Nshot Nsho t [Nd_t(_l ) Nd_t(_2) )jj
a)
where ;
• O2sa t is the unaccountable satellite center-of-mass bias,
• a2noise is the cumulated randc_n'variance of the timing system,
• Nshot is the number of shots used to establish a normal point,
• K; is a conversion factor frQm ps to mm,
• (T2sc is the unaccountable Streak Camera bias (typically I to 2 ps),
• _2puds e defines the received pulse width ((_ = 0.425 FWHM),
• A is the 2-colour correction sensitivity (related to )%1 and )%2), and
• Ndet (A) is the number of detected photons at wavelength I.
The expected number of detected photons at a given wavelength is derived
from the link budget analysis as follows :
®Ndet=K2{2_.R--_(z).l-_.(,-Si/40).T2tm(Z).QE(2_)} Semit'tel "_2cx [ Q2
7-58
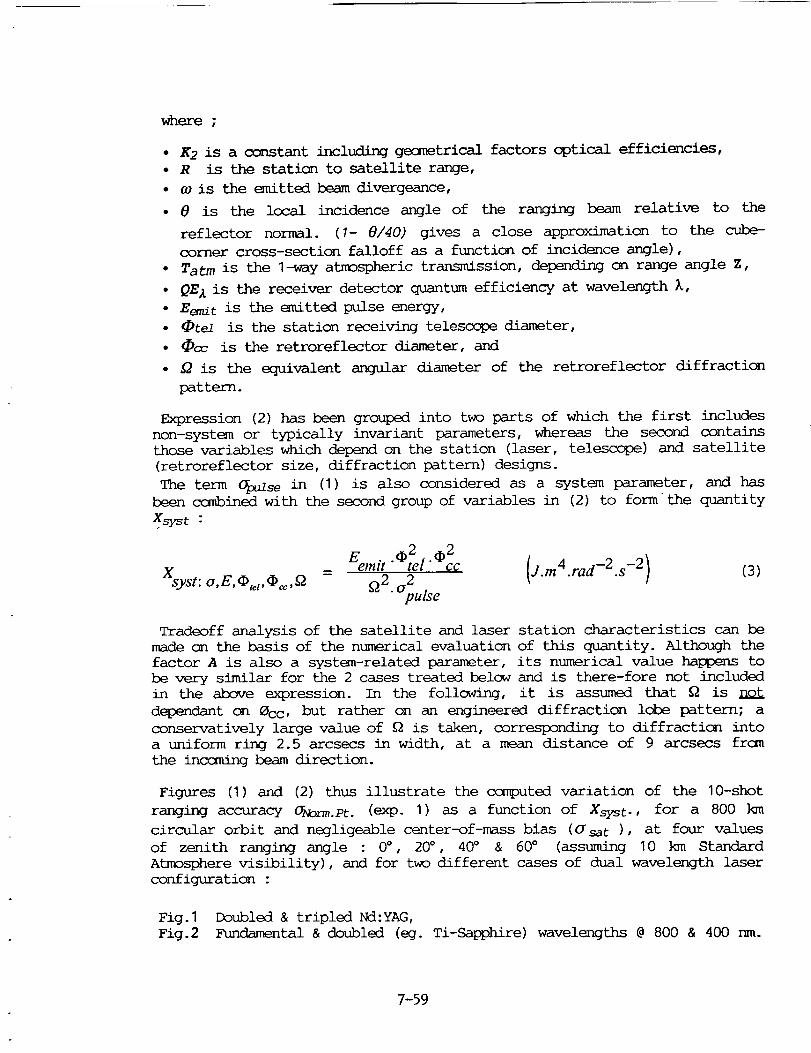
where ;
• K2 is a constant including geometrical factors optical efficiencies,
• R is the station to satellite range,
• _0 is the emitted beam divergeance,
• @ is the local incidence angle of the rangi_ beam relative to the
reflector normal. (1- 8/40) gives a close approximation to the cube-
corner cross-section falloff as a function of incidence angle),
• Tat m is the l-way atmospheric transmission, depending on range angle Z,
• QE l is the receiver detector quantum efficiency at wavelength _,
• Eemit is the emitted pulse energy,
• _te/ is the station receiving telescope diameter,
• _oc is the retroreflector diameter, and
• _2 is the equivalent angular diameter of the retroreflector diffraction
pattern.
Expression (2) has been grouped into two parts of which the first includes
non-system or typically invariant parameters, whereas the second contains
those variables which depend on the station (laser, telescope) and satellite
(retroreflector size, diffraction pattern) designs.
The term _x/se in (I) is also considered as a system parameter, and has
been combined with the second group of variables in (2) to form the quantity
Xsyst :
_2 _2
Emit" tel" cc Ij.m4.rad-2.s-21Xyst: o,E, eo,_,eo _,S2 = _2. o2
(3)•, t
pulse
Tradeoff analysis of the satellite and laser station characteristics can be
made on the basis of the numerical evaluation of this quantity. Although the
factor A is also a system-related parameter, its numerical value happens to
be very similar for the 2 cases treated below and is there-fore not included
in the above expression. In the following, it is assumed that _ is not
dependant on Zcc, but rather on an engineered diffraction lobe pattern; a
conservatively large value of _ is taken, corresponding to diffraction into
a uniform ring 2.5 arcsecs in width, at a mean distance of 9 arcsecs from
the incoming beam direction.
Figures (I) and (2) thus illustrate the computed variation of the 10-shot
ranging accuracy (_Norm.Pt. (exp. I) as a function of Xsyst., for a 800 km
circular orbit and negligeable center-of-mass bias (_sat), at four values
of zenith ranging angle : 0°, 20°, 40 ° & 60 ° (assuming 10 km Standard
Atmosphere visibility), and for two different cases of dual wavelength laser
configuration :
Fig.1 Doubled & tripled Nd:YAG,
Fig.2 Fundamental & doubled (eg. Ti-Sapphire) wavelengths @ 800 & 400 nm.
7-59
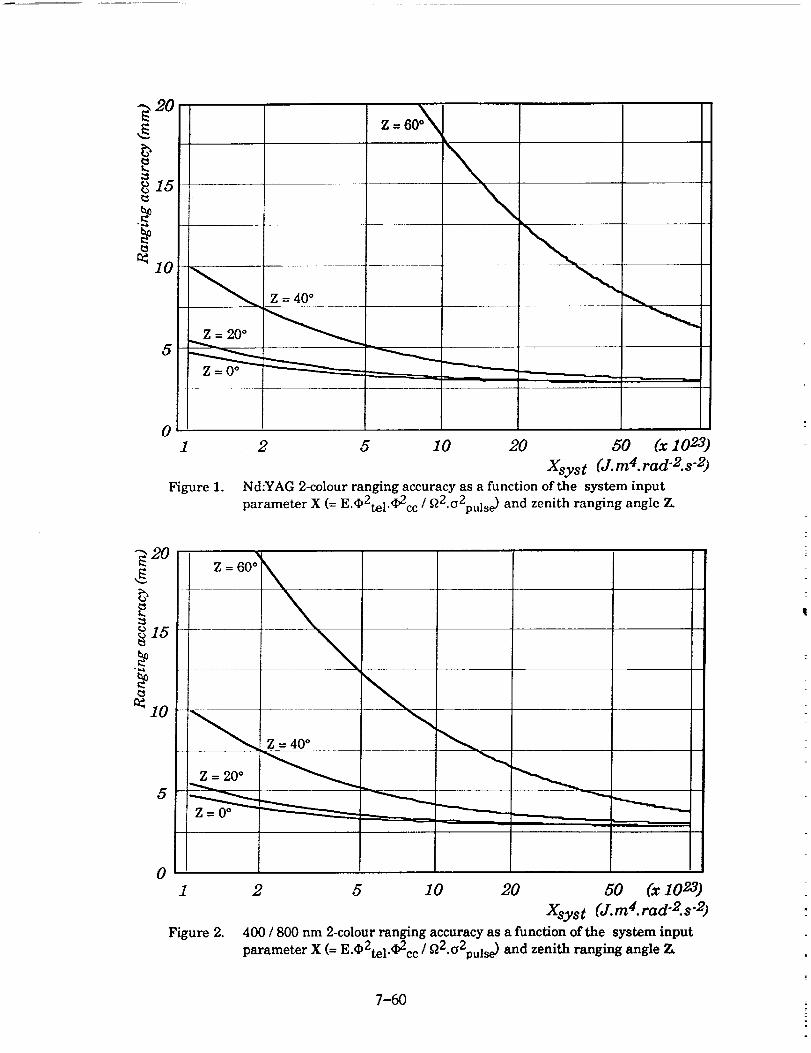
9 20
k.
15
10
g = 40°
Z = 20 ° _
I
01
Figure 1.
2 5 10 20 50 (x 1 023)
Xsyst (J.m4.rad'2.s "2)
Nd:YAG 2-colour ranging accuracy as a function of the system input
parameter X (= E.O2tel.O2cc / fl2.a2puls e) and zenith ranging angle 7_
920Z = 60 ° \
\
_15
_ 10 .......
01
Figure 2.
2 5 10 20 50 (x 1023)
Xsyst (J.m4.rad'2.s "2)
400 / 800 nm 2-colour ranging accuracy as a function of the system input
parameter X (= E.O2tel.¢2cc / _2.g2puls e) and zenith ranging angle Z,
7-60

The resulting curves show (for example) that if sub-centimetric ranging
accuracies are to be achieved with 2-colour systems up to zenith angles of
60 ° , cne could accept a value of Xsyst. >- 7-1023 from the fundamental/doubled
system, whereas a factor of - 8 improvement would be needed for oomparable
performance from a Nd:YAG station.
The above example supposes normal incidence at the retroreflector, and
could be provided by the following numerical values for a 800 / 400 nm
system and a single cube-corner retroreflector :
• = 40 mJ
" _te/ = 30 cm
• _cc = 4ore
• G_dse = 43 ps (FWHM_dse = 100 ps)
By shortening the emitted pulse FWHM to - 50 ps, one could achieve the same
performance at local retroreflector incidences up to 300. An additional
factor of - 3 improvement in telescope or reflector diameter would be
required to achieve the same result with a Nd:YAG laser (assuming 40 mJ and
50 ps FWHM to be near to the practical limits for the emitted pulse power).
Further improvements could be achieved with still shorter pulses (in the
case of a broad bandwidth amplification medium), or a larger number of
pulses per normal-point. At the satellite level, larger retroreflectors, or
more ccnfined diffraction lobe patterns could be considered, without having
to resort to the classical multiple reflector solution.
The strong link budget dependance on orbital height (_ R-4) w_Id probably
render single-reflector satellites unsatisfactory for orbits higher than a
few 1000 km, if sub-centimetric accuracies were to be expected at high
zenith angles and with. a small number of pulses per normal point.
These considerations are encouraging, as they suggest that millimetric
center-of-mass determinations could well be achieved with dual-colour SLR,
provided appropriate consideration is given to the design of future geodesic
satellites.
4 SECOND GENERATION REFLECTOR SATELLITE CONFIGURATIONS
It has been pointed out at the beginning of th/s paper that in the
interests of a clean return signature and unambiguous center-of-mass
determinations, the "ideal" geodesic satellite should exhibit non-
overlapping reflector FOVs in order to inhibit multiple ecb_ returns,
whereas the link budget calculations given in § 3 show that a single
retroreflector of reasonable dimensions could provide adequate return signal
strength for millimetric range determination accuracies.
A parameter of considerable importance in the retroreflector design is that
of velocity aberration correction, in which an appropriate trade-off is
needed between link budget considerations (influenced by the value of _) and
stabilisation of the reflector orientation relative to the orbital plane.
Two fundamentally different approaches could thus be used, according to the
choice between ultimate satellite simplicity and optimal link budget
performance, as set out in the examples below :
7-61
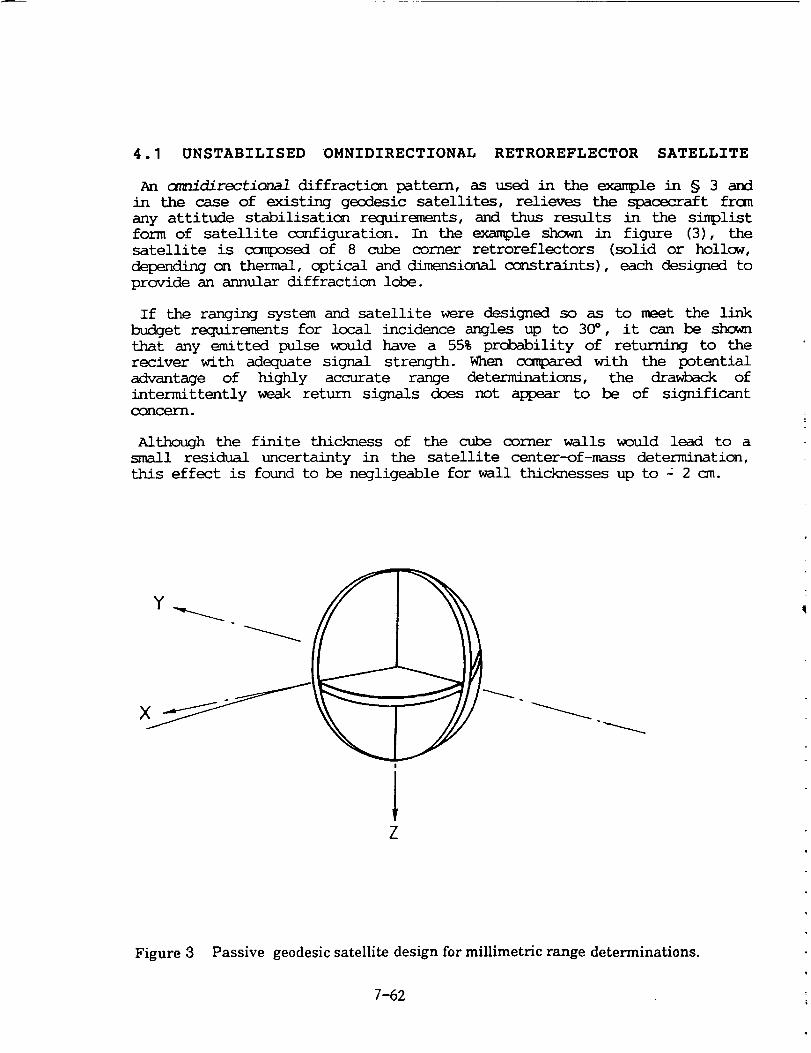
4.1 UNSTABILISED OMNIDIRECTIONAL RETROREFLECTOR SATELLITE
An cmnidirectional diffracticn pattern, as used in the example in § 3 and
in the case of existing geodesic satellites, relieves the spacecraft from
any attitude stabilisaticn requirements, and thus results in the simplist
form of satellite configuration. In the example shown in figure (3), the
satellite is crmp0sed of 8 cube corner retroreflectors (solid or hollow,
depending on thermal, optical and dimensional ccrastraints), each designed to
provide an annular diffraction lobe.
If the ranging system and satellite were designed so as to meet the link
budget requirements for local incidence angles up to 30° , it can be shown
that any emitted pulse _ould have a 55% prchability of returning to the
reciver with adequate signal strength. When cc_pared with the potential
advantage of highly accurate range determinations, the drawback of
intermittently weak return signals does not appear to be of significant
concern.
Although the finite thickness of the cube corner walls would lead to a
small residual uncertainty in the satellite center-of-mass determination,
this effect is found to be negligeable for wall thicknesses up to = 2 cm.
Z
Figure 3 Passive geodesic satellite design for millimetric range determinations.
7-62

4.2 STABILISED DIRECTIONAL RETROREFLECTOR SATELLITE
The link budget performance of the previous design could be ccnsiderably
improved by concentrating the diffracted energy into 2 small lobes (i.e. by
reducing _), as is the case with the proposed GLRS-R ground target design
(reported elsewhere in these proceedings). This approach could only be
impl_nented if the direction of the diffraction lobes were appropriatelymaintained in alignment with the direction of relative movement between
emitter and reflector.
In Figure (4), such a satellite design is shown, in which spin stabilisedattitude control is used to maintain one of each of the cube corner dihedral
angles in a direction perpindicular to the orbital plane. These dihedral
angles would be slightly spoiled from perpindicularity so as to generate two
small diffraction lobes in opposite directicns, of sufficient amplitude to
correct for the velocity aberration. A gain of - 10 or more in return signal
strength, cc_pared with the annular diffraction lobe design, could be
expected.
Although a sp/n stabilisation is shown here, 3-axis stabilisation could
also be envisaged - thus requiring a smaller number of cube corners. In both
cases the attitude control _uld not have to be very precise (typically -
+ 5° should be adequate), and could be achieved using virtually passive
systems such as magnetic torquers. A further possibility would be to use a
completely passive 3-axis stabilisation system based on gravity masts.
| i
V
Figure 4 Spin-stabilised geodesic satellite design for millimetric range determinations.
7-63

5 CONCLUSIONS
It has been shown from link budget analyses that, when coupled with an
appropriate satellite configuration, realistic single retroreflectordimensions could enable millimetric absolute accuracies to be achieved with
future 2-colour SLR, through the removal of center-of-mass uncertainties in
the range determination.
The engineering of retroreflector velocity aberration corrections is an
important factor in the design of a geodesic satellite and in the link
budget performance to be expected from the _lete ranging system.
Two approaches to the design of second generation geodesic satellites have
been suggested. Although these might imply the use of non-spherical orbiting
bodies, with ccrLsequently higher atmospheric drag and solar radiation
pressure imbalances than for existing satellites, they could nevertheless
enable excellent geometric mode (short arc) range determinations to be
achieved, and could be expected to provide very good long arc performance
for high altitude orbits.
7-64


