29
MUMBAI RESIDENTIAL & OFFICE JULY TO DECEMBER 2017 KnightFrank.co.in
| Date post: | 23-Jan-2018 |
| Category: |
Real Estate |
| Upload: | knight-frank-india |
| View: | 256 times |
| Download: | 1 times |

MUMBAIRESIDENTIAL & OFFICEJULY TO DECEMBER 2017
KnightFrank.co.in

2
RESIDENTIAL RECAP H1 2017
New launches fell 36%;
sales dropped by 8% YoY
Unsold inventory of 138,652 units
remained a concern

3
First time DROP in Mumbai residential
prices in the decade starting 2010

Considering all discounts in the
form of stamp duty waivers,
floor rise charge, rental
schemes, the effective discount
has been in the range of
11-12%
Annual price change
4
5,659
6,0726,547 7,085
7,796
7,994
8,120
7,717
0
1,000
2,000
3,000
4,000
5,000
6,000
7,000
8,000
9,000
2010 2011 2012 2013 2014 2015 2016 2017
-5%
YoY
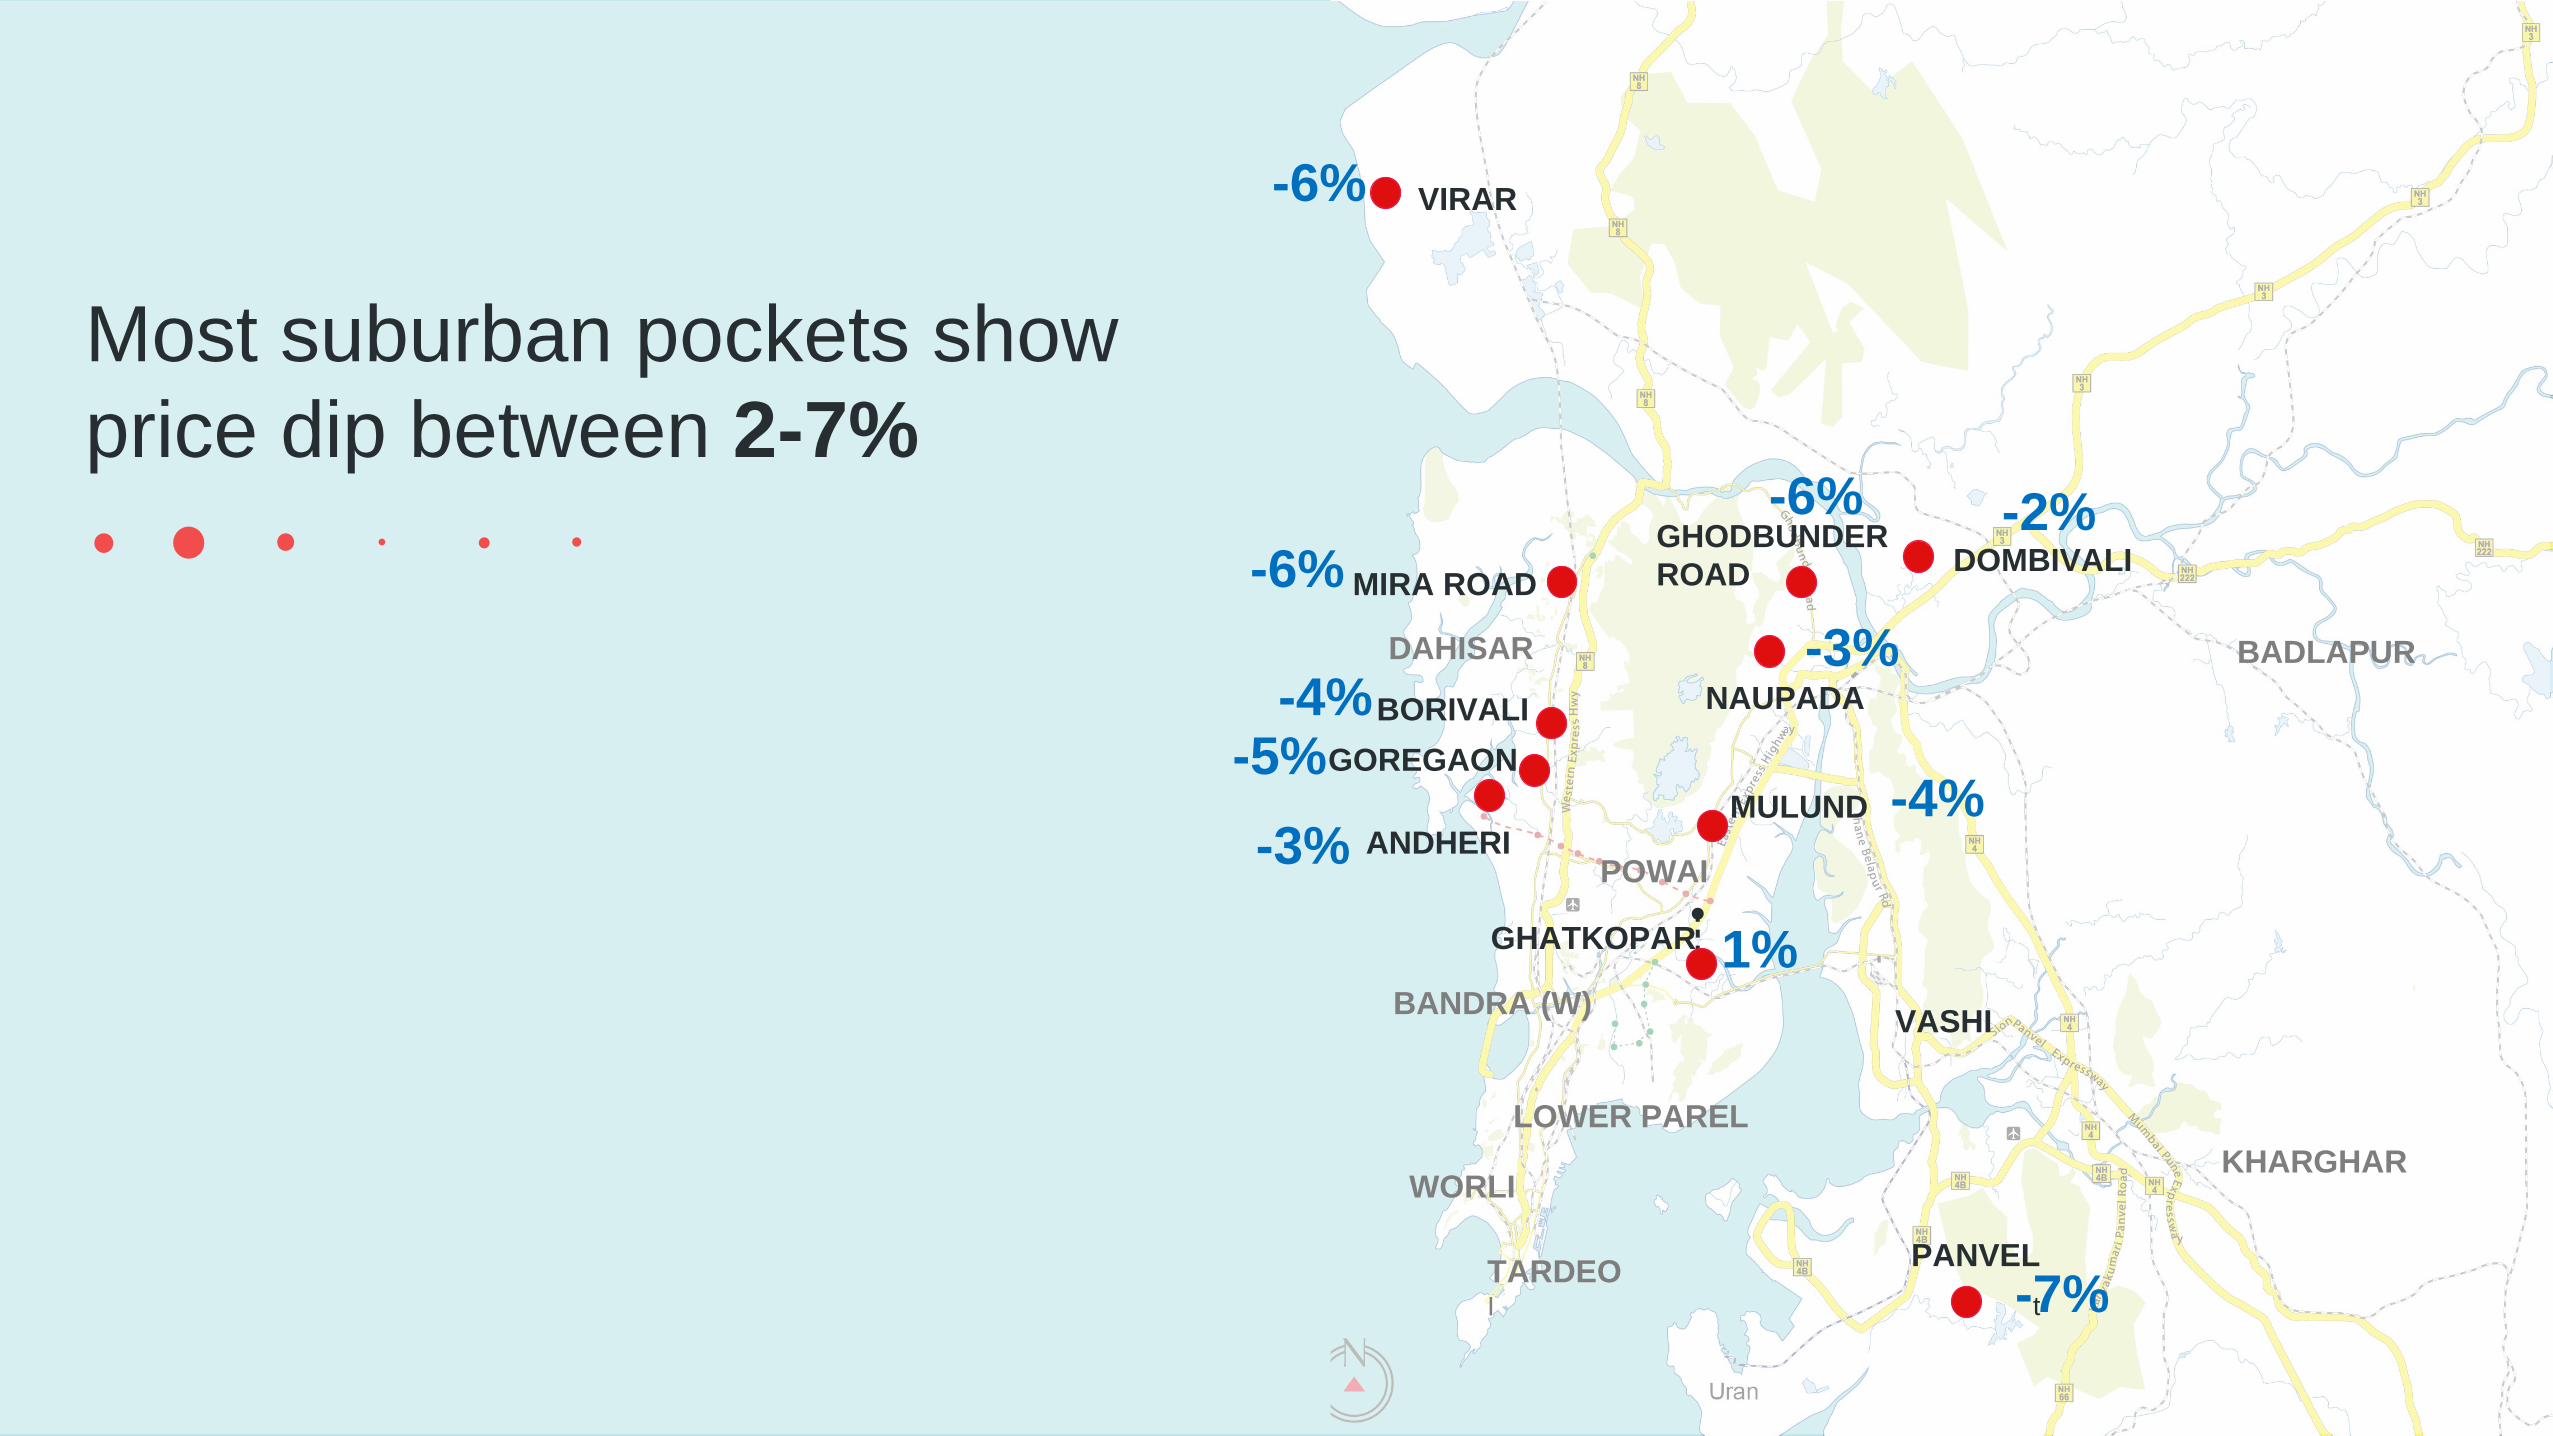
GHATKOPAR 1%
LOWER PAREL
WORLI
MULUND -4%
POWAI
PANVEL
t-7%
KHARGHAR
VASHI
DOMBIVALI
-2%
BADLAPUR
MIRA ROAD-6%
VIRAR-6%
TARDEOI
DAHISAR
BORIVALI-4%
BANDRA (W)
GOREGAON-5%
NAUPADA
-3%
GHODBUNDER
ROAD
-6%
ANDHERI-3%
Most suburban pockets show
price dip between 2-7%

70
80
90
100
110
120
130
140
CPI Mumbai
Residential prices decline by
5% compared to an inflation
growth of 5.5% in 2017
Deal sweetened: Gap between retail inflation and home
prices widens
6
CPI
MUMBAI

7
Mumbai is marching towards the
Knight Frank Affordability
Benchmark* of
4.5
(*house price to income ratio)
2017
7.82010
11

8
Launches come to a near-halt
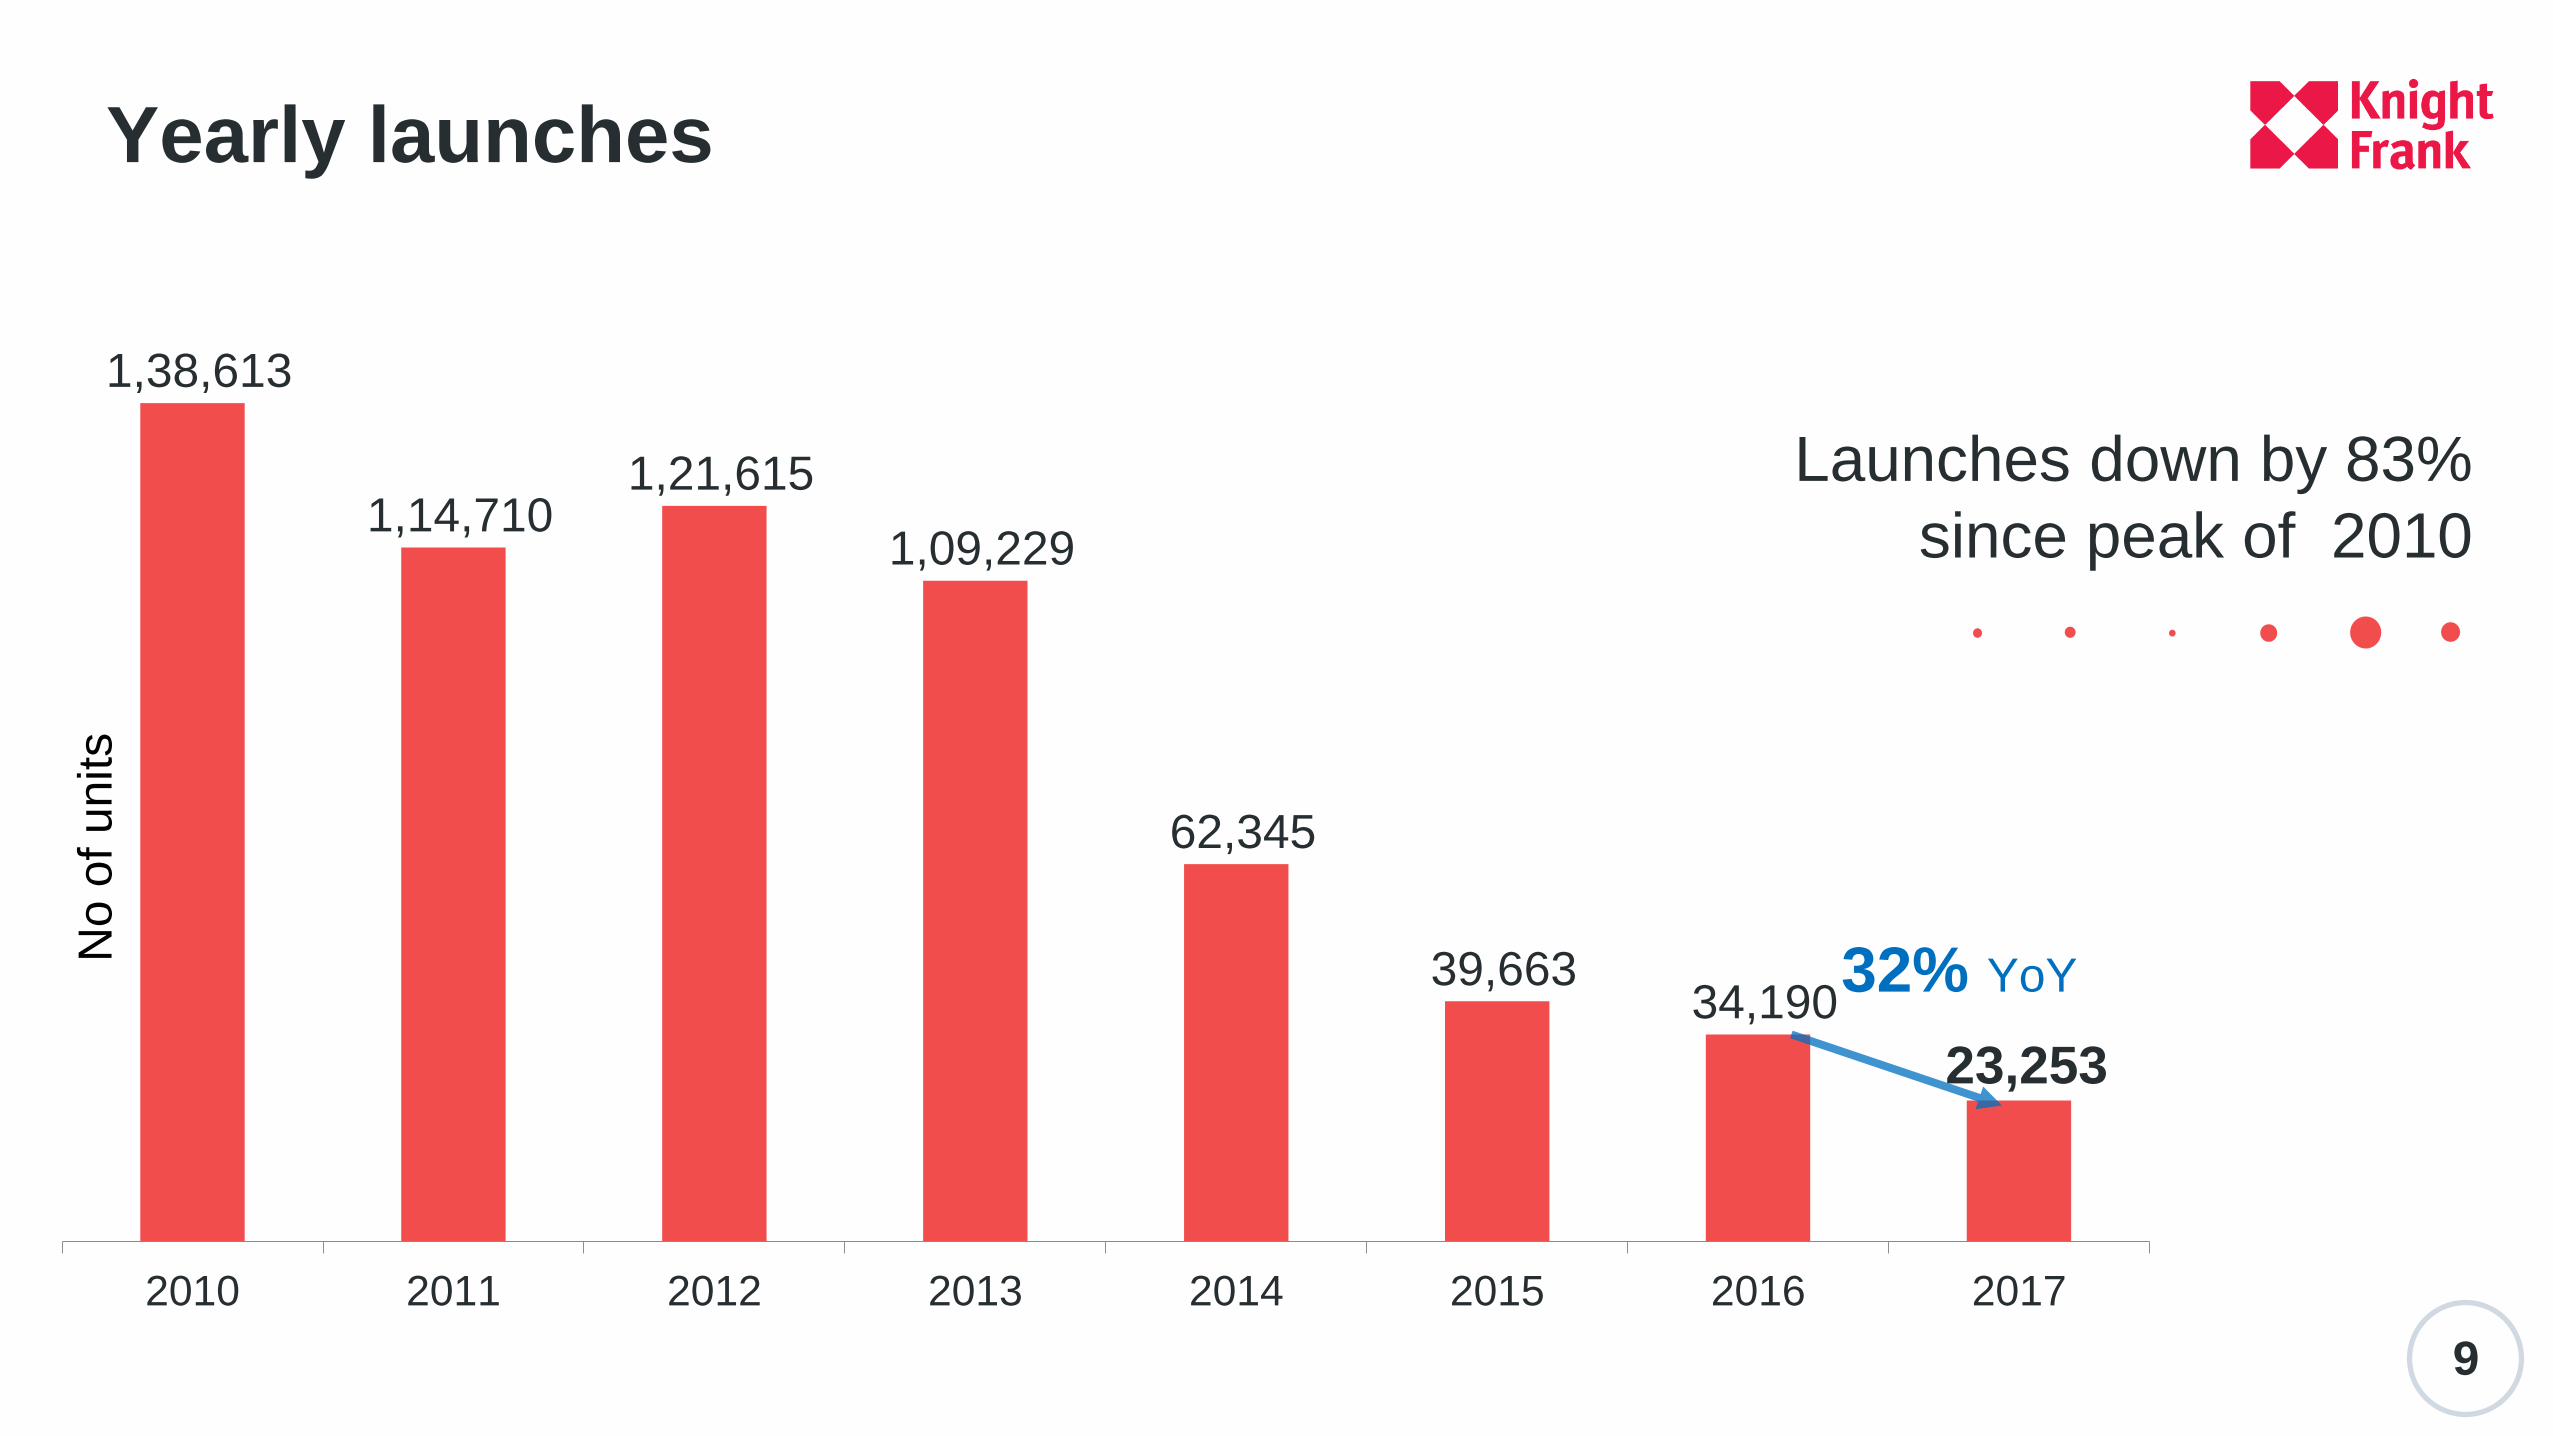
Yearly launches
9
1,38,613
1,14,710 1,21,615
1,09,229
62,345
39,663 34,190
23,253
2010 2011 2012 2013 2014 2015 2016 2017
32% YoY
No o
f units
Launches down by 83%
since peak of 2010

10
35,512
26,833
18,887 20,776
24,450
9,740
15,763
7,490
H1 2014 H2 2014 H1 2015 H2 2015 H1 2016 H2 2016 H1 2017 H2 2017
23% YoY
Half-yearly launches
Launches continue to
drop in H2 2017
No o
f units

11
Sales under pressure,
developers blink

12
Quarterly sales
Uptick in quarterly
sales witnessed
No o
f units
17,392
21,903
17,182
8,416
15,265
Q4 2013 Q4 2014 Q4 2015 Q4 2016 Q4 2017
DEMONETISATION

13
60,179
41,981 41,369
32,717
36,505 34,135
30,179
H2 2010 H2 2011 H2 2012 H2 2013 H2 2014 H2 2015 H2 2016 H2 2017
Half-yearly sales
Despite19% YoY growth, sales were down to 50%
of H2 2010 levels in H2 2017
25,403

14
1,08,680
96,226
85,978
74,094 67,715
62,581 60,374 62,256
2010 2011 2012 2013 2014 2015 2016 2017
3%
Yearly sales

Thane, Chembur to Mulund and
Mira Bhayander to Virar have recorded
significant growth in sales over H2 2016
Which micro-market saw maximum change in sales in H2?
Thane
Peripheral
Western Suburbs
Western Suburbs
Central Mumbai
South Mumbai
Central
Suburbs Navi Mumbai
Peripheral
Central Suburbs
+52%
7,190 units
+5%
2,882 units
398 units
+140%
245 units
+1%
+44%
3,495 units
+16%
9,685 units
3,269 units
+32%
3,015 units
-26%

16
Slide in launches pull down
unsold inventory

Unsold inventory
valued at
INR 131,000 crore –
6% of
Maharashtra’s
2017-18 GDP
17
Unsold inventory, age and QTS
Unsold
inventoryQuarters-to-sell
Age of
inventory
H1 2014 2,13,742 11.7 8.8
H2 2014 2,04,070 11.5 10.1
H1 2015 1,94,510 12.1 11
H2 2015 1,81,151 11.1 11.9
H1 2016 1,70,630 10.2 12.6
H2 2016 1,54,967 10.1 13.2
H1 2017 1,38,653 8.8 11.7
H2 2017 1,15,964 7.6 15.6
QTS and age in quarters

Unsold units
19,329
QTS 11.7
Age 16.0
Unsold units
4,175
QTS 18.3
Age 19.4
THANE Unsold units
11,697
QTS 8.1
Age 13.3
PERIPHERAL WESTERN
SUBURBSUnsold units
15,701
QTS 5.1
Age 17.2
WESTERN
SUBURBS
CENTRAL
MUMBAI Unsold units
18,379
QTS 11.6
Age 13.6Unsold units
929
QTS 12.4
Age 16.4SOUTH
MUMBAI
CENTRAL
SUBURBS
NAVI
MUMBAI
Unsold units
21,842
QTS 11
Age 14.7
Unsold units
23,912
QTS 4.5
Age 15.9
PERIPHERAL
CENTRAL SUBURBSLocations such as Lower Parel,
Worli, Prabhadevi in Central
Mumbai worst performing
markets, more than four years
to offload inventory
Age and QTS in quarters

KEY FINDINGS
19
01 03
02 04
New launches down by 83%
from peak in 2010
For the first time in this decade,
Mumbai sees a decline in
weighted average prices in 2017
• Base price down by 5% YoY
• Effective prices down by 11-12% YoY
Unsold inventory down
by 25% YoY
• Drastic fall in launches reduce inventory levels that impacted quarters-to-sell to 7.9 quarters from a high of 12 quarters three years back
Sales in 2017 rose by
3% YoY
• Residential sales in H2 2017 were 19% better than demonetisation-hit H2 2016 on account of base effect. 12% lower than average H2 sales between 2013-15
• Homes launches in H2 2017 dropped by 23% YoY
• 2017 saw 32% fewer launches YoY

20
Transactions fell by 19% for want of
quality space
Vacancy level surged to 22% in H1 2017
although BKC & Lower Parel maintained
single digit vacancy pushing rentals up
by 6% YoY
OFFICERECAP H1 2017

Yearly new completions
21
12
7.6
9.2
5.8 5.9
10.4
0
2
4
6
8
10
12
2012 2013 2014 2015 2016 2017
76%
YoY
in m
nsq
ft
Large volume of supply
adds pressure on
vacancy rates and
rentals

The office market witnessed the
highest transaction volumes in the
last 5 years
23
6.006.25
7.34 7.507.07
7.53
2012 2013 2014 2015 2016 2017
Transactions up
by 6% YoY
Yearly new transactions

24
2.62.4
4.85.0
3.3
4.4
H2 2012 H2 2013 H2 2014 H2 2015 H2 2016 H2 2017
Transactions up
by 36% YoY
Large transactions by
IT/ITeS and co-
working players pull
up H2 2017
Half-yearly transactions

25
22.8%22.6%
21.6%
19.6%
20.2%
17.0%
18.0%
19.0%
20.0%
21.0%
22.0%
23.0%
24.0%
2013 2014 2015 2016 2017
Vacancy
Vacancy levels increased
on account of huge supply
Central Mumbai and BKC and
off-BKC remain in single digits

26
127
111 118
104
121115
-
20
40
60
80
100
120
140
2012 2013 2014 2015 2016 2017
INR
/sq
ft/m
on
thWeighted average rental movement
High transactions in
peripheral markets pull
down weighted average
rentals by 5% YoY in
2017

BKC & OFF-BKC
CBD & OFF-CBD
CENTRAL
MUMBAI
PBD
SBD
CENTRAL
SBD WEST
Central Mumbai witnessed the highest growth in rentals in 2017
PBD
INR 160-250/sq ft/month
-3%12 month change
INR 220-330/sq ft/month
4%
INR 80-140/sq ft/month
3%
INR 80-150/sq ft/month
3% INR 50-90/sq ft/month
-4%
INR 170-200/sq ft/month
7%

28
Industry H2 2016 H2 2017
BANKING,
FINANCIAL
SERVICES &
INSURANCE
31% 23%
IT/ITES 16% 20%
MANUFACTURING 33% 11%
OTHER SERVICES 20% 46%
What was the share of demand by industry in H2 2017
• IT/ITeS and Other Services segments
particularly co-working recorded
significant growth in transactions
• GST implementation related challenges
led to drop in manufacturing’s share
Interchange

KEY FINDINGS
01 03
02 04
29
New supply higher by
76% YoY
• New office supply hit double digits for the first time since 2012
Vacancy sees a marginal
rise from 19% to 20.2%
• BKC and Lower Parel remain in single digit vacancy
Co-working demand has a
big role in the jump in
transactions
• This segment has been emerging as a new
occupier category similar to the e-commerce
wave of 2014–15 in Bengaluru
Peripheral markets see
increased demand
• Demand in peripheral markets pull office
leasing by 6% in 2017


