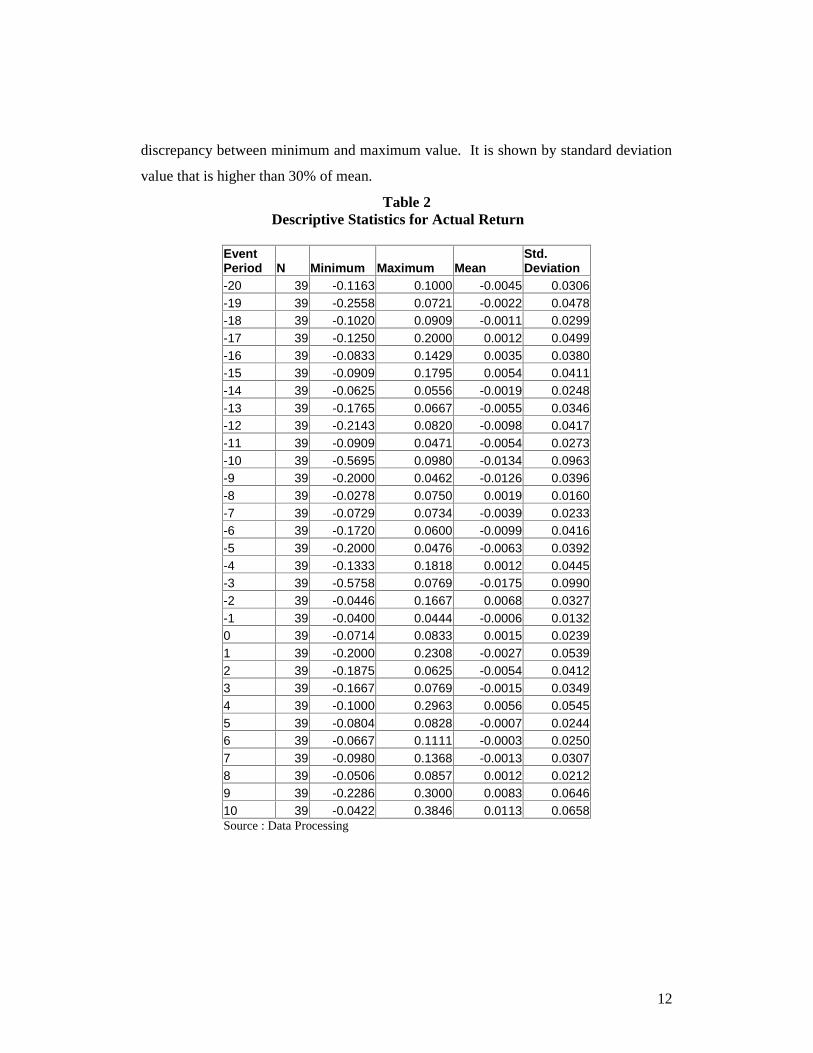
Munich Personal RePEc Archive Analysis of Relationship Between Market Reactions and Long Term Performance on Acquisitions Tongam Sihol Nababan and Sere Eva Nababan and Bantu Tampubolon University of HKBP Nommensen, Medan, Indonesia June 2005 Online at http://mpra.ub.uni-muenchen.de/49110/ MPRA Paper No. 49110, posted 23. August 2013 14:00 UTC
Transcript
MPRAMunich Personal RePEc Archive
Analysis of Relationship Between MarketReactions and Long Term Performanceon Acquisitions
Tongam Sihol Nababan and Sere Eva Nababan and Bantu
Tampubolon
University of HKBP Nommensen, Medan, Indonesia
June 2005
Online at http://mpra.ub.uni-muenchen.de/49110/MPRA Paper No. 49110, posted 23. August 2013 14:00 UTC
ANALYSIS OF RELATIONSHIP BETWEEN MARKET REACTIONS ANDLONG TERM PERFORMANCE ON ACQUISITIONS
Sere Eva Nababan, T. Sihol Nababan, Bantu Tampubolon
Abstrak
Tulisan ini adalah studi tentang hasil penelitian yang memberikan perhatian padaaktivitas akuisisi yang dilakukan oleh perusahaan-perusahaan pengakuisisi (acquirer).Tujuan utama penelitian ini adalah untuk melihat bagaimana reaksi pasar (marketreaction) akan memberikan tuntunan atas gambaran kinerja perusahaan-perusahaanpengakuisisi dalam jangka panjang. Dalam studi ini digunakan 39 perusahaanpengakuisisi yang telah melakukan akuisisi dalam periode waktu antara tahun 1991sampai dengan 1998. Studi ini menerapkan metode event study dengan menggunakanmarket model untuk menghitung abnormal return.
Uji hipotesis yang digunakan adalah adalah One Sample T-test, MultipleRegressions, Wilcoxon Signed-Rank Test dan Manova Test. Hasil pengujian hipotesismenunjukkan bahwa pihak perusahaan pengakuisisi menerima negative abnormalreturn yang signifikan di sepanjang tanggal akuisisi. Hal ini mengindikasikan bahwaperistiwa akuisisi menghasilkan return yang lebih rendah dari predicted return yangdiprediksikan oleh pemegang saham perusahaan pengakuisisi. Dalam studi iniditunjukkan beberapa factor yang mempengaruhi abnormal return seperti : financialsynergy, size of acquirer, managerial efficiency, growth of acquirer, dan businessrelatedness. Hasil dari pengujian hipotesis terhadap terhadap factor-faktor tersebutmenunjukkan bahwa tidak satupun dari variabel tersebut yang memberikan nilai yangsignifikan. Hal ini berarti bahwa motif-motif akusisi tersebut bukan merupakan motivasibagi pengakusisi untuk terlibat dalam aktivitas ekuisisi.
Untuk menilai kinerja perusahaan-perusahaan pengakusisi dalam jangkapanjang, digunakan proxy yakni : ROA, ROE, OPM. Hasil pengujian menunjukkanbahwa secara keseluruhan tidak ada perbedaan yang signifikan antara kinerja sebelumdan sesudah akuisisi. Ini berarti bahwa umumnya perusahaan-perusahaan pengakuisisitidak mempu mengintegrasikan gain terhadap kinerja jangka panjangnya.
Keywords : acquisition, long term performance, market reaction, abnormal profit
1. INTRODUCTION
1.1. Background
For global enterprises, organizations in the new or next economy will win or
lose are determined by how well they manage their alliances strategy. The things really
2
matter to business executives now and in the future are some others: core competencies,
relationships, changing technologies, flexible organizations and new kind competition.
Those matters have something to do with business alliances. This research refers
business alliances to acquisition activities.
Acquisition has different meaning and characteristic. In this research there are
some definitions about acquisitions. According to Moin (2003), acquisition can be
defined as the take over of ownership or controlled of one’s company asset by another
company. In this term either acquiring companies or acquired companies independently
exist as corporate body. Azevedo (1999) said that acquisition takes place when one
company acquirers the voting stock of other company, or its assets. The acquired
company will still exist as a legal unit and then be included as a subsidiary in an
individual group. Then, PSAK (Pernyataan Standar Akuntansi Keuangan in Moin,
2003) No.22 defined acquisition as an activity where acquirer and acquiree agree to join
their business activity. Acquirer will have a control upon net assets and business
operation of acquiree.
Some others expert on acquisition practices come up with a definition of
acquisition as a close, collaborative relationship between two or more firms, with the
intent of accomplishing mutually compatible goals that should be difficult for each to
accomplish alone. At this point it may say that acquisition activities involve at least two
partners and each of them has their own interest. The main endeavor to be tied up in
relationship is to obtain mutually compatible goals.
It is documented that early merger and acquisition movement had mostly
occurred in United Stated since 1890s. At that time motives for merger and acquisition
were propelled by sustained growth of economic and significant changes in business
environment. Eventually merger and acquisition activity becomes more pervasive and
now exceeds the US area. There are many international companies involved in such
activity, like Daimler Benz and Chrysler; HP and Compaq; Exxon and Mobil Oil; and
so on.
Acquisition activity continues to grow in Indonesia. People become more
familiar with this term as it is brightened up by some merger events such as the merger
3
of Bank Mandiri, Bank Permata, Indofood-Bogasari, Kalbe Farma-Dankos, and so on.
In Indonesia merger/acquisition activity was started in 1970s. It predominantly
conducted by acquirers company that has been go public. At that time the motive for
merger was tax reduction.
Acquisition implies that there is a set of operating norm exists among partners
who are expected not to act in self-interest that would be detrimental to others. It also
implies that there is a notion of voluntary involvement rather than coercion. The great
expectation behind this decision is a reciprocal behavior.
Merger becomes one activity that gives a great impact to stakeholders. Experts
posit that merger is a sort of controversial and dramatical event. It is not merely as a
strategic alternative but also a financial transaction to create value to shareholders, to
increase economies of scale so as to compete with others. Strategically executives must
begin with maintaining stand-alone performance from the announcement of the deal
right through the post-acquisition integration process. Since investors have priced
heavily to build a future expectation into today’s valuation, acquirer’s stock will suffer
if there is any indication of deteriorating performance at either of the combining
business. Combined company should be able to change the economics of either the
acquirer’s or target’s business, otherwise the acquisition will create no additional value
and the premium will be lost.
Market reaction to merger and acquisition announcement will inaugurate a good
predictor of subsequent performance (Weston, et.al., 2001). Most of the time
acquisition deals will determine how the stock market will react. If the market judges
that the deal will succeed the initial market is likely to be favorable. If market judges
negatively, the response is just the opposite. Some empirical studies show that in post
acquisition performance target firms pursue more substantial gains than acquiring
companies. You, Caves, Smith, and Henry (Weston et.al, 2001) gave a conclusion that
mean return to target company for 133 mergers during the period 1975-1984 was about
20%, while return to shareholders of acquiring companies were a negative 1%.
In Indonesia some researchers conduct some studies around merger/acquisition.
Saiful (2003) contended that target companies experience a positive abnormal return
4
surrounding merger/acquisition announcement. Furthermore he found that abnormal
return of target firm is higher than that of non-target firms. Seputro (2002) in his
research gave a conclusion that merger/acquisition activity do not give any synergism
effect towards profitability and efficiency but increase book value of the firms. Then,
Rahmawati (2000) holding 36 samples summarized that acquisition gave an additional
wealth for shareholders about 22.73%.
The idea of choosing this topic is merely triggered by curiosity of how an
acquisition works financially. It is quite interesting to find out that not only a couple
could make marriage but also company. Several studies have been conducted on
acquisitions activity. Much of them focus only on certain area, namely market reaction,
acquisition motives, long-term performance. This research will delineate a complete
extension upon market reaction to acquisitions event and simultaneously identify how it
is related to long-term performance. We may learn that some forces have been driving
the changes of the increased alliances activities like merger and acquisitions. Foremost
is technological change that is impacting every industry. The way of doing such
business will continue and as for now it has far reaching to pharmaceutical, chemical,
auto, tire and petroleum industries.
Finally, the mergers and acquisitions is just one of choices that need scrutiny
evaluation. The challenge here is to make sure the deal would be a good fit today and
into the future, strategically, financially and operationally for the purchaser. Potential
acquisitions should be considered at a variety of levels. Financial models should be
developed which evaluate the future impact on company’s revenue, product mix, gross
profit margins, selling costs, overhead and more.
I.2. Problem Identification
This research investigates the relationship between market expectations and
long-term performance of acquisitions decision. The problem arises here is whether the
market reaction driven by the motivation of acquisitions such as: financial synergy, size
of acquirer, managerial efficiency, growth of acquirer, and business relatedness creates
long-term value.
5
I.3. Objectives of the Research
The objectives of this research are: 1). to investigate whether acquisitions
activity creates abnormal return, 2). to explain whether motives for acquisitions affect
magnitude of Cumulative Abnormal Return (CAR), 3) to find the variations in market
reaction at the time of acquisitions and to relate them with a long term performance.
I. 4. Contribution
This study is expected to give benefit for: 1) other researchers who need
information concerning with the result of the study, 2) management of the company that
needs additional insight about a phenomenon of acquisitions, 3) public as an additional
knowledge to more understand the impact of acquisitions.
2. FRAMEWORK OF RESEARCH AND HYPOTHESIS
Several studies has been conducted on acquisitions event. Some of them focus
on market reaction and acquisition motives and some others focus only on long-term
performance. In this research the attention is devoted to determine market reaction to
acquisition date and to determine some variables that enhance the value of acquisitions
event and simultaneously identify how those valuation effects consistently portray the
long-term performance, particularly the performance of acquiring companies.
There are several value enhancements encouraging some firms engaged in
acquisition activities. This research will examine and test some variables or factors that
will represent how acquisition enhances value. Those variables, considered as the
market expectations, will be examined on how they match with long-term performance.
In general studies on the effect of acquisitions event determine positive
abnormal return surrounding activity announcement. It conceives that acquisition
announcement contains information content. Theoretically acquisition activities extend
some strategic motives, namely: financial synergy, size of acquirer, managerial
efficiency, growth of acquirer, and business relatedness.
6
Particularly some of the research on acquisitions event predicts the longer-term
performance of merging company. Some researchers postulated that acquisition
activities contribute a positive effect upon performance of merged partners. It is
occurred as synergism motives can be maintained.
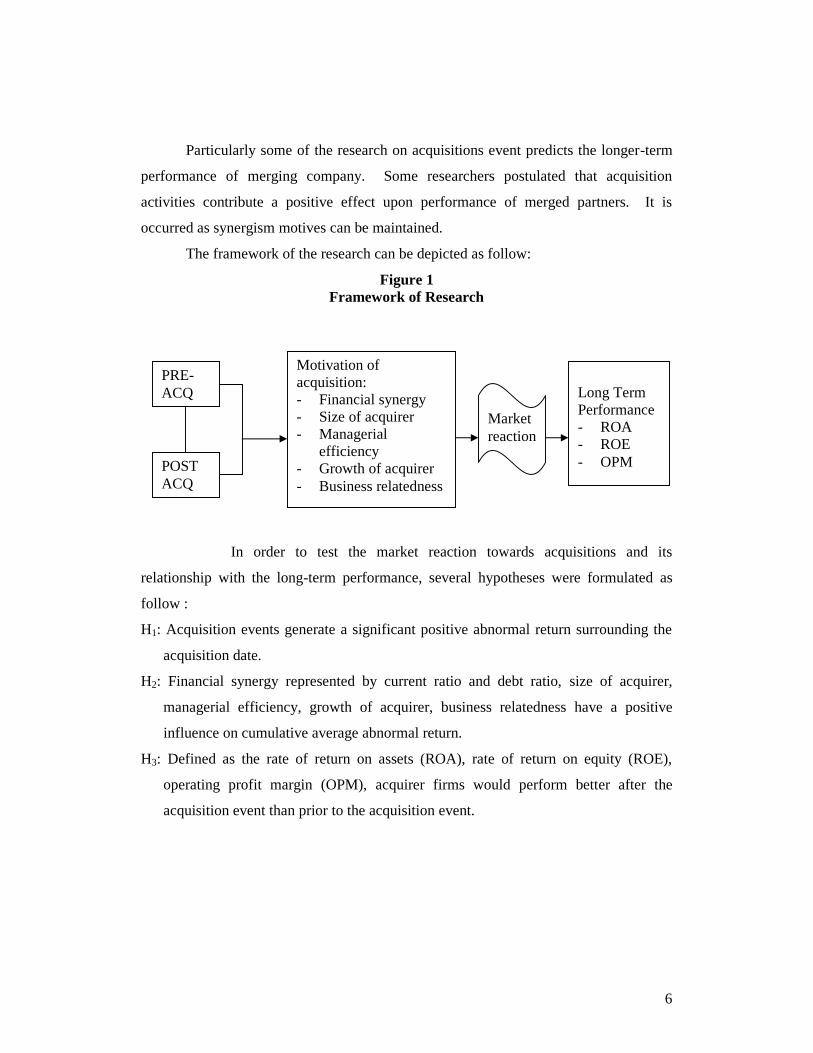
The framework of the research can be depicted as follow:
Figure 1Framework of Research
In order to test the market reaction towards acquisitions and its
relationship with the long-term performance, several hypotheses were formulated as
follow :
H1: Acquisition events generate a significant positive abnormal return surrounding the
acquisition date.
H2: Financial synergy represented by current ratio and debt ratio, size of acquirer,
managerial efficiency, growth of acquirer, business relatedness have a positive
influence on cumulative average abnormal return.
H3: Defined as the rate of return on assets (ROA), rate of return on equity (ROE),
operating profit margin (OPM), acquirer firms would perform better after the
acquisition event than prior to the acquisition event.
PRE-ACQ
POSTACQ
Motivation ofacquisition:- Financial synergy- Size of acquirer- Managerial
efficiency- Growth of acquirer- Business relatedness
Long TermPerformance- ROA- ROE- OPM
Marketreaction
7
3. RESEARCH METHODOLOGY
3.1. Data Resources
The characteristic of the data is secondary data which are: acquisition date, date
of listing, daily stock price, composite stock price index or Index Harga Saham
Gabungan (IHSG), and financial statement as of December 31. Data are collected from
various resources, such as: Pusat Data Bisnis Indonesia, Harian Bisnis Indonesia,
Indonesian Capital Market Directory, JSX Statistic, PDPM FE-UGM.
3. 2. Sample Selection
In this research the population is defined as completed acquiring companies that
has been listed in the Jakarta Stock Exchange. Sample is determined as purposive
sampling. Purposive sampling in the research is confined to specific type of criteria set
by the researcher (Sekaran, 2003).
To be included in the sample, the following criteria must be satisfied:
a. The companies- acquiring companies- is manufacturing firms and must be listed in
the Jakarta Stock Exchange.
b. The acquisitions must be completed in the period from 1991 through 1998. The
reason for choosing this period because it is in 1990s Indonesian Capital Market
experienced resurgence. Since then acquisition is perceived as an avenue for
improving business competition.
c. There is financial statement available at least two year before the acquisition date
and three years after the acquisition takes place.
d. The date of acquisition must be clearly recorded.
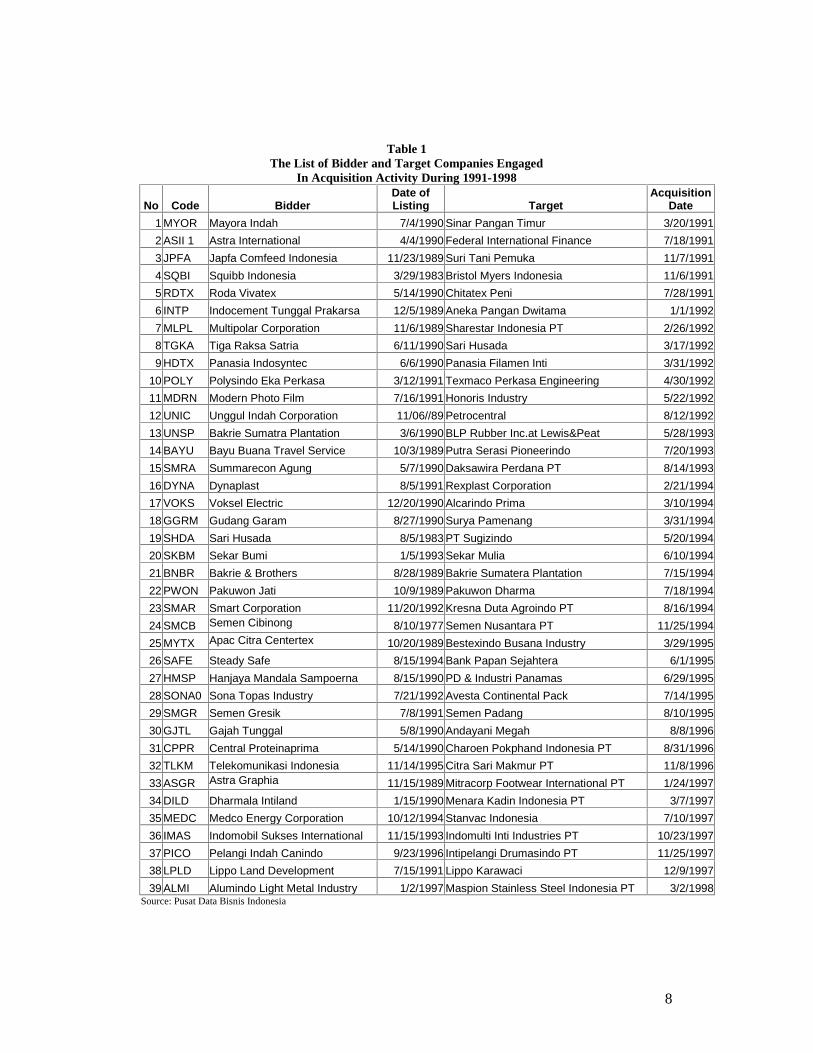
Based on those criteria, the total numbers of acquisition deals are 39 bidder
companies. All firms considered as the sample disclosed in Table 3.1.
8
Table 1The List of Bidder and Target Companies Engaged
In Acquisition Activity During 1991-1998
No Code BidderDate ofListing Target
AcquisitionDate
1 MYOR Mayora Indah 7/4/1990 Sinar Pangan Timur 3/20/19912 ASII 1 Astra International 4/4/1990 Federal International Finance 7/18/19913 JPFA Japfa Comfeed Indonesia 11/23/1989 Suri Tani Pemuka 11/7/19914 SQBI Squibb Indonesia 3/29/1983 Bristol Myers Indonesia 11/6/19915 RDTX Roda Vivatex 5/14/1990 Chitatex Peni 7/28/19916 INTP Indocement Tunggal Prakarsa 12/5/1989 Aneka Pangan Dwitama 1/1/19927 MLPL Multipolar Corporation 11/6/1989 Sharestar Indonesia PT 2/26/19928 TGKA Tiga Raksa Satria 6/11/1990 Sari Husada 3/17/19929 HDTX Panasia Indosyntec 6/6/1990 Panasia Filamen Inti 3/31/1992
10 POLY Polysindo Eka Perkasa 3/12/1991 Texmaco Perkasa Engineering 4/30/199211 MDRN Modern Photo Film 7/16/1991 Honoris Industry 5/22/199212 UNIC Unggul Indah Corporation 11/06//89 Petrocentral 8/12/199213 UNSP Bakrie Sumatra Plantation 3/6/1990 BLP Rubber Inc.at Lewis&Peat 5/28/199314 BAYU Bayu Buana Travel Service 10/3/1989 Putra Serasi Pioneerindo 7/20/199315 SMRA Summarecon Agung 5/7/1990 Daksawira Perdana PT 8/14/199316 DYNA Dynaplast 8/5/1991 Rexplast Corporation 2/21/199417 VOKS Voksel Electric 12/20/1990 Alcarindo Prima 3/10/199418 GGRM Gudang Garam 8/27/1990 Surya Pamenang 3/31/199419 SHDA Sari Husada 8/5/1983 PT Sugizindo 5/20/199420 SKBM Sekar Bumi 1/5/1993 Sekar Mulia 6/10/199421 BNBR Bakrie & Brothers 8/28/1989 Bakrie Sumatera Plantation 7/15/199422 PWON Pakuwon Jati 10/9/1989 Pakuwon Dharma 7/18/199423 SMAR Smart Corporation 11/20/1992 Kresna Duta Agroindo PT 8/16/199424 SMCB Semen Cibinong 8/10/1977 Semen Nusantara PT 11/25/199425 MYTX Apac Citra Centertex 10/20/1989 Bestexindo Busana Industry 3/29/199526 SAFE Steady Safe 8/15/1994 Bank Papan Sejahtera 6/1/199527 HMSP Hanjaya Mandala Sampoerna 8/15/1990 PD & Industri Panamas 6/29/199528 SONA0 Sona Topas Industry 7/21/1992 Avesta Continental Pack 7/14/199529 SMGR Semen Gresik 7/8/1991 Semen Padang 8/10/199530 GJTL Gajah Tunggal 5/8/1990 Andayani Megah 8/8/199631 CPPR Central Proteinaprima 5/14/1990 Charoen Pokphand Indonesia PT 8/31/199632 TLKM Telekomunikasi Indonesia 11/14/1995 Citra Sari Makmur PT 11/8/199633 ASGR Astra Graphia 11/15/1989 Mitracorp Footwear International PT 1/24/199734 DILD Dharmala Intiland 1/15/1990 Menara Kadin Indonesia PT 3/7/199735 MEDC Medco Energy Corporation 10/12/1994 Stanvac Indonesia 7/10/199736 IMAS Indomobil Sukses International 11/15/1993 Indomulti Inti Industries PT 10/23/199737 PICO Pelangi Indah Canindo 9/23/1996 Intipelangi Drumasindo PT 11/25/199738 LPLD Lippo Land Development 7/15/1991 Lippo Karawaci 12/9/199739 ALMI Alumindo Light Metal Industry 1/2/1997 Maspion Stainless Steel Indonesia PT 3/2/1998
Source: Pusat Data Bisnis Indonesia
9
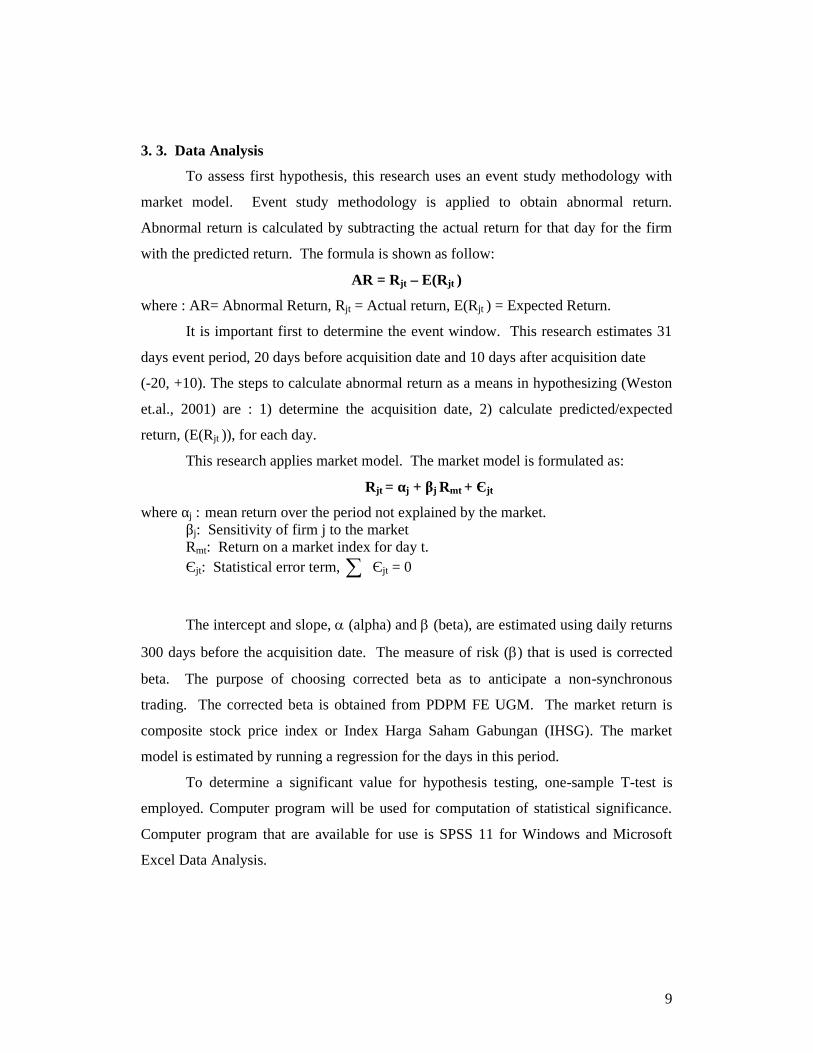
3. 3. Data Analysis
To assess first hypothesis, this research uses an event study methodology with
market model. Event study methodology is applied to obtain abnormal return.
Abnormal return is calculated by subtracting the actual return for that day for the firm
with the predicted return. The formula is shown as follow:
AR = Rjt – E(Rjt )
where : AR= Abnormal Return, Rjt = Actual return, E(Rjt ) = Expected Return.
It is important first to determine the event window. This research estimates 31
days event period, 20 days before acquisition date and 10 days after acquisition date
(-20, +10). The steps to calculate abnormal return as a means in hypothesizing (Weston
et.al., 2001) are : 1) determine the acquisition date, 2) calculate predicted/expected
return, (E(Rjt )), for each day.
This research applies market model. The market model is formulated as:
Rjt = αj + βj Rmt + Єjt
where αj : mean return over the period not explained by the market.βj: Sensitivity of firm j to the marketRmt: Return on a market index for day t.Єjt: Statistical error term, Єjt = 0
The intercept and slope, (alpha) and (beta), are estimated using daily returns
300 days before the acquisition date. The measure of risk () that is used is corrected
beta. The purpose of choosing corrected beta as to anticipate a non-synchronous
trading. The corrected beta is obtained from PDPM FE UGM. The market return is
composite stock price index or Index Harga Saham Gabungan (IHSG). The market
model is estimated by running a regression for the days in this period.
To determine a significant value for hypothesis testing, one-sample T-test is
employed. Computer program will be used for computation of statistical significance.
Computer program that are available for use is SPSS 11 for Windows and Microsoft
Excel Data Analysis.
10
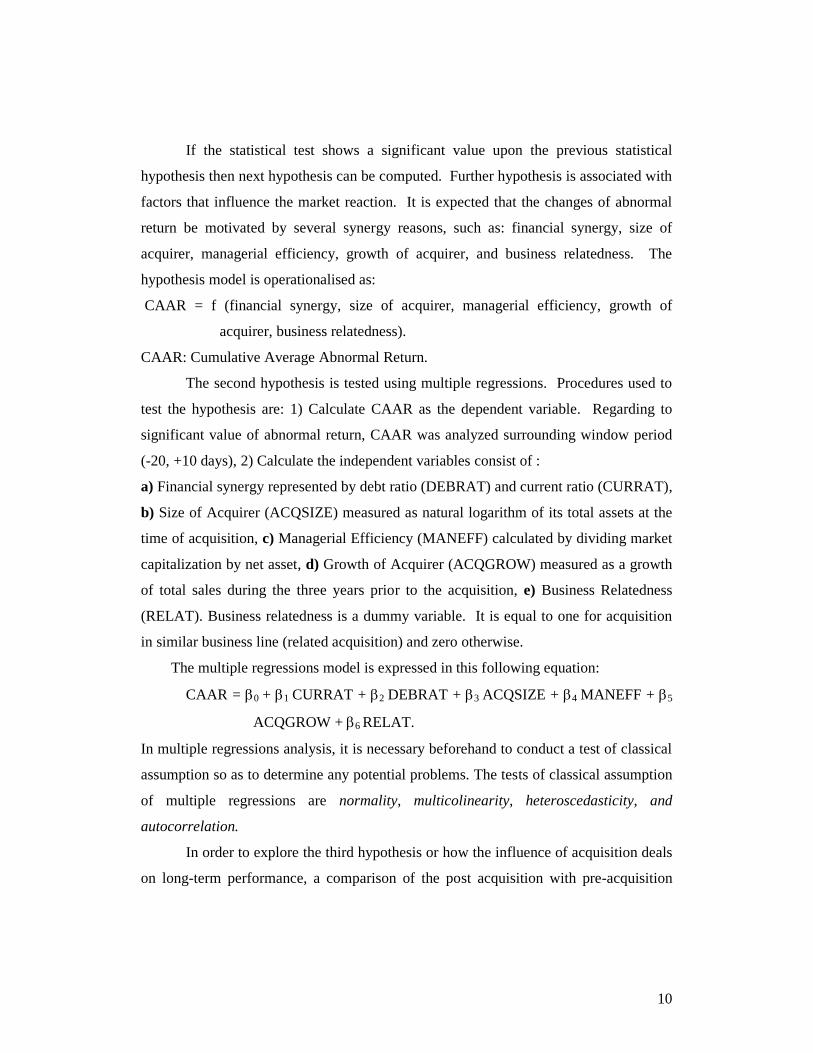
If the statistical test shows a significant value upon the previous statistical
hypothesis then next hypothesis can be computed. Further hypothesis is associated with
factors that influence the market reaction. It is expected that the changes of abnormal
return be motivated by several synergy reasons, such as: financial synergy, size of
acquirer, managerial efficiency, growth of acquirer, and business relatedness. The
hypothesis model is operationalised as:
CAAR = f (financial synergy, size of acquirer, managerial efficiency, growth of
acquirer, business relatedness).
CAAR: Cumulative Average Abnormal Return.
The second hypothesis is tested using multiple regressions. Procedures used to
test the hypothesis are: 1) Calculate CAAR as the dependent variable. Regarding to
significant value of abnormal return, CAAR was analyzed surrounding window period
(-20, +10 days), 2) Calculate the independent variables consist of :
a) Financial synergy represented by debt ratio (DEBRAT) and current ratio (CURRAT),
b) Size of Acquirer (ACQSIZE) measured as natural logarithm of its total assets at the
time of acquisition, c) Managerial Efficiency (MANEFF) calculated by dividing market
capitalization by net asset, d) Growth of Acquirer (ACQGROW) measured as a growth
of total sales during the three years prior to the acquisition, e) Business Relatedness
(RELAT). Business relatedness is a dummy variable. It is equal to one for acquisition
in similar business line (related acquisition) and zero otherwise.
The multiple regressions model is expressed in this following equation:
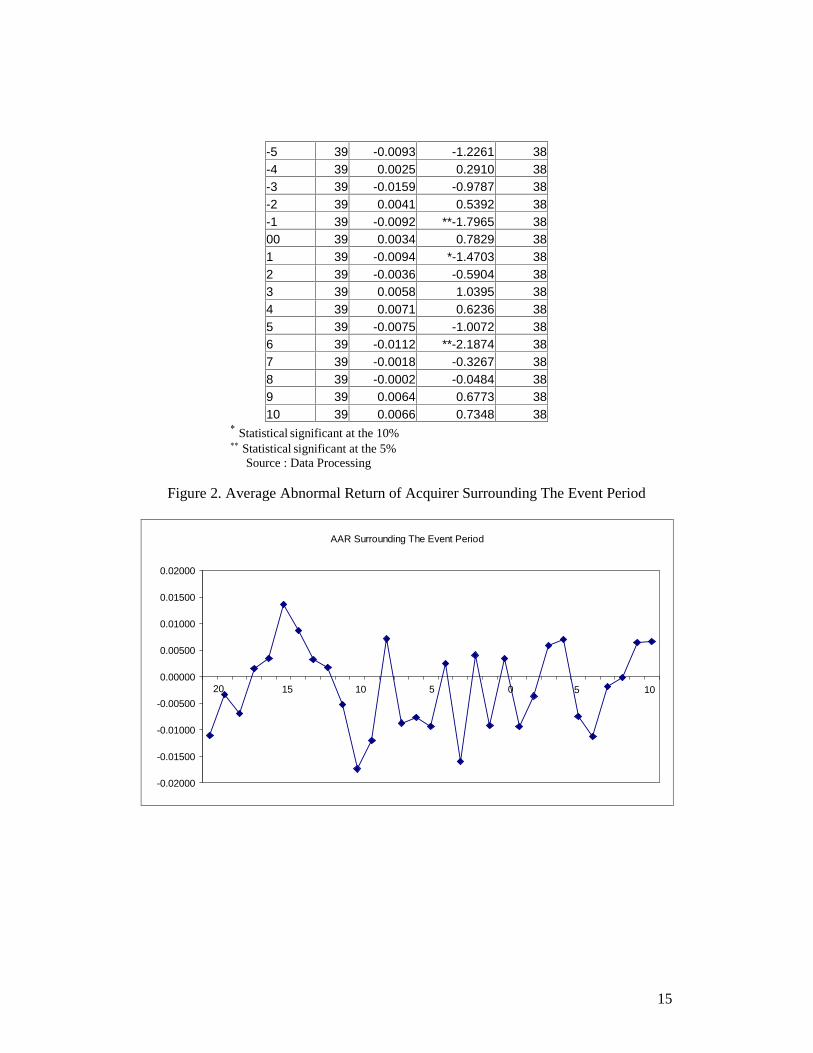
Statistical significant at the 10% Statistical significant at the 5%
Source : Data Processing
Figure 2. Average Abnormal Return of Acquirer Surrounding The Event Period
AAR Surrounding The Event Period
-0.02000
-0.01500
-0.01000
-0.00500
0.00000
0.00500
0.01000
0.01500
0.02000
15 10 05 5 1020
16
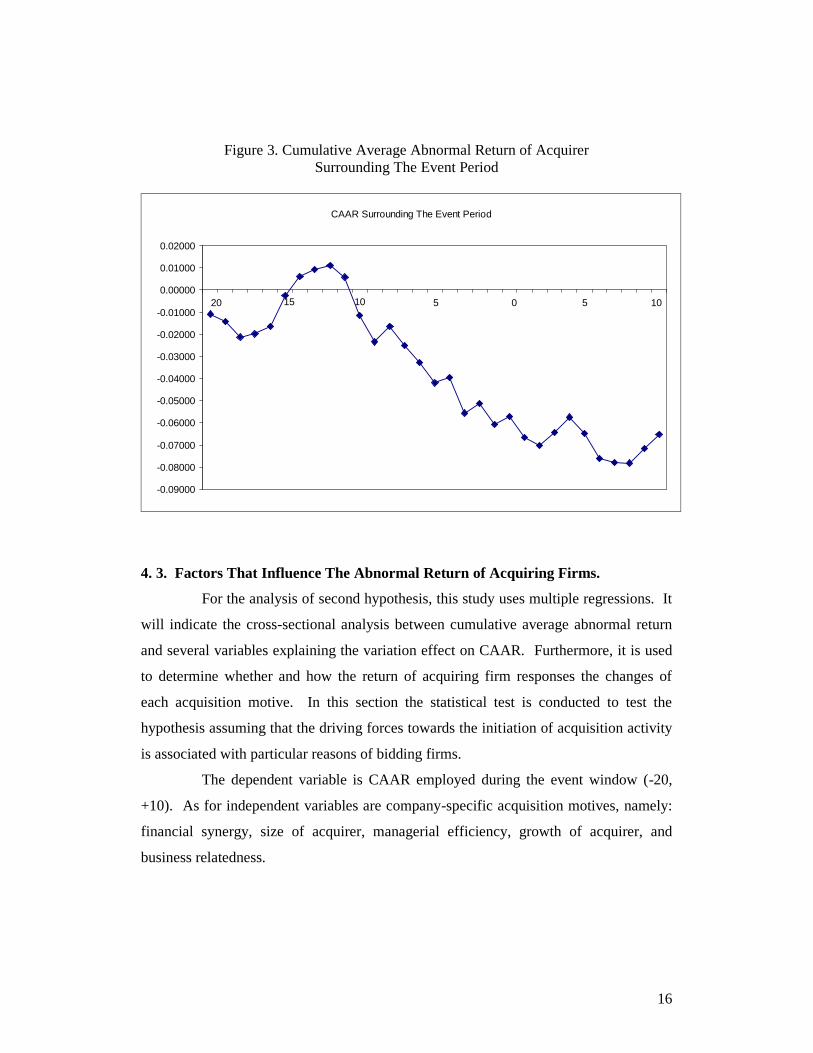
Figure 3. Cumulative Average Abnormal Return of AcquirerSurrounding The Event Period
CAAR Surrounding The Event Period
-0.09000
-0.08000
-0.07000
-0.06000
-0.05000
-0.04000
-0.03000
-0.02000
-0.01000
0.00000
0.01000
0.02000
100 515 10 520
4. 3. Factors That Influence The Abnormal Return of Acquiring Firms.
For the analysis of second hypothesis, this study uses multiple regressions. It
will indicate the cross-sectional analysis between cumulative average abnormal return
and several variables explaining the variation effect on CAAR. Furthermore, it is used
to determine whether and how the return of acquiring firm responses the changes of
each acquisition motive. In this section the statistical test is conducted to test the
hypothesis assuming that the driving forces towards the initiation of acquisition activity
is associated with particular reasons of bidding firms.
The dependent variable is CAAR employed during the event window (-20,
+10). As for independent variables are company-specific acquisition motives, namely:
financial synergy, size of acquirer, managerial efficiency, growth of acquirer, and
business relatedness.
17
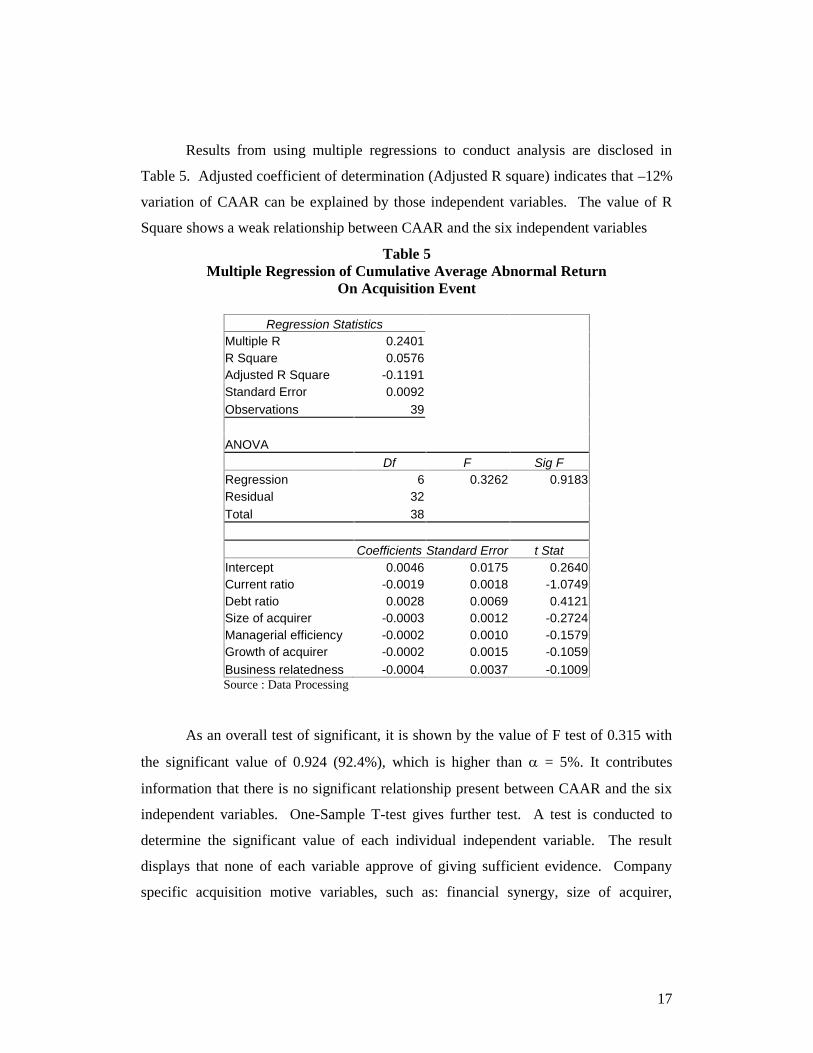
Results from using multiple regressions to conduct analysis are disclosed in
Table 5. Adjusted coefficient of determination (Adjusted R square) indicates that –12%
variation of CAAR can be explained by those independent variables. The value of R
Square shows a weak relationship between CAAR and the six independent variables
Table 5Multiple Regression of Cumulative Average Abnormal Return
On Acquisition Event
Regression StatisticsMultiple R 0.2401R Square 0.0576Adjusted R Square -0.1191Standard Error 0.0092Observations 39
ANOVADf F Sig F
Regression 6 0.3262 0.9183Residual 32Total 38
Coefficients Standard Error t StatIntercept 0.0046 0.0175 0.2640Current ratio -0.0019 0.0018 -1.0749Debt ratio 0.0028 0.0069 0.4121Size of acquirer -0.0003 0.0012 -0.2724Managerial efficiency -0.0002 0.0010 -0.1579Growth of acquirer -0.0002 0.0015 -0.1059Business relatedness -0.0004 0.0037 -0.1009Source : Data Processing
As an overall test of significant, it is shown by the value of F test of 0.315 with
the significant value of 0.924 (92.4%), which is higher than = 5%. It contributes
information that there is no significant relationship present between CAAR and the six
independent variables. One-Sample T-test gives further test. A test is conducted to
determine the significant value of each individual independent variable. The result
displays that none of each variable approve of giving sufficient evidence. Company
specific acquisition motive variables, such as: financial synergy, size of acquirer,
18
managerial efficiency, growth of acquirer, business relatedness, cannot explain the
acquisition motives of acquiring companies.
Throughout the test, it is inferred that acquisitions activity could not be
enhanced by acquirers’ motives of acquisition. It might be imply that decision to deal
with acquisition is initiated by the non-economic reasons such as: to maintain the
performance of the firm as to keep away from bankruptcy, pay an excessive premium
for target and not being able to create sufficient value from the deal (hubris hypothesis
or agency problem), more prone to overconfidence, and so on.
The result of this analysis is in contrast to the study of Nilmawati (2003). She
finds at least two variables earn significant value related to factors associated with
change in CAAR, unrelated acquisition and the size of target companies. Those bidding
firms involved in unrelated business acquisition generate positive reaction from the
market. The size of target firms relatively to the bidder firms earns significant value. It
determines that bidder firms earn positive abnormal return if they acquire bigger target
firms. The results also do not conform to the findings of Raj and Forsyth (retrieved
June 2004). They find that bidding firms acquiring target firm of similar business line
gain significant positive abnormal return.
The result of business relatedness of this research is roughly consistent with the
finding of Barney (1988). Barney determines that one of the factors affecting the
abnormal return is business relatedness. He finds that bidding firms does not generate
abnormal return when they acquire related target firm.
The results of regressions analysis also indicated that a test of classical
assumption meet the assumption of normality, multicolinearity, heteroscedasticity, and
autocorrelation.
4. 4. Long Term Performance.
The analysis before shows that the acquisition motives have apparently not been
able to fully materialize the changes of CAAR. However, it is possible to assess the
longer-term horizon of acquisition activity. The measures of long-term performance are
ROA, ROE and OPM.
19
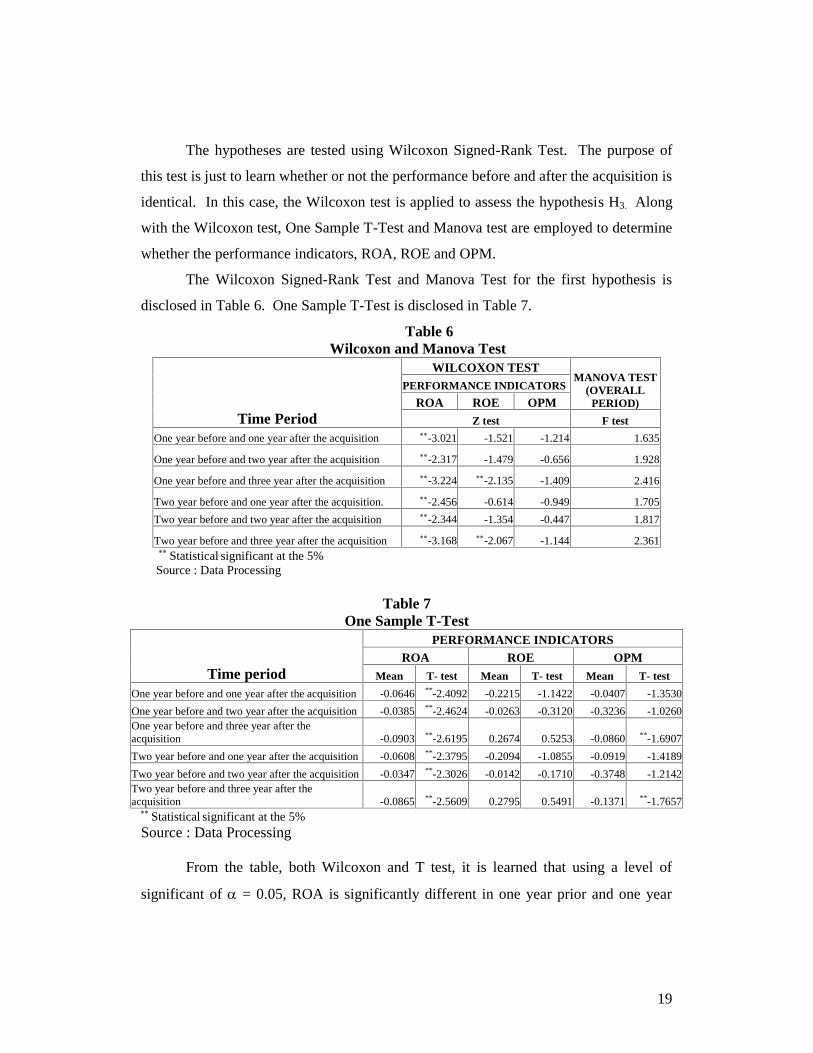
The hypotheses are tested using Wilcoxon Signed-Rank Test. The purpose of
this test is just to learn whether or not the performance before and after the acquisition is
identical. In this case, the Wilcoxon test is applied to assess the hypothesis H3. Along
with the Wilcoxon test, One Sample T-Test and Manova test are employed to determine
whether the performance indicators, ROA, ROE and OPM.
The Wilcoxon Signed-Rank Test and Manova Test for the first hypothesis is
disclosed in Table 6. One Sample T-Test is disclosed in Table 7.
Table 6Wilcoxon and Manova Test
Time Period
WILCOXON TESTMANOVA TEST
(OVERALLPERIOD)
PERFORMANCE INDICATORS
ROA ROE OPMZ test F test
One year before and one year after the acquisition -3.021 -1.521 -1.214 1.635
One year before and two year after the acquisition -2.317 -1.479 -0.656 1.928
One year before and three year after the acquisition -3.224 -2.135 -1.409 2.416
Two year before and one year after the acquisition. -2.456 -0.614 -0.949 1.705
Two year before and two year after the acquisition -2.344 -1.354 -0.447 1.817
Two year before and three year after the acquisition -3.168 -2.067 -1.144 2.361 Statistical significant at the 5%
Source : Data Processing
Table 7One Sample T-Test
Time period
PERFORMANCE INDICATORSROA ROE OPM
Mean T- test Mean T- test Mean T- test
One year before and one year after the acquisition -0.0646 **-2.4092 -0.2215 -1.1422 -0.0407 -1.3530
One year before and two year after the acquisition -0.0385 **-2.4624 -0.0263 -0.3120 -0.3236 -1.0260One year before and three year after theacquisition -0.0903 **-2.6195 0.2674 0.5253 -0.0860 **-1.6907
Two year before and one year after the acquisition -0.0608 **-2.3795 -0.2094 -1.0855 -0.0919 -1.4189
Two year before and two year after the acquisition -0.0347 **-2.3026 -0.0142 -0.1710 -0.3748 -1.2142Two year before and three year after theacquisition -0.0865 **-2.5609 0.2795 0.5491 -0.1371 **-1.7657 Statistical significant at the 5%Source : Data Processing
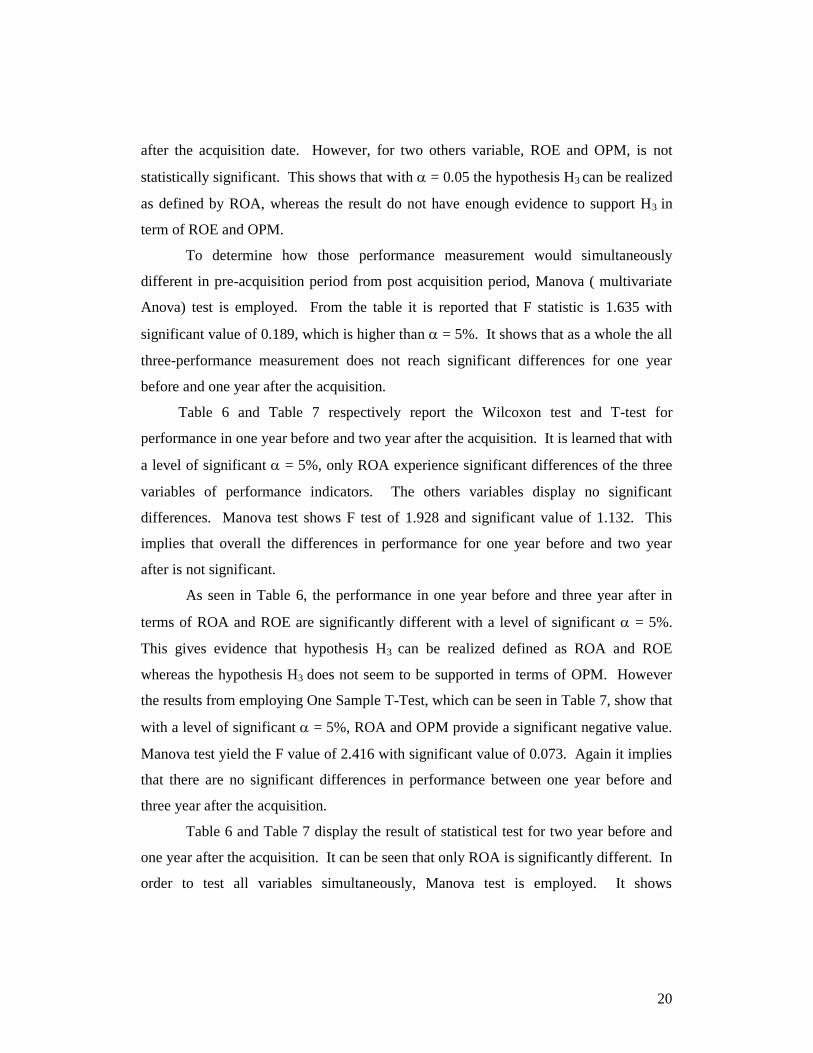
From the table, both Wilcoxon and T test, it is learned that using a level of
significant of = 0.05, ROA is significantly different in one year prior and one year
20
after the acquisition date. However, for two others variable, ROE and OPM, is not
statistically significant. This shows that with = 0.05 the hypothesis H3 can be realized
as defined by ROA, whereas the result do not have enough evidence to support H3 in
term of ROE and OPM.
To determine how those performance measurement would simultaneously
different in pre-acquisition period from post acquisition period, Manova ( multivariate
Anova) test is employed. From the table it is reported that F statistic is 1.635 with
significant value of 0.189, which is higher than = 5%. It shows that as a whole the all
three-performance measurement does not reach significant differences for one year
before and one year after the acquisition.
Table 6 and Table 7 respectively report the Wilcoxon test and T-test for
performance in one year before and two year after the acquisition. It is learned that with
a level of significant = 5%, only ROA experience significant differences of the three
variables of performance indicators. The others variables display no significant
differences. Manova test shows F test of 1.928 and significant value of 1.132. This
implies that overall the differences in performance for one year before and two year
after is not significant.
As seen in Table 6, the performance in one year before and three year after in
terms of ROA and ROE are significantly different with a level of significant = 5%.
This gives evidence that hypothesis H3 can be realized defined as ROA and ROE
whereas the hypothesis H3 does not seem to be supported in terms of OPM. However
the results from employing One Sample T-Test, which can be seen in Table 7, show that
with a level of significant = 5%, ROA and OPM provide a significant negative value.
Manova test yield the F value of 2.416 with significant value of 0.073. Again it implies
that there are no significant differences in performance between one year before and
three year after the acquisition.
Table 6 and Table 7 display the result of statistical test for two year before and
one year after the acquisition. It can be seen that only ROA is significantly different. In
order to test all variables simultaneously, Manova test is employed. It shows
21
insignificant value indicating that the acquisition activity could not enhance the
performance of acquiring firms. The performance in two year before and two year after
are only significant when performance was measured as ROA (sig. = 0.05). The
two other variables, ROE and OPM, display no significant differences. For Manova test
is learned that overall, the performance in two year before and two year after is not
significantly different.
Table 6 presents the Wilcoxon test in two year before and three year after the
acquisition date. It shows that with significant level = 5%, two of the three indicators,
ROA and ROE, is significantly different in two year before and three year after the
acquisition date. This finding supports the hypothesis H3 in terms of ROA and ROE.
Table 7 presents the T-test. It is learned that with significant level = 5%, ROA and
OPM reveal a significant negative value. Result from using Manova test explains that
performance for two year before is not statistically different from that of three year after
the acquisition date. It can be seen as the result of F test of 2.361 and significant value
is 0.078.
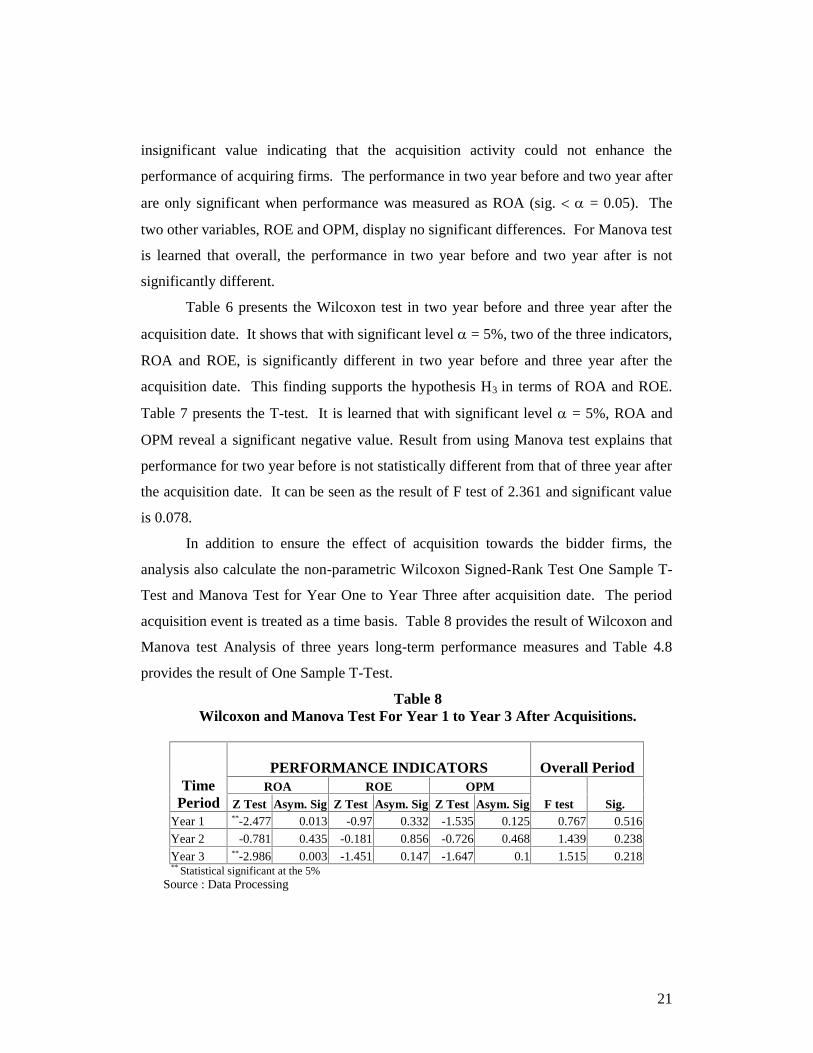
In addition to ensure the effect of acquisition towards the bidder firms, the
analysis also calculate the non-parametric Wilcoxon Signed-Rank Test One Sample T-
Test and Manova Test for Year One to Year Three after acquisition date. The period
acquisition event is treated as a time basis. Table 8 provides the result of Wilcoxon and
Manova test Analysis of three years long-term performance measures and Table 4.8
provides the result of One Sample T-Test.
Table 8Wilcoxon and Manova Test For Year 1 to Year 3 After Acquisitions.
TimePeriod
PERFORMANCE INDICATORS Overall PeriodROA ROE OPM
F test Sig.Z Test Asym. Sig Z Test Asym. Sig Z Test Asym. SigYear 1 **-2.477 0.013 -0.97 0.332 -1.535 0.125 0.767 0.516
Year 2 -0.781 0.435 -0.181 0.856 -0.726 0.468 1.439 0.238
Year 3 **-2.986 0.003 -1.451 0.147 -1.647 0.1 1.515 0.218** Statistical significant at the 5%
Source : Data Processing
22
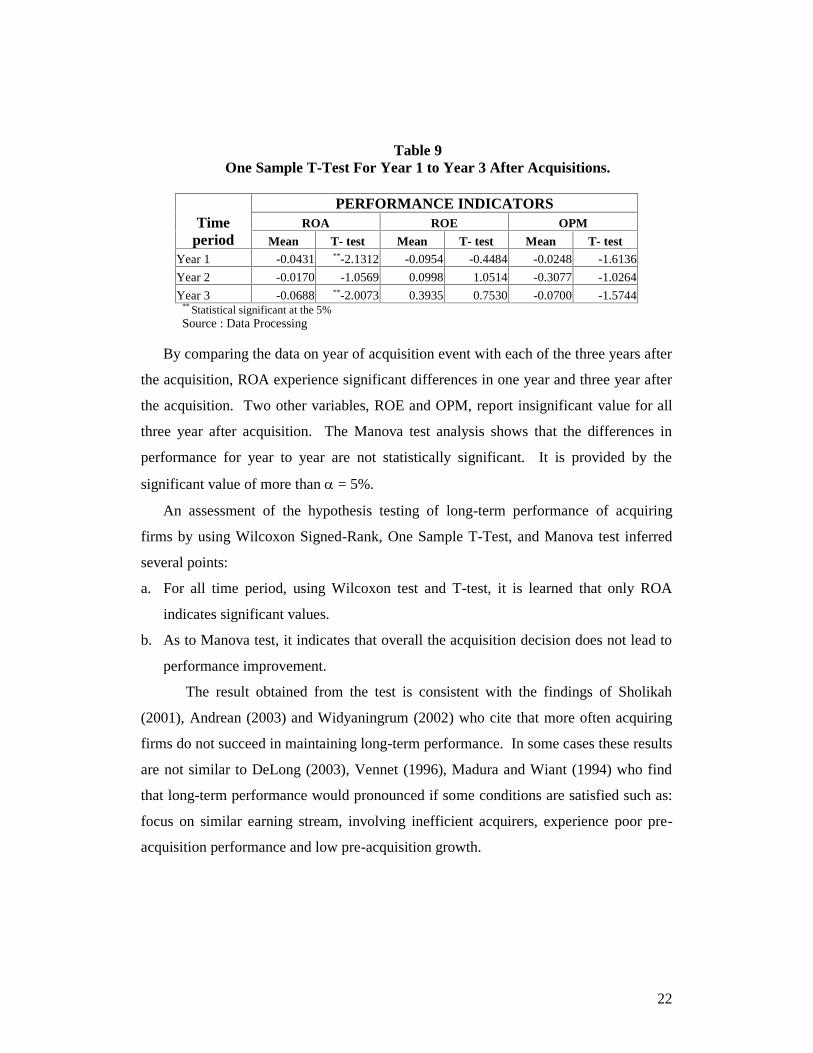
Table 9One Sample T-Test For Year 1 to Year 3 After Acquisitions.
Timeperiod
PERFORMANCE INDICATORSROA ROE OPM
Mean T- test Mean T- test Mean T- testYear 1 -0.0431 **-2.1312 -0.0954 -0.4484 -0.0248 -1.6136
Year 2 -0.0170 -1.0569 0.0998 1.0514 -0.3077 -1.0264
Year 3 -0.0688 **-2.0073 0.3935 0.7530 -0.0700 -1.5744** Statistical significant at the 5%Source : Data Processing
By comparing the data on year of acquisition event with each of the three years after
the acquisition, ROA experience significant differences in one year and three year after
the acquisition. Two other variables, ROE and OPM, report insignificant value for all
three year after acquisition. The Manova test analysis shows that the differences in
performance for year to year are not statistically significant. It is provided by the
significant value of more than = 5%.
An assessment of the hypothesis testing of long-term performance of acquiring
firms by using Wilcoxon Signed-Rank, One Sample T-Test, and Manova test inferred
several points:
a. For all time period, using Wilcoxon test and T-test, it is learned that only ROA
indicates significant values.
b. As to Manova test, it indicates that overall the acquisition decision does not lead to
performance improvement.
The result obtained from the test is consistent with the findings of Sholikah
(2001), Andrean (2003) and Widyaningrum (2002) who cite that more often acquiring
firms do not succeed in maintaining long-term performance. In some cases these results
are not similar to DeLong (2003), Vennet (1996), Madura and Wiant (1994) who find
that long-term performance would pronounced if some conditions are satisfied such as:
focus on similar earning stream, involving inefficient acquirers, experience poor pre-
acquisition performance and low pre-acquisition growth.
23
5. CONCLUSION AND RECOMMENDATION
5.1. Conclusion
Results from using One-Sample T-test provide an evidence showing that the
market react relatively in doubt to accept the information about the acquisition event. It
is reflected as average abnormal return experiences the fluctuated value. By observing
31 days window period, Average Abnormal Return (AAR) earns significant positive
value at day 15, day 14 and day 8 before the acquisition date (t = -15, - 14, - 8). The
significant negative value is found at day 9, day 7, and day 1 before the acquisition date
(t = -9, -7, -1), and at day 1, day 6 after the acquisition (t = 1, 6). In this case the
investor might perceive that acquisition activity do not favored by the market, thus
decreasing shareholders wealth.
By examining the specific acquiring firm motivations of acquisition, it is found
that none of each variable approve of giving sufficient evidence of disparity of CAAR.
It implies that initiation to involve in acquisition deal may be attributed to some non-
economic motives, such as: to maintain the performance of the firm as to keep away
from bankruptcy, pay an excessive premium for target and not being able to create
sufficient value from the deal (hubris hypothesis or agency problem), more prone to
overconfidence, and so on. This result is consistent with the result of AAR showing
that the market has little faith towards the success of acquisition.
Differing performance levels over the time period designated the analysis of
long-term performance. The results indicate that based on Wilcoxon test there are two
variables generate significant differences, namely ROA and ROE while One Sample T-
test generates significant values for ROA and OPM. For all time period ROA in pre-
acquisition is statistically different from post-acquisition, whereas ROE and OPM are
statistically significant in one year before, three year after acquisition date and two year
before, three year after the acquisition. The results of both statistical tests provide the
negative and significant value for the hypothesis on ROA, ROE and OPM. It indicates
the inverse expectation between pre- and post- acquisition performance. As an overall
24
result, which is computed by Manova test, it is learned that the acquisition activity does
not affect on performance improvement.
These results are consistent with the market reaction, which is in doubt to predict
the success of the acquisition over the long-term performance. Along with the result of
hypothesis 2, it can be postulated that several reasons why long-term performance is
deteriorated in the following years after the acquisition is also related to non-economic
reasons, as follows:
1. The management side might only concern to the rapid increase of total balance sheet
so that the merged firms experience a large amount of expense.
2. Acquisition may also perceive as a mean to obtain prestige. In such a case large
acquisition will invite the media attention so that enhance the firm rankings.
3. The management might be overconfidence in creating value from acquisition. It
ensures that acquirer companies pay an excess premium so that the value of
shareholders of acquiring firms is decreasing.
4. After the acquisition completed, the merged companies may not be willing to
restructure to achieve the potential cost savings.
5. The problem may also come from human factors. In this kind of situation the
merged companies have a big problem in integrating different business culture.
5. 3. Recommendations
Based on the analysis and conclusions, here are some recommendations:
1. To provide further understanding about the effect of acquisition on long-term
performance, it is suggested to apply a detailed approach. So, it would be able
to discern of to what extent the acquisition will deteriorate the performance of
combined firm.
2. It might be directional if the study of acquisitions is conducted by designing
particular categorical observation. For instance, a study separately examines the
acquisition activities based on focusing and diversifying acquisition or
horizontal and vertical acquisition.
25
3. It is possible to employ other performance indicators rather than using the
financial ratios as a measure of long-term performance.
4. The total number of sample in this research is quite small, so it is possible to add
sample data obtained from various sources.
==================================
REFERENCES:
Azevedo, Joao. 1999. “Why Do Companies Merge?: Merger Motives andDeterminants”. Strategy and International Business. Retrived: June 2004. From:www.tuta.hut.fi.
Barney, Jay B. 1998. “Returns To Bidding Firms In Mergers and Acquisitions:Reconsidering The Relatedness Hypothesis”. Strategic Management Journal,Vol.9. pp.71-78.
Boedijoewono, Noegroho, Drs. 2001. “Pengantar Statistik Ekonomi dan Perusahaan”.Jilid 2. Edisi Revisi. Yogyakarta: Unit Penerbit dan Percetakkan AMP YKPN.
Bower, Joseph L. 2001. “Not All M&As Are Alike And That Matters”. HarvardBusiness Review. March. pp. 93-101.
Brigham, Eugene F. & Philip R. Daves. 2002. “Intermediate Financial Management”.Seventh Edition. United States of America: Thomson Learning, Inc.
Deloitte Consulting and Deloitte&Touche. “Solving The Merger Mystery: MaximizingThe Pay Off of Mergers and Acquisitions”. Retrieved: February 2004. From:www.dc.com/services/mergers/index.asp.
DeLong, Gayle. 2003. “Does Long-Term Performance of Mergers Match MarketExpectation?: Evidence from the US Banking Industry”. Financial Management.
Gaughan, Patrick A. 2002. “Mergers, Acquisitions, and Corporate Restructurings”.Third Edition. New York: John Wiley & Sons, Inc.
Hadiputranto, Hadinoto & Patners. 2003. “Guide To Mergers & Acquisitions:Indonesia”. Retrieved: May 2004. From: www.hhp.co.id.
Hall, Ernest. H, Jr. 1995. “Corporate Diversification and Performance: An Investigationof Causality”. Australian Journal of Management. Vol. 20 No. 1. pp. 25-41.
26
Hair, Joseph F., Jr., Rolph E. Anderson, Ronald L. Tatham. 1998. “Multivariate DataAnalysis”. Fifth Edition. New Jersey: Prentice Hall, Inc.
Hyland, David C., David J. Diltz. Spring, 2002. “Why Firms Diversify: An EmpiricalExamination”. Financial Management. pp. 5-35.
Hildebrand, David K., Lyman Ott. 1991. “Statistical Thinking For Managers”. ThirdEdition. United States of America: PWS-KENT Publishing Company.
Jogiyanto, Dr. H.M., M.B.A., Akt. 2003. “Teori Portofolio dan Analisis Investasi”.Edisi 3. Yogyakarta: BPFE.
Kustianto, Bambang, Drs., M.A. 1998. “Statistika Untuk Ekonomi dan Bisnis”.Yogyakarta:BPFE.
Madura, Jeff & Kenneth J. Wiant. 1994. “Long Term Valuation Effects of BankAcquisitions”. Journal of Banking & Finance, Vol.18. pp. 1135-1154.
Moeller, Sara B., Frederik P. Schlingemann, Rene M. Stulz. 2003. “Do Shareholders ofAcquiring Firms Gain From Acquisitions?”. Retrieved: June 2004. From:www.cob.ohio-state.edu.
Moeller, Sara B., Frederik P. Schlingemann, Rene M. Stulz. 2003. “Firm Size and TheGains From Acquisitions”. Journal of Financial Economics. pp. 1-37.
Nilmawati. 2003. “Analisis Pengaruh Pengumuman Merger dan Akuisisi TerhadapReturn Saham Bidder dan Target di BEJ”. Tesis, tidak diterbitkan. MagisterManagement UGM.
Nugroho, Eryawan Budi. 2002. “The Impact of Acquisitions Towards Stock Return ofTarget Companies in Jakarta Stock Exchange”. Tesis, tidak diterbitkan. MagisterManagement UGM.
PeopleSoft, Inc. 2001. “Poised For Growth: Mergers, Acquisitions, and HRMS”.Retrieved: February 2004. From: www.peoplesoft.com
Rahmawati, Eka Nuraini. 2000. “Pengaruh Pengumuman Merger dan Akuisisi TerhadapReturn Saham Target di BEJ”. Tesis, tidak diterbitkan. Magister Sains UGM.
27
Raj, Mahendra Professor, Michael Forsyth. “The Long Term Performance of UKMergers and Acquisitions: Separation by Bidder Motivation”. Retrieved: June2004. From: www.uwi.tt/financeconference/
Saiful. 2003. “Abnormal Return Perusahaan Target dan Industri Sejenis SekitarPengumuman Merger dan Akuisis”. Jurnal Riset Ekonomi dan Manajemen, Vol. 3No. 1, Hal. 76-90.
Saprianto, Feri. 2003. “Analisis Dampak Akuisisi Terhadap Nilai Perusahaan”. Tesis,tidak diterbitkan. Magister Management UGM.
Sekaran, Uma. 2003. “Research Methods for Business”. Fourth Edition. United Statesof America: John Wiley & Sons, Inc.
Seputro, Edi. 2002. “Pengaruh Merger Terhadap Profitibilitas, Effisiensi, dan NilaiGuna Perusahaan”. Tesis, tidak diterbitkan. Magister Management UGM.
Sholikah, Nur. 2001. “Pengaruh Merger dan Akuisisi Terhadap Kinerja PerusahaanPerbankan Publik Di Indonesia”. Jurnal Bisnis dan Manajemen, Vol. 1, No. 1,Hal. 17-41.
Stybel, Laurence J., Dr and Maryanne Peabody. “The Life Cycle ofMergers/Acquisitions”. Retrieved: February 2004. From:http://www.boardpoints.com.
______. “The Indonesian Capital Market Law and Regulations”. Retrieved: May 2004.From: www.bappepam.go.id.
Sumarliyah. 1996. “Sekilas Mengenai Merger dan Akuisisi”. Bank & Manajemen.Juli/Agustus. Hal. 24-27.
Vennet, Rudi Vander. 1996. “The Effect of Merger and Acquisition on The Efficiencyand Profitability of EC Credit Institutions”. Journal of Banking & Finance, Vol.20 pp. 1531-1558.
Weston, J. Fred, Kwang S. Chung, Susan E. Haag. 1990. “Mergers, Restructuring andCorporate Control”. New Jersey: Prentice-Hall, Inc.
Weston, J. Freud & Samuel C. Weaver. 2001, “Merger and Acquisition”. UnitedStates:McGraw-Hill
28
Weston, J. Freud, Juan A. Siu, Brian A. Johnson. 2001. “Take Overs, Restructuring &Corporate Governance”. New Jersey: Prentice-Hall, Inc.
Wibowo, Satrio. 1996. “Kinerja Saham Akuisitor Jangka Panjang Setelah Akuisisi(Perbandingan Antara Akuisisi Konglomerasi dan Non-Konglomerasi di BEJ)”.Tesis, tidak diterbitkan. Magister Management UGM.
Widyaningrum, Retno. 2002. “Pengaruh Jangka Panjang Merger dan Akuisisi SetelahMoneter Terhadap Saham di BEJ: Perbandingan Akuisisi Internal dan Eksternal”.Tesis, tidak diterbitkan. Magister Management UGM.
Yeh, Tsung-Ming and Yasuo Hoshino. 2002. “The Impact of M&As on ShareholderWealth: Evidence From Taiwanese Corporations”. The Developing Economies,XL-4.
==========================
Tentang Penulis :
Sere Eva Nababan, lahir di Balige, Kabupaten Toba, 8 Januari 1979. Gelar SarjanaEkonomi (S-1) Jurusan Manajemen diperoleh dari Fakultas Ekonomi UniversitasHKBP Nommensen (UHN) Medan tahun 2001. Gelar S-2 Magister Manajemen(MM) diperoleh dari Program Pascasarjana Universitas Gajah Mada (UGM)Yogyakarta dan De La Salle University, Philippine tahun 2004. Saat ini bekerjasebagai karyawan di salah satu perusahaan swasta.
T. Sihol Nababan, lahir di Siborongborong, Tapanuli Utara, 7 Mei 1966. Gelar SarjanaEkonomi (S-1) diperoleh dari Universitas Sumatra Utara (USU) Medan tahun1990. Gelar S-2 Magister Sains (MSi) di bidang Perencanaan Wilayah diperolehdari Progran Pascasarjana Universitas Sumatra Utara (USU) Medan tahun 2000.Saat ini sedang mengikuti Program S-3 (Doktor) Ilmu Ekonomi di UniversitasDiponegoro (UNDIP) Semarang. Sejak tahun 1992 sampai sekarang menjadiDosen Tetap di Fakultas Ekonomi Universitas HKBP Nommensen (UHN)Medan.
Rusliaman Siahaan, lahir tanggal 10 Nopember 1963. Gelar Sarjana Ekonomi (S-1)Jurusan Manajemen diperoleh dari Fakultas Ekonomi Universitas HKBPNommensen (UHN) Medan tahun 1986. Gelar S-2 Magister Manajemen (MM)diperoleh dari Program Pascasarjana Universitas Gajah Mada (UGM) Yogyakartatahun 1996. Saat ini bekerja sebagai dosen tetap di Fakultas Ekonomi UHNMedan dan menjabat sebagai Sekretaris Jurusan Manajemen Fakultas Ekonomi.


![Ocularis Kalbe Discussion Aug 21[1]](https://static.documents.pub/doc/80x56/554ec18ab4c9053c4b8b49c9/ocularis-kalbe-discussion-aug-211.jpg)


