Munich Personal RePEc Archive Economic Impact and Implications for Jordan of the U.S.–Jordan Free Trade Agreement Montague J. Lord USAID February 2001 Online at http://mpra.ub.uni-muenchen.de/41168/ MPRA Paper No. 41168, posted 10. September 2012 06:09 UTC
Transcript
MPRAMunich Personal RePEc Archive
Economic Impact and Implications forJordan of the U.S.–Jordan Free TradeAgreement
Montague J. Lord
USAID
February 2001
Online at http://mpra.ub.uni-muenchen.de/41168/MPRA Paper No. 41168, posted 10. September 2012 06:09 UTC
Economic Impact and Implications for Jordan of the U.S. – Jordan Free Trade Agreement
Montague Lord
February 2001
Economic Impact and Implications for Jordan of the Jordan-U.S. FTA Draft Report
AMIR Program ii
Table of Contents Table of Contents ............................................................................................................... iii Tables and Boxes ................................................................................................................ v Acronyms and Abbreviations ............................................................................................ vi Executive Summary ......................................................................................................... viii
Chapter 1: Introduction ................................................................................................ 1 A. Study Objective ............................................................................................ 1 B. Approach and Organization of the Study ..................................................... 1
A. The U.S.–Jordan Free Trade Agreement ...................................................... 3 B. WTO Accession and Commitments ............................................................. 5 C. The Euro-Mediterranean Association Agreement ........................................ 6 D. Other Regional and Bilateral Arrangements ................................................ 6
Chapter 3: Structure of Trade ...................................................................................... 8
A. Trade Structure and Flows ........................................................................... 8 B. Trade with the United States ........................................................................ 9
A. Jordan’s Tariff Schedule ............................................................................ 11 B. Jordan’s Free Zones .................................................................................... 12 C. U.S. Preferential Tariffs ............................................................................. 16
Chapter 5: International Competitiveness ................................................................ 19
A. Comparative Advantage ............................................................................. 19 B. International Competitiveness .................................................................... 20
Chapter 6: Export Compatibility with the U.S. Market ............................................. 27
A. Emerging Exports and Imports ................................................................... 27 B. U.S. Tariffs on Jordan’s Exports ................................................................. 33
Chapter 7: Potential FTA Impact on Exports ............................................................ 35
A. FTA-Related Tariff Liberalization ................................................................ 35 B. U.S. Market Access Regulations .................................................................... 40
Economic Impact and Implications for Jordan of the Jordan-U.S. FTA Draft Report
AMIR Program iii
Chapter 8: Potential FTA Impact on Imports ............................................................ 42
A. Trade Complementarities. ........................................................................... 42 B. Nominal and Effective Protection ............................................................... 44
Chapter 9: Potential FTA Impact on Trade in Services ............................................ 48
A. Jordan’s Service Sector ............................................................................... 48 B. FTA and GATS Commitments ................................................................... 48 C. Liberalization of Services ........................................................................... 50
Economic Impact and Implications for Jordan of the Jordan-U.S. FTA Draft Report
AMIR Program iv
List of Tables 3.1 Jordan’s Structure of Trade with World and United States by HS Chapter, 1999 . 8 3.2 Jordan’s Geographic Distribution of Exports, 2000 ............................................... 9 3.3 Jordan’s Major Merchandise Exports to the United States, 1999 ......................... 10 4.1 Jordan’s 2001 MFN Applied Tariffs..................................................................... 11 4.2 Economic Activity of QIZs, as of September 2000 .............................................. 14 4.3 U.S. Tariffs by MFN Rates and Preferential Schemes, 2000 ............................... 18 5.1 Revealed Comparative Advantage of Jordan and Other Middle East Countries in World Market ................................................................................................... 21 5.2 Revealed Comparative Advantage of Jordan and Other Middle East Countries in U.S. Market ...................................................................................................... 22 5.3 Real Cross-Rate Indices of Selected Middle East Currencies with
U.S. Dollar, 1991-2000 ......................................................................................... 23 5.4 International Competitiveness of Selected Middle East Countries in
U.S. Market, 1991-2000........................................................................................ 24 5.5 Comparative Competitive Indicators of Jordan and Other Middle East Countries: Macro Dynamics ................................................................................. 25 5.6 Comparative Competitive Indicators of Jordan and Other Middle East Countries: Infrastructure and Investment Climate ................................................ 26 6.1 Indices of Trade Compatibility ............................................................................. 29 6.2 U.S. Tariffs on Selected Jordanian Exports .......................................................... 34 7.1 Impact of U.S.-Jordan FTA on Sample of Jordan's Exports ................................. 39 8.1 Jordan: Top Imports from the United States ......................................................... 43 8.2 Tariffs and Two-Way Trade in Jordan's Major Imports from the United States .. 46 8.3 Jordan's Exports of Furniture by Type, 1994-99 .................................................. 47 8.4 Jordan’s Effective Rate of Protection in the Furniture Industry ........................... 47 9.1 Jordan’s Services Account in the Balance of Payments, 1995-2000 .................... 50 9.2 Jordan and U.S. GATS Commitments, by Sector ................................................. 53 B.1 Jordan and U.S. GATS Commitments, by Sector ................................................. 61 B.2 U.S. Jordan FTA Commitments versus Jordan’s GATS Commitments ............... 65 List of Boxes 2.1 Preferential Treatment Granted Under Jordan’s Bilateral Agreement ................... 7 4.1 Options for Meeting Value-Added Requirement in QIZs .................................... 13 4.2 Main Differences Between QIZs and the US-Jordan FTA ................................... 15 6.1 Export and U.S. Market Performance of Jordan’s Large-Size Exports ................ 30 6.2 Export and U.S. Market Performance of Jordan’s Medium-Size Exports ........... 31 6.3 Export and U.S. Market Performance of Jordan’s Small-Size Exports ................ 32 6.4 Export and U.S. Market Performance of Jordan’s Emerging Exports .................. 32
Economic Impact and Implications for Jordan of the Jordan-U.S. FTA Draft Report
AMIR Program v
Acronyms and Abbreviations
AAEU Association Agreement with the European Union AFTA Arab Free Trade Agreement AMIR Access to Microfinance and Improved Implementation of Policy
Reform (Program) ATC Agreement on Textiles and Clothing BAI Business Association Initiative BDV Brussels Definition of Value CBI Caribbean Basin Initiative EPZ Export processing zone ERP Effective rate of protection EU European Union FOB Free on board FDI Foreign direct investment FEER Fundamental equilibrium exchange rate FTA Free trade agreement FTAA Free Trade Agreement of the Americas FTZ Free trade zone GATS General Agreement on Trade in Services GATT General Agreement on Tariffs and Trade GDP Gross domestic product GDP Gross domestic production GSP Generalized System of Preferences HS Harmonized System IATA International Air Travel Association IMF International Monetary Fund IPR Intellectual property rights IT Information technology ITA Information Technology Agreement MFA Multi-Fibre Arrangement MFN Most Favored Nation NAFTA North American Free Trade Agreement NRP Nominal rate of protection NTBs Non-tariff barriers NTMs Non-tariff measures PTA Preferential trade arrangements PTMs Para-tariff measures QIZ Qualified Industrial Zone RCA Revealed comparative advantage REER Real effective exchange rate SEZ Special Economic Zone SITE Society of Incentive Travel Executives SMEs Small and medium size enterprises SOEs State-owned enterprises
Economic Impact and Implications for Jordan of the Jordan-U.S. FTA Draft Report
AMIR Program vi
TCMs Trade control measures TRIPS Trade-Related Intellectual Property Rights TRQ Tariff-rate quota UNDP United Nations Development Program USAID United States Agency for International Development USDA US Department of Agriculture USITC US International Trade Commission USFDA US Food and Drug Administration WATA World Air Transport Association WIPO World Intellectual Property Rights Organization WTO World Trade Organization
Economic Impact and Implications for Jordan of the Jordan-U.S. FTA Draft Report
AMIR Program vii
Executive Summary Background On October 24, 2000, the Hashemite Kingdom of Jordan (Jordan) and the United States signed the U.S.-Jordan Free Trade Agreement (FTA). The Jordanian business community and the Government of Jordan are eager to encourage exports of goods and services to the United States and attract foreign direct investment (FDI) and its accompanying technological transfer. In response to this interest, the Jordan Trade Association (JTA) and the Jordanian American Business Association (JABA) have planned a series of economic impact assessments and awareness campaigns aimed at the educating the business community on the U.S.-Jordan FTA. In support of these initiatives and those of the Government of Jordan in promoting trade and investment, the Access to Microfinance and Improved Implementation of Policy Reform (AMIR) project has undertaken the present study in consultation with USAID. The objective is to review the U.S.–Jordan FTA and assess its impact on trade in goods and services of the Hashemite Kingdom of Jordan (Jordan), with a view to examining the following specific areas:
(1) The comparative advantage of Jordan in exports of goods and services to the U.S. market, relative to other countries in the Middle East region.
(2) The effect of FTA-related tariffs, rules of origin, and other market access
conditions on Jordanian exporting companies. (3) The impact of the FTA on the bilateral trade in services between Jordan
and the United States. The study was conducted during January–February 2001 and is based on fieldwork that included interviews with private and public sector officials in Jordan. It also draws on the extensive literature on the current wave of preferential trade arrangements, particularly that dealing with the impact of free trade agreements on participating countries.
Jordan’s Trade and Tariff Structure
Jordan’s major exports are in the form of natural resource based products, of which chemical products and mineral products together account for nearly one-half of total export revenue. In contrast, imports are heavily concentrated in transportation equipment, machinery and electrical equipment and mineral products, mainly in the form of iron and steel. Overall, the magnitude of these imports is twice as large as those of exports. Jordan’s structure of trade with the United States is considerably different from that with the rest of the world, which reflects each country’s comparative advantage in the other’s market. Jordan’s major export to the U.S. is transport equipment (60 percent of the total), which mainly reflects the re-export of aircraft and parts. Articles of jewelry plated with
Economic Impact and Implications for Jordan of the Jordan-U.S. FTA Draft Report
AMIR Program viii
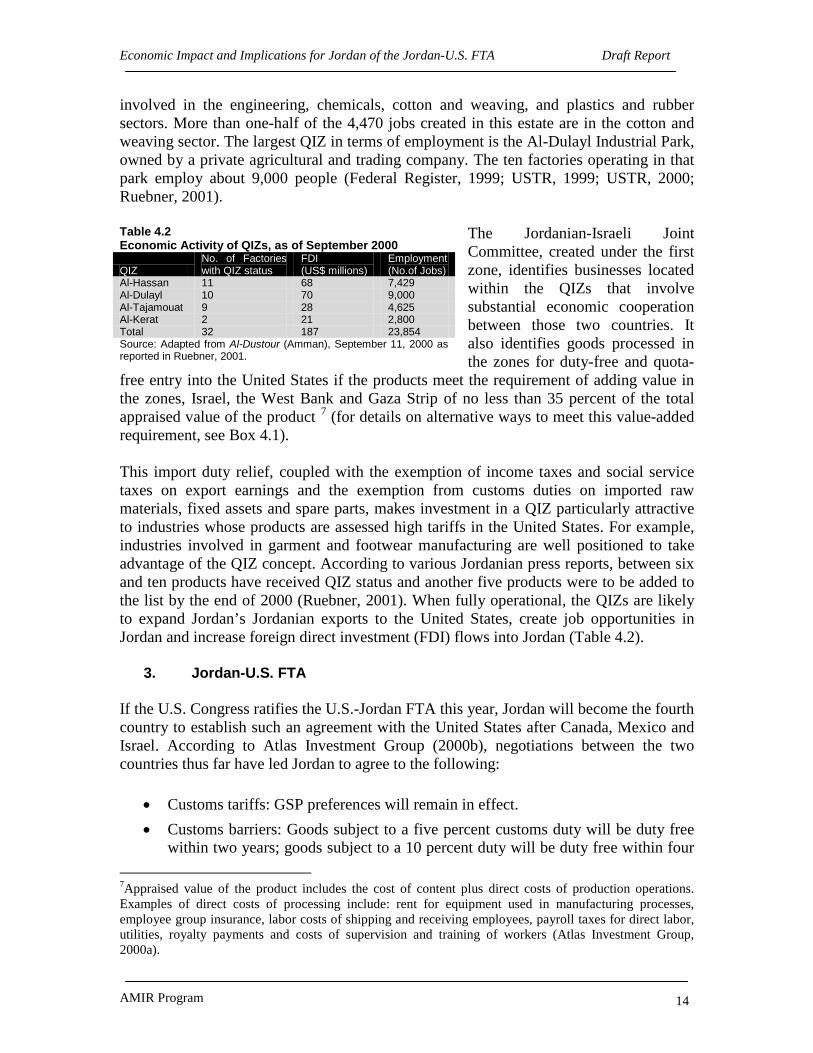
gold make up the second largest export category (9 percent of the total), followed by articles of apparel and carpets (7 percent of the total) in the third largest category. On the import side, cereals represent the largest U.S. import of Jordan, representing nearly one-fourth its total imports. Two other important categories are transport equipment, mainly in the form of aircraft parts, and machinery and electrical equipment, primarily in the form of machinery parts and data processing equipment. Other significant, albeit smaller, categories include prepared foods and tobacco, chemical products, vegetable fats and oils and optical equipment. In April 2000 Jordan became a member of the WTO and committed to bind most of its tariffs at a 20 percent ceiling by the year 2010. Jordan’s current tariff schedule is fairly transparent at the Harmonized System (HS) section level with relatively few tariff rates, but it has widely varying rates within each product category. The schedule has six ad valorem rates of 0, 5, 10, 20, 30 and 40 percent, with a mean unweighted average rate of 16 percent. The rates will be gradually reduced over the present decade to meet the WTO commitments. In services, Jordan commitments covered the majority of services sectors, but there are a number of exemptions in each sector that represent legal and regulatory barriers to trade. U.S. Tariff Preferences and QIZs The United States MFN tariff schedule comprises nearly 14,000 tariff lines having an unweighted average of 6 percent. In practice, however, the actual tariff rates applied by industrialized countries to products originating from Jordan and other developing countries are usually less than the MFN rate because of tariff preference schemes like the Generalized System of Preferences (GSP) and other preferential trade arrangements (PTAs). The United States currently extends duty-free treatment to imports under the North American Free Trade Agreement (NAFTA), the US-Israeli Free Trade Agreement, the Caribbean Basin Initiative (CBI), the Andean Initiative, and the upcoming U.S.-Jordan Free Trade Agreement. Plans for other regional arrangements, including one in the Asia Pacific region, are underway. The other important tariff preference for Jordan is that provided by the Qualifying Industrial Zone (QIZ) scheme, which was formalized by the United States-Israel Free Trade Area Implementation Act (IFTA) of 1985. The system allows articles to be imported duty free into the United States that are produced in the West Bank, Gaza Strip and QIZs between Israel and Jordan and between Israel and Egypt. The Jordanian-Israeli Joint Committee, created under the first zone, identifies businesses located within the QIZs that involve substantial economic cooperation between those two countries. It also identifies goods processed in the zones for duty-free and quota-free entry into the United States if the products meet the requirement of adding value in the zones, Israel, the West Bank and Gaza Strip of no less than 35 percent of the total appraised value of the product.
Economic Impact and Implications for Jordan of the Jordan-U.S. FTA Draft Report
AMIR Program ix
At first glance, it might appear that the establishment of the FTA would compete with the QIZs and the free zones in attracting investments. One of the key differences between QIZs and the FTA is the duty-free and quota-free status (see Boxes S1). Under the QIZ, exported goods (as long as they meet the local content requirement) are duty-free and quota-free; under the FTA, some products will enjoy immediate elimination of duties and others will have to wait ten years. Therefore, some companies could find an investment to be more attractive under the QIZ concept rather than waiting until the FTA is ratified.
Input requirements are another key issue in examining the differences between QIZs and the FTA. Under the QIZ, production of goods is subject to an 11.7 percent Jordanian input; under current negotiations of the FTA, Jordanians alone should provide the minimum 35 percent value added for each product. The input requirement therefore allows investors a choice, which in part may be influenced by political considerations. Lastly, the QIZ is a designated area with existing infrastructure, while the FTA is country-wide, a distinction that can influence investor preferences in determining what preferential system to adopt. Jordan’s Comparative Advantage Jordan’s endowment of natural resources and human capital has allowed exporters to develop a relatively high productivity in natural resource and human resource-intensive products. However, Jordan and other Middle East countries generally have a comparative advantage in similar product categories, implying a low level of complementary opportunities that could induce a strong expansion in intra-regional trade within the Middle East. In trade with the United States, Jordan and the selected other Middle East countries have a similar pattern of comparative advantage. For example, in natural resource-intensive products, Jordan continues to have a clear comparative advantage in manufactured fertilizers, as do Morocco, Tunisia and, to a lesser extent, Israel and Egypt. Among unskilled labor-intensive products, Jordan and all other Middle East countries have a comparative advantage in footwear, clothing and textile yarn. Jordan is the only country in the region with a comparative advantage in furniture in the U.S. market. Among the human capital and technology-intensive products, Jordan again shares a comparative advantage with other Middle East countries in all but one product. The similarity of export performances across product divisions for Jordan and other Middle East countries suggests that, by developing cross-border production facilities and benefiting from economies of scale, exporters could improve their export performance in the world market, and the U.S. market in particular. For this expansion to happen, however, problems
Box S1 Main Differences Between QIZs and the US-Jordan FTA QIZs FTA Duty and Quota-Free Status Exported goods are duty and quota-free Schedule of elimination of duties to be
completed over 10 years Activities Covered Only industrial activities Industrial activities and services Legal Framework US-Israel FTA US-Jordan FTA Input Requirements 11.7% Jordanian 35% Jordanian under current
negotiations Designated areas Defined areas within the country Entire country
Economic Impact and Implications for Jordan of the Jordan-U.S. FTA Draft Report
AMIR Program x
of sufficient capital required to upgrade processing techniques will need to be overcome. The ability and willingness of businesses to enter into joint ventures will naturally depend on comparative production costs between the countries, economic policies and the regulatory environment, and p olitical issues. Jordan’s International Competitiveness Jordan’s export competitiveness depends on its exchange rate competitiveness, labor and infrastructure costs, financial conditions, and trade policies. Unfortunately, Jordan’s exchange rate policies and a gradually widening differential between inflation rates in Jordan and the United States have driven up the real cross rate of the dinar (JD) against the dollar.1 The real cross rate rose by nearly 6 percent between 1995 and 1998, while that of most other Middle East countries fell. Despite the subsequent stabilization of the JD between 1999 and 2000, the real cross-rates of Israel, Tunisia and Morocco have continued to fall in the last three years, which has further weakened the competitive position of Jordan relative to those countries in the U.S. market (Table S1). The loss of Jordan’s export competitiveness has been especially severe in Western Europe and Asia, since the Euro and most of the currencies in Asia have depreciated relative to the US dollar. In addition to the loss of export competitiveness, the appreciation of the JD has stimulated imports, and undermined a recovery in domestic production, employment and fiscal revenue because of the loss of domestic profitability of production. Our attempt to compare factor costs of Jordan with other Middle East countries was hampered by the lack of data. We have therefore used information from the World Bank’s World Development Indicators for Jordan and other selected Middle East countries. Not surprisingly, Jordan is not competitive in its exports relative to most other Middle East countries, but its macro dynamics are favorable and there are mixed results on its infrastructure, investment climate and human resource capacity.
1 The real cross rate is the nominal bilateral exchange rate adjusted for relative movements in the national prices of Jordan and a partner country (the United States). As such, an increase in the index reflects an appreciation or revaluation and a decline denotes a devaluation or depreciation.
Table S1 International Competitiveness of Selected Middle East Countries in U.S. Market, 1991-2000 (1995 = 100) 1991 1992 1993 1994 1995 1996 1997 1998 1999 2000
Turkey 89.1 89.0 88.1 118.2 100.0 101.3 104.2 98.4 97.9 97.9 Note: An increase in the index reflects an improvement in the competitiveness; a fall reflects a loss of competitiveness. Source: Calculated from the inverse of the real cross exchange rates for each country.
Economic Impact and Implications for Jordan of the Jordan-U.S. FTA Draft Report
AMIR Program xi
Jordan’s Export Compatibility with the U.S. Market Comparative advantage analysis is limited to static concepts since in reality countries like Jordan alter their situations by adopting new technologies either internally through research and development, or externally through FDI and the development of cross-border production facilities. We have therefore used an alternative approach adopted from business economics that explains cross-country differences based on the degree of concentration or so-called agglomeration of industries. By changing the manufacturing production base of countries, PTAs at the regional level and FTAs at the bilateral level can help to alter and accelerate the development process of countries. In the context of the U.S.-Jordan FTA, the central indicator of Jordan’s ability to shift its comparative advantage is the degree of trade compatibility between its export structure and that of the United States. Having established compatibility of traded products, we can then invoke performance indicators to reveal the extent to which firms compete effectively in world and regional market. Success in export markets – measured by rapidly expanding exports and rising market shares – indicates the extent to which an economy is willing and able to achieve global integration and alter its comparative advantage in the global marketplace. We have examined Jordan’s trade compatibility with the United States from the point of view of its exports, and use a set of performance indicators to identify those products that could benefit from the U.S.-Jordan FTA. In particular, we used the following criteria to select the products with growth potential in the US market: (a) the degree of trade compatibility between Jordan and the United States, (b) Jordan’s recent export growth record, and (c) the trend growth rate of Jordan’s product market share. The analysis of trade compatibility and export performance concentrates on the following types of products: (1) domestic exports of Jordan (excludes re-exports); (2) product aggregation at the 4-digit HS level (disaggregation at the HS 6-digit level yielded excessively high year-to-year variations and therefore poor trend performance indicators); and (3) data analysis based on the period 1994-99, with the product selection procedure based on 1997-99 data. Jordan’s exports were divided into the following four types of product exports: Large traditional product domestic exports, defined as those products that in 1999 represented at least JD5 million (there were 41 products in this range); medium-size domestic exports, whose product export value represented between JD1 million and JD5 million (53 products in this range); small-size domestic exports of between JD500,000 and JD1 million (44 products in this range); newly emerging domestic exports of between JD250,000 and JD500,000 (38 products in this range). Using these value ranges, the total number of products in the sample consisted of 176 products out of a total of 613 products.
The trade compatibility index measures the degree of compatibility between Jordan’s exported products and those products imported by the United States. The index approaches zero when Jordan
Table S2 Indices of Trade Compatibility Jordan Exports Index
Large-Size 0.33
Medium-Size 0.42
Small-Size 0.34
Emerging Exports 0.63
Economic Impact and Implications for Jordan of the Jordan-U.S. FTA Draft Report
AMIR Program xii
exports none of what the United States imports, and it approaches unity when the export share of a product of Jordan is identical to the import share of that product by the United States. Overall, the unweighted average of the four product categories for Jordan’s exports and U.S. imports equals 0.43, which lies between the index of trade between Latin American countries and that of trade between the developed countries (Table S2). Within these four categories, it is the emerging export products of Jordan that have the highest degree of trade compatibility with the United States. This category includes a broad set of products that ranges from Dead Sea cosmetics to batteries, orthopedic appliances, blankets and travel rugs, and machinery for sorting and screening mineral substances. Jordan’s traditional exports are generally less compatible with U.S. foreign needs, but at the product level there are a number of products that are compatible with U.S. import requirements: apparel and clothing accessories, aluminum bars and rods, animal feed, and insecticides. There are also a large number of products that are highly compatible with U.S. import requirements among the small and medium size exports of Jordan: olive oil, luggage, pharmaceuticals, household appliances, ceramic sinks and wash basins, paints and varnishes, articles of jewelry, tarpaulins and awnings, machinery for plant or laboratory equipment, tableware and kitchenware, electric accumulators, fruit and vegetable juices, chocolate and antibiotics.
Potential FTA Impact on Jordan’s Exports
Jordan’s ability to affect its market position based on the competitiveness of its products in the U.S. market has been measured by the trend growth rate of product exports and the ratio of product exports relative to U.S. imports of those products. The competitiveness of firms and industries in the world market and in that of the U.S. market in particular is reflected in high rates of export growth and rising market shares. Following the approach used by the World Bank, the export performance of Jordan has been classified into the following four categories: (1) rising stars, i.e., products in which Jordan has a rising market share and U.S. imports are expanding; (2) falling stars, i.e., products in which Jordan has a rising market share but U.S. imports are contracting; (3) missed opportunities, i.e., products in which Jordan has a falling market share despite expanding U.S. imports; and (4) retreat, i.e., products in which Jordan’s market share is falling and U.S. imports are contracting.
The results of the analysis show that for Jordan the most desirable products are the rising stars and missed opportunity products, and most of Jordan’s exports in our sample fall within these two categories. These are the nearly 100 Jordanian products whose market shares have been rising at the same time that U.S. imports have been expanding (i.e., the rising stars), or those products whose market shares have been falling despite expanding U.S. imports (i.e., the missed opportunities). Of these products, none have tariffs in the United States that exceed 20 percent. Thirteen products have U.S. tariffs in the 10-20 percent range; 18 products have tariffs in the 5-10 percent range; 42 products have tariffs under 5 percent; and 21 products have no tariffs. We have calculated the hypothetical impact on US$100,000 worth of exports from Jordan to the US market for each of the 94 products that are either rising stars or have
Economic Impact and Implications for Jordan of the Jordan-U.S. FTA Draft Report
AMIR Program xiii
experienced missed opportunities in recent years. As expected, the largest gains would accrue to those products that currently face relatively high tariffs. The gain in export revenue from these products currently facing tariffs of 10 to 20 percent ranges from 3 to 5 percent a year over the 5-year period of tariff reductions, and it averages 3.7 percent a year for the increased export value of all of these products during that period. For those products currently facing tariffs in the range of 5 to 10 percent, the export revenue gain would equal 2 to 3.5 percent a year over a four year period, and average 2.5 percent a year for their combined value during that period. Finally for those products currently facing tariffs in the 0 to 5 percent range, the annual gain in revenue would range between 0.1 to 3.6 percent over a two-year period. Given the timeline of the tariff reduction schedule, export revenue changes from tariffs in the 10 to 20 percent range are likely to be more beneficial to Jordan than if confronted with tariffs in excess of 20 percent in any of the 94 products. Sensitivity analysis on the selected products showed that the net present value of the potential flow of future revenue from the FTA would be higher for the medium-to-low tariff products having a shorter implementation period than those products with high-tariffs having a longer implementation period. For example, the estimated net present value of the additional revenue for Jordanian cheese and curd exports to the United States under the existing 19 percent tariff was nearly 20 percent higher than for a hypothetical export facing a 25 percent tariff in the U.S. market. The fact that the FTA will eliminate tariffs on a relatively fast track for the types of products exported by Jordan will therefore be more beneficial to exporters than if they faced high tariffs in the United States. Rules of Origin Jordan’s exports to the U.S. market under the FTA are subject to rules of origin that require that the sum of the cost or value of the materials produced in Jordan plus their direct processing costs be no less than 35 percent of the value of the product exported to the United States. The Industrial Development Department of the Ministry of Industry and Trade study on the rules of origin of the U.S.-Jordan FTA demonstrated that most Jordanian businesses qualify for preferential treatment. In the short run, these rules of origin can raise the cost of industries trying to meet the requirements by shifting to higher cost inputs from domestic sources. The FTA may therefore be trade diverting if there is a shift from lower to higher cost sources of supply, rather than having the desired effect of being trade creating by shift production from higher to lower cost sources of supply. In the long run the effects are highly dependent on the form of the structure of the industry and its market. In addition to these requirements, there are regulations affecting access to the U.S. market. These regulations cover product standards and testing and certification procedures in general, phytosanitary requirements for agricultural products, and U.S. Food and Drug Administration (USFDA) requirements for pharmaceutical products.
Economic Impact and Implications for Jordan of the Jordan-U.S. FTA Draft Report
AMIR Program xiv
Potential FTA Impact on Jordan’s Imports Jordan currently obtains about 10 percent of its total imports from the United States, and those imports are concentrated in a relatively few number of products. The top 36 products account for over two-thirds of total imports from the United States and, of these, 14 products account for one-half of all imports. The extent to which Jordanian businesses will be affected by the U.S.-Jordan FTA impact will depend on the magnitude of existing protection from foreign competition, as well as the effect that bilateral trade liberalization will have on the cost of their inputs. For Jordan about one-half of its major imports from the United States occurs in products in which it has significant two-way trade. This so-called intra-industry trade (IIT) is highest in cigarettes, vegetable fats and oils, tractor parts, refrigerators, sunflower seed and oil, dryers, furniture and orthopedic appliances. There is no two-way trade in wheat, aircrafts and their parts, rice, corn, chemical wood pulp, automated data processing machines and automobiles. Of those products having high IIT indices, vegetable fats and oil imports from the United States are not expected to increase significantly, since exports have been entering Jordan under U.S. Government export assistance program GSM 102/103 (U.S. credit Guarantee programs) and Public Law 480 (food aid). The United States International Trade Commission (USITC) has also identified specific U.S. exports that might increase their penetration of the Jordanian market as a result of the FTA. Of the other products examined by the USITC, little if any penetration into the Jordanian market is expected for crude petroleum, fertilizers, jewelry, phosphates and potash. Negligible penetration is expected in citrus fruit and juices, vegetables, live animals, nuts, and textile and apparel (mainly in the form of artificial filament and cotton and manmade fiber fabrics). To the extent that the U.S.-Jordan FTA eliminates tariffs on inputs and their final products, it will tend to favor more efficiently produced goods whether produced domestically or in the United States, and it will raise consumer welfare. Perhaps more importantly, it will liberate valuable resources from less productive sectors for use in Jordan’s true comparative advantage industries. Under these circumstances, it is useful to examine the magnitude of protection of industries and their value added under both existing levels of protection and bilateral free trade with the United States. The extent of this protection can be measured by the effective rate of protection (ERP). In contrast to the nominal rate of protection (NRP) that measures the extent of protection by the difference between the border price of foreign-made products and the price of domestic import-substitutes made by local producers, the ERP measures the increase in value-added of the protected industry over value added of that same industry measured in terms of border prices. Analysis of ERPs across industries can show how Jordan’s present tariff structure influences the production and the distribution of benefits and costs among the Jordanian industries and consumers, as well as the extent to which the U.S.-Jordan FTA is likely to shift the existing tariff-induced bias away from import substitution to export expansion and investment in the production of non-tradables. The analysis,
Economic Impact and Implications for Jordan of the Jordan-U.S. FTA Draft Report
AMIR Program xv
however, requires the application of technical coefficients of production derived from input-output (IO) tables to the total value of the tradable material inputs. Since an IO table for Jordan does not exist, we have limited the present analysis to an illustrative product (furniture) for which technical coefficients of production can be constructed from other available IO tables. The ERP calculations for Jordan’s wood furniture industry demonstrate the extent to which the industry will be susceptible to foreign competition when protection to the industry is eliminated. Although tariffs on the industry’s two major inputs, sawn wood and veneer wood and plywood, are zero, there are high tariffs on the more processed carpentry wood, paints and hardware, woven fabrics and textiles, and moderate tariffs on chemicals, tools, leather and oils. Overall, the trade-weighted average of these tariffs is over 5 percent for inputs. As a result, the estimated ERP for furniture is nearly 50 percent in Jordan, which is somewhat less than in the example where the industry was subject to a 30 percent tariff on the final good but there were no tariffs on inputs. Still, the industry in Jordan is heavily protected and it probably diverts resources away from the country’s true comparative advantage industries. Potential FTA Impact on Jordan’s Services Trade The service sector contributes over 70 percent of Jordan’s total output, measured by the gross domestic product (GDP). Within this sector, the leading industries are finance, insurance, real estate and business services, contributing over 20 percent of the country’s total output, and transport and communications, contributing 18 percent. The trade industry, which covers tourism, hotels and restaurants, contributes another 12 percent. Demand for all these services tends to be highly income-elastic since consumption of services such as tourism, education and health has expanded more rapidly than demand for manufacturing goods and agricultural products. While the share of services in Jordan’s foreign trade has also risen rapidly, its share relative to total trade has been smaller than in domestic production and employment. Overall, services trade contribute one-half of total receipts from goods and services, and account for one-third of total payments for goods and services. The services balance has been positive and growing, which has helped to offset the large merchandise trade deficit. Under the U.S.-Jordan FTA, negotiations have been facilitated by the mutual recognition agreements for trade liberalization in services under the General Agreement on Trade in Services (GATS). Unlike the Euro-Mediterranean Partnership agreement between the EU and Jordan that simply makes reference to the multilateral obligations of participating countries under the GATS, under the U.S.-Jordan FTA a broad range of services will be liberalized on the basis of the U.S. and Jordan’s existing commitments to the GATS. In the U.S. schedule there are relatively few exemptions on specific service sectors and, as a result, Jordan already enjoys near complete access to the U.S. services market. Jordan, however, has limited access under its GATS commitments in all of its service sectors. Of the sectors where Jordan has made GATS commitments, it has a total of 222
Economic Impact and Implications for Jordan of the Jordan-U.S. FTA Draft Report
AMIR Program xvi
exemptions across both horizontal commitments and sector-specific commitments for limitations on both market access and national treatment. In contrast, the United States has 93 exemptions in these areas and most of these are related to the temporary entry and stay of persons in the United States under its horizontal commitments. These exemptions are time-bound, lasting no longer than ten years after joining the WTO, and are subject to periodic review and negotiation in subsequent trade liberalizing rounds. Under the FTA, Jordan will expand its commitments to liberalize services trade with the United States by amending its laws and regulations over a three-year period. Under these conditions, there will be little distinction between international and domestic liberalization since external and internal market openings will parallel one another to ensure that persisting internal barriers do not contravene the potential benefits of more liberal access conditions. Since the FTA covers liberalization of all trade in services, the changes will open the Jordanian service industries to U.S. companies, especially in tourism, transport services, health and financial services – the largest service sectors, as well convention services, printing and publishing, courier services, audiovisual, education and environmental. The impact on Jordan’s economy is expected to be substantial. While the costs associated with great U.S. access to the Jordanian service sectors will be reflected in the services account of the balance of payments, there are more widespread benefits anticipated from improvements in the quantity of investment and the expertise required to up-grade and operate Jordan’s services sectors such as telecommunications. Moreover, early liberalization under the FTA will contribute substantially to the country's location attractiveness for new investment in modern services industries, and the globalisation of Jordan’s service sectors. In the United States, service imports are generally free of tariffs, quotas, and other common trade barriers. Import impediments instead take the form of prohibitions or restrictions on market access, which typically include licensing requirements and investment regulations, particularly in the transport, basic telecommunication and financial service industries. Fewer restraints are imposed on professional service industries such as the accountancy, legal, architecture, and engineering service industries. For Jordan at least four or five sectors may prove relevant: tourism, software development, transport and, possibly, health services. In these areas, Jordan may a have a strong interest in expanding its access to the U.S. market through the FTA. Summing Up There are three central findings. First, the FTA will open many opportunities of Jordan to expand its exports to the U.S. market. The greatest opportunities will occur in the emerging export products that have the highest degree of trade compatibility with the United States. These products include Dead Sea cosmetics, orthopedic appliances, rugs and machinery. Although Jordan’s traditional exports are somewhat less compatible with U.S. foreign needs, there are nevertheless opportunities in such products as apparel and clothing accessories, aluminum bars and rods, animal feed and insecticides. Among the small and medium size exports, there will be opportunities in such wide-ranging products
Economic Impact and Implications for Jordan of the Jordan-U.S. FTA Draft Report
AMIR Program xvii
as olive oil, luggage, pharmaceuticals, household appliances, ceramic sinks and wash basins, paints and varnishes, jewelry, awnings, kitchenware, fruit and vegetable juices, chocolate and antibiotics. Jordan’s ability to exploit these opportunities will depend on several key factors determining its international competitiveness. Its macro dynamics are favorable to investment, but there are mixed reviews on its factor and infrastructure costs, and recent movements in the real exchange rate has undermined Jordan’s competitiveness relative to nearly all other Middle Eastern countries. Second, U.S. exports to Jordan are expected to grow substantially as a result of the FTA. Since there is a large amount of two-way trade in many traded products, the elimination of trade barriers between Jordan and the United States will favor the most efficient producers. In Jordan, inefficient industries with particularly high levels of protection will be most vulnerable, and the FTA will liberate valuable resources from less productive sectors for use in Jordan’s true comparative advantage industries. These industries can be identified from the two-way trade calculations provided by this study, along with estimates of each industry’s effective rate of protection. Our estimate of the ERP for the furniture demonstrates that the level of protection in this one industry is larger than simple nominal rates of protection would reveal. This type of information would be valuable to both the private and public sectors in adjusting to the FTA. Third, expectations about the FTA effects on services trade are supported by the findings of this study. Calculations of the proportion of market access constraints on individual service sectors show that Jordan’s sectors are considerable more protected. The FTA will therefore open more new opportunities for U.S. businesses in Jordan than for Jordanian businesses in the United States. While these service inflows will lower Jordan’s current surplus in the services account, they will bring with them much needed FDI associated technological transfers and provide other types of externalities to the Jordanian economy. Recognition of these changes will help Jordanian businesses adjust and exploit these new opportunities under the FTA. Finally, the present study has pointed to a number of areas that should be examined in greater detail by the Jordanian business community: Jordan’s International Competitiveness – Comparative factor and infrastructure cost data for Jordan and other Middle East countries are essential for gauging the competitiveness of industries in the U.S. and global markets. While the limited timeframe of the present study hampered data collection, such data would be useful to both the public sector in formulating policies and the private sector in determining investment opportunities. Moreover, it would help to identify likely areas of FDI inflows into the country. FTA Impact on Jordan’s Effective Rates of Protection – In order to gauge the impact of the FTA on Jordan’s import-competing industries, the analysis of effective rates of protection conducted in this study for furniture could be extended to other Jordanian industries. It is possible to derive the technical coefficients of production from selective interviews with businesses in the leading industries that are likely to compete with U.S.
Economic Impact and Implications for Jordan of the Jordan-U.S. FTA Draft Report
AMIR Program xviii
imports and benchmarking the results with other IO tables. Future work in this area would be valuable to Jordanian businesses in gauging their competitiveness. Export Revenue Gains from the FTA and Output and Employment Effects – The export revenue gains to Jordan from the FTA calculated in the present study are intended to be primarily illustrative. Further detailed estimates of the potential revenue gains using statistically estimated price elasticities would provide more realistic estimates of possible revenue gains, as would economy-wide estimates of the dynamic effects of the FTA on output and employment of industries. FTA Rules of Origin and Their Trade-Creating and Trade-Diverting Effects – In the short run, the rules of origin can raise the cost of industries trying to meet the requirements by shifting to higher cost inputs from domestic sources. The FTA may therefore be trade diverting if there is a shift from lower to higher cost sources of supply, rather than having the desired effect of being trade creating by shift production from higher to lower cost sources of supply. In the long run, the effects are highly dependent on the form of the structure of the industry and its market. Future work should examine these effects at the industry level. Regulatory Constraints in U.S. Market for Jordanian Service Exports – Although services imports into the United States are generally free of tariffs, quotas, and other common trade barriers, import impediments in the form of prohibitions or restrictions on market access will inhibit Jordan’s ability to access that market. The impediments typically take the form of licensing requirements and investment regulations at the federal, state and local levels. Jordan’s interest in tourism, software development, transport and health services suggests the need for more detailed analysis of existing impediments in the U.S. market for these industries.
Economic Impact and Implications for Jordan of the Jordan-U.S. FTA Draft Report
AMIR Program 1
Chapter 1: Introduction
A. Study Objective This document represents the draft final report of the study conducted by the Business Association Initiative (BAI) component of the AMIR program to analyze the economic impact of the U.S.–Jordan Free Trade Agreement (FTA) on Jordanian business sectors. It assesses the economic impact on trade in goods and services of the Hashemite Kingdom of Jordan (Jordan) from the U.S.–Jordan FTA, with a view to addressing the following specific areas:
(1) The comparative advantage of Jordan in exports of goods and services to the U.S. market, relative to other countries in the Middle East region;
(2) The effect of FTA-related tariff loads, rules of origin, and other market access
conditions on Jordanian exporting companies, compared with other U.S. market access agreements and mechanisms; and
(3) The impact of the FTA on the bilateral trade in services between Jordan and the
United States. The study was conducted in Jordan during January–February 2001 and is based on fieldwork that included extensive interviews with private and public sector officials in the country (see Annex C for a list of meetings conducted). It also draws on extensive literature of the current wave of preferential trade arrangements, particularly those dealing with the impact of free trade agreements on participating countries.2
B. Approach and Organization of the Study ♦ Chapter 1 describes the objective and coverage of the study. ♦ Chapter 2 reviews Jordan’s existing multilateral, regional, and bilateral trade
agreements in the context of the U.S.–Jordan FTA. ♦ Chapter 3 describes the structure and geographic composition of Jordanian trade, and
the country’s commodity trade with the United States.
2 For a recent review of recent theoretical and empirical analysis of free trade agreements and other preferential trade arrangements, see Panagariya (2000).
Economic Impact and Implications for Jordan of the Jordan-U.S. FTA Draft Report
AMIR Program 2
♦ Chapter 4 examines the tariff schedules of Jordan and United States, and Jordan’s preferential rates in its Qualifying Industrial Zones, and the United States’ preferential tariffs.
♦ Chapter 5 analyzes the comparative advantage of Jordan and other Middle Eastern
countries, and assesses key factors affecting Jordan’s overall competitiveness in terms of macroeconomic conditions, factor input costs, financial costs, and trade policies.
♦ Chapter 6 identifies high-growth Jordanian exports and their U.S. import growth
rates, the U.S. import demand for selected products of Jordan, the anticipated effect of FTA-related tariff liberalization on Jordanian exports, and the rules of origin and other U.S. market regulations likely to affect Jordan’s penetration of the U.S. market.
♦ Chapter 7 examines the likely effect of the FTA on Jordan’s exports of services. ♦ Chapter 8 assesses the impact of the FTA on import competing industries by
identifying trade complementarities between Jordan and the United States, and measuring the effective rates of protection on those products.
♦ Annex A contains information on the methodology used in the empirical analysis. ♦ Annex B presents information on the U.S. and Jordanian commitments under both the
FTA and the GATS. ♦ Annex C lists the meetings conducted. ♦ Annex D provides the references.
Economic Impact and Implications for Jordan of the Jordan-U.S. FTA Draft Report
AMIR Program 3
Chapter 2: Trade Agreements
A. The U.S.–Jordan Free Trade Agreement The U.S.-Jordan Free Trade Agreement (FTA), signed on October 24, 2000, will eliminate duties and commercial barriers to bilateral trade in goods and services between Jordan and the United States. The FTA also includes separate sets of substantive provisions addressing trade and the environment, trade and labor, and electronic commerce. Other provisions address intellectual property rights protection, balance of payments, rules of origin, safeguards and procedural matters such as consultations and dispute settlement. Under the FTA, tariffs will be eliminated on virtually all trade between the two countries within 10 years. Tariff reductions will occur in four stages: (i) current tariffs of less than 5 percent will be phased out in two years, (ii) those that are now between and 5 and 10 percent will be eliminated in four years, (iii) those between 10 and 20 percent will be gone in five years, and (iv) those that are now more than 20 percent will be eliminated in 10 years. Although there is no negative list, special arrangements exist for tariff reductions on sensitive products such as apples, poultry, tobacco and some tobacco categories, cars and alcohol. In services, Jordan already enjoys near complete access to the U.S. market, whereas it maintains a number of restrictions in its own service market. Jordan’s commitments under the GATS cover the majority of services sectors: from a total of 155 sub-sectors, classified within 12 sectors, Jordan made commitments in 144 sub-sectors. However, Jordan maintains a number of exemptions in all service sectors. Under the FTA, specific liberalization has been achieved in many key sectors in which Jordan had made commitments, and new ones were introduced in the rail and internal waterways transport sub-sectors. Electronic commerce is explicitly covered in the FTA. Jordan and the United States committed to promoting a liberalized trade environment for electronic commerce that should encourage investment in new technologies and stimulate the innovative uses of networks to deliver products and services. Both countries agreed to avoid imposing customs duties on electronic transmissions, imposing unnecessary barriers to market access for digitized products, and impeding the ability to deliver services through electronic means. The U.S.-Jordan FTA adopts the U.S.-Israel FTA rules of origin, whereby duty free access to the U.S. market is allowed when the value of the product is at least 35 percent, of which up to 15 percent can be from the United States. Within six months of the entry into force of the FTA, Jordan and the United States will enter into discussions on the extent to which the cost or value of materials that are products of a territory neighboring
Economic Impact and Implications for Jordan of the Jordan-U.S. FTA Draft Report
AMIR Program 4
Jordan may be counted in the appraised value of a product when determining the 35 percent content requirement. The FTA provides protections for trademarks, copyrights, and patents, and specifically mentions the protection of software and pharmaceuticals, two categories of products whose copyrights and patents are especially prone to violation. Among other things, Jordan has undertaken to ratify and implement the World Intellectual Property Organization (WIPO) Copyright Treaty, and WIPO Performances and Phonograms Treaty within two years.3 These treaties establish several critical elements for the protection of copyrighted works in a digital network environment, including creator’s exclusive right to make their creative work available online.4 The FTA includes in the body of the agreement key provisions that reconfirm that free trade and the protection of the rights of workers can go hand in hand. These provisions reaffirm the parties' support for the core labor standards adopted in the 1998 International Labor Organization's Declaration on Fundamental Principles and Rights at Work. The countries also reaffirmed their belief that is inappropriate to lower standards to encourage trade, and agreed in principle to strive to improve their labor standards. Each side agreed to enforce its own existing labor laws and to settle disagreements on enforcement of these laws through a dispute settlement process. The FTA also includes a separate set of substantive provisions on trade and the environment, and trade and labor. Specifically, each country agreed to avoid relaxing environmental laws to encourage trade. The United States and Jordan affirmed their belief in the principle of sustainable development, and agreed to strive to maintain high levels of environmental protection and to improve their environmental laws. Each side also agreed to a provision on effective enforcement of its environmental laws, and to settle disagreements on enforcement of these laws through a dispute settlement process. Both countries are conducting environmental reviews, which were extremely useful in developing some of the provisions of the agreement. The FTA contains safeguard measures to ensure that if the implementation of the agreement leads to “a substantial cause of serious injury, or threat thereof” to a domestic industry, either country may temporarily suspend further tariff reductions on the affected goods. If either country decides to enact a safeguard measure, its duration cannot exceed 4 years or the 10-year transitional period, and no measure shall be maintained “except to the extent and for such time as may be necessary to prevent or remedy serious injury and to facilitate adjustment.” The FTA also recognizes the special challenges faced by “infant industries” during a period of trade liberalization and that therefore neither country should create obstacles to “infant industries” that seek the imposition of safeguard measures.
3 For legal text and other IPR issues, see http://www.wipo.org 4 From the U.S.-Jordan FTA Fact Sheet at http://www.usembassy-amman.org
Economic Impact and Implications for Jordan of the Jordan-U.S. FTA Draft Report
AMIR Program 5
Finally, the FTA provides for dispute settlement panels to issue legal interpretations of the FTA, but only if the countries have first consulted and failed to resolve the dispute. The process includes strong provisions on transparency. As in the Israel FTA, the report of such dispute settlement panels is non-binding, and the affected country is authorized to take appropriate measures if the parties are still unable to resolve a dispute once a panel has issued its recommendations. B. WTO Accession and Commitments Jordan became a member of the WTO in April 2000. In addition to liberalizing trade in goods and services, Jordan committed itself to comply with the WTO Multilateral Agreements on Trade Related Aspects of Intellectual Property Rights (TRIPS), Customs Valuation, Import Licensing Procedures, Technical Barriers to Trade, and Sanitary and Phytosanitary Measures.5 Tariffs are to be bound at a 20 percent ceiling by the year 2010, with the exception of certain items that are to be bound at 35 percent. Jordan’s tariff schedule has six ad valorem rates: 0 percent, 5 percent, 10 percent, 20 percent, 30 percent and 35 percent. Tariff reductions will be implemented in March of every year. In services, Jordan’s commitments covered the majority of services sectors. From a total of 155 sub-sectors, classified within 12 sectors, Jordan made commitments in 128 sub-sectors. Some of the key elements of Jordan’s accession commitments are as follows: • Jordan will gradually remove price and profitability control measures placed on some
commodities with a view for eventual liberalization of all prices at the retail level. • Provisions of international treaties or agreements will prevail if contradictions with
Jordanian laws arise. • Jordan will levy no duties and charges on imports other than ordinary customs duties
and fees and charges for services rendered. • Exemptions on customs duties for certain imports by the ten state trading companies
will not be renewed once they expire. • Jordan will not apply quantitative restrictions on imports. • The engagement of a pre-shipment inspection service provider meeting the
requirements of the Agreement on Pre-shipment Inspection would be ensured. • Jordan will eliminate export subsidies by the end of 2002.
5 Jordan is currently negotiating commitments in the Government Procurement Agreement.
Economic Impact and Implications for Jordan of the Jordan-U.S. FTA Draft Report
AMIR Program 6
• Jordan will not apply any anti-dumping, countervailing or safeguard measures to imports from WTO Members until it has notified and implemented appropriate laws in conformity with the provisions of the WTO Agreements.
• Free zones or free economic zones in Jordan will be fully subject to the coverage of the
commitments taken in the Protocol of Accession, and Jordan will enforce its WTO obligations in those zones, including those commitments derived from the TRIPS Agreement.
C. The Euro-Mediterranean Association Agreement The Euro-Mediterranean Association Agreement aims to create a new climate for economic and cultural relations, in particular for the development of trade, investment and economic and technological cooperation. Under this agreement, free trade will be achieved in 12 years. The Agreement also covers services, social and cultural affairs, and financial co-operation. All industrial products and natural resources originating in Jordan would enter duty free in the European Union (EU) immediately, while EU industrial products benefit from annual duty reductions over the 12-year implementation period. Under this Association Agreement with the European Union (AAEU), products originating in the EU are excluded from preferential treatment, and specific import procedures and safeguards are made for trade in agricultural products. About 65 percent of the goods imported from the EU will receive preferential treatment, excluding those products in the negative list: cigarettes, used cars, tomato paste, used clothes, clothes and shoes, furniture and carpets. In services there is no schedule of specific commitments beyond those made under the WTO commitments. D. Other Regional and Bilateral Agreements Jordan has concluded bilateral trade agreements with many countries (see Box 2.1). These agreements are generally based on the MFN principle, although some agreements with Arab countries included trade preferences. Preferential treatment was accorded to specific goods included in protocols annexed to these agreements. However, Jordan has terminated all trade protocols, except that with Lebanon. The trade agreement with Iraq essentially provides Iraqi oil in exchange for Jordanian exports. Jordan had concluded bilateral investment promotion and protection agreements with Germany, France, Turkey, Switzerland, Malaysia, Romania, United Kingdom, Tunisia, Yemen, Egypt, Italy, Algeria, Indonesia, the United States, the Czech Republic, Poland, the Netherlands and Morocco.
Jordan is a member of the Arab Common Market Agreement (ACM) together with Egypt, Iraq, Mauritania, Libya, Syria and Yemen. Jordan also signed the Arab Free Trade Area Agreement (AFTA) in January 1998. Tariffs between member countries are to be eliminated over a ten-year period. Under this agreement, Jordan will eliminate import duties on approximately 94 per cent of its tariff lines. The AFTA does not include
Economic Impact and Implications for Jordan of the Jordan-U.S. FTA Draft Report
AMIR Program 7
provisions on the application of non-tariff measures, but the implementation program prohibits the use of non-tariff measures such as quantitative restrictions and import licensing for non-exempt and non-prohibited products.
Box 2.1 Preferential Treatment Granted Under Jordan's Bilateral Agreements
Bilateral agreement with: Preferences Granted
Bahrain Free Trade Agreement. Algeria Free Trade Agreement. Egypt Free trade area by 2005. Customs duties and other equivalent
taxes are to be reduced by 10 per cent annually. Some 48 products, representing 1,450 tariff lines at the six-digit level, are temporarily excluded from the agreement. Agricultural products also will benefit from the tariff reductions, except for certain fruits and vegetables, which are subject to seasonal restrictions.
Israel Ten per cent tariff reduction for 66 products originating in Israel.
Kuwait
Free movement for agricultural and livestock products. Customs duties and equivalent taxes reduced by 20 per cent annually for specific industrial products
Libya Free movement for all products originating in both countries. Oman Free movement for agricultural, livestock and fish products. Palestinian Authority
Duty free access for 60 products originating in the Palestinian Territories.
Qatar
Mutual exemptions from customs duties for agricultural products and natural resources. Lists of duty free industrial products to be established.
Saudi Arabia Duty free treatment for 166 products.
Sudan Customs duties exemptions for agricultural, livestock and industrial products.
Syria Customs duties exemptions for agricultural, natural resources and industrial products.
Economic Impact and Implications for Jordan of the Jordan-U.S. FTA Draft Report
AMIR Program 8
Chapter 3: Structure of Trade
A. Trade Structure and Flows Jordan’s major exports are in the form of natural resource based products. Table 3.1 lists the major export products by Harmonized System (HS) category in 1999. Ranked in terms of export value to the world, chemical products (HS VI) and mineral products (HS V) together account for nearly one-half of the country’s export revenue. Machinery and electrical equipment (HS XVI), vegetable products (HS II), transport equipment (HS XVII), textile and textile products (HS 11) each contribute between 5 and 10 percent of the total value of exports. Other important export categories that contributed between 2 and 5 percent of the total export value are animal and vegetable fats and oils (HS III), base metals and their articles (HS XV), plastics (HS VII), and foodstuff preparations (HS IV). We will examine these exports in considerably more detail in Chapter 6.
Table 3.1 Jordan’s Structure of Trade with World and United States by HS Chapter, 1999 (Thousands of US dollars)
HS
Exports Imports Balance
Description World U.S.A. World U.S.A. World U.S.A.
I Live animals; animal products 54,437 355 145,717 1,775 -91,280 -1,421
II Vegetable products 121,494 110 380,071 88,585 -258,577 -88,476
III Animal or vegetable fats and oils 69,594 267 63,908 18,670 5,685 -18,404
IV Prepared foodstuffs; beverages, spirits and vinegar; tobacco 51,083 994 223,555 25,310 -172,472 -24,316
V Mineral products 207,272 299 487,319 1,318 -280,046 -1,019
VI Products of the chemical or allied industries 677,577 1,071 381,417 23,250 296,160 -22,179
VII Plastics and articles thereof; rubber and articles thereof 56,434 201 155,440 4,540 -99,006 -4,339
VIII Raw hides and skins, leather, fur skins and articles thereof 7,903 2,568 2,532 72 5,371 2,496
IX Wood and articles of wood 2,054 7 38,357 1,296 -36,304 -1,290
X Pulp of wood or of other fibrous cellulosic material 63,195 15 92,507 10,850 -29,312 -10,835
XI Textiles and textile articles 103,176 3,078 197,364 8,322 -94,188 -5,244
XII Footwear, headgear, umbrellas 6,609 11 11,833 164 -5,224 -153
XIII Articles of stone, plaster, cement 24,688 57 49,477 1,120 -24,788 -1,064
XIV Natural or cultured pearls, precious or semi-precious stones 7,656 3,621 28,940 749 -21,284 2,871
XV Base metals and articles of base metals 61,193 1,352 265,819 9,616 -204,625 -8,264
XVI Machinery and mechanical appliances; electrical equipment 167,976 1,582 493,734 68,406 -325,758 -66,824
XVII Vehicles, aircraft, vessels and other transport equipment 105,633 25,276 517,320 73,411 -411,687 -48,135
XVIII Optical, precision, medical instruments and apparatus 24,192 737 89,595 15,065 -65,403 -14,328
XX Miscellaneous manufactured articles 17,269 266 51,513 5,131 -34,244 -4,864
XXI Works of art, collectors' pieces and antiques 632 50 392 13 240 37
Unspecified 1,691 22 39,985 8,564 -38,294 -8,541
Total 1,831,759 41,936 3,716,794 366,227 -1,885,035 -324,291 Source: Department of Statistics.
Economic Impact and Implications for Jordan of the Jordan-U.S. FTA Draft Report
AMIR Program 9
The major export markets for these exports are the Middle East and Asian regions, particularly India, Saudi Arabia, Iraq and the United Arab Emirates (Table 3.2). The North American and European Union markets each absorb only 3 percent of Jordan’s exports. In contrast, Jordan’s major foreign suppliers are the European Union (31 percent of the total), Asia (24 percent), and other Arab countries (22 percent). The United States provides about 10 percent of Jordan’s imports. Jordan’s imports are heavily concentrated in transportation equipment (HS XVII), machinery and electrical equipment (HS XVI), and mineral products (HS V) that were mainly in the form of iron and steel. Together these three categories account for 40 percent of total import expenditures. Other important import categories are chemical and vegetable products (HS VI and 2 respectively), which each represent 10 percent of total imports, and base metals (HS XV), prepared foodstuffs and beverages (HS IV), textile and textile articles (HS XI) and plastic and rubber articles (HS VII). Overall, the magnitude of these imports is twice as large as those of exports. Despite the importance of Jordan’s major export categories, imports of mineral products are 2.4 times larger than exports, that of machinery and electrical equipment and vegetable products are both 3 times larger than exports, and imports of transport equipment are 5 times larger than exports. B. Trade with the United States
Jordan’s structure of trade with the United States is considerably different from that with the rest of the world, which reflects each country’s comparative advantage in the other’s market (Table 3.3). Jordan’s major export category to the U.S. market is transport equipment (60 percent of the total), which mainly reflects the re-export of aircraft and parts. Articles of jewelry plated with gold make up the second largest export category (9 percent of the total), followed by articles of apparel and carpets (7 percent of the total) in the third largest category. The other significant export categories are machinery and electrical appliances (4 percent of the total, mainly in the form of air conditioners), base metal articles (3 percent, mainly in the form of aluminum waste and scrap), chemical products (3 percent, mainly cosmetics and pharmaceuticals), prepared foodstuffs (3 percent, mainly tobacco and food preparations), and optical equipment (2 percent). On the import side, cereals and wheat in particular represent the largest import of Jordan, representing nearly one-fourth of total imports from the United States. Two other major categories are transport equipment (HS XVII), mainly in the form of aircraft parts, and machinery and electrical equipment (HS XVI), primarily in the form of machinery parts and data processing equipment. Other significant, albeit smaller, categories are prepared foods and tobacco (HS IV), chemical products (HS VI), vegetable fats and oils (HS III), and optical equipment (HS XVIII).
Table 3.2 Jordan’s Geographic Distribution of Exports, 2000 Percent
Middle East 40.6%
Asia 35.4%
North America 3.1%
European Union 3.1%
Other Europe 0.4%
South America 0.4%
Others 17.1%
Total 100.0% Source: Department of Statistics.
Economic Impact and Implications for Jordan of the Jordan-U.S. FTA Draft Report
AMR Program 10
Table 3.3 Jordan's Major Merchandise Exports to the United States, 1999 (Thousands US dollars and percent)
Domestic Exports Re-Exports Total Exports
HS Description Value Percent Value Percent Value Percent Main Products
I Live animals; animal products - 0.0% 355 1.2% 355 0.8% Frozen turkey and fish
II Vegetable products 102 0.8% 7 0.0% 110 0.3% Thyme and bay leaves
III Animal or vegetable fats and oils 267 2.0% - 0.0% 267 0.6% Vegetable fats from hydrogenated palm oil
IV Prepared foodstuffs; beverages, spirits and vinegar; tobacco 388 2.9% 606 2.1% 994 2.4% Tobacco and food preparations
V Mineral products 299 2.3% - 0.0% 299 0.7% Sodium chloride and marble and travertine
VI Products of the chemical or allied industries 604 4.6% 467 1.6% 1,071 2.6% Cosmetics, pharmaceuticals and organic chemicals
VII Plastics and articles thereof; rubber and articles thereof 196 1.5% 5 0.0% 201 0.5% Plastic packaging
VIII Raw hides and skins, leather, fur skins and articles thereof 2,549 19.4% 19 0.1% 2,568 6.1% Suitcases and handbags
IX Wood and articles of wood 7 0.0% - 0.0% 7 0.0% Wood frames
X Pulp of wood or of other fibrous cellulosic material 15 0.1% - 0.0% 15 0.0% Paper and printed books
XI Textiles and textile articles 3,069 23.4% 8 0.0% 3,078 7.3% Articles of apparel and carpets
XXI Works of art, collectors' pieces and antiques 50 0.4% - 0.0% 50 0.1% Works of art
Unspecified 6 0.0% 16 0.1% 22 0.1%
Total 13,143 100.0% 28,792 100.0% 41,936 100.0% Source: Department of Statistics.
Economic Impact and Implications for Jordan of the Jordan-U.S. FTA Draft Report
AMIR Program 11
Chapter 4: Tariff Structures
A. Jordan’s Tariff Schedule Jordan’s tariff schedule is fairly transparent at the Harmonized System (HS) section level with relatively few tariff rates, but it has widely varying rates within each product category (Table 4.1). The schedule has an average most favored nation (MFN) rate of 16 percent. A minimum tariff of 0 percent is applied in 17 of the 21 HS sections and a maximum tariff of 30 percent is applied in all by one of the HS sections. The tariff peak of 180 percent is applied to certain liquor and tobacco products (HS Section 4). Other imports that are taxed at higher than average rates include footwear (HS Section 12), arts and antiques (HS Section 21), miscellaneous manufactured articles (HS Section 20) and arms and munitions (HS Section 19).
Table 4.1 Jordan’s 2001 MFN Applied Tariffs Number of
Overall 6,411 0% 180% 16% a/ The unweighted estimated average of the complete Most Favored Nation (MFN) applied tariff (viz., includes ad valorem, specific and other portions of MFN tariff). Source: Customs Authority.
Economic Impact and Implications for Jordan of the Jordan-U.S. FTA Draft Report
AMIR Program 12
B. Jordan’s Free Zones
1. Traditional Free Zones
The concept of free zones was initiated in 1973 in Jordan under the Aqaba Port Commercial Free Zone.6 Success of the zone was hindered by competition in the Jebel Ali Free Zone in Dubai, which allowed complete foreign ownership of zone-based companies. Ten years later Jordan launched the Zarqa Commercial and Industrial Free Zone, which despite the fact that it is land-locked without access to sea ports or railways, has become the most popular free zone investment site in Jordan for companies interested in exporting to Iraq. Other zones include the Sahab Industrial Estate Free Zone, Queen Alia International Airport Free Zone. Plans are currently underway to convert Aqaba into a Special Economic Zone (SEZ), which would streamline bureaucracy, lower taxes and facilitate customs handling. In the SEZ the private sector would be involved in the development of transportation and communication services, tourism, and high value-added activities. Both Jordanian and foreign investors are permitted to invest in trade, services and industrial projects in free zones. Industrial projects must have the following characteristics:
(a) New industries depending on advanced technology, (b) Industries requiring raw material and/or locally manufactured parts which are
locally available, (c) Industries that complement domestic industries, (d) Industries that enhance labor skills and promote technical know-how, and (e) Industries providing consumer goods and that contribute to reducing market
dependency on imported goods. The benefits provided to companies operating in these designated free zones are substantial, as exemplified by the following incentive list (U.S. Department of State, 2001):
6As summarized by Atlas Investment Group (2000a), several types of free zones exist throughout the world. The ‘first-generation’ free zones are made up of commercial, industrial and cargo free zones. Commercial zones house retailers with heavily taxed products that store materials in the zone to avoid paying duties before dispatching products into the country. Industrial zones are mainly established for manufacturing companies that rely on export markets and want to avoid duties and taxes under their products are ready to enter the country. Cargo free zones are usually established in air and sea ports and are heavily used by re-exporters. The ‘second-generation’ free zones include media, information technology parks and qualifying industrial zones. Media free zones is a new concept that offers censorship on and regulation-free press, radio and television broadcasting. Information technology parks provide hi-tech communication infrastructure aimed at computer-based industries. Lastly, qualifying industrial zones permit qualifying exports to the United States tax free.
Economic Impact and Implications for Jordan of the Jordan-U.S. FTA Draft Report
AMIR Program 13
(a) Profits are exempt from income and social services taxes for a period of 12 years, with the exception of profits generated from storage services that involve goods released to the domestic market;
(b) Salaries and allowances payable to non- Jordanian employees are exempt from income and social services taxes;
(c) Goods imported to and/or exported from free zones are exempt from import taxes and custom duties, with the exception of goods released to the domestic market;
(d) Industrial goods manufactured in free zones enjoy partial custom duties exemption once released to the domestic market, depending on the proportion of the value of local inputs and locally incurred production costs;
(e) Construction projects are exempt from licensing fees and urban and property taxes; and
(f) Free transfer of capital invested in free zone, including profits.
2. Qualifying Industrial Zones
Qualifying Industrial Zones (QIZs) came about as a result of the attempt to revive the free zone industry in Jordan, which had become saturated along with those in other countries of Middle East region. Unlike export processing zones (EPZs), whose main objective is usually to promote non-traditional exports, or the other types of traditional free zones mentioned above, the QIZ program was established to stimulate economic cooperation between countries in the Middle East.
QIZs were formalized by the United States-Israel Free Trade Area Implementation Act (IFTA) of 1985, which allows articles to be imported duty free into the United States that were produced in the West Bank, Gaza Strip and QIZs between Israel and Jordan and between Israel and Egypt. In 1998 Israel and Jordan established the Irbid Industrial Park as the first QIZ, and in 1999 the United States designated as additional QIZs the Al-Kerak Industrial Estate, the Al-Dulayl Industrial Park, the Al-Tajamouat Industrial City and the Gateway Industrial Park. In late 2000 the Mushatta International Complex, the El Zay Duty Free Area and the Al Qastal Industrial Zone were included in the list of Israel-Jordan QIZs. The Irbid zone, formally known as the al-Hassan Industrial Estate, is currently the largest of the QIZs in terms of number of businesses. It houses 82 factories, most of which are
Box 4.1 Options for Meeting Value-Added Requirement in QIZs Option 1: Of the 35% value added, at least: • 11.7% (or one-third) must come from a Jordan QIZ • 8% must come from Israel (7% for high tech goods) • Balance of 15.3% (or 16.3% if high tech goods are
involved) must be filled by content from a Jordan QIZ, Israel, USA or West Bank/Gaza.
Option 2: Jordanian and Israel manufacturers must each contribute at least 20% of the total production cost of manufacturing the QIZ good. Production costs may include materials, wages and salaries, design, R&D, depreciation of capital investment and overhead). Option 3: A combination of Option 1 and 2,viz., one partner can provide at least 20% of the total production cost, while the other partner contributes the minimum content requirement as long as the total cost of production plus the cost of material makes up at least 35% of the appraised value of the product. Source: Jordan Investment Board (www.jordaninvest.com).
Economic Impact and Implications for Jordan of the Jordan-U.S. FTA Draft Report
AMIR Program 14
involved in the engineering, chemicals, cotton and weaving, and plastics and rubber sectors. More than one-half of the 4,470 jobs created in this estate are in the cotton and weaving sector. The largest QIZ in terms of employment is the Al-Dulayl Industrial Park, owned by a private agricultural and trading company. The ten factories operating in that park employ about 9,000 people (Federal Register, 1999; USTR, 1999; USTR, 2000; Ruebner, 2001).
The Jordanian-Israeli Joint Committee, created under the first zone, identifies businesses located within the QIZs that involve substantial economic cooperation between those two countries. It also identifies goods processed in the zones for duty-free and quota-
free entry into the United States if the products meet the requirement of adding value in the zones, Israel, the West Bank and Gaza Strip of no less than 35 percent of the total appraised value of the product 7 (for details on alternative ways to meet this value-added requirement, see Box 4.1). This import duty relief, coupled with the exemption of income taxes and social service taxes on export earnings and the exemption from customs duties on imported raw materials, fixed assets and spare parts, makes investment in a QIZ particularly attractive to industries whose products are assessed high tariffs in the United States. For example, industries involved in garment and footwear manufacturing are well positioned to take advantage of the QIZ concept. According to various Jordanian press reports, between six and ten products have received QIZ status and another five products were to be added to the list by the end of 2000 (Ruebner, 2001). When fully operational, the QIZs are likely to expand Jordan’s Jordanian exports to the United States, create job opportunities in Jordan and increase foreign direct investment (FDI) flows into Jordan (Table 4.2).
3. Jordan-U.S. FTA If the U.S. Congress ratifies the U.S.-Jordan FTA this year, Jordan will become the fourth country to establish such an agreement with the United States after Canada, Mexico and Israel. According to Atlas Investment Group (2000b), negotiations between the two countries thus far have led Jordan to agree to the following:
• Customs tariffs: GSP preferences will remain in effect. • Customs barriers: Goods subject to a five percent customs duty will be duty free
within two years; goods subject to a 10 percent duty will be duty free within four 7Appraised value of the product includes the cost of content plus direct costs of production operations. Examples of direct costs of processing include: rent for equipment used in manufacturing processes, employee group insurance, labor costs of shipping and receiving employees, payroll taxes for direct labor, utilities, royalty payments and costs of supervision and training of workers (Atlas Investment Group, 2000a).
Table 4.2 Economic Activity of QIZs, as of September 2000
QIZ No. of Factories with QIZ status
FDI (US$ millions)
Employment (No.of Jobs)
Al-Hassan 11 68 7,429 Al-Dulayl 10 70 9,000 Al-Tajamouat 9 28 4,625 Al-Kerat 2 21 2,800 Total 32 187 23,854 Source: Adapted from Al-Dustour (Amman), September 11, 2000 as reported in Ruebner, 2001.
Economic Impact and Implications for Jordan of the Jordan-U.S. FTA Draft Report
AMIR Program 15
years and those subject to 15 and 20 percent duty will be duty free within five years; any goods subject to 30 percent duty or greater will be duty free within 10 years.
• Services: Jordan will be given a three-year grace period to amend intellectual property laws.
• Environment: Discussions are underway on Jordanian environmental laws and regulations and they relate to trade, which will likely be revised to reflect those in NAFTA.
Box 4.2 Main Differences Between QIZs and the U.S.-Jordan FTA QIZs FTA Duty and Quota-Free Status Exported goods are duty and quota-
free Schedule of elimination of duties to be completed over 10 years
Activities Covered Only industrial activities Industrial activities and services Legal Framework U.S.-Israel FTA U.S.-Jordan FTA Input Requirements 11.7% Jordanian 35% Jordanian under current
negotiations Designated areas Defined areas within the country Entire country Source: Adapted from Atlas Investment Group, 2000b. At first glance, it seems that the establishment of a new FTA would create competition between the QIZs and the free zones in attracting investments. The free zones cover a wider scope of activities, and could present a threat to the success of the QIZs. One of the key differences between QIZs and the FTA is the duty-free and quota-free status (Box 4.2). Under the QIZ, exported goods (as long as they meet the local content requirement) are duty-free and quota-free; under the FTA, some products will enjoy immediate elimination of duties and others will have to wait ten years. Therefore, some companies could find an investment to be more attractive under the QIZ concept than waiting until the FTA is ratified. Input requirements are another key issue in examining the differences between QIZs and the FTA. Under the QIZ, production of goods is subject to an 11.7 percent Jordanian input; under current negotiations of the FTA, Jordanians alone should provide the minimum 35 percent value added for each product. The input requirement therefore allows investors a choice, which in part may be influenced by political considerations. Lastly, the fact that a QIZ is a designated area complete with existing infrastructure is also an important difference between a QIZ and the FTA. Under the FTA, the entire country of Jordan in effect becomes a free zone, thereby allowing companies to set up operations in any location. Nonetheless, the Government of Jordan has promoted QIZs based on proximity to water, electricity and labor supplies, thereby suggesting that start-up companies will likely choose those zones over areas not having existing infrastructure. In the final analysis, the choice of whether or not to invest in a QIZ will likely depend on the timeliness of the investment, investor personal preferences and attitudes and certain industry-specific issues (Atlas Investment Group, 2000b and 2000c).
Economic Impact and Implications for Jordan of the Jordan-U.S. FTA Draft Report
AMIR Program 16
The economic impact of the FTA, with an eventual across-the-board zero-tariff, is expected to be significant in terms of the expansion of the overall volume of Jordanian exports to the United States (see Chapter 6 for details). The FTA is expected to have an especially large impact on the textile and apparel sector of Jordan, since few firms have qualified their products for QIZ status and therefore face substantial tariffs when exporting to the United States. According to the USITC, U.S. imports of QIZ-designated products amount only to $159,000 in 1999, all of which were classified under HS Chapters 61 and 62 (apparel products). Nonetheless, as all QIZs become operations and more product lines become eligible for QIZ status in upcoming years, U.S. duty-free imports of products under the QIZ are expected to increase. C. U.S. Preferential Tariffs GSP - - Outside the duty-free rates that are part of the QIZ arrangement specific to the United States, the actual tariff rates applied by industrialized countries to products originating from Jordan and other developing countries are usually less than the MFN rate because of tariff preference schemes like the Generalized System of Preferences (GSP) and other preferential trade arrangements (PTAs). Countries offering the GSP apply low or zero-rate tariffs to certain commodities originating from developing countries eligible for participation in the scheme. The GSP scheme is unilateral, viz., developing countries are not required to extend reciprocal tariff reductions. The program is intended to give preferential tariff treatment to developing countries until their exporters are able to compete on world markets with normal, non-preferential tariffs.8 The United States, Japan, Australia, Scandinavia and other non-EU countries offer Jordan beneficial access to their markets under GSP arrangements. An assessment of the effect of the GSP and other PTAs on the average tariff level applied to developing countries that are eligible beneficiaries is complex because of the variety of schemes that are in place and the fact that goods can be included or excluded from time to time over the life of the program (Michalopolus, 1999). For example, under the current United States GSP, most imports of minerals (HS Section 5) from least-developing countries are eligible for preferences, although most imports of plastic and rubber (HS Section 7) of all GSP beneficiary countries (e.g., developing and least developed) are eligible for GSP preferences (Table 4.3). Moreover, it is clear that recent patterns in world trade are diminishing the intended effects of the GSP. First, as multilateral trade agreements reduce tariffs worldwide, the margin between the GSP preferential rates and MFN rates becomes smaller. For example, U.S. tariff rates, which averaged 5.4 percent on industrial products before the Uruguay 8The preferential and unilateral nature of GSP appears to be in violation of several principles of the General Agreement on Tariffs and Trade (GATT), which state that trade must be conducted on a nondiscriminatory (or MFN) basis, that members of the World Trade Organization (WTO) must extend any tariff concessions to all trading partners, and that tariff reductions must be reciprocal. Since 1971, however, a GATT waiver has allowed the industrial countries to extend preferential tariff treatment for developing countries (Holliday, 1998).
Economic Impact and Implications for Jordan of the Jordan-U.S. FTA Draft Report
AMIR Program 17
Round, will be reduced to 3.5 percent when the new reductions are completed. Second, the growing number and size of other preferential tariff arrangements are also diminishing the value of tariff relief under GSP. The United States, for example, extends duty-free treatment to imports under the North American Free Trade Agreement (NAFTA), the U.S.-Israeli Free Trade Agreement, the Caribbean Basin Initiative (CBI), the Andean Initiative, and the upcoming U.S.-Jordan Free Trade Agreement. Plans for other regional arrangements, including on in the Asia Pacific region, are underway. Likewise, the EU is also expanding its preferential trading arrangements in Africa, Central and Eastern Europe, and elsewhere. Therefore, beneficiaries of GSP are increasingly either participating in alternative preferential arrangements or competing with producers who enjoy preferential treatment under other arrangements (Holliday, 1998). MFN tariff rates nonetheless serve as a base with which to assess duty on imports and to compare tariff rates under various PTAs. The United States MFN tariff schedule is comprised of nearly 14,000 tariff lines having an unweighted average of 6 percent. The highest average tariff of 18 percent appears in footwear (HS Section 12); the lowest average of 0 percent appears in art and antiques (HS Section 21). The schedule is also characterized by having a minimum tariff of 0 percent, which is applied to certain products in all HS sections and a maximum tariff of 350 percent, which is applied to certain processed foods and tobacco products (HS Section 4). Products defined in the ‘other’ category (HS Section 99) make up more than 10 percent of the tariff lines and are assessed prohibitive tariffs. Many of these so-called sensitive products are excluded from preferential agreements, as for example those with Israel, Mexico and Canada that include certain types of textiles and related products. Tariff preferences of the United States vary widely under NAFTA, the CBI, the Israel FTA and the U.S.-Jordan FTA. In general, however, the share of tariff lines (by HS section) eligible for tariff preferences under the NAFTA and Israel FTA are similar, with most differences occurring in tariff preferences accorded to CBI countries (viz., fewer number of tariff lines generally enjoy fewer preferences when compared with NAFTA and Israel FTA). For example, about 90 percent of all U.S. imports of footwear (HS 12) originating from Canada and Mexico under NAFTA and Israel under the FTA with that country receive tariff preferences, yet only 8 percent of footwear imports originating from CBI countries are taxed at preferential rates. In contrast, more than one-half (57 percent) of U.S. imports of paper and cellulose (HS 10) originating from Israel and CBI countries receive preferential treatment, compared with only 8 percent of imports of those products from Canada and Mexico.
Economic Impact and Implications for Jordan of the Jordan-U.S. FTA Draft Report
AMIR Program 18
Table 4.3 US Tariffs by MFN Rates and Preferential Schemes, 2000
NAFTA CBI Israel FTA
MFN Tariff Rates by Section GSP Share of Tariff Lines Eligible for…
HS Section/Description Number of Tariff
Lines Minimum Maximum Average a/
Dominant Indicator
b/
Share of Tariff Lines
Canada Preferences
Mexico Preferences
Dominant Indicator
c/
Share of Tariff Lines
Share of Tariff Lines
1 Live Animals/Products 737 0% 117% 11% A+ 64% 70% 59% E 62% 69%
d/, e/ Other 1,494 0% -- -- A+ 1% 0.5% 34% E 1% 1%
Overall 13,943 0% 350% 6% A+ 24% 64% 68% E 52% 64% a/ The unweighted estimated average of the complete Most Favored Nation (MFN) applied tariff (viz., includes ad valorem, specific and other portions of MFN tariff. b/ 'A+' indicates that only imports from least-developing beneficiary countries are eligible for GSP tariff preferences under certain subheadings; 'A' indicates that imports from all GSP beneficiary countries are eligible for GSP tariff preferences under certain subheadings. c/ 'E' indicates that imports from all CBI beneficiary countries are eligible for CBI tariff preferences under certain subheadings. d/ Refers to HS Chapter 99 and includes tariffs applied to 'sensitive products'. e/ Calculations for minimum, maximum and average tariff rates are based on ad valorem portion of tariff rate; MFN specific rates and other MFN rates are applied to many commodities in this section. Source: United States International Trade Commission (USITC).
Economic Impact and Implications for Jordan of the Jordan-U.S. FTA Draft Report
AMIR Program 19
Chapter 5: International Competitiveness A. Comparative Advantage Jordan’s exports are made up of types of goods in which there is a relatively high level of productivity (the Ricardian model), and those in which the exported goods are intensive in the factors with which the country is abundantly endowed (the Heckscher-Ohlin model). Jordan is endowed with natural resources, and exporters have developed a relatively high productivity level in those natural resource-intensive products, which has generally made them competitive in the world markets for those types of products. Tables 5.1 and 5.2 show the comparative advantages of export product divisions of Jordan and other selected Middle East countries in three factor-intensity categories: natural-resource intensive products, unskilled labor-intensive products, and human capital and technology-intensive products. The indices measure the ‘revealed’ comparative advantage (RCA) of the countries in each factor-intensity category: when the value of the index is greater than one, it implies a measurable degree of comparative advantage in a product category; when it is less than one, it suggests a comparative disadvantage.9 Table 5.1 shows the comparative advantages of Jordan and the other selected countries in the world market, and Table 5.2 shows their comparative advantage in the U.S. market. Jordan and other Middle East countries generally have strong export performances in similar product categories, implying a low level of complementarity opportunities that could induce a strong expansion in intra-regional trade within the Middle East. In the natural resource-intensive products, Jordan has a clear comparative advantage in manufactured fertilizers, as do Morocco, Tunisia and, to a lesser extent, Israel and Egypt. Jordan also has a strong comparative advantage in animal and vegetable oils, as do Tunisia and Morocco, and it has a unique comparative advantage in crude materials. Jordan also has a comparative advantage in food and live animals, paper and paperboard, non-metallic mineral manufactures, albeit much smaller than Israel. Among the human capital and technology-intensive products, Jordan shares a comparative advantage with other Middle East countries in all but one product: Inorganic chemicals (Jordan, Egypt, Israel, Tunisia, Morocco) Essential oils, perfume materials (Jordan, Egypt and Turkey) Medicinal and pharmaceutical products (Jordan and Egypt) Plastic materials, regenerated cellulose (Jordan and Israel) Dyeing, tanning, and coloring materials (only Jordan)
9For a discussion on the conceptual issues and problems of measuring the comparative advantage of countries and regions, see Greenaway and Milner (1993). For comparative RCA indices for the industrialized countries and developing regions, see Lord (1991, 1999).
Economic Impact and Implications for Jordan of the Jordan-U.S. FTA Draft Report
AMIR Program 20
Among unskilled labor-intensive products, the data do not reflect Jordan’s recent expansion of garments and travel goods, since the information for those products is based on 1998 and 1999 trade data. In trade with the United States, Jordan and the selected other Middle East countries have a similar pattern of comparative advantage. In natural resource-intensive products, Jordan continues to have a clear comparative advantage in manufactured fertilizers, as do Morocco, Tunisia and, to a lesser extent, Israel and Egypt. Jordan also has a strong comparative advantage in animal and vegetable oils, as do Tunisia and Morocco. In the case of crude materials, however, it shares a comparative advantage with Morocco. Jordan also has a comparative advantage in food and live animals (along with Morocco and Egypt), paper and paperboard, non-metallic mineral manufactures, albeit much smaller than Israel, and similar to that of Turkey, Egypt and Tunisia. Among unskilled labor-intensive products, Jordan and all other Middle East countries emerge with a comparative advantage in footwear, clothing and textile yarn. Jordan is the only country in the region with a comparative advantage in furniture in the U.S. market. Among the human capital and technology-intensive products, Jordan again shares a comparative advantage with other Middle East countries in all but one product: inorganic chemicals (Jordan, Egypt, Israel, Tunisia, Morocco); essential oils, perfume materials (Jordan, Egypt and Turkey); medicinal and pharmaceutical products (Jordan, Egypt and Israel); plastic materials, regenerated cellulose (Jordan and Israel); and dyeing, tanning, and coloring materials (only Jordan). The similarity of export performances across product divisions for Jordan and other Middle East countries suggests that, by developing cross-border production facilities and benefiting from economies of scale, exporters could improve their export performance in the world market, and the U.S. market in particular. For this expansion to happen, however, problems of sufficient capital required to upgrade processing techniques will need to be overcome. The ability and willingness of businesses to enter into joint ventures will naturally depend on comparative production costs between the countries, infrastructure and transportation facilities, market prospects, economic policies and the regulatory environment.
B. International Competitiveness Jordan’s export competitiveness is based on five broad categories: (a) exchange rate competitiveness, (b) labor and infrastructure costs, (c) financial conditions and (d) trade policies.10 We examine these categories under in the following two sub-sections of this chapter.
10 An alternative categorization by the World Bank consists of (a) overall performance, (b) macroeconomic and market dynamism, (c) financial dynamism, (d) infrastructure and investment climate, and (e) human resources. See http://fpsi.worldbank.org/fpsiweb/frame/compet.html.
Human Capital/Technology-Intensive: 0.48 0.20 0.76 0.42 0.32 0.25 Chemical Elements and Compounds 0.03 0.05 1.65 0.13 0.02 0.02 Inorganic Chemicals 5.11 3.47 3.18 0.26 8.51 18.32 Dyeing, Tanning, and Coloring Materials 1.36 0.17 0.20 0.63 0.28 0.12 Medicinal and Pharmaceutical Products 5.87 1.13 0.95 0.25 0.18 0.11 Essential Oils, Perfume Materials, Etc. 6.16 2.28 0.90 1.86 1.00 0.61 Explosives, Pyrotech Products 0.73 0.11 0.61 0.20 0.05 0.01 Plastic Materials, Regenerated Cellulose 1.57 0.09 2.47 0.80 0.21 0.06 Chemical Materials and Products 1.21 0.63 1.42 0.19 0.12 0.07 Rubber Manufactures 0.04 0.42 0.55 1.49 0.37 0.59 Iron and Steel 0.08 1.34 0.05 2.51 0.45 0.15 Manufactures of Metal 0.60 0.50 1.36 1.04 0.39 0.16 Non-Electrical Machinery 0.26 0.03 0.58 0.36 0.17 0.04 Electrical Machinery and Appliances 0.06 0.02 1.12 0.37 0.48 0.09 Transport Equipment 0.06 0.01 0.29 0.34 0.06 0.05 Plumbing, Heating, Lighting Equipment 0.24 2.35 0.06 1.50 0.55 1.23 Professional and Scientific Instruments 0.06 0.02 1.20 0.08 0.17 0.06 Miscellaneous Manufactured Goods 0.56 0.33 0.89 0.50 0.17 0.13
Notes: (1) All calculations are for 2-digit SITC product categories, derived from unweighted averages of product components at the 3-digit SITC level using 1998 data. (2) Factor-intensity category calculations are unweighted averages of individual product divisions. Source: COMTRADE database.
Economic Impact and Implications for Jordan of the Jordan-U.S. FTA Draft Report
AMIR Program 22
Table 5.2 Revealed Comparative Advantage of Jordan and Other Middle East Countries in U.S. Market Category/Product Division Jordan Egypt Israel Turkey Tunisia Morocco Natural Resource-Intensive: 3.40 3.23 2.07 1.46 1.39 3.30 Food and Live Animals 1.54 1.96 0.62 2.33 0.80 4.87 Beverages and Tobacco 0.49 0.06 0.05 1.96 0.90 0.15 Crude Materials, inedible (ex.fuels) 6.59 1.82 0.60 0.62 0.36 3.74 Mineral Fuels 0.04 18.62 0.31 0.60 3.94 1.19 Animal and Vegetable Oils 13.89 0.50 0.03 1.99 7.78 2.71 Fertilizers, Manufactured 20.07 2.57 3.44 0.10 9.87 14.03 Wood and Cork Manufactures 0.07 0.22 0.13 0.54 0.90 2.57 Paper and Paperboard 1.95 0.30 0.15 0.35 0.26 0.10 Non-Metallic Mineral Manufactures 3.41 2.12 33.28 3.80 1.78 0.82 Non-Fuel Minerals 0.43 3.93 0.60 1.21 0.26 1.64 Unskilled Labor-Intensive: 1.86 6.66 1.32 10.54 12.90 5.50 Leather and Manufactures 0.01 3.24 0.15 1.43 2.18 5.88 Textile Yarn 1.37 9.64 1.38 9.04 1.49 1.96 Furniture 1.19 0.59 0.22 0.58 0.41 0.16 Travel Goods and Handbags 0.56 0.31 0.29 2.73 5.86 5.17 Clothing 2.44 7.70 2.01 18.99 30.93 11.11 Footwear 8.33 1.59 1.21 5.92 36.08 15.71 Human Capital/Technology-Intensive: 0.40 0.20 0.74 0.40 0.30 0.23 Chemical Elements and Compounds 0.02 0.04 1.48 0.12 0.02 0.02 Inorganic Chemicals 4.46 3.03 2.77 0.23 7.44 16.00 Dyeing, Tanning, and Coloring Materials 1.46 0.19 0.21 0.68 0.30 0.13 Medicinal and Pharmaceutical Products 6.80 1.31 1.10 0.29 0.21 0.13 Essential Oils, Perfume Materials, Etc. 5.63 2.09 0.82 1.70 0.91 0.56 Explosives, Pyrotech Products 0.63 0.10 0.53 0.18 0.05 0.01 Plastic Materials, Regenerated Cellulose 1.34 0.08 2.12 0.69 0.18 0.05 Chemical Materials and Products 0.78 0.40 0.91 0.12 0.08 0.04 Rubber Manufactures 0.05 0.44 0.57 1.56 0.39 0.62 Iron and Steel 0.25 3.90 0.14 7.32 1.31 0.44 Manufactures of Metal 0.63 0.52 1.42 1.08 0.40 0.17 Non-Electrical Machinery 0.19 0.02 0.41 0.26 0.12 0.03 Electrical Machinery and Appliances 0.05 0.02 0.98 0.32 0.42 0.08 Transport Equipment 0.04 0.01 0.20 0.23 0.04 0.03 Plumbing, Heating, Lighting Equipment 0.40 4.00 0.10 2.56 0.93 2.09 Professional and Scientific Instruments 0.04 0.01 0.77 0.05 0.11 0.04 Miscellaneous Manufactured Goods 0.54 0.32 0.86 0.48 0.16 0.13
Notes: (1) All calculations are for 2-digit SITC product categories, derived from unweighted averages of product components at the 3-digit SITC level using 1998 data. (2) Factor-intensity category calculations are unweighted averages of individual product divisions. Source: COMTRADE database.
Economic Impact and Implications for Jordan of the Jordan-U.S. FTA Draft Report
AMIR Program 23
1. Exchange Rate Competitiveness The dinar (JD) has historically exhibited relative stability, and has been supported by large capital inflows in the form of foreign aid and worker remittances. During a period of considerable instability in 1986-92, the JD was de-linked from the U.S. dollar in 1989 and tied to a trade-weighted basket of currencies. A two-tier exchange rate system was established, comprising official and free market exchange rates. The official exchange rate was applied to the public sector’s imports of essential goods and transfers to Jordanians studying abroad. The dual exchange system was terminated in 1990, and the exchange rates were unified at a sharply devalued exchange rate. While significant restrictions remained on bank foreign exchange transactions, the JD was formally pegged to the U.S. dollar in 1995. Being pegged to the U.S. dollar, the cross-rate of the JD against the Euro and other broader baskets of currencies like the SDR has caused the cross-rate of the JD against the Euro to appreciate sharply in recent years. As a result, the Central Bank has recently considered pegging the JD to a basket that would combine the U.S. dollar with other currencies.11
The combination of Jordan’s exchange rate policies and a gradually widening differential between inflation rates in Jordan and the United States has driven up the real cross rates of the JD against the dollar.12 The real cross rate is the nominal bilateral exchange rate adjusted for relative movements in the national prices of Jordan and a partner country (the United States). As such, an increase in the index reflects an appreciation or revaluation and a decline denotes a devaluation or depreciation. Using this measure, we estimate that the real cross rate of the JD relative to the dollar rose by nearly 6 percent between 1995 and 1998 (Table 5.3). In contrast, the real cross-rates of currencies of most other selected Middle East countries fell against the U.S. dollar during this period. Only the Egyptian pound appreciated by a greater amount than the Jordanian dinar. 11 For an analysis of the extent of exchange rate overvaluation in Jordan, Egypt, Morocco and Tunisia prior to 1995, see Domaq and Shabsigh (1999). 12 The real cross-rate is defined as R = Pe/( RnPf), where Pe is in the price of domestic goods, Pf is the price of the partner country’s goods, and Rn is the nominal bilateral exchange rate.
Table 5.3 Real Cross-Rate Indices of Selected Middle East Currencies with U.S. Dollar, 1991-2000 (1995 = 100) 1991 1992 1993 1994 1995 1996 1997 1998 1999 2000
Turkey 112.2 112.4 113.5 84.6 100.0 98.7 96.0 101.7 102.1 102.1 Note: An increase in the index reflects an appreciation; a fall reflects a depreciation. Sources: Derived from data from International Monetary Fund, International Financial Statistics, and World Economic Outlook database.
Economic Impact and Implications for Jordan of the Jordan-U.S. FTA Draft Report
AMIR Program 24
Despite the subsequent stabilization of the JD, the real cross-rates of Israel, Tunisia and Morocco have continued to fall in the last three years, which has further weakened the competitive position of Jordan relative to those countries in the U.S. market (Table 5.4). This definition of competitiveness in terms of the real cross-rate provides a good index of the degree of international competitiveness of Jordan’s tradables sector in the U.S. market. In Table 5.4, an increase in the real cross-rate reflects an increase in the domestic cost of producing tradable goods, and therefore a deterioration of Jordan’s international competitiveness. The loss of Jordan’s export competitiveness has been especially severe in Western Europe and Asia, since the Euro and most of the currencies in Asia have depreciated relative to the U.S. dollar. In addition to the loss of export competitiveness, the appreciation of the JD stimulated imports, and undermined a recovery in domestic production, employment and fiscal revenue because of the loss of domestic profitability of production.13 2. Comparative Competitive Indicators
Our attempt to obtain comparative factor cost data for Jordan and other Middle East countries was hampered by the limited timeframe of the present study. We have therefore adopted the World Bank’s World Development Indicators for the competitiveness of firms and industries in Jordan and the other selected Middle East countries. While recent data are often lacking, the information provides some insight into Jordan’s competitiveness relative to other countries. The indicators are organized in five broad categories: Table 5.5 covers overall performance and macro and market dynamism, and Table 5.6 covers infrastructure and investment climate and human resources.
13 From a trade policy perspective, Jordan could use the exchange rate as an equilibrating instrument for the current account by using it to replace trade restrictions as an instrument with which to achieve a sustainable medium-term internal and external balance. Internal balance in this context refers to the condition needed to achieve equilibrium in the non-tradable goods market, while external balance refers to the condition need to achieve equilibrium in the current account, a condition that implies compatibility with sustainable long-term capital inflows.
Table 5.4 International Competitiveness of Selected Middle East Countries in U.S. Market, 1991-2000 (1995 = 100) 1991 1992 1993 1994 1995 1996 1997 1998 1999 2000
Turkey 89.1 89.0 88.1 118.2 100.0 101.3 104.2 98.4 97.9 97.9 Note: An increase in the index reflects an improvement in the competitiveness; a fall reflects a loss of competitiveness. Source: Calculated from the inverse of the real cross exchange rates for each country.
Economic Impact and Implications for Jordan of the Jordan-U.S. FTA Draft Report
AMIR Program 25
Table 5.5 Comparative Competitive Indicators of Jordan and Other Middle East Countries: Macro Dynamics Jordan Egypt Israel Turkey Morocco Tunisia I. Overall Performance:
Export Share of World Trade (%) 1994 0.00% 0.20% 0.40% 0.50% 0.10% 0.10%
Average Annual Growth in Export Share (%) 1989-95 -1.8% -3.1% 0.8% 2.6% 0.1% 2.0%
Export Competitiveness
Average Annual Nominal Export Growth (%) 88-89 to 93-94 -2.8% 7.5% 7.5% 7.4% 7.1% 9.8%
Export Growth from World Demand (%) 88-89 to 93-94 5.3% 5.2% 8.2% 5.9% 6.4% 5.8%
Export Structure
Manufactured Exports (% of total exports) 1996 49% 32% 91% 74% 50% 80%
Percent Change in Share of Manufactured Exports (%) 1980-93 50% 200% 11% 167% 138% 108%
High Tech. Exports (% of manufactured exports) 1996 26% 9% 30% 8% 24% 10%
Trade Policy
Mean Tariff (%) 1990-93 14% 28% 8% 14% 25% 30%
Standard Deviation of Tariff Rates (%) 1990-93 N/A 29% 11% 25% 13% 13%
Government Involvement in the Economy
Government Consumption (% of GDP) 1996 23% 10% 29% 12% 16% 16%
Average Annual Growth of Government Consumption (%) 1990-96 7% 2% 3% 3% 1% 4%
Government Surplus/Deficit (% of GDP) 1995 1.1% 0.3% -4.7% -4.1% -1.4% -3.2% Source: World Bank.
Economic Impact and Implications for Jordan of the Jordan-U.S. FTA Draft Report
AMIR Program 26
Table 5.6 Comparative Competitive Indicators of Jordan and Other Middle East Countries: Infrastructure and Investment Climate Jordan Egypt Israel Turkey Morocco Tunisia Information and Communication Network
Life Expectancy at Birth (Years) 1996 71 65 77 69 66 69
Growth in Life Expectancy (%) 1960-1994 49% 16% 5% 13% 14% 13% Source: World Bank, World Development Indicators.
Economic Impact and Implications for Jordan of the Jordan-U.S. FTA Draft Report
AMIR Program 27
Chapter 6: Export Compatibility with the U.S. Market
A. Emerging Exports and Imports The comparative advantage analysis in the previous chapter is limited to static concepts. In reality, countries alter their situations by adopting new technologies either internally through research and development, or externally through foreign direct investment (FDI) and the development of cross-border production facilities. These new technologies allow countries to change their comparative advantage, exploit new markets and, in the case of developing countries, to converge to levels of income and economic structures similar to those of developed economies. The comparative advantage analysis therefore needs to be modified to encompass the effects of changing technological situations and changing worker skills on production patterns of countries. One alternative approach adopted from business economics by both the World Bank and the United Nations Economic Commission for Latin America (TradeCan, 2000) is to assume that there are few natural resource and technological differences between countries. Under these conditions, the degree of concentration or so-called agglomeration of industries helps to accounts for developmental differences between countries. The concentration of industrial activity in particular locations has allowed some countries to advance more quickly than those countries without industrial agglomeration. By changing the manufacturing production base of countries, preferential trade arrangements (PTAs) at the regional level and FTAs at the bilateral level can help to alter and accelerate the development process of countries. Hanson (1994), for example, has shown that the recent agglomeration of industries in Mexico has been associated with increasing returns to scale. In a subsequent study, Hanson (2000) illustrated that the PTA with the United States has strongly influenced the degree of industrial agglomeration in Mexico, as industries have increasingly shifted to locations with easy access to the U.S. market and thereby generated growing employment and incomes in those areas. In the context of bilateral trade arrangements of FTAs and regional trade arrangements under PTAs, the central indicator of a country’s ability to alter its comparative advantage is the degree of trade compatibility between its export structure and that of its trading partner. Having established compatibility of traded products, one can then invoke performance indicators to reveal the extent to which firms compete effectively in the world and regional markets. Success in export markets – measured by rapidly expanding exports and rising market shares – indicates the extent to which an economy is willing and able to achieve global integration and alter its comparative advantage in the global marketplace. In the remainder of this section, we examine Jordan’s trade compatibility with the United States from the point of view of its exports, and use a set of performance indicators to identify those products that could benefit from the U.S.-Jordan FTA. In particular, we used the following criteria to select the products with growth potential in
Economic Impact and Implications for Jordan of the Jordan-U.S. FTA Draft Report
AMIR Program 28
the U.S. market: (a) the degree of trade compatibility between Jordan and the United States, (b) Jordan’s recent export growth record, and (c) the trend growth rate of Jordan’s product market share.
1. Product Selection Procedure The analysis of trade compatibility and export performance concentrates on the following: (1) domestic exports of Jordan (excludes re-exports); (2) product aggregation at the 4-digit HS level (disaggregation at the HS 6-digit level yielded excessively high year-to-year variations and therefore poor trend performance indicators); and (3) data analysis based on the period 1994-99, with the product selection procedure based on 1997-99 data. The analysis of Jordan’s exports was divided into the following four types of product exports:
(1) Large traditional product domestic exports, defined as those products that in 1999 represented at least JD5 million. There were forty-one (41) products in this range.
(2) Medium-size domestic exports, whose product export value represented between
JD1 million and JD5 million. There were fifty-one (53) products in this range.
(3) Small-size domestic exports of between JD500,000 and JD1 million. There were forty-four (44) products in this range
(4) Newly emerging domestic exports of between JD250,000 and JD500,000. There
were thirty-eight (38) products in this range Using these value ranges, the total number of products in the sample consisted of 176 products out of a total of 613 products. (Exports of the remaining 437 products were each under JD250,000.)
2. Trade Compatibility Measure The trade compatibility index measures the degree of compatibility between Jordan’s exported products and those products imported by the United States. The index of compatibility (Cx/m) is computed using the following formula:
Cx/m = 1 – (Σ|xjd - mus|)/2 where xjd is Jordan’s share of good i exports relative to its total exports, and mus is the share of U.S. good i imports relative to its total imports. The index approaches zero when Jordan exports none of what the United States imports, and it approaches unity when the exports share of product i of Jordan is identical to the import share of that product by the United States. According to Michaely (2000), the index of compatibility is usually
Economic Impact and Implications for Jordan of the Jordan-U.S. FTA Draft Report
AMIR Program 29
between 0.50 and 0.60 for trade between industrialized countries, and it averages about 0.20 for trade between Latin America countries.14
Overall, the unweighted average of the four product categories for Jordan’s exports and U.S. imports equals 0.43, which lies between the index of trade between Latin American countries and that of trade between the developed countries (Table 6.1). Within these four categories, it is the one of emerging export products of Jordan that have the highest degree of trade compatibility with the United States. This category includes a broad set of products that range from Dead Sea cosmetics to batteries,
orthopedic appliances, blankets and travel rugs, and machinery for sorting and screening mineral substances. Jordan’s traditional (large-size) exports are generally less compatible with U.S. foreign needs, but at the product level there are a number of products that are compatible with U.S. import requirements: apparel and clothing accessories, aluminum bars and rods, animal feed and insecticides. There are also a large number of products that are highly compatible with U.S. import requirements among the small and medium size exports of Jordan: olive oil, luggage, pharmaceuticals, household appliances, ceramic sinks and wash basins, paints and varnishes, articles of jewelry, tarpaulins and awnings, machinery for plant or laboratory equipment, tableware and kitchenware, electric accumulators, fruit and vegetable juices, chocolate and antibiotics.
3. Trend Growth of Jordan’s Exports and Market Shares Jordan’s ability to affect its market position based on the competitiveness of its products in the U.S. market has been measured by the trend growth rate of product exports in the four product categories and the ratio of product exports relative to U.S. imports of those products. The competitiveness of firms and industries in the world market and that of the U.S. market in particular are reflected in high rates of export growth and rising market shares. Following the approach used by the World Bank and others (TradeCan, 2000), the export performance of Jordan has been classified into the following four categories:
♦ Rising Stars: Products in which Jordan has a rising market share and U.S. imports are expanding.
♦ Falling Stars: Products in which Jordan has a rising market share but U.S. imports are contracting.
♦ Missed Opportunities: Products in which Jordan has a falling market share despite expanding U.S. imports.
14 The index was originally developed by Michaely (1994) and has recently been applied by Rajapatirana (1997) and Michaely (2000) for Latin American trade.
Table 6.1 Indices of Trade Compatibility
Jordan Exports Index
Large-Size 0.33 Medium-Size 0.42 Small-Size 0.34 Emerging Exports 0.63 Note: See text for definition of export categories by size.
Economic Impact and Implications for Jordan of the Jordan-U.S. FTA Draft Report
AMIR Program 30
♦ Retreat: Products in which Jordan’s market share is falling and U.S. are contracting.
Boxes 6.1 through 6.4 show the classification of Jordan’s exports according to product size groupings. Clearly, the most desirable products for Jordan are the rising star and missed opportunity products, and most of Jordan’s exports in our sample fall within these two categories. There are, however, a number of other products that would have been listed under the falling stars and retreat categories that were not included in the sample. These were the products in each export-size category that have a negative export growth trend in 1997-1999, and which would have been likely to have experience a declining market share during that period had they been included in the sample.
Box 6.1 Export and U.S. Market Performance of Jordan’s Large-Size Exports Jordan's Market Share U.S. Imports
Rising
Expanding Contracting Rising Stars: Aluminum bars and rods Tubes, hoses, and fittings Articles of apparel Animal feed Women's vests Vegetable fats and oils Sacks and bags Cartons and boxes Ammonium carbonate Printed books and brochures Air conditioning machines Soap Medicaments Diphosphours pentaoxide Television receivers Furniture and parts
Falling Stars: Salt and pure sodium chloride Molding boxes for metal foundry
Falling
Missed Opportunities: Aluminum waste and scrap Insecticides Packing products Tomatoes, fresh or chilled Chemical fertilizers
Retreats: (None) a/
a/ Jordan’s exports with negative growth rates were excluded from the sample; otherwise they would appear in the retreat and missed opportunities product lists.
Economic Impact and Implications for Jordan of the Jordan-U.S. FTA Draft Report
AMIR Program 31
Box 6.2 Export and U.S. Market Performance of Jordan’s Medium-Size Exports Jordan's Market Share U.S. Imports
Rising
Expanding Contracting Rising Stars: Track suits and ski suits Paints and varnishes Articles of jewelry Tarpaulins and awnings Washing machines Machines cleaning, grading seed Natural sands of all kinds Trunks and suitcases Olive oil Liquid pumps Polymers of vinyl chloride Boards, panels and cabinets Parts suitable for machinery Men's underpants and briefs Aluminum casks and similar containers Wadding of textile materials Seats
Falling Stars: Soybean oil
Falling
Missed Opportunities: Ceramic sinks; wash basins Machinery and laboratory equipment Yeasts Synthetic filament yarn Refrigerators and freezers Non-woven garments Food preparations nes Registers and notebooks Cabbages, cauliflowers and kale Insulated wire cable Motor vehicles parts and accessories
Retreat: (None) a/
Economic Impact and Implications for Jordan of the Jordan-U.S. FTA Draft Report
AMIR Program 32
Box 6.3 Export and U.S. Market Performance of Jordan’s Small-Size Exports Jordan's Market Share U.S. Imports
Rising
Expanding Contracting Rising Stars: Safety glass Electric accumulators Uncoated craft paper and paperboard Fruit and vegetable juices Antibiotics Women's or girls' overcoats Men's or boys' suits Optical fibers and optical fiber bundles Onions, shallots, garlic and leeks Stoppers, caps and lids Trailers and semi-trailers Baths, shower- baths, and wash basins Cheese and curd Lead waste and scrap Mineral or chemical fertilizers, phosphates Men's vests Marble and other building stone Apricots, cherries and peaches Electronic integrated circuits
Falling Stars: Glycerol (glycerin)
Falling
Missed Opportunities: Tableware and kitchenware Uncoated paper and paperboard Chocolate Sugar confectionery Paper and paperboard Interchangeable tools for hand tools Gelatin Instruments used in medical sciences Electrical apparatus for line telephony
Retreat: (None) a/
/ J d ’ t ith ti th t l d d f th l th i th ld i th
Box 6.4 Export and U.S. Market Performance of Jordan’s Emerging Exports Jordan's Market Share U.S. Imports
Rising
Expanding Contracting Rising Stars: Batteries Blankets and travel rugs Garments, not knitted or crocheted Perfumes and toilet waters Cellulose and its chemical derivatives Embroidery in the piece Envelopes and correspondence cards Wire of base metal with flux material Men's overcoats
Falling Stars: Articles of apparel and clothing accessories
Falling
Missed Opportunities: Vegetables prepared or preserved Orthopedic appliances Mechanical appliances Machinery for screening minerals Yarn of synthetic staple fibers Aluminum structures Glazed ceramic flags and paving Polishes for footwear and furniture
Retreat: (None) a/
Economic Impact and Implications for Jordan of the Jordan-U.S. FTA Draft Report
AMIR Program 33
B. U.S. Tariffs on Jordan’s Exports Under the U.S.-Jordan FTA, tariffs on virtually all trade between Jordan and the United States are to be eliminated within 10 years. The tariff reductions are set to take place in four stages: Tariffs of less than 5 percent will be phased out in two years Tariffs that are between and 5 and 10 percent will be eliminated in four years
Tariffs that are between 10 and 20 percent will be removed in five years
Tariffs that are more than 20 percent will be eliminated in 10 years
Table 6.2 shows the current U.S. tariffs on Jordan’s products identified as either rising stars and those that have experienced lost opportunities in recent years. Some of these products already enter the United States under preferential duty-free access under the GSP. For example, precious metal (other than silver) articles of jewelry enters the U.S. market duty-free under the GSP (Ruebner, 2000). These are the nearly 100 Jordanian products whose market shares have been rising at the same time that U.S. imports have been expanding (i.e., the rising stars), or those products whose market shares have been falling despite expanding U.S. imports (i.e., the lost opportunities). Of these products, none have tariffs in the United States that exceed 20 percent. Thirteen (13) products have U.S. tariffs in the 10-20 percent range; eighteen (18) products have tariffs in the 5-10 percent range; forty-two (42) products have tariffs under 5 percent; and twenty-one (21) products have zero-rate tariffs.
1. Textiles and Apparel15 Unlike many other U.S. manufacturing sectors, imports of textiles and apparel are subject to relatively high ad valorem tariffs. A large portion of trade in these products takes place under bilateral and multilateral agreements that allowed for the use of bilateral quotas to control import flows. Most U.S. imports from Mexico and Canada qualified for preferential duty treatment under NAFTA. Imports from Israel under the U.S.-Israel Free Trade Agreement also qualify. In addition, duty-free treatment under the Caribbean Basin Economic Recovery Act (CBERA) is applied to textiles and apparel made of silk and non-cotton vegetable fibers. Finally, imports from a number of countries qualify for reduced duty treatment under heading 9802.00.80 of the Harmonized Tariff Schedule of the United States. Although the majority of imports covered by these quotas correspond to specific textile and apparel industry categories, a small percentage corresponds to production of other types of goods such as man-made fibers, luggage and handbags, and boot and shoe cut stock and findings. Under its WTO commitments, the United States will reduce its tariffs on textile and apparel products by January 1, 2004. 15 The material in this and subsequent sub-sections draws from the comprehensive study on U.S. import barriers by the USITC (1999).
Economic Impact and Implications for Jordan of the Jordan-U.S. FTA Draft Report
AMIR Program 34
Table 6.2 U.S. Tariffs on Selected Jordanian Exports 0406 Cheese and curd . 18.7%
6103 Men's or boys' suits 15.8%
2106 Food preparations not elsewhere specified 15.3%
1806 Chocolate and other food preparations with cocoa 14.6%
6102 Women's or girls' overcoats 14.2%
6908 Glazed ceramic flags and paving 13.3%
2009 Fruit and vegetable juices 13.2%
1704 Sugar confectionery 12.0%
0704 Cabbages, cauliflowers and kale 11.6%
6201 Men's or boys' overcoats 11.6%
5509 Yarn of synthetic staple fibers 11.5%
4202 Trunks, suit-cases, vanity-cases and brief-cases 10.9%
2309 Animal feed 10.6%
6301 Blankets and travel rugs 9.4%
6208 Women's or girls' vests 9.3%
6107 Men's or boys' underpants and briefs 8.9%
6207 Men's or boys' vests 8.7%
5402 Synthetic filament yarn 8.1%
0703 Onions, shallots, garlic and leeks 8.0%
5810 Embroidery in the piece 8.0%
6305 Sacks and bags 6.6%
6210 Garments, not knitted or crocheted 6.5%
3922 Baths, shower- baths, and wash basins 6.3%
7113 Articles of jewelry and parts thereof 6.2%
5601 Wadding of textile materials 5.9%
6306 Tarpaulins and sun blinds 5.8%
6910 Ceramic sinks; wash basins 5.8%
7610 Aluminum structures 5.7%
3912 Cellulose and its chemical derivatives 5.3%
7007 Safety glass 5.0%
3904 Polymers of vinyl chloride 5.0%
2005 Other vegetables prepared or preserved 4.9%
3503 Gelatin 4.4%
8207 Interchangeable tools for hand tools 4.4%
3924 Tableware and kitchenware 4.1%
3808 Insecticides 4.0%
3923 Packing products 3.7%
702 Tomatoes, fresh or chilled 3.5%
3208 Paints and varnishes 3.5%
8528 Television receivers 3.4%
1515 Other fixed vegetable fats and oils 3.4%
8507 Electric accumulators 3.3%
2102 Yeasts 3.2%
3917 Tubes, hoses, and fittings 3.1%
7604 Aluminum bars, rods and profiles 3.0%
9001 Optical fibers and optical fiber bundles 2.8%
Continued
Economic Impact and Implications for Jordan of the Jordan-U.S. FTA Draft Report
AMIR Program 35
Table 6.2 (Continued) U.S. Tariffs on Selected Jordanian Exports 8544 Insulated wire cable 2.7% 7612 Aluminum casks, drums and similar containers 2.7% 8506 Primary cells and primary batteries 2.7% 8537 Boards, panels, consoles, desks, and cabinets 2.7% 2836 Carbonates and commercial ammonium carbonate 2.3% 8450 Washing machines 2.2% 1509 Olive oil and its fractions 1.9% 4823 Paper, paperboard, and cellulose wadding 1.7% 4818 Articles of apparel; clothing accessories 1.7% 4817 Envelopes, letter cards and correspondence cards 1.7% 4819 Cartons and boxes 1.6% 2515 Marble and other building stone 1.5% 4820 Registers, account books, and notebooks 1.4% 8309 Stoppers, caps and lids 1.3% 8415 Air conditioning machines 1.3% 8708 Motor vehicles parts and accessories 1.3% 8716 Trailers and semi-trailers 1.2% 8419 Machinery, plant or laboratory equipment 0.9% 3302 Mixtures of odoriferous substances and mixtures 0.8% 8424 Mechanical appliances 0.7% 4804 Uncoated craft paper and paperboard 0.7% 4802 Uncoated paper and paperboard 0.6% 8413 Pumps for liquids. 0.5% 2941 Antibiotics 0.3% 8418 Refrigerators and freezers 0.2% 5603 Non-woven garments 0.1% 809 Apricots, cherries and peaches 0.1% 2505 Natural sands of all kinds 0.0% 2809 Diphosphours pentaoxide; polyphosphoric acids 0.0% 3003 Medicaments 0.0% 3103 Mineral or chemical fertilizers, phosphates 0.0% 3104 Mineral or chemical fertilizers, potassic. 0.0% 3303 Perfumes and toilet waters 0.0% 3401 Soap, organic 0.0% 3405 Polishes and creams for footwear and furniture 0.0% 4901 Printed books and brochures 0.0% 7602 Aluminum waste and scrap 0.0% 7802 Lead waste and scrap 0.0% 8311 Wire and others of base metal coated with flux material 0.0% 8431 Parts suitable for machinery 0.0% 8437 Machines for cleaning, sorting or grading seed 0.0% 8474 Machinery for sorting or screening mineral substances 0.0% 8517 Electrical apparatus for line telephony 0.0% 8542 Electronic integrated circuits 0.0% 9018 Instruments used in medical sciences 0.0% 9021 Orthopedic appliances 0.0% 9401 Seats 0.0% 9403 Other furniture and parts. 0.0%
Source: USITC.
Economic Impact and Implications for Jordan of the Jordan-U.S. FTA Draft Report
AMIR Program 36
Under the Agreement on Textiles and Clothing (ATC) that went into effect on January 1995 as a part of the WTO agreements, the United States and the three other WTO members with MFA quotas (the EU, Canada, and Norway), agreed to eliminate the textile and apparel quotas over a 10-year period that ends on January 1, 2005. At that time, all trade in textiles and apparel among WTO members will have been integrated into the GATT regime and thus will be subject to the same trade rules as goods of other sectors. The ATC calls for quotas to be phased out in four stages:
(1) Stage 1: Beginning in January 1995, the WTO members integrated 16 percent or more of their textile and apparel trade into the GATT regime, based on their respective 1990 import volumes, and countries implement accelerated annual growth rates for the remaining quotas, with an increase of 16 percent for the major supplier countries and 25 percent for small suppliers.
(2) Stage 2: Beginning in January 1998, an additional 17 percent of trade was
integrated into the GATT regime and quota growth rates were increased by 25 percent and 27 percent, respectively, for the major and small supplier countries.
(3) Stage 3: Beginning in January 2002, an additional 18 percent of trade will be
integrated into the GATT regime and annual growth rates for the remaining quotas will be increased by 27 percent.
(4) Stage 4: As of January 2005, the remaining 49 percent of textiles and apparel
trade will be integrated into the GATT regime.
2. Cheese and Other Dairy Products The United States imposes tariff-rate quotas (TRQs) on several dairy products (e.g., cheese, nonfat dry milk, and fluid milk). For these products to receive the in-quota rate, importers must obtain a license issued by the U.S. Department of Agriculture (USDA). The import license identifies the product, the country from which it may be imported, and the maximum quantity that can be imported. The license can be renewed as long as the importer has met the requirements of the regulation. In addition to these licensing requirements, U.S. imports of dairy products are also subject to health and sanitary regulations. The magnitude of these import restrictions on cheese and other dairy products is substantial. A recent USITC (1999) recently found that trade liberalization would have the greatest impact on the cheese sector.
3. Confectionary Sugar Confectionary sugar in the United States is regulated by a system of TRQs is used to restrict the volume of sugar imports. These quotas are applied to five categories of products: (1) blended syrups containing sugar, not in retail containers; (2) edible preparations containing over 65 percent sugar, not in retail containers; (3) sweetened cocoa powder; (4) flour mixes and dough containing over 10 percent sugar, except dough
Economic Impact and Implications for Jordan of the Jordan-U.S. FTA Draft Report
AMIR Program 37
in retail containers; and (5) edible preparations containing over 10 percent sugar. The TRQ for refined sugar is on a global first-come, first-served basis.
4. Tobacco and Tobacco Products In the United States, a TRQ applies to imports of leaf tobacco and manufactured tobacco used in the production of cigarettes for domestic consumption, mainly flue-cured and burley tobacco. Under a Presidential Proclamation that became effective in September 1995, TRQ allotments were negotiated with supplier countries based on production levels and market share. These TRQ specify the maximum quantity that can be imported at a low tariff rate during the quota-year. The U.S. Customs Service tracks the quantity of imports from the countries of origin on a first-come, first-served basis.
Economic Impact and Implications for Jordan of the Jordan-U.S. FTA Draft Report
AMIR Program 38
Chapter 7: Potential FTA Impact on Exports
A. FTA-Related Tariff Liberalization Expenditure-switch policies in the form of tariffs create a ‘price wedge’ between the domestic price to the consumer in the United States and the world market price of the product. This wedge effectively imposes a tax on the consumer. The tax rate, denoted t, raises the price of the product to (1+t)P in the United States. The relative prices of Jordan and its competitors to the U.S. market remain unaltered: that of Jordan (denoted i) is Pi/P and that of its competitors (denoted k) is Pk/P. In the case of a small market like that of U.S.-Jordan trade flows, the effect of trade liberalization is simply determined by the amount of the reduction in the price wedge (i.e., the magnitude of the tariff reduction) and by the responsiveness of consumers to price changes (i.e., the price elasticity of import demand). A change in the quantity demanded of the product because of protectionist measures in the U.S. market would therefore bring about a proportional change in the demand for the product supplied by Jordan and other foreign suppliers to the U.S. market. As such, we can calculate the effect of a tariff reduction in the U.S. market on Jordan’s exports of each product from the estimate of the import demand schedule. Although the approach includes the imperfect-competition features of the ‘new trade theory’, the small market response to trade liberalization is similar to that which would occur under perfect competition: tariff reductions in a sector cause domestic buyers of final and intermediate products to substitute toward imports, thereby causing domestic-competing industries to contract production while Jordanian exporters expand their shipments.16 Annex A describes the econometric model used to measure the effect of tariff reductions for individual products on U.S. imports and Jordanian exports. Table 7.1 shows the hypothetical impact on US$100,000 worth of exports from Jordan to the U.S. market for each of the 94 products that are either rising stars or have experienced lost opportunities in recent years. As expected, the largest gains would accrue to those products that currently face relatively high tariffs. The gain in export revenue from these products currently facing tariffs of 10 to 20 percent ranges from 3 to 5 percent a year over the 5-year period of tariff reductions, and it averages 3.7 percent a year for the increased export value of all of these products during that period. For those products currently facing tariffs in the range of 5 to 10 percent, the export revenue gain would equal between 2 and 3.5 percent a year over a four-year period, and average 2.5 percent a year for their combined value during that period. Finally for those products currently facing tariffs in the 0 to 5 percent range, the annual gain in revenue would equal between 0.1 and 3.6 percent over a two-year period. 16 The new theory of trade incorporates increasing returns to scale, imperfect competition, and product variety to explain trade. For a description of its theory and dynamic specification, see Lord (1991).
Economic Impact and Implications for Jordan of the Jordan-U.S. FTA Draft Report
AMIR Program 39
Table 7.1 Impact of U.S.-Jordan FTA on Sample of Jordan's Exports
Percent Change in Export Revenue from
Previous Year
NPV of 5-Year
Additional Revenue on
$100,000 Initial
Exports HS Code Commodity Description Tariff Yr 1 Yr 2 Yr 3 Yr 4 Yr 5
42 Products with Under 5% Tariffs: 0-5% 1.6% 1.6% - - - $ 490,212 Notes: Calculations based on actual US tariffs, and uniform initial Jordanian export levels of US$100,000 to the US market, and uniform price elasticities of import demand to allow for cross-product comparisons. a/ There are an additional 21 products in the sample with 0% tariffs in the United States.
Economic Impact and Implications for Jordan of the Jordan-U.S. FTA Draft Report
AMIR Program 40
Given the timeline of the tariff reduction schedule, export revenue changes from tariffs in the 10 to 20 percent range are likely to be more beneficial to Jordan that if it confronted tariffs in excess of 20 percent in any of the 94 products. Sensitivity analysis on the selected products showed that the net present value of the potential flow of future revenue from the FTA would be higher for the medium-to-low tariff products having a shorter implementation period than those products with high-tariffs having a longer implementation period. For example, the estimated net present value of the additional revenue for Jordanian cheese and curd exports to the United States under the existing 19 percent tariff was nearly 20 percent higher than for a hypothetical export facing a 25 percent tariff in the U.S. market. The fact that the FTA will eliminate tariffs on a relatively fast track for the types of products exported by Jordan will therefore be more beneficial to exporters than if they faced high tariffs in the United States. The export revenue gains to Jordan from the FTA are intended to be primarily illustrative since we used the same price elasticity across products to allow for comparison of the effects of different tariff reduction schedules under the FTA. Also, we have not captured the economy-wide effects of dynamic changes in efficiency and economic growth. These effects would include not only direct U.S.-Jordan bilateral trade, but also output and employment in the goods and services sectors of the Jordanian economy.17 B. U.S. Market Access Regulations The U.S.-Jordan FTA is supported by rules of origin that ensure that exporters do not import goods from outside to re-export them within the FTA. The rules of origin of the U.S.-Jordan FTA are specified in Annex 2.2 of the Agreement and require that the sum of the cost or value of the materials produced in Jordan plus their direct processing costs be no less than 35 percent of the value of the product exported to the United States.18 In determining the 35 percent domestic content requirement, the cost of materials used in the production of a product in Jordan, and which are products of the United States, can be counted in an amount up to 15 percent of the appraised value of the product. That is, the products can be manufactured in either Jordan or the United States, but the contribution of materials by the United States cannot exceed 15 percent of the value of the product. 19
17 For comparable economy-wide analyses of the FTA of Morocco with the EU under the Euro-Med Agreements (EMAs), see Rutherford, Ruström, and Tarr (1993); for the FTA of Tunisia with the EU, see Brown, Deardorff, and Stern (1997); for the FTA of Egypt with the EU, see Konan and Maskus (1997) and Dessus and Suwa-Eisenmann (1998). 18 From a legal point of view, there appear to be four types of rules of origin. These are (a) requirements in terms of domestic content, (b) requirements in terms of a change in tariff heading (CTH), (c) requirements in terms of specified processes that must be performed within the FTA, and (d) requirements that the product has been substantially transformed (Krishna and Krueger, 1995). The U.S.-Jordan FTA rules of origin refer to domestic content and substantial transformation of products. 19 Though the rules of origin have been criticized for their protectionist effects, especially by Krueger (1999), they can lead to an improvement in efficiency by reversing the trade-diverting effect of a tariff preference on the final good. Falvey and Reed (1997) and Ju and Krishna (1996) offer further discussion of the analytic aspects of the rules of origin.
Economic Impact and Implications for Jordan of the Jordan-U.S. FTA Draft Report
AMIR Program 41
The Industrial Development Department of the Ministry of Industry and Trade has recently completed a useful study on the rules of origin of the U.S.-Jordan FTA and the QIZs (Industrial Development Department, 2001). Based on a survey of ten companies that were considered to be representative of the pharmaceutical, garment, carpet, electrical products, vegetable oil and gold industries, the study estimated the contribution of the representative companies to the value added of their products. Following the FTA and QIZ rules of origin, the study calculated the domestic contribution as the combined sum of domestic production costs and direct industrial expenses relative to the free on board (fob) value of the final product exported.20 Of the ten companies, eight met or nearly met the rules of origin requirements under regulations governing both the FTA and QIZs. Only the pharmaceutical and jewelry companies fell considerably short of the 35 percent requirement because of the large share of their raw material inputs originating from foreign sources. Those companies with domestic value added shares that well exceeded the rules of origin requirements were representatives of the garment, carpet and vegetable oil industries, while those companies that fell somewhat short of the rules of origin requirements were part of the electrical machinery industry. In the short run, these rules of origin requirements can raise the production cost of industries by forcing a shift to higher cost inputs from domestic sources. The FTA may therefore be trade diverting if there is a shift from lower to higher cost sources of supply, rather than having the desired effect of being trade creating by shifting production from higher to lower cost sources of supply. In the long run the effects are highly dependent on the form of the structure of the industry and its market.21 In addition to these requirements, there are a number of regulations affecting access to the U.S. market. These regulations cover product standards and testing and certification procedures in general, phytosanitary requirements for agricultural products, and U.S. Food and Drug Administration (USFDA) requirements for pharmaceutical products.
20 The fob price of the final product includes material inputs plus direct and indirect industrial expenses plus profits. Direct industrial expenses include the cost of labor, depreciation of machinery, product inspection, design costs, research and development, and utilities. 21 See, for example, Krishna and Krueger (1995). For further analysis of rules of origin of FTAs and their welfare effects on developing countries, see Ju and Krishna 1996). Also, Falvey and Reed (1997) assess the equivalence of rules of origin and commercial policy instruments.
Economic Impact and Implications for Jordan of the Jordan-U.S. FTA Draft Report
AMIR Program 42
Chapter 8: Potential FTA Impact on Imports
A. Trade Complementarities Jordan currently obtains about 10 percent of its total imports from the United States, and those imports are concentrated in a relatively few number of products. The top 36 products account for over two-thirds of total imports from the United States and, of these, 14 products account for one-half of all imports (Table 8.1). The extent to which Jordanian businesses will be affected by the U.S.-Jordan FTA will depend on the magnitude of existing protection from foreign competition, as well as the effect that bilateral trade liberalization will have on the cost of their inputs. Table 8.2 shows the nominal MFN tariffs currently applied to the top 36 products imported from the United States. That table also shows the extent to which these products are both exported and imported by Jordan. This intra-industry trade (IIT), or two-way trade, is generally associated with the existence of product differentiation between similar types of goods.22 The measure of intra-industry trade compares the proportion of a country’s exports and imports of goods originating from the same industry with that country’s overall trade. The IIT indices that are near zero imply that little or no intra-industry trade exists, since either Jordan’s exports or imports of that industry approach zero. In contrast, IIT indices that approach 100 imply that Jordan’s exports of products from an industry are nearly the same as the amount of imports from that same industry, and therefore all trade is intra-industry trade. About one-half of Jordan’s major imports from the United States occurs in products in which significant two-way trade exists. This intra-industry trade is highest in cigarettes, vegetable fats and oils, tractor parts, refrigerators, sunflower seed and oil, dryers, furniture and orthopedic appliances. There is no two-way trade in wheat, aircraft and their parts, rice, corn, chemical wood pulp, automated data processing machines and automobiles. Of the products with high IIT indices, vegetable fats and oil imports from the United States are not expected to increase significantly since exports have been entering Jordan under U.S. Government export assistance program GSM 102/103 (U.S. credit Guarantee programs) and Public Law 480 (food aid) (ITC, 2000). The USITC (2000) has also identified specific U.S. exports that might increase their penetration of the Jordanian market as a result of the FTA. Of the 16 products examined, about one-half were products with high IIT indices listed in Table 8.2. The products examined were the following:
22 Two-way trade provides a good indication of inward FDI opportunities since foreign companies can achieve economies of scale through cross-border joint ventures. For an analysis of two-way trade and FDI growth opportunities, see Lord (1999).
Economic Impact and Implications for Jordan of the Jordan-U.S. FTA Draft Report
AMIR Program 43
Table 8.1 Jordan: Top Imports from the United States
HS Code Description Value
(‘000 US$) Percent of Total
1001 Wheat and Muslin 26,803 9.9%
8803 Airplanes and Parts 25,641 9.5%
1006 Rice 14,330 5.3%
1005 Corn (Maize) 10,926 4.0%
1515 Vegetable Fats And Oils 10,583 3.9%
2403 Tobacco Manufactures 9,308 3.4%
8431 Machinery Parts 6,353 2.4%
4703 Chemical Wood Pulp 6,099 2.3%
1507 Soybean Oil 5,738 2.1%
8471 Automatic Data Processing Machines 4,040 1.5%
9018 Medical Instruments 3,672 1.4%
8414 Air Or Vacuum Pumps 3,657 1.4%
8703 Motor Cars 3,601 1.3%
1512 Sunflower Seed and Oil 3,501 1.3%
9301 Military Weapons 3,367 1.2%
9306 Munitions 3,323 1.2%
8418 Refrigerators 2,998 1.1%
1502 Fats Of Bovine Animals, Sheep Or Goats 2,983 1.1%
9802 Articles Donated For Relief Or Charity 2,028 0.8%
0802 Nuts , Fresh Or Dried 2,018 0.7%
8802 Aircraft 1,938 0.7%
7303 Tubes and Pipes of Cast Iron 1,918 0.7%
2402 Cigars and Cigarettes 1,883 0.7%
6309 Worn Clothing 1,626 0.6%
8708 Parts And Accessories for Tractors 1,622 0.6%
8525 Transmission Apparatus for Radiotelephony 1,603 0.6%
1901 Malt Extract; Food Preparations of Flour 1,575 0.6%
8413 Pumps For Liquids 1,511 0.6%
Total 184,516 68.3% Source: Derived from data of Department of Statistics and USITC.
Economic Impact and Implications for Jordan of the Jordan-U.S. FTA Draft Report
AMIR Program 44
Animal and vegetable fats and oils Cereals (wheat, rice and corn) Citrus fruit and juices Crude petroleum Electronics Fertilizers Iron and steel mill products Jewelry Live animals Machinery and transportation equipment Nuts Pharmaceuticals Phosphates Potash Textiles and apparel Vegetables
Of the other products examined by the USITC, little if any penetration into the Jordanian market is expected for crude petroleum, fertilizers, jewelry, phosphates and potash. Negligible penetration is expected in citrus fruit and juices, vegetables, live animals, nuts, and textile and apparel (mainly in the form of artificial filament, cotton and manmade fiber fabrics). Three of these categories were examined by the USITC study in detail: cereals (other than wheat), electric machinery, and machinery and transport equipment. The findings indicated that U.S. exports of cereals to Jordan could increase by 14 percent, that exports of electrical machinery could double, and that machinery and transport equipment could expand by nearly 40 percent. While these increases are insignificant relative to total U.S. exports in those categories, they are important for Jordan. Also, the removal of tariffs on Jordanian imports of U.S. steel could divert imports of low-quality Russian and Ukrainian steel to U.S. suppliers. B. Nominal and Effective Protection Tariffs have been an important source of government revenue and they have served to protect the local market for domestic industries. The existence of tariff escalation has also promoted the production of final goods in place of intermediate and capital goods, other material inputs, and non-traded commodities, which is typical of the now-disfavored import-substitution policy. To the extent that the U.S.-Jordan FTA eliminates tariffs on inputs and their final products, it will tend to favor more efficiently produced goods whether produced domestically or in the United States, and it will raise consumer welfare. Perhaps more importantly, it will liberate valuable resources from less productive sectors for use in Jordan’s industries having true comparative advantage. Under these circumstances, it is useful to examine the magnitude of protection of
Economic Impact and Implications for Jordan of the Jordan-U.S. FTA Draft Report
AMIR Program 45
industries and their value added under both existing levels of protection and bilateral free trade with the United States. The extent of this protection can be measured by the effective rate of protection (ERP). In contrast to the nominal rate of protection (NRP) that measures the extent of protection by the difference between the border price of foreign-made products and the price of domestic import-substitutes made by local producers, the ERP measures the increase in value-added of the protected industry over value added of that same industry measured in terms of border prices.23 For an industry or firm, the value added is the difference between the total value of output and the cost of the intermediate inputs used in the production of the final product. Since the value added measures the return to capital and labor used in the industry or firm, the larger the proportion of low-tariff imports used in the production of the product the higher the ERP, and therefore the more attractive the industry is for investment. Similarly, the magnitude of ERP rises steeply as the amount of value-added components becomes smaller relative to inputs. For this reason, low value-added production that simply mixes imported materials, packages or assembled products are potentially high ERP industries. Analysis of ERPs across industries can show how Jordan’s present tariff structure influences the production and the distribution of benefits and costs among the Jordanian industries and consumers, as well as the extent to which the U.S.-Jordan FTA is likely to shift the existing tariff-induced bias away from import substitution to export expansion and investment in the production of non-tradables. The analysis, however, requires the application of technical coefficients of production derived from input-output tables to the total value of the tradable material inputs. Since an input-output table for Jordan does not exist, we have limited the present analysis to an illustrative product (furniture) for which technical coefficients of production can be constructed from other available IO tables. In the case of Jordan’s production of furniture, we can first consider an example where furniture is produced using only one tradable input, wood (for an overview of recent export performance of Jordan’s furniture products, see Table 8.3). Let US$100 worth of furniture require US$55 worth of wood without any tariff distortions.24 Under free trade, the value added would be US$45. With an existing tariff of 30 percent applied to the final
23 In practice, calculation of the ERP is based on the measurement of the difference between the observed value added with the existing tariff structure and that estimated for the industry under free trade. The value added under free trade is calculated by deducting from the observed value added the revenue equivalent of the tariff on the industry’s output and the cost equivalent of the tariffs affecting intermediate inputs used in production. Specifically, the ERP for a product is the percentage excess of domestic value added, V, over the international market value added, W, that value added that would have been realized in the absence of the existing tariff structure. The difference between V and W, expressed as a percentage of W is the ERP, i.e. ERP = (V - W) / W. 24 In practice, the observed technical coefficients in Jordan include the effects of tariff distortions. We can recover the technical coefficients that would exist without the tariff distortions by eliminating those distortions from the domestic price of the product and its inputs (see Annex A).
Economic Impact and Implications for Jordan of the Jordan-U.S. FTA Draft Report
AMIR Program 46
product, then furniture would now sell for US$130 in the domestic market.25 However, using the ERP formula, we would find the value-added available for profits and non-tradable inputs to be much higher at 66 percent (the 30 percent tariff divided by the 45 percent domestic value added). Naturally, this profit would be eroded if the tradable input were also subject to a tariff. For input tariffs of 10, 20 and 30 percent the ERP would successively fall to 54, 42 and 30 percent. Thus the ERP shows the extent to which an industry is afforded a relative advantage because of a graduated tariffs structure over one that is uniform.
25 The current nominal tariff of 30 percent applies to imports of nearly all types of furniture listed in Table 8.3. Imports for modernization and renewal of hotels and hospitals, however, are exempt from duties and taxes on furniture once every seven years (U.S. Department of State, 2001).
Economic Impact and Implications for Jordan of the Jordan-U.S. FTA Draft Report
AMIR Program 47
Table 8.2 Tariffs and Two-Way Trade in Jordan's Major Imports from the United States
HS Code Description MFN Tariff Intra-Industry Trade Index
2402 Cigars and Cigarettes 100% 94.8
1515 Vegetable Fats And Oils 5% 83.3
8708 Parts And Accessories for Tractors 30% 81.7
8418 Refrigerators 30% 80.4
1512 Sunflower Seed and Oil 5-10% 66.7
8421 Centrifuges, including Dryers 0-30% 53.9
9403 Furniture 30% 48.1
9021 Orthopedic Appliances 0% 46.6
1507 Soybean Oil 5% 39.5
9018 Medical Instruments 0% 38.5
8431 Machinery Parts 30% 37.2
8413 Pumps For Liquids 5-30% 36.2
8414 Air Or Vacuum Pumps 10% 14.4
2403 Tobacco Manufactures 70% 12.4
1901 Malt Extract; Food Preparations of Flour 0-30% 10.4
8525 Transmission Apparatus for Radiotelephony 30% 0.2
1001 Wheat And Meslin 0% -
8803 Airplanes Parts 10% -
1006 Rice 5% -
1005 Corn (Maize) 5% -
4703 Chemical Woodpulp 5% -
8471 Automatic Data Processing Machines 0% -
8703 Motor Cars 15-30% -
9301 Military Weapons 30% -
9306 Munitions 30% -
1502 Fats Of Bovine Animals, Sheep Or Goats 5% -
9802 Articles Donated For Relief Or Charity 0% -
8802 Aircraft 0% -
7303 Tubes and Pipes of Cast Iron 30% - Source: Calculated from data of the Department of Statistics and USITC.
Economic Impact and Implications for Jordan of the Jordan-U.S. FTA Draft Report
AMIR Program 48
Table 8.4 shows the ERP calculations for Jordan’s wood furniture industry. Although tariffs on the industry’s two major inputs, sawn wood and veneer wood and plywood, are zero, high tariffs are applied to the more processed carpentry wood, paints and hardware, woven fabrics and textiles, and moderate tariffs are applied to chemicals, tools, leather, and oils. Overall, the trade-weighted average of these tariffs is over 5 percent for inputs. As a result, the estimated ERP for furniture in Jordan is nearly 50 percent, which is somewhat less than in the example where the industry was subject to a 30 percent tariff on the final good but there were no tariffs on inputs. Still, the Jordanian furniture industry is heavily protected and it probably diverts resources away from the country’s industries having a true comparative advantage.
In order to gauge the impact of the FTA at the industry-level, this type of analysis could easily be extended to other industries in Jordan. Since an IO table for Jordan does not exist, it is possible to derive the technical coefficients of production from selective interviews with businesses in the leading industries that are likely to compete with U.S. imports and benchmark the results with other IO tables. Future work in this area would be valuable to Jordanian businesses in gauging their competitiveness in the U.S. and global marketplaces.
Table 8.3 Jordan's Exports of Furniture by Type, 1994-99 (JD) HS Code Product Description 1994 1995 1996 1997 1998 1999
940360 Other wooden furniture 702,942 701,344 873,221 2,150,091 1,881,336 2,191,283
940340 Wooden furniture used in kitchen 122,156 255,947 354,340 721,873 706,179 1,275,009
940370 Furniture of plastics 4,290 99 34,015 54,448 508,131 805,175
940320 Other metal furniture 70,438 93,168 160,091 107,057 405,467 420,123
940330 Wooden furniture used in offices 6,680 28,923 6,580 46,176 87,085 325,680
940310 Metal furniture used in offices 9,204 33,835 30,775 114,362 85,239 147,057
940350 Wooden furniture used in bedroom 36,577 40,058 57,760 23,036 176,669 91,066
940380 Furniture of other materials 9,440 8,370 - 6,900 60,860 85,652
Source: Department of Statistics.
Table 8.4 Jordan’s Effective Rate of Protection in the Furniture Industry
Nominal Rate of
Protection
Input Coefficient with Tariff
Input Coefficient
without Tariff
Finished Product 30%
Tradable material inputs
Sawn wood, polishing pads 0% 0.182 0.236
Veneer and plywood 0% 0.150 0.195
Wood and carpentry wood 30% 0.078 0.078
Paints and hardware 30% 0.069 0.069
Industrial chemicals 10% 0.027 0.032
Petroleum oils and residues 5% 0.021 0.026
Tools and saw blades 10% 0.011 0.013
Industrial machinery 0% 0.004 0.005
Woven fabrics 30% 0.004 0.004
Woodworking machinery 0% 0.002 0.003
Leather, abrasive products 10% 0.002 0.002
Textile goods 30% 0.001 0.001
Plastics products 0% 0.001 0.002 Effective Rate of Protection (%) 49% Note: See Annex A for methodology and input-output coefficient sources.
Economic Impact and Implications for Jordan of the Jordan-U.S. FTA Draft Report
AMIR Program 49
Chapter 9: Sector Impact of FTA on Services
A. Jordan’s Service Sector The service sector contributes over 70 percent of Jordan’s total output, measured by the gross domestic product (GDP). Within this sector, the leading industries are finance, insurance, real estate and business services, contributing over 20 percent of the country’s total output, and transport and communications, contributing 18 percent. The trade industry, which covers tourism, hotels and restaurants, contributes another 12 percent. Demand for all these services tends to be highly income-elastic since consumption of services such as tourism, education and health has expanded more rapidly than demand for manufacturing goods and agricultural products.
While the share of services in Jordan’s foreign trade has also risen rapidly, its share relative to total trade has been smaller than in domestic production and employment. Overall, services trade contributes one-half of total receipts from goods and services, and accounts for one-third of total payments for goods and services. The services balance has been positive and growing, which has helped to offset the large merchandise trade deficit (Table 7.1). Nevertheless, the ongoing international embargo on Iraq, which was formerly Jordan’s largest trading partner, has negatively impacted tourism and other services receipts. Tourism is the largest non-factor services export, followed by transport services composed of shipping, passenger and other transport services.
B. FTA and GATS Commitments Despite a number of similarities between services trade and merchandise trade, there are important differences in their trade barriers and cross-border movements.26 First, many cross-border service activities require physical presence in the foreign market, in which case liberalization is required of both the movement of the service and the service provider (for example, travel agents) or consumer (for example, tourists). Second, barriers to trade in services are often in the form of regulations, which are easier to enforce when foreign service providers (for example, insurance firms) are located in the host country. Finally, trade in services tends to generate more movements in foreign direct investment (FDI) and cross-border networks than does merchandise trade. The resulting networks and FDI activities can generate economies of scale in such sectors as telecommunications and information services that would otherwise not be possible for small size countries like Jordan.
26 For a survey of analytical issues facing services trade, see Hoekman and Braga (1997).
Economic Impact and Implications for Jordan of the Jordan-U.S. FTA Draft Report
AMIR Program 50
Under the U.S.-Jordan FTA, negotiations have been facilitated by the mutual recognition agreements for trade liberalization in services under the General Agreement on Trade in Services (GATS). 27 28 The GATS provides the multilateral framework under the WTO for regulating trade in services under two sets of obligations: (1) a set of general concepts, principles and rules that apply to all measures affecting trade in services; and (2) specific negotiated obligations that constitute commitments that apply to those service sectors and sub-sectors that are listed in a member country's schedule. These sectors cover the following29: Business (including professional and computer) services; Communication services; Construction and engineering services; Distribution services; Educational services; Environmental services; Financial (insurance and banking) services; Health services; Tourism and travel services; Recreational, cultural and sporting services; Transport services; Other services not included elsewhere.
The GATS applies to four "modes of supply:" (1) cross-border supply of a service (i.e., not requiring the physical movement of supplier or consumer); (2) services involving movement of the consumer to the location of the supplier; (3) services sold in the territory of a country by entities that have established a presence there but originate in the territory of another country; and (4) services requiring the temporary movement of natural persons. The total value of services traded through modes (3) and (4) is probably much greater than that of the trade in services taking place through modes (1) and (2). However, the lack of statistics makes any concrete estimate difficult to make. Market access is not defined in the GATS. Instead, agreement has been reached on a list of six measures that in principle are prohibited. These consist of limitations on: (1) the number of service suppliers allowed, (2) the value of transactions or assets, (3) the total quantity of service output, (4) the number of natural persons that may be employed, (5)
27 The United States of America Schedule of commitments can be found at the following address: http://www.ustr.gov. Jordan’s schedule of commitments can be found at the http://www.wto.org and http://www.mit.gov.jo. 28 In contrast to the U.S.-Jordan FTA, NAFTA provides for general obligations on market access or the right of non-establishment (i.e. the right to provide cross-border services without an established presence), which are not general obligations under the GATS. Moreover, NAFTA uses a negative list approach to coverage so that all services are covered unless they are explicitly excluded, in contrast to the positive list used by the GATS, which is less transparent because governments do no reveal non-conforming measures and excluded sectors (Hoekman and Braga, 1997). 29These 12 sectors are further divided into 155 sub-sectors.
Economic Impact and Implications for Jordan of the Jordan-U.S. FTA Draft Report
AMIR Program 51
the type of legal entity through which a service supplier is permitted to supply a service (e.g., branches versus subsidiaries for banking), and (6) participation of foreign capital in terms of a maximum percentage limit of foreign share holding or the absolute value of foreign investment. Commitments are made in a manner that is both transparent and clarifies whether any market access or national treatment limitations exist (i.e. GATS, Article XVI, and XVII respectively)30. Moreover, exemptions to the Article II Most Favored Nations Treatment31 must be included. This includes areas where specific favorable treatment is extended to nationals of a specific country compared to another. Areas where reciprocity in treatment is a condition are also included here (e.g., to allow certain professionals or insurance companies to establish commercial presence and practice in Jordan, a reciprocal treatment is required).
30 For the full legal text of General Agreement on Trade in Services (GATS) see http://www.wto.org. 31 The MFN principle refers to the concept of non-discrimination among countries. Exceptions to the rule are members of regional trade agreements, which are subject to preferential treatment of some form or another.
Table 9.1 Jordan’s Services Account in the Balance of Payments, 1995-2000 2000 2000
Economic Impact and Implications for Jordan of the Jordan-U.S. FTA Draft Report
AMIR Program 52
C. Liberalization of Services In some cases like the Euro-Mediterranean Partnership agreement concluded between the EU and Jordan and a number of other Mediterranean countries, the FTAs simply make reference to the multilateral obligations of participating countries under the GATS.32 But in the case of the U.S.-Jordan FTA, a broad range of services will be liberalized on the basis of the U.S. and Jordan’s existing commitments to the GATS. Annexes 3.1 and 3.2 of the FTA address services. Annex 3.2 states that:
“the delegations representing Jordan and the United States of America (United States) discussed Jordan’s requirements for reciprocal treatment in certain services sectors. Jordan has listed in its schedule of specific commitments under the General Agreement on Trade in Services (GATS) exemptions from most-favored-nation (MFN) treatment that are based on a reciprocity requirement. The Government of Jordan hereby confirms the United States satisfies the reciprocity requirements with respect to access for duly qualified auditors, pharmacists, and geologists/geological engineers; licensing of medical testing and laboratory administration professionals; and publication of newsletters by foreign news agencies. Both Jordan and the United States will provide access in the above-mentioned sectors to each other’s suppliers consistent with their respective commitments under the GATS.”
Annex 3.1 contains the complete schedule of commitments by Jordan and the United States.33 In the U.S. schedule there are relatively few exemptions on specific service sectors and, as a result, Jordan already enjoys near complete access to the U.S. services market.34 Jordan, however, has limited access under its GATS commitments in all of its service sectors. Of the sectors where Jordan has made GATS commitments, it has a total of 222 exemptions across both horizontal commitments and sector-specific commitments
32 For a comprehensive review of the services provisions in other FTAs, see Stephenson (undated). 33 The schedules are configured in matrix form, with horizontal issues and individual service sectors listed along the vertical axis and commitments to provide market access, national treatment, and additional commitments along the horizontal axis. Each cell of the matrix records the existence or absence of commitments. Also in each cell numbered one to four represents the four modes of supply: (1) lmitations on cross-border supply; (2) limitations on consumption abroad, (3) limitations on commercial presence, and (4) limitations on presence of natural persons. Where commitments exist, details regarding the limitations appear after the corresponding number of the cell. The words ‘Unbound’ and ‘None’ appear in cells to either convey that a measure inconsistent with market access or national treatment may be introduced in the sector for a specific mode of supply without penalty. Unbound measures may grow more restrictive in the future, or convey that no sector-specific limitations apply for a specific mode of supply. Where all modes of supply are "Unbound" and no additional commitments have been undertaken for a given service sector, the sector does not appear in the schedule. Since the GATS covers 155 sectors and 4 modes of supply, there are 620 sector-mode supply combinations on which offers could be made. 34 The U.S. schedule comprises the initial schedule finalized in April 1994, plus two supplemental schedules. Supplement 1 lists U.S. commitments on financial services, finalized on July 1995; supplement 2 lists U.S. commitments on basic telecommunication services, finalized on February 1997.
Economic Impact and Implications for Jordan of the Jordan-U.S. FTA Draft Report
AMIR Program 53
for limitations on both market access and national treatment (see Table 7.2).35 In contrast, the United States has 93 exemptions in these areas and most of these are related to the temporary entry and stay of persons in the United States under its horizontal commitments. These exemptions are time-bound, lasting no longer than ten years after joining the WTO, and are subject to periodic review and negotiation in subsequent trade liberalizing rounds.
1. Impact on Jordan Service Imports Under the FTA, Jordan will expand its commitments to liberalize services trade with the United States by amending its laws and regulations over a three-year period.36 Under these conditions, there will be little distinction between international and domestic liberalization since external and internal market openings will parallel one another to ensure that persisting internal barriers do not contravene the potential benefits of more liberal access conditions. This approach is also reflected in the scope of market access commitments assumed by Jordan under the GATS. As underscored by the WTO (1997), those commitments extend to both discriminatory and non-discriminatory restrictions, covering measures targeted specifically against foreign suppliers as well as others affecting all market participants. According to the Atlas Investment Group (2000b), the major legal and regulatory changes will take place in the following four areas:
(1) Improving laws and regulations on intellectual property; (2) Raising allowable foreign investment; (3) Allowing non-Jordanian majority representation on company executive boards for
a number of sectors; and (4) Eliminating government support of service companies.
Since the FTA covers liberalization of all trade in services, the changes will open the Jordanian service industries to U.S. companies, especially in tourism, transport services, health and financial services – the largest service sectors, as well convention services, printing and publishing, courier services, audiovisual, education and environmental.
35 Market access commitments relate to the following areas: (1) maximum foreign ownership limitations: e.g. a maximum percentage limit on foreign shareholding or the total value of individual or aggregate foreign investment; (2) restrictions on the establishment of some kind of local representation; (3) limitation on the total number of service operations or on the total quantity of service output; (4) limitations on the total number of service personnel that may be employed in a particular service sector; (5) restrictions on the ability of service suppliers to choose the business form (e.g. company, partnership) in which they want to operate; and (6) limitations on the overall number of service suppliers allowed operating in the market, because of quota system or a monopoly situation. 36 According to the working party report of Jordan’s accession to the WTO (WTO, 1999), Jordan’s trade in services is primarily regulated by the Investment Promotion Law No. 16 for 1995, the Companies Law No. 1 for 1989, the Foreign Investment Regulation No. 39 for 1997, the Central Bank Law No. 19 for 1979, the Foreign Exchange Law No. 95 for 1966, the Banks' Law No. 24 for 1971, the Money Exchange Dealings Law No. 37 for 1992, the Labor Law No. 37 for 1988, and the Residency and Foreigners Affairs Law No. 5 for 1991.
Economic Impact and Implications for Jordan of the Jordan-U.S. FTA Draft Report
AMIR Program 54
The impact on Jordan’s economy is expected to be substantial. While the costs associated with great U.S. access to the Jordanian service sectors will be reflected in the services account of the balance of payments, there are more widespread benefits anticipated from improvements in the quantity of investment and the expertise required to upgrade and operate Jordan’s services sectors such as telecommunications. Moreover, early liberalization under the FTA will contribute substantially to the attractiveness of the country's location for new investment in modern services industries, and the globalization of Jordan’s service sectors.
Economic Impact and Implications for Jordan of the Jordan-U.S. FTA Draft Report
AMIR Program 55
Table 9.2 Jordan and U.S. GATS Commitments, by Sector
No. of Market Access
Limitations
No. of National
Treatment Limitations
No. of Market Access
Limitations
No. of National
Treatment Limitations
Horizontal Commitments 2 3 1 2 Sector-Specific Commitments, of which: 139 78 73 17 1. BUSINESS SERVICES 41 21 15 4 A. Professional Services 18 9 9 3 B. Computer and Related Services 1 1 1 - C. Research and Development Services 4 2 - - D. Real Estate Services 2 1 1 1 E. Rental/Leasing Services without Operators 2 1 - - F. Other Business Services 14 7 4 - 2. COMMUNICATION SERVICES 7 4 4 2 A. Courier services - - 1 - B. Telecommunication services 5 3 C. Audiovisual services 2 1 3 2 3. CONSTRUCTION AND ENGINEERING 2 - 4 - A. General construction work for buildings - - 1 - B. General construction work for civil engineering - - 1 - C. Installation and assembly work 1 - 1 - D. Building completion and finishing work 1 - 1 - 4. DISTRIBUTION SERVICES 5 2 4 - A. Commission agents' services 3 1 1 - B. Wholesale trade services - - 1 - C. Retailing services - - 1 - D. Franchising 2 1 1 - 5. EDUCATIONAL SERVICES 6 4 3 - A. Secondary education services 1 1 - - B. Higher education services 1 1 - - C. Adult education 2 1 2 - D. Other education services 2 1 1 - 6. ENVIRONMENTAL SERVICES 2 2 4 - A. Sewage services - - 1 - B. Refuse disposal services - - 1 - C. Sanitation and similar services 1 1 1 - D. Other 1 1 1 - 7. FINANCIAL SERVICES 22 15 23 10 A. All insurance and insurance-related services 7 4 9 3 B. Banking and other financial service 15 11 14 7 8. HEALTH RELATED AND SOCIAL SERVICES 4 2 1 1 A. Hospital services - - 1 1 B. Other Human Health Services 2 1 - - C. Social Services 2 1 - - 9. TOURISM AND TRAVEL RELATED SERVICES 10 5 4 - A. Hotels and restaurants (incl. catering) 6 3 1 - B. Travel agencies and tour operators services 3 1 2 - C. Tourist guides services 1 1 1 - 10. RECREATIONAL, CULTURAL SERVICES 6 5 5 - A. Entertainment services 3 2 1 - B. News agency services 1 1 1 - C. Libraries, archives, museums and others 1 1 1 - D. Sporting and other recreational services 1 1 2 - 11. TRANSPORT SERVICES 34 18 6 - A. Maritime Transport Services 10 6 - - B. Internal Waterways Transport 10 5 - - D. Rail Transport Services 8 4 2 - D. Road Transport Services 6 3 4 - Note: - Denotes either unbound or not included in the commitment schedule. Source: Derived from each country’s GATS commitment schedule.
Economic Impact and Implications for Jordan of the Jordan-U.S. FTA Draft Report
AMIR Program 56
2. Impact on Jordan Service Exports Services imports into the United States are generally free of tariffs, quotas and other common trade barriers. Import impediments instead take the form of prohibitions or restrictions on market access, which typically include licensing requirements and investment regulations. They exist at the federal, state and local levels, and are consistent with “national treatment” obligations under multilateral trade agreements if both U.S. and foreign firms face the same degree of restriction. Other U.S. service markets feature relatively few import restraints, mainly in the form of limitations on market access or national treatment. The United States does, nevertheless, restrict imports in certain service industries, especially transport, basic telecommunication and financial service industries. Fewer restraints are imposed on professional service industries such as the accountancy, legal, architecture, and engineering service industries. For Jordan at least four sectors may prove relevant to a number of economies: tourism, software development, transport and, possibly, health services. In these areas, Jordan may a have a strong interest in expanding its access to the U.S. market through the FTA. Tourism and Travel-Related Services - Tourism is the largest single source of foreign exchange earnings from non-factor services for Jordan, although year-to-year variations are large because of foreign travelers’ high responsiveness to the degree of political instability in the Middle East region.37 In the last five years, for example, the growth in the number of tourists arriving in Jordan ranged from –3.0 to 7.5 percent a year, and arrivals from the United States varied even more from year to year. All travel-related purchases by visitors to Jordan (e.g., transportation, lodging, and dining expenses) are counted as exports, as are sales of royalties and licensing fees (such as for manufacturing processes). Tour companies are an important component of tourism, and foreign-owned companies will increasingly dominate this sub-sector. Overseas tour operators based in and out of the country often handle tourists visiting Jordan. Owing to recognition and registration by such international bodies as the International Air Travel Association (IATA), World Air Transport Association (WATA) and the Society of Incentive Travel Executives (SITE), these large tour companies have a major advantage over local competitors. Moreover, affiliation to some of the major hotels enables them to provide a chain of integrated export services including tours, car hire, accommodations bookings and air ticketing. Because of the structure of the tourism industry in Jordan, the FTA will likely affect small businesses that are not operating at international standards. Large-size companies will likely be better able to face this challenge through mergers and acquisitions. Already large travel agencies are discussing mergers or some type of alliance with multilateral companies to operate as sub-agents of the recognizable larger companies. Nonetheless, in the tourism sector, trading conditions were already liberal before the conclusion of the
37 Travel encompasses all expenditures of non-resident individuals, including expenditures for goods as well as for services. For issues related to the recording of travel and other service categories, see Whichard (undated).
Economic Impact and Implications for Jordan of the Jordan-U.S. FTA Draft Report
AMIR Program 57
Uruguay Round. Like other countries, the United States and Jordan made a high number of commitments in major tourism sectors, notably hotels and restaurants. Software Development and IT Services - Jordan’s national strategy for the development of its information technology (IT) services sector is contained in the REACH Initiative (2000). The strategy aims to bolster the country's IT sector to compete in local, regional, and global markets, particularly in certain software development and IT service niches. The services most often delivered to foreign clients include systems integration,38 outsourcing39 and custom programming.40 At present, Jordan’s comparative advantage in this sector lies in its human capital resources, and its greatest potential lies in the Middle East region rather than the global market, particularly in the areas of software development from customization (Arabization), testing, implementation and maintenance. There is, nonetheless, a relatively strong potential for high-end remote processing and data management activities (REACH Initiative, 2000). The FTA will open opportunities for foreign investment in Jordan’s IT industry through both direct foreign investment and investments in support industries such as telecommunications. Development of Jordan’s IT export potential will be closely tied, on the one hand, to the growth and globalization of its telecommunications and education sectors and, on the other, to increased foreign collaboration, technical assistance, and venture capital from foreign investment in the sector.41 All these areas will be enhanced by the U.S.-Jordan FTA and will likely provide a convergence of telecommunications, computer technology and software development in Jordan. At the same time, regulatory and administrative improvements in intellectual property rights under the FTA will reduce software piracy and encourage U.S. companies to consider Jordan as a software development center. The FTA will provide an opportunity to Jordan to exploit the tight U.S. market for labor with the necessary skills for the IT industry. As noted by the REACH Initiative (2000), the United States is currently facing labor shortages in the IT sector. As a result, U.S. firms are outsourcing software development to India, Israel, Sri Lanka, Pakistan, Egypt, Russia, Ukraine, Poland, Hungary and other countries possessing capable IT workforces and infrastructure.
38 Systems integration comprises the development, operation, and maintenance of computer networks. Tasks involve all phases of systems design, including planning, coordinating, testing, and scheduling of projects; analysis and recommendation of hardware and software; system installation; software customization; and end-user training. 39 Outsourcing describes the practice of contracting out internal functions, ranging from low-skill services such as data entry to more complex functions such as managing a company’s telecommunication and computer networks. 40 Custom programmers create or modify software to perform tasks that are unique to client companies. 41 It is important to recognize, however, that venture capital is ‘hot money’ that is highly mobile. For this reason, foreign direct investment is often preferred over portfolio investments in an industry.
Economic Impact and Implications for Jordan of the Jordan-U.S. FTA Draft Report
AMIR Program 58
Jordan has no sector-specific limitations on (a) consultancy services related to the installation of software, (b) software implementation services, (c) data processing services and (d) ‘other’ computer services, except as they relate to Jordan’s horizontal exemption on the entry and temporary stay of persons. This restriction is in line with most other countries, where the proportion of full commitments on market access for presence of natural persons is only two percent when, like Jordan, horizontal limitations are taken into account (WTO, 1998). The sector-specific limitations listed under presence of natural persons usually concern quantitative limitations on the number of persons. The IT industry also includes companies which not only use, but, more importantly, design, build and supply the means for electronic commerce. Assemblage of computers, networks, software, and related computer services makes electronic commerce possible. Jordan has done little so far to integrate its IT into the fast growing business-to-business (B2B) electronic commerce, which has been one of the major channels by which companies have been able to overcome their distance to market limitations. Still, in computer services, proximity to the customer is essential because the best way to clearly identify market opportunities is through familiarity with cultural, administrative and regulatory issues that clients need to address. As a result, most service companies concentrate on regional and national markets, implying that commercial presence, in various forms, is an important mode.42 While the GATS directly addresses the progressive liberalization of computer services and other IT-related service sectors, it should be born in mind that the WTO agreements to eliminate tariff and non-tariff barriers on information and communication technology products are also of great importance to these services. The Information Technology Agreement and the Mutual Recognition Agreements on conformity assessment are expected to help reduce the cost of equipment essential to trade in computer and other services. They are also forecast to stimulate the growth of the IT industry and electronic commerce generally, and computer services in particular. Transport Services43 - International air transport is governed by (1) a network of bilateral agreements that regulate entry or directly restrict the competitiveness of foreign airlines, (2) domestic regulatory systems that effectively restrict entry of foreign carriers, (3) restrictions on ancillary domestic markets that impair a foreign carrier’s ability to compete, and (4) subsidization and state ownership of competing foreign airlines.44 The WTO does not cover this sector and has no effect on the operation of these non-tariff barriers (NTBs) to trade. Most U.S. regulation of air travel is through bilateral agreements or so-called Open Skies agreements that enable airlines from one country to fly to any city in the other country, 42 For details on the global IT service industry, see WTO (1998). 43 For an analysis of international shipping, transport, and related logistical services in the context of the GATS framework, see Francois and Wooton (2000). 44 See Findlay (1999) for an analysis of the existing regulatory environment in the industry and its impact on the competitiveness of developing countries in the market.
Economic Impact and Implications for Jordan of the Jordan-U.S. FTA Draft Report
AMIR Program 59
extend flights to third countries (“beyond rights”) and jointly market their services in code-sharing arrangements. To date, the United States has signed 33 full Open Skies agreements and a number of partial air service agreements. These agreements tend to increase competition, lower fares and freight rates, and expand trade and tourism in signatory countries. Nevertheless, the USITC (1999) has suggested that the benefits of the Open Skies agreements are likely to be less significant in countries like Jordan that have a small number of dominant carriers that control a substantial number of takeoff and landing slots.
Economic Impact and Implications for Jordan of the Jordan-U.S. FTA Draft Report
AMIR Program 60
Chapter 10: Conclusions The present study has examined the U.S.–Jordan FTA and assessed its impact on trade in goods and services of Jordan. It has specifically addressed three issues: (1) the comparative advantage of Jordan in exports of goods and services to the U.S. market relative to other countries in the Middle East region; (2) the effect of FTA-related tariffs, rules of origin, and other market access conditions on Jordanian exporting companies; and (3) the impact of the FTA on bilateral trade in services between Jordan and the United States. There are three central findings. First, the FTA will open many opportunities for Jordan to expand its exports to the U.S. market. The greatest opportunities will occur in the emerging export products that have the highest degree of trade compatibility with the United States. These products include Dead Sea cosmetics, orthopedic appliances, rugs and machinery. Although Jordan’s traditional exports are somewhat less compatible with U.S. foreign needs, there are nevertheless opportunities in such products as apparel and clothing accessories, aluminum bars and rods, animal feed and insecticides. Among the small and medium size exports, there will be opportunities in such wide-ranging products as olive oil, luggage, pharmaceuticals, household appliances, ceramic sinks and wash basins, paints and varnishes, jewelry, awnings, kitchenware, fruit and vegetable juices, chocolate and antibiotics. Jordan’s ability to exploit these opportunities will depend on several key factors determining its international competitiveness. Its macro dynamics are favorable to investment, but there are mixed reviews on its factor and infrastructure costs, and recent movements in the real exchange rate has undermined Jordan’s competitiveness relative to nearly all other Middle Eastern countries. Second, U.S. exports to Jordan are expected to grow substantially as a result of the FTA. Since there is a large amount of two-way trade in many traded products, the elimination of trade barriers between Jordan and the United States will favor the most efficient producers. In Jordan, inefficient industries with particularly high levels of protection will be most vulnerable, and the FTA will liberate valuable resources from less productive sectors for use in Jordan’s true comparative advantage industries. These industries can be identified from the two-way trade calculations provided by this study, along with estimates of each industry’s effective rate of protection. Our estimate of the ERP for the furniture demonstrates that the level of protection in this one industry is larger than simple nominal rates of protection would reveal. This type of information would be valuable to both the private and public sectors in adjusting to the FTA. Third, expectations about the FTA effects on services trade are supported by the findings of this study. Calculations of the proportion of market access constraints on individual service sectors show that Jordan’s sectors are considerable more protected. The FTA will therefore open more new opportunities for U.S. businesses in Jordan than for Jordanian businesses in the United States. While these service inflows will lower Jordan’s current surplus in the services account, they will bring with them much needed FDI associated
Economic Impact and Implications for Jordan of the Jordan-U.S. FTA Draft Report
AMIR Program 61
with technological transfers and provide other types of externalities to the Jordanian economy. Recognition of these changes will help Jordanian businesses adjust and exploit these new opportunities under the FTA. Finally, the present study has pointed to a number of areas that should be examined in greater detail by the Jordanian business community: Jordan’s International Competitiveness – Comparative factor and infrastructure cost data for Jordan and other Middle East countries are essential for gauging the competitiveness of industries in the U.S. and global markets. While the limited timeframe of the present study hampered data collection, such data would be useful to both the public sector in formulating policies and the private sector in determining investment opportunities. Moreover, it would help to identify likely areas of FDI inflows into the country. FTA Impact on Jordan’s Effective Rates of Protection – In order to gauge the impact of the FTA on Jordan’s import-competing industries, the analysis of effective rates of protection conducted in this study for furniture could be extended to other Jordanian industries. It is possible to derive the technical coefficients of production from selective interviews with businesses in the leading industries that are likely to compete with U.S. imports and benchmarking the results with other input-output tables. Future work in this area would be valuable to Jordanian businesses in evaluating their competitiveness. Export Revenue Gains from the FTA and Output and Employment Effects – The export revenue gains to Jordan from the FTA calculated in the present study are intended to be primarily illustrative. Further detailed estimates of the potential revenue gains using statistically estimated price elasticities would provide more realistic estimates of possible revenue gains, as would economy-wide estimates of the dynamic effects of the FTA on output and employment of industries. FTA Rules of Origin and Their Trade-Creating and Trade-Diverting Effects – In the short run, the rules of origin can raise the cost of industries trying to meet the requirements by shifting to higher cost inputs from domestic sources. The FTA may therefore be trade diverting if there is a shift from lower to higher cost sources of supply, rather than having the desired effect of being trade creating by shifting production from higher to lower cost sources of supply. In the long run, the effects are highly dependent on the form of the structure of the industry and its market. Future work should examine these effects at the industry level. Regulatory Constraints in U.S. Market for Jordanian Service Exports – Although services imports into the United States are generally free of tariffs, quotas, and other common trade barriers, import impediments in the form of prohibitions or restrictions on market access will inhibit Jordan’s ability to access that market. The impediments typically take the form of licensing requirements and investment regulations at the federal, state and local levels. Jordan’s interest in tourism, software development, transport and health services suggests the need for more detailed analysis of existing impediments in the U.S. market for these industries.
Economic Impact and Implications for Jordan of the Jordan-U.S. FTA Draft Report
AMIR Program 62
Annex A: Methodological Notes
A. Modeling Price and Income Effects Expenditure-switch policies in the form of tariffs create a ‘price wedge’ between the domestic price to the consumer in the United States and the world market price of the product. These measures effectively impose a tax on the consumer. The effective tax rate, denoted t, raises the price of the product to (1+t)P in the United States. We can express the demand for imports (M) of the United States as related to that tariff-adjusted price {[(1+t)P/D}, as well as income (Y) in the following expression: M = k1Yε [(1+t)P/D]γm (A.1) The incidence on the consumer of the effective price rise of the product by [(1+t)P – P would be to reduce the quantity of the product demanded. The relative prices of Jordan and its competitors to the U.S. market remain unaltered: that of Jordan (denote i) is Pi/P and that of its competitors (denoted k) is Pk/P. The demand function for Jordan is therefore: X = k2M[Pi/P]γx (A.2) A change in the quantity demanded of the product because of protectionist measures in the U.S. market would cause a proportional change in the demand for the product supplied by Jordan and other foreign suppliers to the U.S. market. Equation (A. 1) shows that the effect of trade liberalization in the U.S. market for Jordanian goods will depend on the price elasticity of import demand γm and the tariff rate t of protection in that market. The dynamic specification of import demand, M, in terms of income, Y, and the price of the product, P, relative to the general price index, D, can be expressed as: mt = α0 + α 1mt-1 + β1yt + β2yt-1 + γ1(p-d)t + γ2(p-d)t-1 + ut ...(A.3) where lower case letters denote logarithms of corresponding capital letters, e.g., (p-d) = ln(P/D), and the expected signs of the coefficients are 0 < α 1 < 1; β1 and β2 >0; γ1 and γ2 < 0. Income is treated as (weakly) exogenous for the parameters of interest. The use of the logarithmic specification in equation (A.3) provides a means by which the elasticity can be calculated directly from the estimated equation; the results are consistent
Economic Impact and Implications for Jordan of the Jordan-U.S. FTA Draft Report
AMIR Program 63
when the elasticities remain constant over time. Tests of parameter constancy provide a means of validating that hypothesis.45 On a steady-state growth path, the long-run dynamic equilibrium relationship implicit in equation (A.8) is: M = k1Yε [(1+t)P/D]γm ...(A.4) where ε = (β1 + β2)/(1-α 1) and γm = (γ1 + γ2)/(1-α 1). B. Effective Rate of Protection The Concept of Effective Rate of Protection - Countries such as Jordan apply tariffs to generate fiscal revenue and to protect industries from foreign competition. The measure of that protection is given by the nominal rate of protection (NRP), which accounts for the extent to which output prices can be raised by domestic firms relative to border prices under protection from foreign competition. In addition to the resource pull into protected sectors, there may be offsetting effects from tariffs on tradable inputs that artificially raise the input prices and the associated costs to firms in the protected sectors. The measure of the net effect of the resource pull and higher costs associated with a tariff schedule is given by the effective rate of protection (ERP). The ERP measures the effect of a country’s tariff schedule on the incentives to producers in an industry to expand or contract their activities relative to a situation of free trade. In contrast to the NRP, therefore, the ERP measures the effect on the value added derived from both the benefit of protection to an industry and the cost to it from the tariffs applied to its inputs. Measuring the Effective Rate of Protection – The ERP for a product j is the percentage excess of domestic value added, V, over the international market value added, W, i.e., that value added that would have been realized in the absence of the existing tariff structure: ERPj = (Vj - Wj) / Wj.. This measure is intuitively appealing insofar as it allows us to express the ERP in terms of border and domestic price equivalents for specific industries in Jordan. Alternatively, we can measure the ERP as the difference between the tariff on the final product and the weighted sum of tariffs on inputs to the product. Formally, we denote the output tariff for industry j by tj, the input tariff for tradable input i by ti, and the amount of input i in a unit of product j by aij. The NRP is given by tj (or in percentage, tj x 100), while the ERP is given by (tj - Σi ti aij)/(1 - Σi aij) , where Σi denotes “summation” over i and the aij in the numerator corresponds to the tariff situation and that in the denominator to free trade situation.
45 For details on the specification and estimation of import and export demand equations, see Lord (1991).
Economic Impact and Implications for Jordan of the Jordan-U.S. FTA Draft Report
AMIR Program 64
Ideally, the input-output coefficients would be measured with and without the current tariff distortions. As a practical matter, of course, free trade is not observable and so some adjustments must be made. This is done by recognizing that the observed unit-value input-output coefficient aij’ – where “ ’ “ denotes the tariff distorted situation – reflects the border price of input i inflated by a factor of (1 + ti) in the numerator and the border price of output j inflated by a factor of (1 + tj) in the denominator. Thus, the free trade value of aij is recovered by multiplying the observable coefficient aij’ by the adjustment factor (1 + tj)/(1 + ti). Using this alternative methodology, we can calculate the ERP in the following manner:
Let Wj = Pj(1 - Σiaij’) Vj = Pj[(1+tj) - Σiaij’ (1+ti)] where: aij = technical coefficient of input in activity j, i.e., the value of input i per unit value
of output in activity j; tj = nominal rate of protection of production of j; ti = nominal rate of protection of input i. Then we can express the level of effective protection as follows:
ERPj = {Pj[(1+tj) - Σiaij’ (1+ti)] / Pj(1 - Σiaij’)} – 1 (A.5) Rearranging terms yields the formula used to estimate the level of effective protection:
ERPj = (tj - Σiaij’ti)/(1 - Σiaij’) (A.6)
= {(1 - Σ aij’)/([1/(1 + tj)] – [Σ[aij’/(1 + ti)]]} – 1 (A.7) The ERP can exceed, equal, or fall short of the NRP depending on whether input tariffs are lower or higher relative to the output tariff. A negative ERP suggests that an industry is being taxed more heavily on its inputs than its final product.
C. Revealed Comparative Advantage (RCA) Index The index of revealed comparative advantage (RCA) used in this study is specified as follows: RCAij = (Xij / Xj) / (Xi / X) (A.8) where, Xij = exports of product i from country j. Xi = exports of product i from the world.
Economic Impact and Implications for Jordan of the Jordan-U.S. FTA Draft Report
AMIR Program 65
Xj = exports of all goods from country j. X = exports of all goods from the world. The RCA index compares a country's exports of a product (normalized with respect to the value of its total exports) to the share of that product in world trade. The normalization with respect to the value of total exports adjusts for country size. In this way small country output can be compared with that of the large countries in the region. The index also scales for product significance as a way of accounting for the importance of trade in one good relative to that of all goods. The interpretation of the RCA index is as follows: an RCA value greater than one implies a comparative advantage since the nation's ratio of product exports to total exports of all goods is greater than the comparable ratio for the world. In contrast, an RCA value of less than one implies a comparative disadvantage. The index takes into consideration several market ratios when adjusting for country size and product significance, and gives useful information depending on how the terms in the formula are arranged. In the formula above, the index is expressed as the share of the product division with respect to total exports for the specific country or region (Xij/Xj), given the same world's share (Xi/X). This interpretation is useful when analyzing countries’ RCA indices since it shows the degree of export concentration across products.
Economic Impact and Implications for Jordan of the Jordan-U.S. FTA Draft Report
AMIR Program 66
Annex B: U.S.-Jordan FTA and GATS Service Commitments Table B.1 Jordan and U.S. GATS Commitments, by Sector
Jordan United States
No. of Market Access
Limitations
No. of National
Treatment Limitations
No. of Market Access
Limitations
No. of National
Treatment Limitations
Horizontal Commitments 2 3 1 2 Sector-Specific Commitments, of which: 139 78 73 17 1. BUSINESS SERVICES 41 21 15 4 A. Professional Services 18 9 9 3 a. Legal Services 1 2 1 1 b. Accounting, auditing and bookeeping services 4 1 2 1 c. Taxation Services 1 1 1 - d. Architectural services 3 - 2 - e. Engineering services 2 - - - f. Integrated engineering services - 2 1 1 g. Architectural services 2 - 2 - h. Medical and dental services 2 1 - - i. Veterinary services - - - - j. Services provided by midwives, nurses 1 1 - - k. Other 2 1 - - B. Computer and Related Services 1 1 1 - a. Consultancy services related to hardware - - - - b. Software implementation services - - - - c. Data processing services 1 1 - - d. Data base services - - 1 - C. Research and Development Services 4 2 - - a. R&D services on natural sciences 2 1 - - b. R&D services on social sciences and humanities - - - - c. Interdisciplinary R&D services 2 1 - - D. Real Estate Services 2 1 1 1 a. Involving own or leased property - - 1 1 b. On a fee or contract basis 2 1 - - E. Rental/Leasing Services without Operators 2 1 - - a. Relating to ships - - - - b. Relating to aircraft - - - - c. Relating to other transport equipment - - - - d. Relating to other machinery and equipment 2 1 - - F. Other Business Services 14 7 4 - a. Advertising services 2 1 1 - b. Market research and public opinion polling services - - 1 - c. Management consulting service - - 1 - d. Services related to man. consulting 1 1 1 - e. Technical testing and analysis services 2 1 1 - f. Services incidental to agriculture, hunting and forestry 1 - 1 - g. Services incidental to fishing 1 1 1 - h. Services incidental to mining - - 1 - i. Services incidental to manufacturing - - - - j. Services incidental to energy distribution - - 1 - k. Placement and supply services of personnel - - 2 -
Continued
Economic Impact and Implications for Jordan of the Jordan-U.S. FTA Draft Report
AMIR Program 67
Table B.1 (Continued) Jordan and U.S. GATS Commitments, by Sector
Jordan United States
No. of Market Access
Limitations
No. of National Treatment Limitations
No. of Market Access
Limitations
No. of National Treatment Limitations
l. Investigation and security - - 2 1 m. Related scientific and technical consulting 2 1 1 - n. Maintenance and repair of equipment - - 1 - o. Building-cleaning services 1 1 1 - p. Photographic services - - 1 - q. Packaging services - - 1 - r. Printing, publishing 2 - 2 - s. Convention services 2 1 1 - 2. COMMUNICATION SERVICES 7 4 4 2 A. Postal services - - - - B. Courier services - - 1 - C. Telecommunication services 5 3 a. Voice telephone services 1 1 - - b. Packet-switched data transmission services - - - - c. Circuit-switched data transmission services 1 - - - d. Telex services 2 - - - e. Telegraph services - 1 - - f. Facsimile services - - - - g. Private leased circuit services - - - - h. Electronic mail 1 - - - i. Voice mail - - - - j. On-line information and data base retrieval - 1 - - k. Electronic data interchange (EDI) - - - - l. Enhanced/value-added facsimile services - - - - m. Code and protocol conversion - - - - n. On-line information and/or data processing - - - - D. Audiovisual services 2 1 3 2 a. Motion picture and video tape production - - 1 2 b. Motion picture projection service - - 1 - c. Radio and television services 2 1 1 - 3. CONSTRUCTION AND ENGINEERING 2 0 4 - A. General construction work for buildings - - 1 - B. General construction work for civil engineering - - 1 - C. Installation and assembly work 1 - 1 - D. Building completion and finishing work 1 - 1 - 4. DISTRIBUTION SERVICES 5 2 4 - A. Commission agents' services 3 1 1 - B. Wholesale trade services - - 1 - C. Retailing services - - 1 - D. Franchising 2 1 1 - E. Other - - - - 5. EDUCATIONAL SERVICES 6 4 3 - A. Primary education services - - - - B. Secondary education services 1 1 - - C. Higher education services 1 1 - - D. Adult education 2 1 2 - E. Other education services 2 1 1 -
Continued
Economic Impact and Implications for Jordan of the Jordan-U.S. FTA Draft Report
AMIR Program 68
Table B.1 (Continued) Jordan and U.S. GATS Commitments, by Sector Jordan United States
No. of Market Access
Limitations
No. of National Treatment Limitations
No. of Market Access
Limitations
No. of National Treatment Limitations
6. ENVIRONMENTAL SERVICES 2 2 4 - A. Sewage services - - 1 - B. Refuse disposal services - - 1 - C. Sanitation and similar services 1 1 1 - D. Other 1 1 1 - 7. FINANCIAL SERVICES 22 15 23 10 A. All insurance and insurance-related services 7 4 9 3 a. Life, accident and health insurance services 1 1 2 1 b. Non-life insurance services 2 1 2 1 c. Reinsurance and retrocession 2 1 4 1 d. Services auxiliary to insurance 2 1 1 - B. Banking and other financial service 15 11 14 7 a. Acceptance of deposits and other repayable - 1 2 1 b. Lending of all types - 1 2 1 c. Financial leasing - - 2 1 d. All payment and money transmission services 2 1 2 1 e. Guarantees and commitments - - 2 1 f. Trading for own account or for account of customers 4 1 2 1 g. Participation in issues of all kinds of securities - - 2 1 h. Money broking 1 1 - - i. Asset management 3 2 - - j. Settlement and clearing services for financial assets 2 2 - - k. Advisory and other auxiliary financial services 2 1 - - l. Provision and transfer of financial information 1 1 - - 8. HEALTH RELATED AND SOCIAL SERVICES 4 2 1 1 A. Hospital services - - 1 1 B. Other Human Health Services 2 1 - - C. Social Services 2 1 - - 9. TOURISM AND TRAVEL RELATED SERVICES 10 5 4 - A. Hotels and restaurants (incl. catering) 6 3 1 - B. Travel agencies and tour operators services 3 1 2 - C. Tourist guides services 1 1 1 - 10. RECREATIONAL, CULTURAL SERVICES 6 5 5 - A. Entertainment services 3 2 1 - B. News agency services 1 1 1 - C. Libraries, archives, museums and others 1 1 1 - D. Sporting and other recreational services 1 1 2 - 11. TRANSPORT SERVICES 34 18 6 - A. Maritime Transport Services 10 6 - - a. Passenger transportation - - - - b. Freight transportation 4 2 - - c. Rental of vessels with crew 1 1 - - d. Maintenance and repair of vessels 5 3 - - e. Pushing and towing services - - - - f. Supporting services for maritime transport - - - -
Continued
Economic Impact and Implications for Jordan of the Jordan-U.S. FTA Draft Report
AMIR Program 69
Table B.1 (Continued) Jordan and U.S. GATS Commitments, by Sector Jordan United States
No. of Market Access
Limitations
No. of National Treatment Limitations
No. of Market Access
Limitations
No. of National Treatment Limitations
B. Internal Waterways Transport 10 5 - - a. Passenger transportation - - - - b. Freight transportation 2 1 - - c. Rental of vessels with crew 2 1 - - d. Maintenance and repair of vessels 2 1 - - e. Pushing and towing services 2 1 - - f. Supporting services for internal waterway transport 2 1 - - E. Rail Transport Services 8 4 2 - a. Passenger transportation - - - - b. Freight transportation 2 1 2 - c. Pushing and towing services 2 1 - - d. Maintenance and repair of rail transport equipment 2 1 - - e. Supporting services for rail transport services 2 1 - - F. Road Transport Services 6 3 4 - a. Passenger transportation - - - - b. Freight transportation 2 1 3 - c. Rental of commercial vehicles with operator 2 1 - - d. Maintenance and repair of road transport equipment 2 1 1 - Note: - Denotes either unbound or not included in the commitment schedule. Source: Derived from each country’s GATS commitment schedule.
Economic Impact and Implications for Jordan of the Jordan-U.S. FTA Draft Report
AMIR Program 70
Table B. 2 U.S.-Jordan FTA Commitments versus Jordan’s GATS Commitments GATS Commitment FTA Commitments (Extra Liberalization
to the WTO) Remarks
Horizontals No Change has been instituted to WTO commitments. In Mode (4): Presence of Natural Persons Intra-corporate transferees who are executives, managers and
specialists (as defined) are not subject to the economic needs test requirements excluding those in the fields of financial services (insurance, banking and other financial services) and services incidental to energy distribution. However, intra-corporate transferees in the field of financial services (insurance, banking and other financial services) who are executives, managers and specialists (as defined) are presumed to meet the economic needs test requirements. Temporary work and residency permits are required. Such permits are issued for a maximum period of one year, but are renewable automatically as long as the work or residency permit holder continues to maintain his/her status within the juridical entity employing him/her.
MFN reciprocity Requirements Both Parties integrated the WTO Accession agreed upon Memorandum of Understanding in which Jordan confirmed that the United States satisfies the reciprocity requirements with respect to access for duly qualified auditors, pharmacists, and geologists/geological engineers; licensing of medical testing and laboratory administration professionals; and publication of newsletters by foreign news agencies. Both countries will provide access in the above-mentioned sectors to each other’s suppliers consistent with their respective commitments under the GATS.
B. Sector Specific Commitments 1. Business Services A. Professional Services (a) Legal services (advisory services on foreign law only (excluding Jordanian Law) (part of CPC 861) (b) Auditing (part of CPC 862) (b) Accounting and bookkeeping services (part of CPC862) (c) Taxation services (CPC 863) (d) Architectural services (CPC 8671) (e) Engineering services (CPC 8672) (g) Urban planning and landscape architectural services (CPC 8674) (h) Medical services (excluding Dental services) (CPC 9312) (j) Services provided by midwives, nurses, physiotherapists (CPC 93191) (k) Other
(i) Veterinary Services (CPC 93201).
No Commitment was made in mode (1) & (2). In Mode (3) Access restricted to veterinarians who must be Jordanian nationals. Nationality requirement for the Veterinarians.
Economic Impact and Implications for Jordan of the Jordan-U.S. FTA Draft Report
AMIR Program 71
B. Computer and Related Services (a) Consultancy services related to the installation of computer hardware (CPC 841) (b) Software implementation services (CPC 842) (c) Data processing services (CPC 843) (d) Data base services (CPC 844) (e) Maintenance and repair services of office machinery and equipment including computers (CPC 845) (f) Other computer services (CPC 849)
No Change has occurred.
Originally a liberal sector.
C. Research and Development Services (a) R & D services on natural sciences (CPC 851) excluding geology related sciences (b) R & D services on social sciences and humanities (CPC 852) (c) Inter disciplinary R & D services (CPC 853)
(a) R & D services on natural Sciences (CPC 851) excluding geology related sciences
At the WTO, Mode (3) was subject to 50% foreign equity limitation. FTA allows a 100% foreign equity ownership. Mode (4) Director of research center must be a Jordanian national.
D. Real Estate Services (a) Real estate services involving own or leased property (CPC 8210) (b) On a fee or contract basis (CPC 822)
No Change
Mode (3) Access restricted to Jordanian natural persons. Juridical entities are not allowed. Real estate agents and licensed surveyors must be Jordanian nationals.
E. Rental/leasing service without operators (a) Leasing or rental services concerning ships without operators (CPC 83103) (d) Relating to other machinery and equipment (CPC 83106-83109)
(a) Leasing or rental services concerning ships without operators (CPC 83103) (3) Subject to 60% foreign equity limitation. Starting no later than 1 January 2002, 100% foreign equity will be permitted. (d) Leasing or rental services relating to other machinery and equipment, specifically agricultural machinery and equipment (CPC 83106) (3) Subject to 50% foreign equity limitation. Starting no later than 1 January 2002, 100% foreign equity will be permitted. (d) Leasing or rental services relating to other machinery and equipment (excluding engines and turbines) (CPC 83107-83109) (3) Subject to a 50% percent equity limitation.
At the WTO, sub-sectors under (CPC 83106 – 83109) were all grouped together with a Mode (3) equity limitation of 50%. In the FTA, extra liberalization occurred in rental and leasing services of agricultural machinery and equipment.
Economic Impact and Implications for Jordan of the Jordan-U.S. FTA Draft Report
AMIR Program 72
F. Other business services (a) Advertising services (CPC 871) (b) Market research (CPC 86401) (c) Management consulting service (CPC 865) (d) Services related to management consulting (CPC 866) (q) Packaging services (CPC 876)
(a) Advertising services (CPC 871)
In Mode (3) a maximum of 50% foreign equity, is committed. Director of advertising agency must be a Jordanian national.
(b) Public Opinion Polling Services (CPC 86402)
No Change
Director of public opinion bureau must be a Jordanian national.
(e) Technical testing and analysis services (CPC 8676)
No Change
Mode (3) 50% Foreign Equity allowed. Cabinet authorization is required. Geologists/ geological engineers must be Jordanian nationals.
(f) Services incidental to agriculture (CPC 8811) (f) Services incidental to animal husbandry, only advisory and consultancy services (part of CPC 8812) (i) Services incidental to manufacturing (CPC 884 & 885)
(g) Services Incidental to fishing (CPC 882) (j) Services Incidental to energy distribution (CPC 887) (k) Placement and supply services of personnel (CPC 872)
At the WTO, Mode (3) was subject to 50% foreign equity limitation. In the FTA a 100% foreign equity is permitted. In the services incidental to animal husbandry, it was maintained that Supervisor must be a Jordanian veterinarian. (g) Extra Service commitment that is fully liberalized. (j) Extra Service commitment with Mode (3) Subject to Cabinet authorization or concession agreements are provided on a national treatment basis. Number of services providers and concessions may be restricted. (k) Extra Service commitment with Mode (3) Subject to 50% foreign equity limitation and to any other limitations on legal form provided by the Jordanian law.
(m) Related scientific and technical consulting services (part of CPC 8675) excluding prospecting, surveying, exploration, exploitation and map making (n) Maintenance and repair of equipment (not including maritime vessels, aircraft, or other transport equipment and television and radio transmitters and apparatus for line telephony or telegraphy; and radio broadcast equipment) (CPC 633, 8861-8866) (o) Building/ Cleaning services (CPC 874) (p) Photographic services (excluding military portraits and aerial photography of the territory of the Hashemite Kingdom of Jordan) (CPC 875)
No Change
(s) Convention services (CPC 87909)
(s) Convention services (CPC 87909)
At the WTO, Mode (3) was subject to 50% foreign equity limitation. FTA permits a 100% foreign equity.
(r) Printing and Publishing (CPC 88442)
(r) Printing and Publishing (CPC 88442)
The FTA commitment increased the foreign equity allowed in Mode (3) from a 50% foreign equity limitation, at the WTO, to 60%. Director of printing and publishing house must be a Jordanian national.
Economic Impact and Implications for Jordan of the Jordan-U.S. FTA Draft Report
AMIR Program 73
2. COMMUNICATION SERVICES A. Postal Services A. Postal Services No Commitments were made in both Agreements. B. Courier services (CPC 7512)
B. Courier services (CPC 7512) (3) Subject to 60% foreign equity limitation. Starting no later than 1 January 2002, 100% foreign equity will be permitted.
At the WTO, Mode (3) was subject to 51% foreign equity limitation. Starting no later than 1 January 2004, 100% foreign equity will be permitted.
C. TELECOMMUNICATION SERVICES No Change No Change
D. Audio Visual Services (a) Motion picture and video-tape production and distribution services (CPC 9611) (b) Motion picture projection service (CPC 9612) (c) Sound recording
(c) Radio and television services (CPC 9613) (1) & (2) None, except unbound for transmission, (3) None, subject to Cabinet approval provided approval is not based on market access or national treatment restrictions. (d) Radio and television transmission services (CPC 7524) (1) & (2) Unbound (3) None, subject to Cabinet approval provided approval is not based on market access or national treatment restrictions.
(a) & (b) No Change, however, distribution outside Jordan is not subject to a foreign equity limitation, as is the case in the WTO commitment. (i.e.)Mode (3) None, except motion picture and videotape distribution services is subject to 50% foreign equity limitation. Director of retail outlet must be a Jordanian national. (c) Extra Service commitment (d) Extra Service commitment
5. EDUCATIONAL SERVICES Commercial presence (in mode 3) is subject to 51% foreign equity limitation. Starting no later than 1 January 2004 , 100% foreign equity will be permitted. A. Primary educational services (CPC 921) B. Secondary educational services (CPC 922) C. Higher educational services (CPC 923) D. Adult education Services (CPC 924) E. Other education services (CPC 929), specifically cultural centers
Commercial presence (in mode 3) is subject to 60% foreign equity limitation. Starting no later than 1 January 2002, 100% foreign equity will be permitted.
Extra liberalization in foreign equity limitation and a 2 year earlier date for a 100% foreign equity to be allowed. Mode (4) Director of adult education center and cultural center must be a Jordanian national.
6. ENVIRONMENTAL SERVICES A. Sewage Services A. Sewage Services No commitment was made at the WTO or FTA. B. Refuse Disposal Services
B. Refuse Disposal Services: collection and treatment of solid waste services (part of CPC 9402) excluding collection and treatment of hazardous waste.
No commitment was made at the WTO. Mode (3) Subject to 50% foreign equity limitation and to any other limitations on legal form provided by the Jordanian law. Establishment and provision of services are subject to Cabinet authorization and to an agreement with the Jordanian Government. Number of service providers may be restricted. Service providers are not allowed to import or to use imported garbage, trash, rubbish and waste for the purpose of providing these services.
7. FINANCIAL SERVICES A. Insurance and insurance-related services (CPC 812)
Economic Impact and Implications for Jordan of the Jordan-U.S. FTA Draft Report
AMIR Program 74
(a) Life, insurance services including health insurance services (CPC 81211) and (CPC 81212) excluding pension fund management. (b) Non- life insurance services (including accident insurance) (CPC 8129) ( c ) Reinsurance and retrocession (CPC 81299)
No Change
Mode (3) Access is restricted to public share holding companies constituted in Jordan and to branches of foreign insurance companies.
At the WTO, Mode (3) Access restricted to Jordanian natural persons, Jordanian general partnerships with majority ownership by Jordanians, and limited liability companies with Jordanians as majority in board of directors. Insurance agent or director of agent company must be a Jordanian national. In the FTA a maximum of 50 percent foreign Equity was committed for general partnerships.
B. Banking and Other Financial Services (excluding insurance) The establishment of a commercial presence (in mode 3 only) or the conduct of new activities is restricted to Public Shareholding companies constituted in Jordan, and to branches and subsidiaries of foreign banks, unless otherwise stated in the specific sub-sector. Furthermore, it is noted that only Banks may undertake activities involving the acceptance of deposits and other repayable funds from the public (CPC 81115-81119 excluding CPC 81117) and extend guarantees and commitments services (CPC 81199**) and money broking (CPC 81339**). Financial service companies as seen in sub-sector entries below may provide all other financial activities. Financial service companies are licensed to undertake Investment Trusteeship, Investment Management, Financial Consultations Financial Brokerage, Depository, and Management of Primary Issues. (a) Acceptance of deposits and other repayable funds from the public (CPC 81115-81119 excluding CPC 81117) (e) Guarantees and Commitments ( CPC 81199**) (h) Money broking (CPC 81339**) (b) Lending of all types including consumer credit, factoring, mortgage credit, and financing of commercial transaction (CPC 8113) (c) Financial leasing (CPC 8112) (d) All payment and money transmission services (CPC 81339) (f) Trading for own account or for account of customers, whether on an exchange, in an over-the-counter market or otherwise, the following: • Money market instruments (checks, bills and
certificates of deposits) (CPC 81339**) • Foreign Exchange (CPC 81333) • Derivative products incl., but not limited to, futures
and options (CPC 81339**) • Exchange rate and interest rate instruments,
including products such as swaps and forward rate agreements (CPC 81339**)
• Transferable securities • (CPC 81321)
(d) All payment and money transmission services, credit, charge and debit cards, travelers’ checks and bankers drafts. (k) Intermediation services have been included. (l) “suppliers of other financial services”
Reference to (CPC 81339**) has been deleted and all related services have been incorporated in the FTA (with the current limitations),i.e. Mode (3) Service must be provided through banks and specialized financial companies. Details of service (d) to be allowed have been spelled out: e.g. , credit, charge and debit cards, travelers’ checks and bankers drafts. Limitations have not changed in FTA
National Treatment Limitation Mode (1) Real property in Jordan may not be mortgaged to banks outside Jordan. Mode (4) Unbound, except as indicated in the horizontal section. Branches of foreign banks are required to have a resident regional manager. Mode (1) and (2) None, except for derivative products, unbound. Mode (3) Access restricted to: a. Banks b. Financial services companies constituted in Jordan, in the form of public shareholding company, limited liability company or a limited partnership in shares company. (g) Mode (1) Unbound. Mode (2) Unbound, except for issuance and public offer of securities outside Jordan by foreign service providers abroad, and
Economic Impact and Implications for Jordan of the Jordan-U.S. FTA Draft Report
AMIR Program 75
• Other negotiable instruments and financial assets, including bullion (CPC 81339**)
(g) Participation in issues of all kinds of securities, incl. under-writing and placement as agent (whether publicly or privately) and provision of service related to such issues. (i) Asset management, such as cash or portfolio management, all forms of collective investment management, custodial, depository, trust services, and pension fund management. (j) Settlement and clearing services for financial assets including securities, derivative products and other negotiable instruments. (k) Advisory and other auxiliary financial services on all the activities (a - l) , incl. credit reference and analysis, investment and portfolio research and advice, advice on acquisitions and on corporate restructuring and strategy (l) Provision and transfer of financial information as related to financial data processing and related software by providers of other financial services
for management by service suppliers outside Jordan of assets that are not traded on Amman Financial Market or otherwise traded in Jordan. Mode (3) Access restricted to: a. Financial services companies constituted in Jordan, in the form of public shareholding company, limited liability company or a limited partnership in shares company. b. Licensed banks through affiliated companies or separate accounts. (j) Mode (1) Unbound *, Mode (2) None Mode (3) Access restricted to the Depository Center at the Amman Bourse for securities and to the Central Bank of Jordan for all other financial instruments. (k) Intermediation is defined as acting as an intermediary between persons or parties including as an agent, finder (one who identifies business opportunities) or mediator. Limitations have been maintained. Mode (1) & (2) None, while Mode (3) Access restricted to: a. Financial services companies constituted in Jordan, in the form of a public shareholding company, limited liability company or a limited partnership in shares company. b. Banks. (l) The technical difference between a service provider and supplier is targeted. No change in limitations, Mode (1), (2) & (3) None.
8. HEALTH RELATED & SOCIAL SERVICES (other than those listed under 1.A.) Commercial presence (in mode 3) is subject to 51% foreign equity limitation. Starting no later than 1 January 2004, 100% foreign equity will be permitted. A. Hospital services (CPC 9311) C. Social services (CPC 933). Specifically, these are nursing homes, convalescent homes, rehabilitation centers B. Other human health services, specifically medical labs (CPC 93199)
Commercial presence (in mode 3) is subject to 60% foreign equity limitation. Starting no later than 1 January 2002, 100% foreign equity will be permitted.
Extra liberalization in foreign equity limitation and a 2 year earlier date for a 100% foreign equity to be allowed. Mode (3) One of the owners must be a physician except in a public limited company. Mode (4) Unbound, except as indicated in the horizontal section. At least 3/4 of physicians in any hospital or nursing or convalescent homes must be Jordanian nationals; at least 1/2 of all staff must be Jordanian nationals. Mode (1), (2) and (3) None. Mode (4) Lab. director must be a Jordanian national.
9. TOURISM AND TRAVEL RELATED SERVICES A. Hotel & motel lodging services, excluding casinos(CPC 6411 & 6412) Meal serving services with full restaurant services (excluding transport facilities) (CPC 6421) Meal serving services in self-serving facilities (cafeterias) (CPC 6422) Beverage serving services for consumption on the premises,
Mode (3) Subject to 50 percent foreign equity limitation. Jordanian juridical entity is required for franchising. Foreign equity limitation does not apply to these services when operated in hotels, motels “or tourist classified restaurants” is added for the purposes of the FTA.
Economic Impact and Implications for Jordan of the Jordan-U.S. FTA Draft Report
AMIR Program 76
excluding casinos (CPC 643) Caterer services providing meals to outside (CPC 6423). Institutional Food Service caterers (with the exception of Airport and airline catering facilities which are confined only to the national air carriers B. Travel Agencies and tour operator services (CPC 7471) Tourist Guide services (CPC 7472)
No Changes were made to the commitments at the WTO.
Mode (1) Foreign travel agencies must implement their tours in Jordan through a local service provider. Mode (3) Service may be provided through Jordanian natural or juridical entities with maximum 50 % foreign equity. Service provider must be a specialized tourist firm. Director must be a Jordanian national.
10. Recreational, Cultural and Sporting Services (other than audio-visual services)
11. Transport Services
A. Maritime Transport Services Transport services by Sea going vessels (CPC 721)
a. Passenger transportation b. Freight transportation c. Pushing and towing services d. Maintenance and repair of rail transport equipment e. Supporting services for rail transport services
No change in foreign Equity allowed. (a) & (b) Mode (3): (a) Establishment of registered company for the purpose of operating a fleet under the national flag of Jordan: Subject to 50% foreign equity limitation except none for ships owned and operated at the same time by a non-Jordanian. (b) Other forms of commercial presence for the supply of international maritime transport services: Subject to 50% foreign equity limitation except none for ships owned and operated at the same time by a non-Jordanian. Mode (4) Unbound, except as indicated in horizontal section. 1/5 of crew on Jordanian ships must be Jordanian.
National Treatment Limitation Mode (3) Service fees for pilot age, berthing and docking are 10% less for Jordanian ships. Jordanian ships are exempt from any Port dues when anchoring in Jordanian territorial waters. Jordanian ships enjoy preferential treatment in prices of bunker provided at the Aqaba Port. (c) No Change (d) Mode (3): An increase of foreign equity allowed, from 50% (as in WTO) to a 60% foreign equity limitation. Access restricted to Jordanian natural or juridical entities. No Change: Mode (3) Subject to 50% foreign equity limit. As a Public utility, a concession or licensing procedures may apply in case of occupation of the public domain
B. Internal Waterways Transport a. Passenger transportation (a) Passenger transportation (CPC 7221) (a) & (b) Mode (3) Subject to 50% foreign equity limitation.
Economic Impact and Implications for Jordan of the Jordan-U.S. FTA Draft Report
AMIR Program 77
b. Freight transportation c. Rental of vessels with crew d. Maintenance and repair of vessels e. Pushing and towing services f. Supporting services for maritime transport No commitment was made in this Sub-sector.
(b) Freight transportation (CPC 7222) (c) Rental of vessels with crew (CPC 7223) (d) Maintenance and repair of vessels (part of CPC 8868) (e) Pushing and towing services (CPC 7224)
Starting no later than 31 December 2003, 100% foreign equity will be permitted. ( c ) Mode (3) Subject to 50% foreign equity limitation. (d) Mode (3) Subject to 60% foreign equity limitation. (e) Mode (3) Subject to 50% foreign equity limitation. Establishment and provision of services are subject to an agreement with the Jordanian government. Number of service providers may be restricted.
C. Air Transport Services (as defined in the Annex on Air Transport) Maintenance and repair of Aircraft (part of CPC 8868) Computer Reservation Systems (CRS): Sales and Marketing, Maintenance and Repair
Maintenance and repair of Aircraft (part of CPC 8868) (3) Subject to 60% foreign equity limitation. Number of service providers may be restricted. (3) Subject to 50% foreign equity limitation.
Mode (3) No commitment had been made at the WTO. Mode (3) No change to 50% foreign equity limitation.
Air Auxiliary Services Freight forwarding services (part of CPC 748) Packing and crating and de-packing and de-crating services (part of CPC 749)
Freight forwarding services (part of CPC 748) (3) Access restricted to Jordanian natural or juridical entities. Director must be a Jordanian national. Subject to 50% foreign equity limitation Packing and crating and de-packing and de-crating services (part of CPC 749) (3) Access restricted to Jordanian natural or juridical entities. Subject to 50% foreign equity limitation. Freight inspection services (part of CPC 749) excluding pre-shipment inspection for customs valuation purposes on imports. (1) None, Jordan does accept pre-shipment inspection for customs valuation purposes on imports. (2) None, Jordan does accept pre-shipment inspection for customs valuation purposes on imports. (3) Subject to 50% foreign equity limitation. Access restricted to freight forwarders in the form of Jordanian natural or juridical entities. Director must be a Jordanian national. Once issuance of specialized licenses for provision of freight inspection services is regulated, access will also be granted to inspection firms in the form of Jordanian natural or juridical entities. (4) Unbound, except as indicated in the horizontal section. Director must be a Jordanian national.
Mode (3) No change to 50% foreign equity limitation. Was not present in WTO commitments.
Economic Impact and Implications for Jordan of the Jordan-U.S. FTA Draft Report
AMIR Program 78
Annex C: Meetings Conducted AMIR Program Dr. Zaki Ayoubi Business Associations
Initiative (BAI) Component Leader
Dr. Steve Wade Chief of Party Dr. Andrew Griminger Project Administrator Dr. Brian O’Shea Policy Component Leader
U.S. Embassy Mr. Ian Campbell Economic Officer USAID Mr. Jon Lindborg Director, Economic
Opportunities Office Mr. Jamal Al-Jabiri Project Management
Specialist – Private Sector Mr. Jonathan Addleton Program Officer
Jordan Trade Association (JTA)
Mr. Samih Darwazah Chairman Mr. Halim Abu-Rahmeh Managing Director Mr. Fareez Barakat Marketing & Membership
Development Manager JTA and Jordanian American Business Association (JABA)
Joint Committee on FTA
JABA Mr. Fawaz Shalan Chairman Ms. Salwa Bamieh, Ms. Fareez Barakat, Mr. Abdelnour Abdelnour, and Ms. Lina Hundaileh
Executive Directors
Atlas Investment Group (Financial Services)
Mr. Omar Al-Masri CEO
Al-Hikma Pharmaceuticals Mr. Sa’id Darwazah Mr. Samih Darwazah
CEO Chairman
Jordan Investment Bureau Mr. Hussein Dabbas Deputy Director General Ministry of Industry and Trade Mr. Samer Tawil
Dr. Ahmad Thogan Hindawi Secretary General Assistant Secretary General
Int@j (Information Technology Association)
Mr. Ra’ed Bilbessi Me. Ahman Tantash
CEO Head, Marketing Division
Jordan International for Travel & Tourism
Mr. Hala Ayoubi General Manager
Irbid Chamber of Industry, Al-Hassan Industrial Estate, Qualified Industrial Zone (QIZ)
Ms. Muyassar Azzam Manager
Jordan Exporters and Producers Association for
Mr. Khair Al-Din Shukri Chairman
Economic Impact and Implications for Jordan of the Jordan-U.S. FTA Draft Report
AMIR Program 79
Fruits and Vegetables Today Philadelphia Chocolate Manufacturing Co.
Ms. Lina Hundaileh General Manager
Amin Kawar & Sons Co. Mr. Amin Kawar Dept. General Manager NCR Corporation Aazzam Shweihat General Manager Scientific & Medical Supplies Co.
Maher Mouasher CEO
Nuqul Group Mr. Ghassan Nuqul Mr. Abdelnour Abdelnour
Vice-Chairman Budgeting Section in-Charge
MMIS Management Consultants
Mr. Salwa Bamieh Director/Partner
Al-Faiha Engineering Products
Mr. Azzam Annab General Manager
Al-Tewfik Automobile & Equipment Co.
Mr. Hasan Tabbaa Managing Director
Al-Hasan Industrial Estate Mr. Mohammed Abu-Atmeh Manager Al-Haramain Apparel Manufacturing Co. Ltd
Mr. M. M. Khawaja General Manager
Jordanian Industrial Estate Corp.
Mr. Abdalla Al-Jahmani Chief, Investors Service Bureau QIZ
H. Zananiri & Sons Ms. Hanna Zananiri Director Specialized Investment Compounds Co. PLC
Economic Impact and Implications for Jordan of the Jordan-U.S. FTA Draft Report
AMIR Program 80
Annex D: References Atlas Investment Group (2000a), ‘Sector Analysis: Third Generation Free Zones’. June 14,
Mimeo. Atlas Investment Group (2000b), ‘The Free Trade Agreement with the US: The Fourth
Inception’. Mimeo. Atlas Investment Group (2000c), ‘Alphabet Soup: Making the most of the QIZs and the FTA’.
Mimeo. Brown, D. K., A.V. Deardorff and R.M. Stern (1997), “Some Economic Effects of the Free
Trade Agreement between Tunisia and the European Union”. In A. Galal and B. Hoekman, Regional Partners in Global Markets: Limits and Possibilities of the Euro-Med Agreements. London and Cairo: Centre for Economic Policy Research (CEPR) and The Egyptian Centre for Economic Studies (ECES).
Dessus, S. and A. Suwa-Eisenmann (1998), “Trade Integration with Europe, Export
Diversification and Economic Growth in Egypt”. OECD Development Centre Technical Paper No. 1938 and CEPR Discussion Paper No. 1938.
Domaq, I. and G. Shabsigh (1999), “Real Exchange Rate Behavior and Economic Growth:
Evidence from Egypt, Jordan, Morocco, and Tunisia”. Washington, DC: International Monetary Fund, Working Paper WP/99/40.
Falvey, R. and G. Reed (1997), “Rules of Origin as Commercial Policy Instruments”.
Nottingham, United Kingdom: Department of Economics, University of Nottingham. Federal Register (1999). Vol. 64, No. 199, October 15. Washington, DC. Findlay, C. (1999), “ Air Transport”. Manila, Philippines. Paper prepared for East Asia
Conference on Options for the WTO 2000 Negotiations. PECC/TPF and World Bank. Francois, J. and I. Wooton (2000), “Trade in International Transport Services”. Tinbergen
Institute Discussion Paper TI 2000-057/2. Erasmus University Rotterdam, Tinbergen Institute.
Ghesquiere, H. (1998), “Impact of European Union Association Agreements on Mediterranean
Countries”. Washington, DC. International Monetary Fund. IMF Working Paper WP/98/116.
Economic Impact and Implications for Jordan of the Jordan-U.S. FTA Draft Report
AMIR Program 81
Hanson, G.H. (1994), ‘Regional Adjustment to Trade Liberalization’. National Bureau of Economic Research. Working Paper No. 4713.
Hanson, G.H. (2000), ‘Increasing Returns, Trade, and the Regional Structure of Wages.’
Economic Journal. Hoekman, B. and C.A.P. Braga (1997), “Protection and Trade in Services: A Survey”
Washington, DC: The World Bank, International Economics Department, International Trade Division. Policy Research Working Paper 1747.
Holliday, G. (1998), ‘Generalized System of Preferences’. Congressional Research Service,
Library of Congress, May 20. Industrial Development Department (2001), “The Effect of the Qualified Industrial Zone and the
Free Trade Agreement with the U.S.A. on Domestic Industry”. Amman, Jordan: Industrial Development Department of the Ministry of Industry and Trade of the Hashemite Kingdom of Jordan.
Jordan Investment Board (undated), ‘Jordan’s Exclusive Qualifying Industrial Zone: A Golden
Opportunity’. Mimeo. Ju, J. and K. Krishna (1996), “Market Access and Welfare Effects of Free Trade Areas
Without Rules of Origin”. Cambridge, MA: National Bureau of Economic Research. Working Paper 5480.
Konan, D.E. and K.E. Maskus (1997), “A Computable General Equilibrium Analysis of
Egyptian Trade Liberalization Scenarios”. In A. Galal and B. Hoekman, Regional Partners in Global Markets: Limits and Possibilities of the Euro-Med Agreements. London and Cairo: Centre for Economic Policy Research (CEPR) and The Egyptian Centre for Economic Studies (ECES).
Krishna, K. and A. Krueger (1995), “Implementing Free Trade Areas: Rules of Origin and
Hidden Protection”. Cambridge, MA: National Bureau of Economic Research. Working Paper No. 4983
Krueger, A.O. (1999), “Free Trade Agreements as Protectionist Devices: Rules of Origin.” In J.
Melvin, J. Moore, and R. Riezman, eds, Trade Theory and Econometrics: Essays in Honor of John S. Chipman. NY: Routledge.
Lord, M. (1991), Imperfect Competition and International Commodity Trade: Theory, Dynamics,
and Policy Modelling. Oxford: Clarendon Press. Lord, M. (1999), The Handbook of Latin American Trade in Manufactures (ed.). Edward Elgar
Publishing.
Economic Impact and Implications for Jordan of the Jordan-U.S. FTA Draft Report
AMIR Program 82
Michaely, M. (1994), “Preferential Trade Agreements in Latin America: An Ex Ante Assessment”. Mimeo. World Bank.
Michaely, M. (2000), “Trade Expansion in the Andean Group”. Mimeo. World Bank. Michalopolus, C. (1999). “Trade Policy and Market Access Issues for Developing Countries:
Implications for the Millennium Round”. Washington, DC: The World Bank. Policy Research Working Paper.
Panagariya, A. (2000), “Preferential Trade Liberalization: The Traditional Theory and New
Developments”. Journal of Economic Literature 38:287-331. Rajapatirana, S. (1997), “Evaluating Integration Choices: The Case of Bolivia”. Journal of
Economic Integration 12(3): 298-324. REACH Initiative (2000), “Launching Jordan’s Software and IT Industry: A Strategy and Action
Plan for H.M. King Abdullah II”. Amman, Jordan. Ruebner, J. (2000), “U.S.-Jordan Free Trade Agreement”. Washington, DC: Library of Congress.
Congressional Research Service. CRS Report for Congress. Ruebner, J. (2001), ‘United States-Israel Free Trade Area: Jordanian-Israeli Qualifying Industrial
Zones’. CRS Report for Congress, Congressional Research Service, The Library of Congress.
Rutherford, T.F., E.E. Rutström and D. Tarr (1993), “Morocco’s Free Trade Agreement with the
European Community: A Quantitative Assessment”. Policy Research Working Papers, WPS 1173, Policy Research Department, The World Bank.
Stephenson, S.M. (undated), “Approaches to Liberalizing Services”. Washington, DC: Trade
Unit, Organization of American States (OAS). TradeCan (2000), TradeCan Database and Software for a Competitiveness Analysis of Nations.
Washington, DC: The World Bank and Economic Commission for Latin American and the Caribbean (ECLAC).
United States Department of State (2001), “FY 2001 Country Commercial Guide: Jordan”.
Amman, Jordan. United States International Trade Commission (USITC, 1999), “The Economic Effects of
Significant Import Restraints”. Washington, DC. Investigation Number 332-325. Second Update 1999. Publication N. 3201.
United States International Trade Commission (USITC, 2000), “Economic Impact on the United
States of the U.S.-Jordan Free Trade Agreement. Washington, DC. Investigation No. 332-418. Publication 3340.
Economic Impact and Implications for Jordan of the Jordan-U.S. FTA Draft Report
AMIR Program 83
United States Trade Representative (USTR, 1999), “U.S. Trade Representative Designates Three
New Duty-Free Zones in Jordan and Israel”. Press Release October 13. United States Trade Representative (USTR, 2000), “USTR Barshefsky Designates Three New
Jordan-Israeli Qualifying Industrial Zones”. Press Release December 12. Whichard, O.G. (undated), “Measurement, Classification, and Reporting of Services Activities:
An International Perspective”. Washington, DC: Bureau of Economic Analysis, U.S. Department of Commerce.
World Trade Organization (WTO, 1998), “Computer and Related Services: Background Note by
the Secretariat”. Council for Trade in Services S/C/W/45.