Page 1
Munich Personal RePEc Archive
Factors Affecting the Decision Making of
Out-Sourcing in Textile in Pakistan
Subhani, Muhammad Imtiaz and Osman, Ms.Amber
Iqra University Research Centre (IURC), Iqra university MainCampus Karachi, Pakistan, Iqra University Karachi
1 November 2010
Online at https://mpra.ub.uni-muenchen.de/27006/
MPRA Paper No. 27006, posted 26 Nov 2010 20:06 UTC
Page 2
Supplier Performance Evaluation Model 1
Factors Affecting the Decision Making of Out -Sourcing in Textile in Pakistan
Dr.M.I.Subhani
Iqra University Research Centre, Khi, Pak
Amber Osman
Iqra University Research Centre, Khi, Pak
Abstract
This research provided the study of importance of factors affecting the
decision making of out-sourcing & supplier performance in Textiles
domain. The textile market of USA is the scope of this research. The basis
of this study allowed comprehending the importance / weight of fac tors of
out-sourcing (including Delivery, Flexibility, Cost, Quality & Reliability)
varied according to the buyers needs. Buyer’s needs some factors were high
weight / importance for one buyer and at the same time the same factors
were low weight / for another buyer. It delineated the root to supply chain
managers and experts for textiles industry for taking the right strategic
decision for out-sourcing in today’s competitive market .
Introduction
There are a lot of factors affecting the decision making of out -sourcing in textiles, but
this research focused on some of the important and very relevant factors. It highlighted to
develop an evaluation model to measure the Total Index Score of Supplier P erformance in
order to study the importance of factors affecting the decision making of out -sourcing &
supplier performance in textiles. The major interest was one of the major strategic issues –
the sourcing issue, which was how to select and evaluate suppliers in the sourcing process .
The first objective of this study was chain operations to investigate current available supplier
Page 3
Supplier Performance Evaluation Model 2
selection and evaluation models and determine their potentials in textile/apparel supply chain
applications. The second objective was to determine the required variables in evaluating
supplier performance for textile/apparel supply and to develop a supplier selection and
evaluation model based on these selected variables. The overall objective of this study was to
provide an easy to use evaluation matrix that can help textile/apparel companies in selecting
the right supply partners to improve the whole supply chain’s performance.
As there are a lot of factors affecting the decision making of out -sourcing in textiles, there
was a need to study the importance of these factors on the basis of buyers’ needs and
demands. The buyers can get a grasp of textile apparels to sort-out the ways to find out the
best of the best possible buyers and also the buyers to analyze and search -out the ways to
remain competitive in the open market for respective buyers.
The limitations of this study were the factors affecting the decision making of out -sourcing
in textiles (including Delivery, Flexibility, Cost, Quality & Reliability) are of very subjecti ve
nature. These factors are difficult to quantify. These factors not only vary country to country,
but they also vary buyer to buyer. It is assumed that the buyers are only USA based.
A Model for Evaluation and Selection of Suppliers in Global Textile and Apparel
Supply Chains:
Introduction of the Model:
With the current competitive textile / apparel market, the textile/apparel companies are
adjusting their business strategy by expanding their global out -sourcing activities to cut down
their manufacturing costs. In the last two decades, some manufacturers in the USA have
shifted their operations to foreign countries with more attractive tax policies and labor costs.
Textile/apparel, semiconductor, and automotive industries are just some of the i ndustries that
enjoyed the benefits of cheaper costs in Mexico and Central America. Meanwhile, Asian
countries are taking huge steps to improve their production and manufacturing processes to
offer low cost products. In contrast, Asian countries have adopt ed an aggressive devaluation
Page 4
Supplier Performance Evaluation Model 3
policy for their currency, thus boosting the demand of products from these countries. In
recent rounds of negotiations, the United States agreed to eliminate the quota system that has
protected the textile / apparel industry fo r decades. In addition, China’s access to the World
Trade Organization (WTO) brings a new set of perspectives to the textile/apparel industry,
which is experiencing significant changes, fierce competition, and cost reduction to maintain
or gain participation in specific markets. As the US textile/apparel industry is moving toward
out-sourcing operations, effective supply chain management (SCM) becomes more critical.
Presently, US companies must decide when, where, and what to outsource, as an important
issue in their strategic planning process. Therefore, the implementation of international
sourcing strategy is playing a critical role in the changes of textile/apparel supply chain
operations fundamentally. Manufacturers are influenced to implement internatio nal sourcing
operations mainly due to their desire to establish a presence in a foreign market, their needs
to satisfy offset requirements and to increase the number of available sources, and their
reactions to local and foreign competitions. Strategic sou rcing aims to reduce the risk of
disrupting the supply chain flows and the total cost of the products. Big textile/apparel
companies usually use a multiple sourcing strategy to reduce risk and to lower down cost,
while at the same time, to establish close relationships between personnel on both the buyer
and supplier sides. One important issue being raised in the operations of textile / apparel
supply chain is the selection of suppliers and the evaluation of these suppliers. Companies
needs to continuously improve their supply chain operations, and meanwhile, add new
suppliers to the existing supply chain as part of improvement activities if necessary. Even
with very competitive product prices, Wal -Mart is still relentlessly searching for the suppliers
that can provide products with cheaper prices and better services. To select new partners and
evaluate current partners becomes critical in the management and implementation of supply
chain operations.
Page 5
Supplier Performance Evaluation Model 4
In this research, logistics issues involving supplier selection and evaluation are the center of
the study given that the US textile/apparel industry is currently facing the need to establish
effective relationships with global suppliers. With the elevation of the current global sourcing
trend, it is more difficult for textile/apparel companies to conduct frequent on -site supplier
evaluations. So these companies need to develop an effective process for the selection and
evaluation of suppliers as a part of their SCM proces ses. This study intends to provide a
supplier selection and evaluation model to help textile/apparel companies in managing their
supplier related supply chain activities.
The Development of the Supplier Evaluation Model:
The model is designed according to a hierarchical structure with several layers of
decision-making activities. The first level of the hierarchy is for the most critical areas in
global sourcing for textile/apparel supply chains. This level consists of five areas that are
called “clusters”, which signify grouping factors include; Delivery, Flexibility, Cost, Quality
and Reliability. Each of these clusters has a weight, which is assigned by buyers according to
their needs. A second level of the hierarchy consists of factors that have significant effect on
each cluster. Again, buyers must assign appropriate weights to each factor according to
specific situations or needs. Additionally, a desired value must be determined for each factor
to provide a framework or benchmark. Following the practices in the textile/apparel industry,
two main characteristics for this model has been taken. This first characteristic is to obtain a
dimensionless index as the result of running the model. The grade that each supplier receives
on each factor was divided by the desired value to obtain a dimensionless index that was then
be multiplied by its corresponding factor a nd cluster weight. It integrated both qualitative and
quantitative factors in the evaluation process. For this reason the model could also be
classified as a multi-attribute approach. The second characteristic, not considering
correlations between factors in the model, is for the sake of simplicity in the use of the model.
Since the buyers and the cross functional teams in the downstream compan ies often use some
Page 6
Supplier Performance Evaluation Model 5
subjective rating scheme to rate factors, putting efforts in determining the correlations
between factors is often not valuable in practice.
The index used in this model to determine a supplier’s performance is the total supplier score.
This score consists of five cluster scores, the scores for delivery, flexibility, quality,
reliability and cost. It was important to note that high cost score h as a negative impact on the
total supplier score. Given that cost effectiveness was an important motivation for global
sourcing, the cost score was an important evaluation and influence over the total supplier
score. The following equation shows the supplier evaluation model:
Total Supplier Score = Delivery Score + Flexibility Score + Quality Score + Reliability
score – Cost Score (equation. 1)
The five scores that determine the total supplier score are from the five key supplier
performance clusters. To determine these cluster scores, one required to determine the cluster
weights (C), the factor weights (K) that influence the cluster, the desired value (DV), and a V
value that is computed by dividing a buyer provided score by the factor’s DV value.
The Clusters for Determining Supplier Performance :
As shown in equation (1), there are five clusters under the supplier performance level.
Three to five factors are under these five clusters. Figure -1 shows the structure of the
decision-making matrix in the proposed approach for evaluating suppl ier performance and
selecting textile/apparel suppliers. The factors affecting the five main clusters’ performance
were selected based on the most common and significant issues in textile/apparel supply
chains. The use of the structure in figure -1 re-emphasized one important aspect, supplier’s
selling price should not be the sole factor used in selecting suppliers. Even in the cost cluster,
the cost effect is according to internal cost and the cost associated with ordering and
invoicing process, in addition to the selling price obtained. Textile/apparel companies have to
Page 7
Supplier Performance Evaluation Model 6
evaluate all cost items encountered in each purchasing process along with the product cost
and the consideration of all the other clusters before extending orders to the suppliers.
Figure-1 (Supplier Performance Evaluation Matrix Structure)
Geographic Location
Freight Terms
Total Order Lead Time
Trade Restrictions
Capacity
Inventory Availability
Information Sharing
Negotiability
Customization
Supplier’s Selling Price
Internal Cost
Ordering and Invoicing
Continuous Improve. Programs
Customer Service
Certifications
% of On-Time Shipments
Felling of Trust
Country’s Political Situation
Currency Exchange Situation
Warranty Policies
Delivery
Flexibility
Cost
Quality
Reliability
Textile / Apparel
Supplier
Performance
Page 8
Supplier Performance Evaluation Model 7
Low product price is critical to the selection of suppliers. But all the other incurred costs in
the purchasing process and supply chain operations are equally important. The proposed
matrix provides a realistic and easy to use structure for textile/apparel compani es to evaluate
suppliers.
The First Cluster (DELIVERY):
Delivery cluster consisted of four factors: Geographic location (Kgl), Freight terms
(Kft), Total order cycle time(Klt) and Trade restrictions(Ktr).
Geographic location (Kgl): Geographic location (Kgl) represented the vicinity to customer
and was determinant to supplier selection from the logistics point of view. A good example of
preferable supplier locations for the US textile/apparel supply chain include locations in
Mexico, Central America, and o ther Caribbean countries, which enjoyed a boom in the 1980s
and 1990s due to their close proximity to US companies. In contrast, suppliers located in the
Far East may score poorly on this category. There are four scores assigned to the geographic
location factor that include:
o Very close proximity with suppliers located in Mexico, Central America, and
Caribbean countries ً(score = 4)
o Close proximity with suppliers located in Andean countries and Brazil ً(score = 3)
o Far with suppliers located in Europe, Af rica, Middle East, and some other South
American countries ً(score = 2) and
o Very Far with suppliers located in the Far East and the Pacific Rim ً(score = 1)
Freight Terms (Kft): The next factor under the delivery cluster was the factor of freight
terms (Kft). This factor referred to the favor ability of shipping conditions from the supplier
chain’s point of view. This favor ability was associated with the supplier’s level of
responsibility over the shipping process. Scores on this factor are according t o the following
four scales:
o Excellent ً(score = 4)
Page 9
Supplier Performance Evaluation Model 8
o Good ً(score = 3)
o Fair ً(score = 2) and
o Poor ً(score = 1)
Total Order Lead Time (Klt): The last factor influencing delivery performance was the
total order lead-time (Klt). The total order lead-time is the lead-time from the moment a
buyer placed an order to the time the customer’s designated site received the ordered
products. Inefficiencies in production, transportation and flow of information between
involved supply chain parties may have negative e ffect on this factor. Since it was very
difficult to establish specific targets for this factor, a buyer determine d the ranges for
performance evaluation. For example, a buyer rank ed the supplier differently as:
o Excellent with a total order lead time from 15 to 20 days(score = 4)
o Good with a period from 21 to 25 days ً( score = 3)
o Fair with a period from 26 to 30 days ً(score = 2) and
o Poor with a time beyond 30 days (score = 1 )
Trade Restrictions (Ktr): The third factor of the delivery cluster was the trade restrictions
(Ktr) factor. It takes into account government regulations for a certain type of products in
both sides of the supply chain. Tariffs and custom duties were the parameters usually
considered in this category. It was important to note that a high score on this factor had a
negative influence on the delivery index. Scores on this category are according to the level of
trade restrictions that include:
o High trade restrictions ً(score = 4)
o Moderate trade restrictions ً(score = 3)
o Low trade restrictions ً(score = 2) and
o Free-trade agreements between countries (score = 1)
The adoptions of just-in-time practices were forcing suppliers to narrow down these ranges.
The delivery score calculated in equation (2) is according to all factors in the delivery cluster:
Page 10
Supplier Performance Evaluation Model 9
Delivery Score = CD [(Kgl*Vgl) + (Kft*Vft) + (Klt*Vlt) - (Ktr*Vtr)]
In the equation, CD is the weight of the delivery cluster and Vgl, Vft, Vtr, and Vlt represent
the values obtained for each factor after dividing the factor’s score by its desired value (DV).
The Second Cluster (FLEXIBILITY):
The flexibility cluster was evaluated in terms of a supplier’s capacity to respond to
unexpected customer demands. Supply chain flexibility relates to activities within an
organization’s departments as well as among external partners including : Suppliers, Carriers,
Third-party companies and Information system providers. Research papers had identified six
components of flexibility, which were : Production flexibility, Market flexibility, Logistics
flexibility, Supply flexibility, Organizational flexibility and Information systems flexibility.
Here, the approach in evaluating supplier’s flexibility was according to five factors including:
Capacity (Kc), Inventory Availability (Kiv), Information Sharing (Kis), Negotiability (Kn),
Customization (Kcu).
Capacity (Kc): Capacity (Kc) was determined by the buyer’s knowledge or information
obtained from the source itself. This score must display the levels of econ omic order
quantities that a supplier can deal with. Scores on this factor are according to the following
four scales:
o Very High ً(score = 4)
o High ً(score = 3)
o Acceptable ً(score = 2) and
o Low ً(score = 1)
Inventory Availability (Kiv): The second factor was the inventory availability (Kiv) factor.
Normally buyers prefer to get suppliers to keep certain levels of safety stocks. This factor was
measured in terms of weeks of safety stocks or available to promise quantities. Small and
medium size companies with make-to-order production systems are likely to score poorly on
Page 11
Supplier Performance Evaluation Model 10
this category. Scales on this category were the same as the scales for the previous factor.
o Very High ً(score = 4)
o High ً(score = 3)
o Acceptable ً(score = 2) and
o Low (score = 1)
Information Sharing (Kis): The third factor, information sharing (Kis), refers to the level of
information shared between parties. For example, buyers may want to receive constant
updates of inventory levels, production plans, and status of orders. On the other hand,
suppliers may want to have access to the buyer’s forecasting data in order to prepare for
potential purchasing orders. Under the current circumstances, real time information
availability as well as compatibility of information sy stems between parties depicted the
difference between high and low levels of information sharing. Still, most buyers evaluate d
suppliers’ information sharing performance based on best knowledge of these suppliers’
systems. The scales used to evaluate infor mation sharing between parties include d:
o Very High with real time updates and compatible electronic data interchange (EDI)
technologies ً(score = 4)
o High with weekly (or less) updates and compatib le EDI technologies (score = 3)
o Acceptable with updates obtained between one to two weeks and with low
compatibility in EDI technologies (score = 2) and
o Low with updates obtained on a monthly basis and with no compatibility or
inexistent EDI ability (score = 1)
Negotiability (Kn): Negotiability (Kn) was the fourth flexibility factor. Even though many
companies preferred to manage contracts with suppliers through brokers, the conditions of
such contracts constituted an important issue for the supplier evaluation process.
Page 12
Supplier Performance Evaluation Model 11
Negotiability was associated with the mutual trust existed between supply chain partners and
was higher in long-term relationships. This category was evaluated according to the scales of:
o Very High (score = 4);
o High ً(score = 3);
o Acceptable ً( score = 2); and
o Low ً(score = 1).
Customization (Kcu): The last factor for the flexibility cluster was the customization (Kcu)
factor. This factor intended to evaluate the supplier’s ability to take orders with special
characteristics. Since unusual requests may require special machine set -ups, this category
favors small and medium size organizations with less complex production processes.
Furthermore, suppliers with a make -to-order production system was more likely to obtain a
good evaluation on this category. Scales on this category were the same as those of the
negotiation factor.
o Very High (score = 4);
o High ً(score = 3);
o Acceptable ً( score = 2); and
o Low ً(score = 1).
The flexibility score was computed in equation (3) with CF as the weight of the flexibility
cluster:
Flexibility Score = CF [(Kc*Vc) + (Kiv*Viv) + (Kis*Vis) + (Kn*Vn) + (Kcu*Vcu)]
The Third Cluster (COST): Cost cluster often represented the main reason why the US
textile/apparel manufacturers have been hurt by foreign comp etition. The global suppliers’
extremely competitive low product prices and increasing levels of quality had led
textile/apparel companies to think that it was significantly cost-effective to partially or totally
manufacture textile/apparel goods overseas. Without any doubt, cost cluster has great
Page 13
Supplier Performance Evaluation Model 12
influence on the supplier selection process. The three factors considered in the evaluation of
the cost cluster were Supplier’s selling price (Ksp), Internal cost (Kic), and Cost for ordering
and invoicing (Koi).
Supplier’s Selling Price (Ksp): Buyers are constantly searching for less costly products.
They took into account the cost of procuring from certain sources; whether they require air,
ground or maritime shipments, which ultimately affect the final price of the pro duct.
Supplier’s selling price was evaluated according to the following four scales:
o High Prices ً(score = 4)
o Acceptable Prices ً(score = 3)
o Low Prices ً(score = 2) and
o Very Low Prices (score = 1)
Internal Cost (Kic): The internal cost factor evaluates the total cost of each purchase and is
adopted from the cost ratio method. In addition to the product price that a company had to
pay for, other costs related with transportation and quality must also be considered e.g
rectification, waste, defects and plant visits. The minimization of internal costs was reflected
in today’s preference for suppliers that were capable to assume the entire manufacturing
processes (the whole package). This category was evaluated according to the following
scales:
o High Internal Costs ً(score = 4)
o Acceptable Internal Costs (score = 3)
o Low Internal Costs (score = 2) and
o Very Low Internal Costs (score = 1)
Cost for Ordering and Invoicing (Koi): The third cost factor, the ordering and invoici ng
factor, relates to the ease of order placing. The implementation of EDI technologies had
contributed to the advancements in the area of ordering. Big companies demand ed their
suppliers to implement online systems in which orders may be placed with less human
Page 14
Supplier Performance Evaluation Model 13
interactions, thus dropping certain barriers such as different languages and time zones in the
supply chain. In the same way, invoicing was a concern when the supplier and the buyer are
located in different countries. Even though advances in technolo gy have overcome many
obstacles in international business activities, organizations still need to work on
implementing customer-driven invoicing system in terms of simplicity and time period to
pay. This factor has four ratings:
o Excellent (score = 4)
o Good ً(score = 3)
o Fair ً(score = 2) and
o Poor ً(score = 1)
The cost score was calculated in equation (4) with CC being the weight of the cost cluster:
Cost Score = CC [(Ksp*Vsp) + (Kip*Vip) - (Koi*Voi)]
The Fourth Cluster (QUALITY): The quality cluster included four (4) factors:
Continuous Improvement (Kip), Certifications (Kct), Customer Service (Kcs) and Percentage
of On-Time Deliveries (Kot).
Continuous Improvement (Kip): Continuous improvement could be defined as the
incessant enhancement in lead times, conformities and reliability of deliveries. Supply chain
members must continuously improve its logistical planning and scheduling. These activ ities
consisted of selection of carriers and consolidation strategies for shipments. Continuous
improvement in production planning and scheduling refers to the reduction of changes in
production schedules or impact minimization when these changes are neces sary.
Improvement on communication also play ed an important role in the evaluation of this
category. Buyers must assess suppliers’ efforts to improve their EDI technologies for a better
and quicker communication. Also, efforts to Cultural elimination and language barriers were
considered as communication improvements. Finally, price reductions and special offers were
Page 15
Supplier Performance Evaluation Model 14
also a part of suppliers’ efforts to enhance customer satisfaction. Continuous improvement
score was according to the following scale:
o High:the supplier constantly presents signs of improvements ً(score = 4)
o Moderate:the supplier occasionally presents signs of improvements ً(score = 3)
o Acceptable:the supplier rarely presents signs of improvements ً(score = 2) and
o Poor:the supplier never presents signs of improvements ً(score = 1)
Certifications (Kct): The certifications factor was for the recognition of the supplier’s
quality level. ISO-9000 certifications or other certifications from recognized organizations or
customers have their significance in the evaluation process. Buyers may use supplier
certifications as quality assurance instruments that determined whether or not some suppliers
were capable to follow standards in the industry. This category was evaluated as:
o Very high: the supplier has ISO 9000 certification
and other supplier certifications in the US (score = 4)
o High: the supplier has ISO 9000 certification but no supplier certifications in the US
(score = 3)
o Acceptable: the supplier has supplier certifications in the US ً(score = 2) and
o Poor: the supplier does not have any certification (score = 1)
Customer Service (Kcs): The third factor was customer service. In the case of the US
textile-apparel supply chain, in which large quantities of products are procured overseas, the
interactions with suppliers has an important role in the smooth flow of goods and
information. From a SCM perspective, customer service showed a supplier’s effectiveness to
respond to customer requests or complaints. Following this definition, this category may be
evaluated as :
o Excellent: the supplier always attended complaints or requests promptly ً(score = 4)
o Good: the supplier attended complaints or requests promptly most of the times ً(score
= 3)
Page 16
Supplier Performance Evaluation Model 15
o Fair: the suppliers attended complaints or requests promptly occasionally ً(score = 2)
o Poor: the supplier never attended complaints or requests promptly ً(score = 1)
Percentage of On-Time Deliveries (Kot): The last factor, percentage of on-time deliveries
(Kot), was one of the key factors in supplier quality since some obstacles may affect on -time
deliveries, such as in-transit delays. Other difficulties in on -time deliveries may be customs
inefficiencies, quota limitations and inefficient paperwork processes. This category was
evaluated as:
o Very high: more than 95 percent of shipments are delivered on time ً(score = 4)
o High: 90 to 95 percent of shipments are delivered on t ime ًscore = 3)
o Moderate: 85 to 90 percent of shipments are delivered on time ً(score = 2) and
o Low: less than 85 percent of shipments are delivered on time ً(score = 1)
With these four factors, the quality score was calculated in equation (5) and the coefficient
CQ was the weight of the quality cluster:
Quality Score = CQ [(Kip*Vip) + (Kcs*Vcs) + (Kct*Vct) + (Kot*Vot)]
The Fifth Cluster (RELIABILITY): The last cluster for supplier performance evaluation
was the reliability of a supplier’s operations to fulfill supply chain activities. Following four
(4) factors influence the reliability of a supplier: The feeling of trust (Kt), the country’s
political situation (Kps), the currency exchange situation (Kce) and the warranty (Kwp).
The Feeling of Trust (Kt): The feeling of trust was evaluated according to the buyer’s
perception of a given supplier. Before approving a supplier’s status, a textile/apparel
company often checks-out the potential supplier’s ability through procedures such as in -plant
visits or sample testing to see if this supplier can follow the company’s standards. Normally,
buyers grant small orders to new suppliers as a “test” before placing larger quantity orders.
The feeling of trust was determined by an on-going partnership between supply chain
partners and performance evaluations of a supplier over the years. A supplier’s reputation in
Page 17
Supplier Performance Evaluation Model 16
the industry can influence the evaluation result in this category. The evaluation of this factor
has the following four simple levels:
o Very High (score = 4)
o High ً(score = 3)
o Moderate ً(score = 2) and
o Low ً(score = 1)
The Country’s Political Situation (Kps): The importance of the second factor, country’s
political situation, lies in the buyer’s concerns about potential disruptions in the flow of
goods that mostly caused by external situations beyond the supplier’s control. Suppliers from
some South and Central American countries, as well as from less developed countries in
South Asia, may score poorly in this category. The proposed evaluation criteria for th is factor
include four ratings:
o Excellent (score = 4)
o Good ً(score = 3)
o Fair ً(score = 2) and
o Poor ً(score = 1)
The Excellent rating showed that the supplier’s country of origin exhibit ed good short and
long-term stability and there were absolutely no concerns of distracting supply chain
operations due to the country’s political situation. The Good rating provide d that the
supplier’s country of origin demonstrated good stability in the short and long term. The Fair
rating reveals that the supplier’s country of origin exhibit ed some concerns regarding political
stability. Some concerns about disruptive events may exist in the supply chain operations.
The Poor rating showed that the supplier’s country of origin exhibits serious concerns
regarding political stability and disruptiv e events in supply chain activities.
The Currency Exchange Situation (Kce): The third factor for the reliability cluster, the
currency exchange situation, had a big impact in the way the international textile/apparel
Page 18
Supplier Performance Evaluation Model 17
supply chains have operated in the last few years. Suppliers in the countries with aggressive
devaluation policies find their products very competitive in international markets. On the
other hand, companies in the countries with revaluated currencies found products less
competitive in international markets. For example, Mexican products have lost market share
in the last few years due to currency revaluation. Buyers may have preference for suppliers
located in the countries where the currency exchange situation favors their companies in
different planning horizons. The evaluation of this category was from a US buyer’s
perspective. The buyer determined the degree of favor- ability according to the following four
scales:
o Very Favorable (score = 4)
o Favorable ً(score = 3)
o Neutral ً(score = 2) and
o Non Favorable ً(score = 1)
The Warranty Policies (Kwp): Quite often the customer’s requested concerned suppliers to
provide warranty, the last factor in the reliability cluster. From a logistics point of view,
warranties were associated with on-time deliveries. Buyers may expect some rebates on late
deliveries, or called the other way, penalties for late deliveries or charge -back. The evaluation
of this category was similar to the previous factor.
o Very Favorable rating means that the supplier takes full responsibility on non-
conformities and offers rebates on late shipments (score = 4)
o The supplier takes partial responsibility on non -conformities or offers rebates when
deliveries are not received on time if it has a Favorable rating (score = 3)
o If the supplier only takes partial responsibility on non -conformities, it gets a Neutral
rating (score = 2)
o For the Non Favorable rating, the supplier does not take any responsibility on non -
conformities (score = 1)
Page 19
Supplier Performance Evaluation Model 18
Equation (6) showed the computation for the reliability score. In the equation, CR was the
weight of the reliability cluster.
Reliability Score = CR [(Kt*Vt) + (Kfe*Vfe) + (Ktr*Vtr) + (Kwp*Vwp)]
(Equation- 6)
The Supplier Performance Evaluation M atrix: Table-1 showed the supplier performance
evaluation matrix used in the evaluation and selection of suppliers based on the five clusters
discussed above. This table was designed in the way that buyers can easily use this table to
evaluate the suppliers while considering the major factors involved in the supply chain
operations and not just the suppliers’ product prices.
Table-1 (Supplier Performance Evaluation Matrix)
Cluster Weight Factors Weight DV Supplier Supplier Supplier
A B C
Delivery CD Geographic location Kgl
Freight terms Kft
Trade restrictions Ktr
Total order lead time Klt
Flexibility CF Capacity Kc
Inventory availability Kiv
Information sharing Kis
Negotiability Kn
Customization Kcu
Cost CC Supplier’s selling price Ksp
Internal cost Kic
Ordering and invoicing Koi
Page 20
Supplier Performance Evaluation Model 19
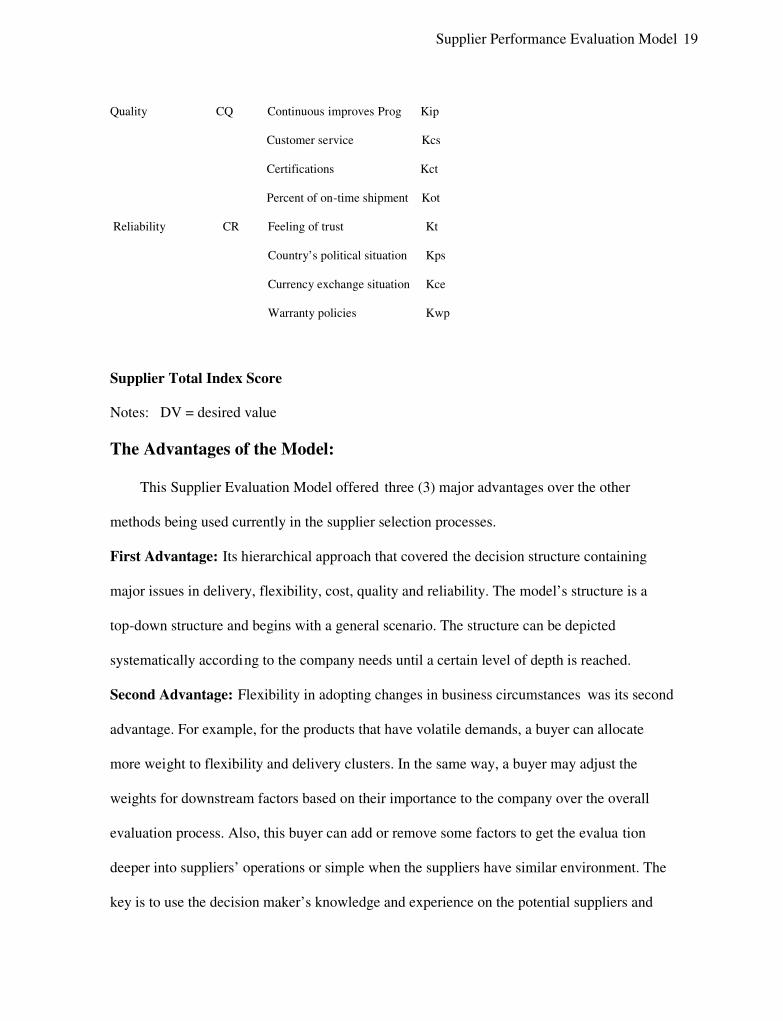
Quality CQ Continuous improves Prog Kip
Customer service Kcs
Certifications Kct
Percent of on-time shipment Kot
Reliability CR Feeling of trust Kt
Country’s political situation Kps
Currency exchange situation Kce
Warranty policies Kwp
Supplier Total Index Score
Notes: DV = desired value
The Advantages of the Model:
This Supplier Evaluation Model offered three (3) major advantages over the other
methods being used currently in the supplier selection processes.
First Advantage: Its hierarchical approach that covered the decision structure containing
major issues in delivery, flexibility, cost, quality and reliability. The model’s structure is a
top-down structure and begins with a general scenario. The structure can be depicted
systematically according to the company needs until a certain level of depth is reached.
Second Advantage: Flexibility in adopting changes in business circumstances was its second
advantage. For example, for the products that have volatile demands, a buyer can allocate
more weight to flexibility and delivery clusters. In the same way, a buyer may adjust the
weights for downstream factors based on their importance to the company over the overall
evaluation process. Also, this buyer can add or remove some factors to get the evalua tion
deeper into suppliers’ operations or simple when the suppliers have similar environment. The
key is to use the decision maker’s knowledge and experience on the potential suppliers and
Page 21
Supplier Performance Evaluation Model 20
on the supply chain’s operations to adjust the level of evaluation to generate the most useful
results.
Third Advantage: The third advantage of this evaluation model was its simplicity with no
complex equations in the model. This model aim ed to provide an easy to use supplier
evaluation and selection procedure, at the sa me time, offer very useful results without
excessive data gathering or analysis. Buyers who use this model can combine knowledge of
the potential suppliers into some critical factors in evaluating these potential suppliers. The
assessment of suppliers includes not only the selling prices of the products but also all the
supply chain related activities which reflect the real cost of the purchased goods.
Findings, Conclusion, and Discussion:
This research concluded that the model provides textile/apparel companies with an
uncomplicated way to evaluate their suppliers and make selection of suppliers more efficient
and effective. Most textile/apparel companies using this model can help build and establish
strategic alliance with global suppliers / exp erts to reduce costs and increase competitiveness
in the international market. Textile/apparel companies were and as current are facing steep
competition in the global market. To make right decisions at different stages of supply chain
operations and encounter issues at the strategic level, the tactical level and the operational
level of decision-making processes is absolute required of the Textiles organizations .
Supplier selection was no longer the only issue of obtaining low product prices, but it deal t
with the costs in all the related supply chain activities. An easy to use supplier evaluation
model that covered SCM issues can proffer buyers great benefits in searching for new
suppliers and evaluating current available suppliers. This model that is flexible enough to
resolve one of the major strategic decision issues, to have an effective sourcing operation
today.
Page 22
Supplier Performance Evaluation Model 21
References
o Almas Heshmati (The Unitewd Nations University, Wider), “Productivity Growth,
Efficiency and Outsourcing in Manufacturing and Se rvice Industries” Journal of
Economic Surveys, Vol. 17, No. 1, by Blackwell Publishing Ltd. 2003.
o Andrew Sheridan May (Knight Wendling Executive Search Limited, London, UK),
“Business Process Out-Sourcing: A New Test of Management Competence”, Career
Development International, 3/4 [1998]. Pp. 136 -141.
o Arnold Maltz and Lisa Ellram, “Outsourcing Supply Management” The Journal of
Supply Chain Management, Spring, 1999 by the National Association of Purchasing
Management, Inc.
o Barbara J. Spencer (Sauder School o f Business, University of British Columbia),
“International Outsourcing and Incomplete Contracts”, Canadian Journal of
Economics, Vol. 38, No. 4, November, 2005, by Canadian Economic Association.
o Christopher B. Cloti, “Perspective on Global Out -sourcing and the Changing Nature
of Work”, Business and Society Review 109:2, pp. 153 -170.
o Daniel R. Krause, Thomas V. Scannell & Roger J. Calantone, “A structural Analysis
of the Effectiveness of Buying Firms’ Strategies to Improve Supplier Performance”,
Decision Sciences Volume 31 Number 1,
Winter, 2000.
o Gene M. Grossman (Princeton University) and Elhanan Helpman (Harvard
University), “Outsourcing in a Global Economy”, Review of Economic Studies, 2005,
72, PP. 135-159.
o Jennifer Miller, “In Pursuit of Quality – the Volume Control for Fabric Goods is
Getting Out of Hand”, J Consumer4 Studies & Home Economics, 22, 4, December
1998, pp 191-198, by Blackwell Sciences Ltd.
Page 23
Supplier Performance Evaluation Model 22
o Marry Amiti & Shang-Jin wei, “Fear of Service Outsourcing”, Economic Policy April
2005 pp.307-347.
o Peter Chalos & Jaeyoung Sung, “Outsourcing Decisions and Managerial Incentives”,
Decision Sciences Volume 29 Number 4 Fall 1998.
o Ronan Mclvor “Strategic Outsourcing: Lessons from a Systems Integrator”, Business
Strategy Review, 2000, Volume 11 Issue 3, pp 41-50.
o S. Gary Tang (engineering Management Program& Centre for Lean LOGISTICS &
engineered Systems, The University of North Carolina at Charlotte, North Carolina,
USA) and Hector Jaramillo (Supplier Development Team, Jacobsen A Textron
Company, Charlotte, North Carolina, USA), A Model for Evaluation and Selection of
Suppliers in Global Textile and Apparel Supply Chains”, International Journal of
Physical Distribution & Logistics Management, Vol. 35, No. 7, 2005, pp. 503 -523, by
Emerald Group Publishing
Limited.
o Thomas F. Espino-Rodriguez & Victor Padron-Robaina, “A Review of Outsourcing
from the Resource-Based View of the Firm”, International Journal of Management
Reviews, Volume 8, Issue 1, pp. 49 -70, by Blackwell Publishing Ltd. 2006.
o Tiaojun Xiao, Yusen Xia & G. Peter Zhang “Strategic Outsourcing Decisions for
Manufactures that Produce Partially Substitutable Products in a Quantity -Setting
Duopoly Situation”, Decision Sciences Volume 38 Number 1 February, 2007.