Munich Personal RePEc Archive Compound Real Option Valuation with Phase-Specific Volatility: a Multi-phase Mobile Payments Case Study Danny Cassimon and Peter-Jan Engelen and Vilimir Yordanov University of Antwerp, Institute of Development Policy and Management, Antwerp, Belgium, Utrecht University, School of Economics, Utrecht, The Netherlands, Vienna Graduate School of Finance, Vienna, Austria 2011 Online at http://mpra.ub.uni-muenchen.de/46053/ MPRA Paper No. 46053, posted 10. April 2013 18:30 UTC
Transcript
MPRAMunich Personal RePEc Archive
Compound Real Option Valuation withPhase-Specific Volatility: a Multi-phaseMobile Payments Case Study
Danny Cassimon and Peter-Jan Engelen and Vilimir
Yordanov
University of Antwerp, Institute of Development Policy andManagement, Antwerp, Belgium, Utrecht University, School ofEconomics, Utrecht, The Netherlands, Vienna Graduate School ofFinance, Vienna, Austria
2011
Online at http://mpra.ub.uni-muenchen.de/46053/MPRA Paper No. 46053, posted 10. April 2013 18:30 UTC
Compound Real Option Valuation with Phase-Specific Volatility:
a Multi-phase Mobile Payments Case Study
D. Cassimon a e, P.J. Engelen b c e ∗ and V. Yordanov d e
a University of Antwerp, Institute of Development Policy and Management, Antwerp, Belgium
b Utrecht University, School of Economics, Utrecht, The Netherlands cTjalling C. Koopmans Institute, Utrecht, The Netherlands
d Vienna Graduate School of Finance, Vienna, Austria
e RODEO Research Centre, The Netherlands
Citation: Cassimon, D., P.J. Engelen and V. Yordanov (2011), “Compound Real Option Valuation with Phase-Specific Volatility: a Multi-phase Mobile Payments Case Study”, Technovation, vol.31, 240-255.
Abstract:
Multi-staged R&D projects are copy-book cases of compound real options. Traditional compound option models assume a constant volatility over the lifetime of the project. Building on the n-fold compound option model of Cassimon et al. (2004), we extend this model to allow for phase-specific volatility estimates, while preserving the closed-form solution of the model. We illustrate the extended model with a case study of a real option valuation of a multi-stage software application project by a large mobile phone operator and we show how project managers can estimate phase-specific volatilities. Keywords: R&D, real options, compound option model, phase-specific volatility
1. Introduction
Research and development (R&D) and pilot projects constitute important resource allocation decisions within companies. They require considerable investment while their future payoff is highly uncertain. Yet they are crucial for future firm growth by opening up potential investment opportunities further down the road. It is now widely accepted in the literature that such projects should be valued and selected using real option methodology (Trigeorgis, 2000). More and more, real option models are becoming recognised as the alternative investment model that explicitly allows for incorporating strategic issues and operational flexibility in companies’ decision making (Guerrero, 2007). Real option modeling links the value of R&D and pilot projects with the market dynamics in which companies operate, with the way in which consumer demand for its products and services materializes and with its corporate strategy (Dai et al., 2007). In this article we focus on multi-stage R&D and pilot projects. Since a multi-staged project can be seen as a sequence of real options, it can be modeled as a compound option using the generalized n-fold compound option model of Cassimon et al. (2004). Since this compound option model assumes a constant volatility over the lifetime of the project, we extend this n-fold compound option model to allow for phase-specific volatility. At the same time we preserve the closed-form solution of the model. We then apply the model to value a project in the ICT sector that fits these characteristics, using an algorithm
∗ Corresponding author: [email protected] . The authors thank Ye Li for her useful comments on an earlier version of the article.
2
developed in MatlabTM for computations. We zoom in on how project managers can practically estimate phase-specific volatilities in real-life business cases. In this way, this article contributes to the understanding of real option applications by showing that real option pricing formula are not just some fancy mathematical modeling, but can indeed be applied in reality. The case study therefore offers a valuable and practical toolbox for practitioners. The remainder of this paper is structured as follows. Section 2 provides a short literature review on the current stance of real option modeling of R&D investment decisions. The section also summarizes the literature on real option applications in the ICT sector as our case study is situated in this field. Section 3 extends the generalized n-fold compound option model to allow for phase-specific volatilities. Section 4 applies the new model to a real-life case study to illustrate how the model works in practice. Section 5 concludes. 2. Real Option Valuation of Corporate R&D Projects
It is now standard literature that the use of a net present value (NPV) approach to allocate corporate resources through investment opportunities has inherent limitations. The now-or-never decision of the NPV model assumes a firm to follow a rigid path once the investment decision is taken (Feinstein and Lander, 2002). In reality, in a competitive environment with uncertainty and change, projects will not materialize in the same shape as management expected initially. New information might arrive or certain sources of uncertainty might be resolved, making it valuable to companies to adjust their strategy along the way (Trigeorgis, 1996). While the NPV model cannot handle operational flexibilities, real option models are well-equipped to incorporate more dynamic aspects in corporate decision-making (Guerrero, 2007). Different theoretical types of real options have been developed in the early literature, such as options to delay (McDonald and Siegel, 1986), scale options (Trigeorgis and Mason, 1987), options to abandon (Myers and Majd, 1990) and growth options (Amran and Kulatilaka, 1999). More recent literature applies real option models to project and company valuation in different sectors, such as to internet companies (Schwartz and Moon, 2000a), the service sector (Jensen and Warren, 2001), consumer electronics (Lint and Pennings, 2001), pharmaceutical R&D (Cassimon et al., 2004) or even criminal behavior (Engelen, 2004). An important field where real options can contribute significantly is in complex research and development decisions. Several papers therefore propose different solutions for modeling multi-phase R&D investment decisions. A first group of papers use numerical approximations to evaluate such investment projects. Kellog and Charnes (2000), Copeland and Antikarov (2001) and Shockley et al. (2003) use binomial lattice to value a multi-phase R&D investment decision. They use a constant volatility over all phases to calculate the upward and downward move of the underlying asset at each step, assuming a geometric Brownian motion for the underlying. Cortelezzi and Villani (2008) also consider R&D projects as multi-stage decisions, but they approach the valuation problem from a different angle. They model the R&D decision as a sequential exchange option, which allows the holder to exchange the underlying project for a stochastic exercise price, and solve the valuation problem by Monte Carlo simulations. Their model allows for uncertainty both in the gross project value and in the investment costs, each of which follows a geometric Brownian motion and assumes a constant volatility. Schwartz (2004) also uses a Monte Carlo simulation based on the Longstaff and Schwartz (2001) procedure to value pharmaceutical R&D projects with a constant volatility.
3
A second group of papers handles the multi-phase R&D valuation problem with closed-form models. Perlitz, Peske and Schrank (1999) and Jensen and Warren (2001) solve the valuation problem of a multi-phase R&D project by breaking down the complex R&D process in two simplified phases in order to be able to apply the two-period compound option model of Geske (1979). Cassimon et al. (2004) introduce a generalized n-fold compound option approach for multi-phase pharmaceutical R&D projects. This model provides the R&D manager with all decision points at each milestone where a decision can be taken whether it is worthwhile to invest further in the project. Instead of explicitly using multiple phases of an R&D project, Wu and Yen (2007) model the valuation problem as a jump-diffusion process. In contrast to a clearly structured R&D project with specific phases, the use of a Poisson model with random jumps over the lifetime of the project gives the decision-maker less control over the occurrence of the different phases and thus renders a more crude approximation of the exact timing of the different phases. All of the above closed-form models assume a constant volatility over the lifetime of the real option. Real options have also been applied to a wide range of ICT investment problems. Early applications include Dos Santos (1991) who applied real options to ISDN investment projects and Favaro et al. (1998) who examine the use of real options to evaluate software reuse investment. Taudes (1998) applies a real option framework on growth options of a software application, while Benaroch and Kauffman (1999, 2000) apply a simple Black-Scholes option model to analyze the optimal timing of introducing a point-of-sale debit service by the Yankee 24 shared electronic banking network of New England (US). Some papers focused on more general approaches. Erdogmus (1999) discusses the contributions of real options in the valuation of complex options in software development. Benaroch (2002) and Benaroch et al. (2006) use a binomial approach to value multi-stage IT investments and show that applying a simple Black-Scholes model does not correctly value a project because it does not handle all embedded multi-stage options. Schwartz and Zozaya-Gorostiza (2003) develop a general approach to handle the valuation of IT investment projects under uncertainty. Dai et al. (2007) use some analytical approximation to value IT infrastructure projects, while Kumar (2002) uses a Margrabe (1978) type of model to manage risks of IT projects from a real options perspective. Other papers apply real options to different case studies. Basili and Fontini (2003) calculate the real option value of 3G telecom licences (UMTS) in the UK by means of a standard Black-Scholes model, while Taudes et al. (2000) apply real option modeling to a case study of a European car parts manufacturer to decide whether or not to upgrade its software platform from SAP R/2 to SAP R/3. In a similar way Elnegaard and Stordahl (2002) discuss the optimal timing to move from ADSL towards VDSL for a cable operator. Bardhan, Bagchi and Sougstad (2004) use a Margrabe model to value and choose among 31 IT projects of a large US-based energy utility company. Kenyon and Cheliotis (2002) use real option modeling to value so-called ‘dark fiber’. It refers to the capacity of existing optical fiber which is currently not in operational use. As it is an example of an asset that generates no revenue at the moment, but may do so in the future but only after a specified amount of extra investment, real option models are used to solve this business case. Iatropoulos et al. (2004) discuss the valuation of optical fiber investment as well. They analyze the economic potential and risks of establishing a broadband network along the longest motorway in Greece (680 km). D’Halluin et al. (2007) solve the problem of
4
the optimal timing to add capacity to a wireless network by a numerical real option approach. Angelou and Economides (2009) combine real option thinking and analytic hierarchy process to growth options provided by investments in broadband technology, while Kauffman and Kumar (2008) use a jump diffusion process to model network effects of technology investments. Typically, the above studies have in common that they show that traditional valuation models such as NPV undervalue IT investments and they subsequently demonstrate the added-value of using a real option model to solve the investment problem. They do differ in the choice of option-type models to handle the business case and use a wide range of models such as the Black-Scholes model (Benaroch and Kauffman, 1999; Elnegaard and Stordahl, 2002; Basili and Fontini, 2003; Iatropoulos et al., 2004), binomial trees (Favaro et al., 1998; Benaroch et al., 2006; Kenyon and Cheliotis, 2002), the Margrabe model (Dos Santos, 1991; Kumar, 2002; Bardhan et al., 2004) and numerical and analytic approximations (Taudes et al., 2000;
Dai et al., 2007; D’Halluin et al., 2007). However, all of the proposed approaches in the above literature have one thing in common: they all assume a constant volatility of the project return over the life time of the real option. Although it is understandable for reasons of simplicity to assume one constant volatility estimate over the lifetime of the project, in reality the volatility of a project will vary over its different development phases. In a real-life business case one often sees the case in which the volatility of the project return declines over time. This is the case when management will learn more about certain sources of uncertainty (e.g. the market potential) as time elapses and it will be translated into a decreasing volatility metric in the later phases of the project. If we experience such a volatility pattern over the lifetime of a project, assuming one constant volatility metric will overvalue the economic potential of the project. This valuation bias can be an important element in the selection of the project, especially for projects at the margin or for competing projects in a firm’s investment portfolio. It might also contribute to misevaluations of the value of the project and the company, for instance during new financing rounds with outside investors. Although some papers (e.g. Benaroch et al, 2006; Dai et al., 2007) try to mitigate this problem by performing a sensitivity analysis, it becomes clear that the best solution is to incorporate different volatilities per phase in the development process of the project. In this article, we add to the existing literature on multi-phase real options by including phase-specific volatility estimates in compound option valuation models. Our model is most closely related to contemporaneous papers as Agliardi and Agliardi (2005) and Lee et al. (2008). Agliardi and Agliardi (2005) develop a generalized formula for multi-fold compound option pricing with time-dependent parameters. They offer an explicit pricing formula solving N nested Black-Scholes differential equations with multivariate normal integrals. Lee et al (2008) further explore the correlation among the multivariate normal integrations and allow both for put and call compound options. Our pricing formula with deterministic volatility measures per phase is a partial case of these more generalized cases of time-dependent volatility formulas. However, allowing managers to think in terms of average volatilities per phase is more realistic than demanding managers to incorporate a stochastic volatility. In this way, our pricing model is better suited for handling practical, real-life cases. Moreover, the nonlinear-nested high-dimension integrals in the more generalized case make the practical computation very difficult. Especially when the fold number increases, the accuracy and convergence of the numerical solution stays an open issue.
5
3. Compound Real Options in Software Development The development of a new software application consists of several typical phases: it starts with the software design phase, followed by the programming or coding phase, a testing phase and ultimately the launch or commercialization phase (Wysocki, 2006; Rittinghouse, 2004; Stellman and Green, 2005). Software development can therefore be seen as a chain of options as is visualized in Figure 1. The initial project in which a new software tool is considered as a particular business solution, i.e. the conception phase, can be seen as an option on the software design phase. If this conception phase turns out to be successful, the software design phase is started; otherwise the project is being discontinued. Software design involves making a plan for the business solution, its aim, its specifications and the architecture of the programming. It will focus on elements such as the maintainability of the software application, the compatibility with other software applications within the company, the extensibility to allow for future software application opportunities, the user-friendliness, and security issues. The software design phase itself is an option on the coding phase. Software coding refers to the process of translating processes into a computer programming language in a way that a computer can execute specific orders. If the coding phase is successful the project moves to the testing phase; if not, the project is again abandoned. During software testing the new application is analyzed to see whether it performs as expected. Typically, during this phase software bugs and errors are detected and cured (Burnstein, 2003). This testing phase is again an option on the launch of the software. Therefore, analyzing a software application as a solution to a certain business case can be viewed as a chain of options:
(a) decision to start design phase – first option; (b) decision to start coding phase – second option; (c) decision to start testing phase – third option; (d) decision to launch the new software solution – fourth option.
When considering the software development process in this way, compound option analysis can be used for the valuation. The start-up of the project, being a 4-fold compound option on the launch or commercialization phase, cannot be valued using the traditional compound option model of Geske (1979), since it only offers a closed-form solution for a 2-fold compound option. Cassimon et al. (2004) developed a generalized compound option model to value compound options of the order higher than two. Such a closed-form solution for an n-fold compound option is preferred over numerical approximations which are often used to value R&D or pilot projects1.
1 A closed-form expression offers a mathematical solution in terms of functions and mathematical operations. This analytical solution has the form of x=f(a,b) and gives the theoretical solution for an option valuation problem within a set of assumptions. Numerical approximations, including lattice approaches and Monte Carlo simulations, only offer an approximation of the true theoretical value. In this way, a closed-form solution is preferred over numerical approximations since it gives the true value directly. Obviously, a closed-form solution is not always available to handle all real option valuations. In such cases, numerical approximations are preferred. For instance, lattice approaches are more flexible to handle more complicated, real-life cases. Monte
Carlo simulations can also be helpful when estimating input parameters.
6
Figure 1. Typical compound option phases in software development
success
success
failure
failure
discontinuation
discontinuation
soft
war
e d
esig
n
ph
ase
soft
war
e co
din
g p
has
e
success
failure discontinuation
test
ing
ph
ase
cash flowssuccess
failure discontinuation
lau
nch
ph
ase
software
solution
success
failure discontinuation
This compound option approach however assumes a constant volatility over the life-time of the real option. In reality this is usually not the case. It is more realistic to assume that the volatility of the project returns varies over the lifetime of the real option. Therefore we need to take into account phase-specific volatility measures. We therefore extend the basic n-fold compound option model of Cassimon et al. (2004) by incorporating phase-specific volatility measures. If C1(V,t) represents the n-fold compound call option, the closed-form solution of the compound option adjusted for phase-specific volatilities can be written as follows:
(1) ( ) ( ) ( )∑+
=
−−+++ ⋅⋅−⋅=
1
1
121
1
112111 ;,...,,;,...,,k
m
m
mm
ttr
m
k
kk RbbbNeKRaaaNVC m
with
(2)
( )1,2 ;
2ln
2
+=−
−
−+
= ,ktt
ttrV
V
b Kl
ll
l
l
l
l
σ
σ
(3) 1,2 ; +=−+= ,kttba Klllll
σ
(4) jitt
tt
j
iij <
−
−= ;ρ
(5) l
V is the solution of ( ) ,kKtVC Kllll
,2 ;,1 ==+
(6) nn KV =
(7) ( )
<==
==
= jiaa
aaR
ijjiij
ii
jiij ;
1 with
,,2,1,1 ρlK
ll
where ti: maturity date for the compound call option Ci, Ki: exercise price for the compound call option Ci, Ci: current value of the compound call option with the underlying compound option Ci+1 and with the boundary condition Ci(V,ti) = max(0,Ci+1(V,ti)-Ki), Nn(a1,…,an;R): n-variate cumulative normal distribution function with ai as upper limits and R as the correlation matrix,
7
2
iσ : variance of the project return for phase i, with i=1, …, n.
r: risk-free interest rate, and V: current value of the underlying project. Appendix A offers the full mathematical proof to derive a closed-form solution for an n-fold compound option model with phase-specific volatilities. Subsequently, the model can be programmed for concrete calculations using computational software. As part of this paper, the authors programmed the model algorithm in MatlabTM to show the actual implementation of the extended model on a practical business case. Appendix B provides the full description of the algorithm in Matlab code. In this way, practitioners can not only replicate our calculations, but also apply the model to real-life valuation problems. In the next section we apply the n-fold compound option model with phase-specific volatilities on a real-life R&D case of a large ICT company and compare it to the standard case of the n-fold compound option model with constant volatility.
4. Example of Compound Real Option Valuation
In what follows, the generalized n-fold compound real option valuation model with phase-specific volatilities is applied to a real-life R&D project of a large mobile phone operator in Europe. For reasons of confidentiality, its name, product references and figures are modified. The calculations examine the business case of a large European mobile phone operator developing a payment system through mobile phones. Instead of paying cash or with credit card, consumers are expected to increasingly use their mobile phones for payments. Especially in business-to-consumer mobile commerce mobile payment is expected to take off in the coming years (Chen and Nath, 2004; Hsieh et al., 2008; Laukkanen, 2007; Smith, 2006). Broadly speaking, two forms of mobile payment systems can be distinguished: SMS-based mobile payment and contactless mobile payment.2 SMS-based mobile payment is a remote payment system in which the outcome of the transaction is communicated to the consumer as a text message (Chen, 2008).3 Panel a of Figure 2 shows that the mobile phone makes a long distance contact with a base station antenna. The transaction is usually billed through operator billing, credit card or direct debit billing. This payment method has been used intensively for mobile content such as ringtones, games, logos and online information retrieval. It is also used, for instance, for the purchase of tickets for public transport: in Belgium the public transport company De Lijn uses SMS-ticketing for the purchase of a one-time bus ticket, while Deutsche Bahn uses MMS-ticketing for the purchase of train tickets in Germany.4
2 Petrauskas and Zumaras (2008) use a similar classification of remote versus proximity mobile payment systems. Juniper (2008a) classifies mobile payments in remote payments where the retailer is remote to the mobile phone user and Physical Point-of-Sale payments when the retailer is physical and the user is located at or near the retailer. The latter can be SMS-based or contactless. 3 Alternatively, payments through WAP, GPRS, UMTS or other online mobile internet access are also used. 4 See http://www.delijn.be/verkooppunten/sms_ticketing_copy.htm and http://www.deutschebahn.com/site/bahn/en/travelling/tickets/ticket__booking/ticket__booking.html.
8
Figure 2. SMS-based versus NFC-based mobile payment systems
Panel a
SMS-based
Panel bContactless
Public transport
Cinema visit
SMS
Mobile
Base station
Base station
Mobile NFC reader
NFC
Contactless mobile payment is a proximity payment system with an operating distance under 20 cm and no contact with a base station antenna (Panel b of Figure 2). In Europe and the U.S. mainly the short-range wireless communication technology Near Field Communication (NFC) is used for this type of mobile payments (Kostakos and O’Neill, 2007).5 A mobile phone with an embedded contactless chip will make automatic or manual initiated communication with an NFC reader within a short distance (Chen, 2008). This is a convenient and fast payment system for low value transactions at manned Point-of-Sales such as kioks or fast food restaurants or unmanned Point-of-Sales such as soda vending machines, movie tickets, or parking tickets (Petrauskas and Zumaras, 2008). Early pilot projects of business applications might include mobile payment for car parking in cities, purchase of tickets for public transport, payment in cinemas and payment for sport events (Juniper, 2008c). For instance, in France telecom operator Bouygues Telecom launched a pilot project using mobile phones as travel passes on the metro network in Paris; in the U.K. Manchester City Football Club launched a similar pilot project.6 The commercial potential of NFC is important as NFC mobile payments are estimated to exceed $75 billion globally by 2013 (Juniper, 2008b). Ondrus and Pigneur (2007) discuss the market potential of NFC in more detail. Although the mobile phone operator in our case study believes in this business case, the company will only take a decision during or at the end of the development of the supporting software application. At the moment of starting the project the market potential and consumer adaptability is still uncertain. Chen (2008) and Gerpott and Kornmeier (2009) discuss critical issues in consumer acceptance of mobile payments. However, over time, the mobile phone operator will be able to learn more about the commercial viability of the project. At each stage of the process, the company has a clear decision moment to decide to abandon this project or to move ahead and finally launch the new payment service. At the moment of analysis (the start of 2008), the project was assumed to enter the software design phase in the third quarter of 2008, and, in case of success, move to the coding phase in the fourth quarter of 2008 and the testing phase in the second half of 2009, and, again in case of success, a commercial product launch starting in 2010. The project’s valuation accounts for a commercialization cycle lasting until 2015. The costs of the development phases and the net
5 In Japan the alternative communication technology FeliCa is used. For more technical details, see Juniper (2008b). For more use of NFC in retail, see Resatsch et al. (2007). 6See http://www.contactlessnews.com/2005/10/26/first-in-france-axalto-and-bouygues-telecom-integrate-navigo-travelcard-into-mobile-phone/ and http://www.cardtechnology.com/article.html?id=200608306K5P5YCW.
9
cash flows of the commercialization phases are estimated using internal company information. Table 1 provides an overview of the different cash flows which project managers expect the project to generate at each phase of its development. The first two columns provide information of the phase and the year of occurrence. Column three presents summary information of these costs for the different phases (i), with estimates being calculated as beginning of period (t) present values (Ii,t). Column 4 presents information on the expected value of the project, i.e. the net operational cash flows of the project for the different phases i, calculated as beginning of period (t) present value, Vi,t. For this project, operational cash flows are only generated from the launch of the commercialization phase on. Table 1. Project characteristics
Phase Year I i,t Vi,t
Conception 2008 -1.4
Software design 2008, 3Q -12.4
Coding 2008, 4Q -21.6
Testing 2009, 2H -10.1
Launch 2010 -32.3 103.94 Legend: Ii,t is the present value of the development cost or the commercialization cost for each project phase i,
calculated as its present value at the start-of-period t, discounted at the firm’s weighted average cost of capital
(wacc) of 10%. Vi,t is the expected project value, i.e. the operational cash flows for each project phase i,
calculated as its present value at the start-of-period. I and V are in million EUR.
While the generalized n-fold compound option approach assumes a constant volatility over the life-time of the real option, it is more realistic to assume that the volatility of the project returns varies over the lifetime of the real option. Therefore, section three extended the basic compound option model to allow for phase-specific volatilities. The estimation of the project’s volatility is not an easy task in the whole valuation exercise. To obtain a reliable estimate for this project a combination of expert opinions and matching the risk characteristics of the project with past projects of the mobile phone operator was used. We use a concrete methodology developed by Arnold and Shockley (2001) and Shockley (2007). In this methodology, the project management team is asked to provide a set of project value scenarios and is then asked to attach subjective probabilities to each of these scenarios, expressed as the likelihood that the realized project value is higher (for good cases), or lower (for the worst case scenario) than the particular scenario. These subjective probabilities are then compared to the computed theoretical probabilities under a normal distribution, using the project’s parameters, for a range of volatilities. The particular volatility selected is the one that provides the optimal match between both sets of probabilities. In this paper, this methodology is repeated for each of the phases, providing an optimal phase-specific volatility. Appendix C provides a detailed overview of the methodology used to compute these specific phase-dependent volatilities. Applying the methodology to our case selects an estimate of 54% to be a realistic volatility of the project return at the early stage of the project. However, the project managers expect to learn more about the commercial profitability of the project in the second half of 2008. Therefore, they believe a volatility estimate of 42% for the coding phase accurately reflects the lower uncertainty. As time elapses and the company will learn more about the market potential of mobile payments, the input volatility metric will decrease to 37% during the testing phase and 35% during the launch phase. This declining volatility is more realistic for such projects than assuming a constant volatility. Note that even though the project team
10
assumes a decreasing volatility of the project return over the life-time of the project, obviously other volatility patterns can be incorporated in our model. Table 2. Valuation of the project according to the n-fold compound option model with phase-
specific volatility
Phase Year ti Ki σσσσi V0 4-fold COV
1.Software design
2008, 3Q 0.5 12.4 0.54
2.Coding 2008, 4Q 0.8 21.6 0.42
3.Testing 2009, 2H 1.5 10.1 0.37
4.Launch 2010 2 32.3 0.35 85.9 20.14 Legend: ti is the maturity date for the compound call option Ci (expressed in years), Ki is the exercise price for
the compound call option Ci,; V is the current value of the underlying project; σi is the phase-specific standard
deviation of the project return and COV is the compound option value based on 4-fold compound option model.
Ki,, V and COV in million EUR. The risk-free interest rate amounts to 3.5%.
Table 2 summarizes the input parameters for the calculation of the 4-fold compound real option value of this project. The first column of Table 2 refers to each development phase, while the second column gives the estimated year of reaching that phase. For each phase, the fourth column gives its after-tax development cost. This is the exercise price of each real option in the chain of the compound options (Ki ). For instance, it is expected that the project moves to the coding phase in the fourth quarter of 2008 (t2 = 0.8) at a cost of EUR 21.6 million. The current value of the underlying project net cash flows, measured in present value at the start of the project, V0, amounts to EUR 85.9 million7, and the risk-free interest rate is equal to 3.5%. The volatility estimates for each phase can be seen in column five of Table 2. As already indicated in the previous section, the model was programmed in MatlabTM (Appendix B provides the full description of the algorithm in Matlab code). Plugging all parameters in the extended n-fold compound option model yields a compound option value of EUR 20.14 million. Subtracting the cost of starting-up the project (EUR 1.4 million, see table 1) yields a total project value of EUR 18.74 million. To what extent does using phase-specific volatilities changes the option value of the project, compared to using a single volatility? In order to answer this question, we also computed the real option value of the project using the standard single-volatility compound option model. Table 3 provides again an overview of the basic parameters, and the resulting option value. Table3. Valuation of the project according to the n-fold compound option model with constant
volatility
Phase Year ti Ki V0 4-fold COV
1.Software design
2008, 3Q 0.5 12.4
2.Coding 2008, 4Q 0.8 21.6
3.Testing 2009, 2H 1.5 10.1
4.Launch 2010 2 32.3 85.9 22.19 Legend: ti is the maturity date for the compound call option Ci (expressed in years), Ki is the exercise price for
the compound call option Ci,; V0 is the expected value of the underlying project estimated as the start of the
project (2008) value and COV is the compound option value based on 4-fold compound option model. Ki, V0 and
7 This is equal to the expected value of the project V as expressed in present value terms at launch (103.94 million, see column 4 of table 1) discounted to the beginning of 2008 at the firm’s wacc of 10%.
11
COV in million EUR. The constant standard deviation of the project return (σ) is estimated to be 54%. The risk-
free interest rate amounts 3.5%.
In this case the volatility of the project return as measured by its standard deviation is assumed to be constant over the lifetime of the project and is estimated to be 54%. Using the different parameters in the 4-fold compound option renders a compound option value of EUR 22.19 million. Since finishing the conception phase costs approximately EUR 1.4 million, the net project value amounts to EUR 20.79 million. This results seems logical compared to the EUR 20.14 million EUR project value of the phase-specific n-fold compound option model since this model involves lower volatility estimates in the later phases of development compared to the case that assumes the highest volatility estimate of 54% in all phases. This is normal as standard option theory predicts a lower option value given a lower volatility of the underlying asset. For this project, the valuation analysis shows that assuming one constant volatility metric over the lifetime of the project slightly overvalues the economic potential of the project. Whether this bias is serious enough to distort valuation and project selection procedures largely depends on the difference between the actual volatilities at each phase compared to the level of the assumed constant volatility. In our example using one constant volatility overestimates the real option value by more than 10%. Although it did not change the decision to invest in the project in our example, it might be an important issue in valuing the company (or the project) in a financing round with new outside investors. 5. Conclusions
In this article we apply compound option valuation methodologies to a specific multi-phase software development project in the ICT sector. In order to obtain a more realistic project evaluation tool to help management to control the software development process, we extended the basic generalized n-fold compound option model of Cassimon et al. (2004). The extended model allows volatility to vary along the different phases of the software development process. Such approach matches more real-life cases as most of the times the volatility of the project returns will vary over the lifetime of the real option. The extended model with time-varying volatility measures was illustrated by a real-life case of a European mobile phone operator. In this particular case, using phase-specific volatilities resulted in a real option value of 18.74 million EUR, which is about 10% lower than the option value calculated using a fixed volatility over the lifetime of the project (20.79 million EUR). Although, in this case, the results did not alter the basic decision to go ahead with the project, this extended approach does provide us with a more accurate value of the project, which is crucial when one wants to accurately value the firm’s net worth. Furthermore, it developed a concrete methodology to calculate these phase-specific volatilities by calibrating subjective probabilities by the project management team under different project value scenarios to the theoretical probabilities under a normal distribution, and then selecting that particular volatility that provided the optimal match between both sets of probabilities. Furthermore, the application to a concrete case also shows that this extension can be easily integrated in existing software used to value these multi-stage compound option projects.
12
References Agliardi, E. and R. Agliardi (2005), “A closed-form solution for multicompound options”, Risk Letters, vol.1, 1-2. Amran, M. and N. Kulatilaka (1999), Real Options, Managing Strategic Investment in an
Uncertain World, Boston, MA, Harvard Business School Press. Angelou, A. and A. Economides (2009), “A compound real option and AHP methodology for evaluating ICT business alternatives”, Telematics and Informatics, vol.26, no.4, 353-374. Arnold, T. and R. Shockley (2001), “Value Creation at Anheuser-Busch: a Real Options Example”, Journal of Applied Corporate Finance, vol.14, no.2, 52-61. Bardhan, I., S. Bagchi and R. Sougstad (2004), “Prioritizing a Portfolio of Information Technology Investment Projects”, Journal of Management Information Systems, vol.21, no.2, 33-60. Basili, M. and F. Fontini (2003), “The option value of the UK 3G telecom licences: was too much paid?”, Journal of Policy, Regulation and Strategy for Telecommunications, vol.5, no. 3, 48–52. Benaroch, M. (2002), “Managing investments in information technology based on real options theory”, Journal of Management Information Systems, vol.19, no.2, 43-84. Benaroch, M. and R.J. Kauffman (1999), “A Case For Using Real Options Pricing Analysis To Evaluate Information Technology Project Investment”, Information Systems Research, vol.10, no.1, 70-86. Benaroch, M. and R.J. Kauffman (2000), “Justifying Electronic Banking Network Expansion Using Real Options Analysis”, MIS Quarterly, vol.24, no.2, 197-225. Benaroch, M., S. Shah and M. Jeffery (2006), “On the Valuation of Multistage Information Technology Investments Embedding Nested Real Options”, Journal of Management
Information Systems, vol.23, no.1, 239-261. Brach, M. and D. Paxson (2001), “A Gene to Drug Venture: Poisson Options Analysis”, R&D
Management, vol.3, no.2, 203-214. Burnstein, I. (2003), Practical Software Testing, Springer, 400p. Cassimon, D., P.J. Engelen, L.Thomassen and M. Van Wouwe (2004), “The Valuation of a NDA using a 6-fold Compound Option”, Research Policy, vol.33, no.1, 41-51. Chen, L. (2008), “A Model of Consumer Acceptance of Mobile Payments”, International
Journal of Mobile Communications, vol.6, no.1, 32-52. Chen, L. and R. Nath (2004), “A framework for mobile business applications”, International
Journal of Mobile Communications, vol. 2, pp.368–381.
13
Copeland, T. and V. Antikarov (2001), Real Options. A Practitioner's guide. Texere. Cortellezzi, F. and G. Villani (2009), “Valuation of R&D sequential exchange options using Monte Carlo approach”, Computational Economics, vol.33, 209-236. Dai, Q., R.J. Kauffman and S.T. March (2007), “Valuing Information Technology Infrastructures: A Growth Options Approach”, Information Technology and Management, vol.8, 1-17. D’Halluin, Y., P.A. Forsyth and K.R. Vetzal (2007), “Wireless Network Capacity Management: A Real Options Approach”, European Journal of Operational Research, vol. 176, 584-609. Doctor, R., D. Newton and A. Pearson (2001), “Managing Uncertainty in Research and Development”, Technovation, vol.21, 79-90. DosSantos, B. L. (1991), “Justifying Investments in New Information Technologies”, Journal
of Management Information Systems, vol.7, no.4, 71-90. Engelen, P.J. (2004), “Criminal Behavior: A Real Option Approach. With an Application to Restricting Illegal Insider Trading”, European Journal of Law and Economics, vol.17, nr. 3, 329-352. Elnegaard, N. and K. Stordahl (2002), “Deciding On The Right Timing Of VDSL Rollouts: A Real Option Approach”, ISSLS 2002. TONIC. Publication, Seoul. Erdogmus, H. (1999), “Valuation of Complex Options in Software Development”, in Proc. of
First Workshop on Economics Driven Software Engineering Research (EDSER1), Los Angeles, California, pp.6. Favaro, J.M., K.R. Favaro and P.F. Favaro (1998), “Value Based Software Reuse Investment”, Annals of Software Engineering, vol.5, 5-52. Feinstein, S. and D. Lander (2002), “A Better Understanding of Why NPV Undervalues Managerial Flexibility”, The Engineering Economist, vol.47, 418-435. Gerpott, T. and K. Kornmeier (2009), “Determinants of customer acceptance of mobile payment systems”, International Journal of Mobile Communications, vol.3, no. 1, 1-30. Geske, R. (1979), “The Valuation of Compound Options”, Journal of Financial Economics, vol.7, no.1, 63-81. Guerrero, R. (2007), “The Case for Real Options Made Simple”, Journal of Applied
Corporate Finance, vol.19, 38-49. Hsieh, C., C. Jones and B. Lin (2008), “The new business potential with mobile commerce”, International Journal of Mobile Communications, vol. 6, no. 4, 436 – 455.
14
Iatropoulos, A., A.Economides and G. Angelou (2004), “Broadband investments analysis using real options methodology: a case study for Egnatia Odos S.A.”, Communications and
Strategies, vol. 55, no.3, 45–76. Jensen, K. and P. Warren (2001), “The Use of Options Theory to Value Research in the Service Sector”, R&D Management, vol.31, no.2, 173-180. Juniper (2008a), Mobile Payment Markets: Money Transfers & Remittances 2008-2013, Juniper Research, 114 p. Juniper (2008b), Mobile Payment Markets: Contactless NFC 2008-2013, Juniper Research, 104 p. Juniper (2008c), Mobile Ticketing: Transport, Sport, Entertainment & Events 2008-2013, Juniper Research, 140 p. Kauffman, R.J. and A. Kumar (2008), “Network Effects and Embedded Options: Decision-Making Under Uncertainty for Network Technology Investments”, Information Technology
and Management, vol.9, 149-168. Kellog, D. and J.M. Charnes (2000), “Real-options valuation for a biotechnology company”, Financial Analysts Journal, vol.56, no.3, 76–84. Kenyon, C. and G. Cheliotis (2002), “Dark fiber valuation”, The Engineering Economist, vol. 47, 264–307. Kester, W. (1984), “Today’s Options for Tomorrow’s Growth”, Harvard Business Review, vol.62, no.1, 153-160. Kostakos, V. and E. O’Neill (2007), “NFC on mobile phones: issues, lessons and future research”, in: Pervasive Computing and Communications Workshops, 2007. PerCom
Workshops '07. Fifth Annual IEEE International Conference, 367-370.
Kumar, R.L. (2002), “Managing Risks in IT Projects: an Options Perspective”, Information
and Management, vol.40, 63-74. Laukkanen, T. (2007), “Measuring mobile banking customers’ channel attribute preferences in service consumption”, International Journal of Mobile Communications, Vol. 5, 123–138. Lee, J. and D. Paxson (2001), “Valuation of R&D Real American Sequential Exchange Options”, R&D Management, vol.31,no.2, 191-201. Lint, O. and E. Pennings (2001), “An Option Approach to the New Product Development Process: A Case Study at Philips Electronics”, R&D Management, vol.31, no.2, 163-172. Longstaff, F. and E. Schwartz (2001), “Valuing American Options by Simulation: A Simple Least-Square Approach”, Review of Financial Studies, vol.14,no.1, 113-147. Margrabe, W. (1978), “The Value of an Option to Exchange One Assets for Another”, Journal of Finance, vol.33, 187-193.
15
McCarthy, J. (2006), Dynamics of Software Development, Microsoft Press, 224p. McDonald, R. and D. Siegel (1986), “The Value of Waiting to Invest”, Quarterly Journal of
Economics, vol.10, 707-727. Myers, S. (1984), “Finance Theory and Financial Strategy”, Interfaces, 14, 126-137. Myers, S. and S. Majd (1990), “Abandonment Value and Project Life”, Advances in Futures
and Options Research, vol.4, 1-21. Newton, D. and A. Pearson (1994), “Application of Option Pricing Theory to R&D”, R&D
Management, vol.24, 83-89. Newton, D., D.A. Paxson and M. Widdicks (2004), “Real R&D Options”, International
Journal of Management Reviews, vol.5/6, no.2, 113-130. Ondrus, J. and Y. Pigneur (2007), “An Assessment of NFC for Future Mobile Payment Systems”, in: Proceedings of the International Conference on the Management of Mobile
Business, 43. Paxson, D. (2003), “Genzyme Biosurgery: a Virtual Real R&D Option Case”, in D. Paxson (ed.), Real R&D Options, Oxford, Butterworth-Heinemann, 271-290. Pennings, E. and O. Lint (1997), “The Option Value of Advanced R&D”, European Journal
of Operational Research, vol.103, 83–94. Perlitz M., T. Peske and R. Schrank (1999), “Real options valuation: the new frontier in R&D project evaluation?”, R&D Management, vol.29, no.3: 255-270. Petrauskas, R. and L. Zumaras (2008), “Comparative Analysis Of Mobile Payments In The European Union”, Intellectual Economics, vol. 2, no. 4, 59–64. Resatsch, F., S. Karpischek, S. Hamacher and U. Sandner (2007), “Mobile Sales Assistant - NFC for retailers”, ACM International Conference Proceeding Series; Vol. 309. Proceedings
of the 9th international conference on Human computer interaction with mobile devices and
services, 313-316. Rittinghouse, J. (2004), Managing Software Deliverables: A Software Development
Management Methodology, Elsevier Digital Press, 320p. Schwartz, E. (2004), “Patents and R&D as Real Options”, Economic Notes, vol.33, no.1, 23-54. Schwartz, E. and M. Moon (2000), “Rational Pricing of Internet Companies”, Financial
Analysts Journal, vol.56, 62-75. Schwartz, E. and M. Moon (2001), “Rational Pricing of Internet Companies Revisited”, The
Financial Review, vol.36, 7-26.
16
Sharpe, P. and T. Keelin (1998), “How SmithKline Beecham makes better resource-allocation decisions”, Harvard Business Review, vol.76, no.2, 45–57. Shockley, R. (2007), An Applied Course in Real Options Valuation,Thomson South-Western, 523p. Shockley, R., S. Curtis, J. Jafari and K. Tibbs (2003), “The Option Value of an Early-stage Biotechnology Investment”, Journal of Applied Corporate Finance, vol.15, no.2, 44–55. Silverman, D. (1999), “Solution of the Black Scholes Equation Using the Green’s Function of the Diffusion Equation”, online at: http://www.physics.uci.edu/~silverma/bseqn/bs/bs.html Smith, A.D. (2006), “Exploring m-commerce in terms of viability, growth and challenges”, International Journal of Mobile Communications, vol. 4, pp.682–703. Stellman, A. and J. Green (2005), Applied Software Project Management, O'Reilly Media, 322p. Taudes, A. (1998), “Software Growth Options”, Journal of Management Information
Systems, vol.15, no.1, 165-185. Taudes, A., M. Feurstein and A. Mild (2000), “Options Analysis of Software Platform Decisions: A Case Study”, MIS Quarterly, vol. 24, No. 2, 227-243. Trigeorgis, L. (1996). Real Options. MIT Press, p. 427. Trigeorgis, L. (2000), “Real options and financial decision-making”, Contemporary Finance
Digest, 25-42. Trigeorgis, L. and S. Mason (1987), “Valuing Managerial Flexibility”, Midland Corporate
Finance Journal, vol.5, 14-21. Van Bossuyt, M. and L. Van Hove (2007), “Mobile payment models and their implications for NextGen MSOs”, Journal of Policy, Regulation and Strategy, vol.9, no.5, p. 31-43. Wu, M-C. and S. H. Yen (2007), “Pricing real growth options when the underlying assets have jump-diffusion processes: the case of R&D investments”, R&D Management, vol. 37, 269-276. Wysocki, R. (2006), Effective Software Project Management, Wiley, 618p.
17
Appendix I. Proof of the valuation formula of the n-fold compound option with phase-
specific volatilities Let C1(V,t) be the price of a compound call option of order (k+1). Then the following formula is valid:
( ) ( ) ( )∑+
=
−−+++ ⋅⋅−⋅=
1
1
121
1
112111 ;,...,,;,...,,k
m
m
mm
ttr
m
k
kk RbbbNeKRaaaNVC m .
where
1,2 ; +=−+= ,kttba Klllll
σ
( )1,2 ;
2ln
2
+=−
−
−+
= ,ktt
ttrV
V
b Kl
ll
l
l
l
l
σ
σ
lV is the solution of ( ) ,kKtVC Kl
lll,2 ;,1 ==+
jitt
tt
j
iij <
−
−= ;ρ
( )
<==
==
= jiaa
aaR
ijjiij
ii
jiij ;
1 with
,,2,1,1 ρlK
ll
Proof.
Since C1 is a call option, the following PDE
holds:2
1
222
11
11
2
1
S
CV
S
CVrCr
t
C
∂
∂⋅⋅−
∂
∂⋅⋅−⋅=
∂
∂σ ,
with C1(V,t1) = max (0, C2(V,t1)-K1) as boundary condition.
Silverman (1999) shows that a PDE such as 2
2 2
2
1
2i i i
i i
C C Cr C r V V
t S Sσ
∂ ∂ ∂= ⋅ − ⋅ ⋅ − ⋅ ⋅
∂ ∂ ∂, with
boundary condition at time ti given by ( ) ( )( )iiiii KtVCtVC −= + ,,0max, 1 and with iV defined
as the value for which ( ) iiii KtVC =+ ,1 can be rewritten as a diffusion equation. Indeed, first
we choose w as iV
Vw ln= and define the function ( )twx , as
( ) ( ) ( ) ( ) ( )teVCetVCetwx w
ii
ttr
i
ttr ii ,,, ⋅⋅=⋅= −− .
Secondly, we rescale the independent variables as
18
( )
2
2
2
2
2
1
21
2
1
2
1
2
i
i
i
i
i
r
w w
r
s t t
σ
σ
σ
σ
−
′ =
− = −
,
and we define the function ( )swx ,ˆ ′ as ( ) ( )twxswx ,,ˆ =′ . With swp +′= , we can rewrite the
dependent variable as ( ) ( )swxspx ,ˆ,~ ′= . Then it follows in a straightforward way that this last
function satisfies the diffusion equation 2
2 ~~
p
x
s
x
∂
∂=
∂
∂.
Making use of the above results, the PDE for C1 can be transformed into a diffusion equation:
2
2 ~~
p
x
s
x
∂
∂=
∂
∂,
with adjusted boundary conditions for the variables p and s:
( )( )
<
≥−=
1
1112
0
,0,~
VVif
VVifKtVCpx ,
with 1V being the solution of C2-K1 = 0,
or
( )( ) ( ) ( )
<
≥⋅⋅−⋅=
∑+
=
−−
−−
+
00
0;,...,,;,...,,0,~
1
2
1
23212132
pif
pifRfffNeKRdddNVpx
k
m
m
mm
ttr
m
k
kkm
.
By introducing the notations
1,...,3,21 +=−+= kwithttfd lllll
σ
( )1,...,3,2
2ln
1
1
2
+=−
−
−+
= kwithtt
ttrV
V
f l
ll
l
l
l
l
σ
σ
and for k,...,2=l the matrices
( )
−
−=
<==
=
=
+
+
++=
11
11
11,1,...,2,1,2
1
tt
tt
jitrr
r
whererR
j
i
jijiij
ii
jiij ρl
ll
we find the following expression for S at t = t1:
19
,
2
12
1
exp2
1
2
1
1
−
= p
r
VV
σ
σ
which will be used later on.
Using the Green’s function as delta-function8, the expression for ( )spx ,~ can be written as:
( ) ( ) ( )∫+∞
∞−′′−⋅′= pdsppGpxspx ,0,~,~ , with ( )
( )s
pp
es
sppG 4
2
4
1,
′−−
⋅Π
=′− ,
or
( ) ( ) ( )
( ) ( ) ( )
( )pd
s
pp
sK
pds
pp
sRffNeK
pds
pp
sRddNp
r
Vspx
m
mm
k
m
ttr
m
k
kk
m
′
′−−⋅
Π⋅−
′
′−−⋅
Π⋅⋅⋅−
′
′−−⋅
Π⋅⋅
′
−
⋅=
∫
∫ ∑
∫
∞+
−−
∞+ +
=
−−
∞+
+
4exp
4
1
4exp
4
1;,...,
4exp
4
1;,...,
2
12
1
exp,~
2
01
2
1
2210
1
2
0
2
2122
1
2
1
1
1
σ
σ
.
A substitution of s
ppb
2
−′= in all of the three integrals and a second substitution
ttbb −−=′11σ in the first integral, lead to the following expression:
( ) ( ) ( )
( ) ( )
dbb
K
dbb
RffNeK
bdb
RddNeVspx
m
mmf
k
m
ttr
m
d
k
kk
ttr
m
−⋅
Π⋅−
−⋅
Π⋅⋅⋅−
′
′−⋅
Π⋅⋅⋅=
∫
∫ ∑
∫
∞+
−−
∞+
−
+
=
−−
∞+
−+
−
2exp
2
1
2exp
2
1;,...,
2exp
2
1;,...,,~
2
01
21
2
**
21
1
2
2
2
*
1
*
2
1
1
1
1
.
In these calculations the new integration boundaries can be found as:
( )
tt
ttrV
V
f−
−
−+
−=−11
1
2
1
1
1
2
1ln
σ
σ
( )ttfd −+−=− 1111 σ ,
8 Consider the Green’s function ( )( )
t
zz
et
tzzG ′
′−−
⋅′Π
=′′− 4
2
4
1, , which clearly satisfies the diffusion equation
2
2
z
G
t
G
∂
∂=
′∂
∂ . Note that G behaves like a delta-function in 0=′t . If zz ′≠ and 0→′t then ( ) 0, →′′− tzzG and if
zz ′= and 0→′t then ( ) ∞→′′− tzzG , . The integral over z′ is equal to
( ) ∫ ∫∫∞+
∞−
∞+
∞−
∞+
∞−=
−
Π=
−
Π−=′′′− 1
2exp
2
1
2exp
2
1,
22
dqq
dqq
zdtzzG .
20
while for 1,...,3,2 += kl we get:
( )
1
1
2
2
2
1
2
1
2
12
1
ln
tt
ttrp
rV
V
f−
−
−+′
−
+
=ll
ll
l
l
l
l
σ
σ
σ
σ
tt
ttif
bbf
−
−=
−
+=
l
l
l
ll
l
11
2
1
1*
1ρ
ρ
ρ
and
( )
1
1
2
2
2
1
2
1
2
12
1
ln
tt
ttrp
rV
V
d−
−
++′
−
+
=ll
ll
l
l
l
l
σ
σ
σ
σ
2
1
1*
1l
ll
l
ρ
ρ
−
′+=
bad .
An application of theorem A.1 in the first integral leads to the final expression for ( )spx ,~ :
( ) ( ) ( ) ( ) ( ) ( )111
1
2
121
1
11211 ;,...,,;,...,,,~ 11 fNKRbbfNeKRaadNeVspxk
m
m
mm
ttr
m
k
kk
ttr m ⋅−⋅⋅−⋅⋅= ∑+
=
−−+++
−
where the correlation matrices can be written as:
( )
<==
==
+=
+
jiifrr
rwithrR
ijjiij
ii
kjiij
k
ρ
1
1,...,2,1,
1
1
and for m = 2, 3,…, k+1:
( )
<==
==
= jiifrr
rwithrR
ijjiij
ii
mjiij
m
ρ
1
,...,2,1,1 .
The final form for the (k+1) fold compound call option therefore equals
( ) ( ) ( ) ( ) ( ) ( )111
1
2
121
1
1121111;,...,,;,...,,, bNeKRbbbNeKRaaaNVtVC
ttrk
m
m
mm
ttr
m
k
kkm ⋅⋅−⋅⋅−⋅= −−
+
=
−−+++ ∑
with
1,21 +=−+= ,k,ttba Klllll
σ
( )
1,21 2
ln
2
+=−
−
−+
= ,k,tt
ttrV
V
b Kl
ll
l
l
l
l
σ
σ
lV determined by ( ) ,k,KtVC Kl
lll,21 ,1 ==+
MV k =+1
ji tt
tt
j
i
ij <−
−=ρ
21
( )
<==
==
= ji rr
r withrR
ijjiij
ii
jiij ρ
1
,,2,1,1 lK
ll
�
Lemma A.1.
If
−
−
−
−
−
−
=
2
1
2
12
2
1
1
2
12
12
1
10
...
1
10
111
k
k
k
a
a
a
a
a
a
A
O
O
O
L
Then
−
−=−
2
1
2
12
112
1
10
...
10
1
k
k
a
a
aa
A
O
O
O
L
by the use of the principle of partitioning. □ Lemma A.2.
If
=−
0
...
0
0...01
1BA , then
=−
0
...
0
0...01
1
BA .
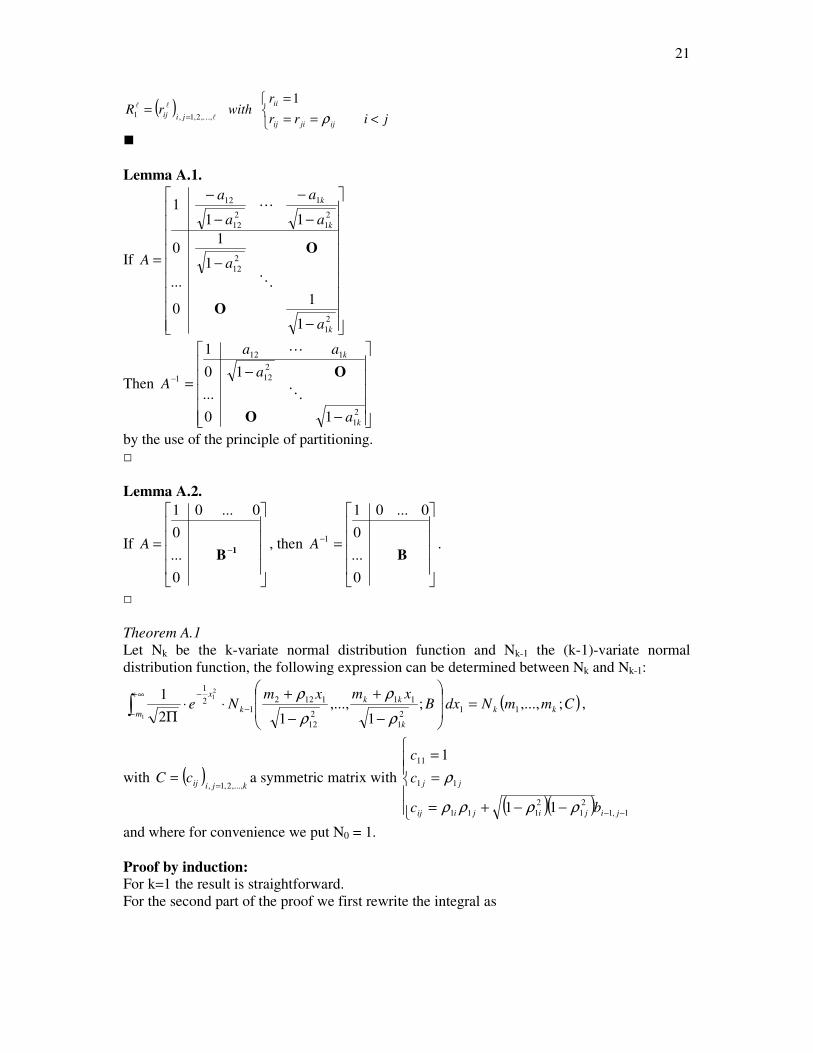
□ Theorem A.1
Let Nk be the k-variate normal distribution function and Nk-1 the (k-1)-variate normal distribution function, the following expression can be determined between Nk and Nk-1:
( )∫∞+
−−
−
=
−
+
−
+⋅⋅
Π1
21
;,...,;1
,...,12
111
2
1
11
2
12
11221
2
1
mkk
k
kk
k
x
CmmNdxBxmxm
Neρ
ρ
ρ
ρ,
with ( )kjiijcC
,...,2,1, == a symmetric matrix with
( )( )
−−+=
=
=
−− 1,1
2
1
2
111
11
11
11
1
jijijiij
jj
bc
c
c
ρρρρ
ρ
and where for convenience we put N0 = 1. Proof by induction:
For k=1 the result is straightforward. For the second part of the proof we first rewrite the integral as
22
∫∞+
−−
−
−
+
−
+⋅⋅
Π1
21
12
1
11
2
12
11221
2
1
;1
,...,12
1
m
k
kk
k
x
dxBxmxm
Neρ
ρ
ρ
ρ
( )
( )
∫ ∫ ∫∞+
−
∞+
−
+−
∞+
−
+−
−
⋅Π
=1
212
1122
22
11
1
1 1
21
,...,2
1
...det2
1...
mxm xm k
xxP
k
k
kk
k
dxdxdxeBρ
ρ
ρ
ρ ,
with
( ) [ ]
⋅
⋅=−
k
kk
x
x
x
xxxxxP...
0
...
0
0...01
...,...,2
1
211 1B
.
Making use of the substitution
kjforxxy jjjj ,...,3,21 11
2
1 =+−= ρρ
we can rewrite this expression as
( ) ( )
( )
k
yyxP
m m k
j
j
k
dydydxe
B
k
k
LK 21
,...,,2
1
2
2
1
21*
1
1det2
1 −∞+
−
∞+
−
=
⋅
−Π
∫ ∫∏ ρ
.
In this formula, we introduced the matrix:
( ) [ ]
⋅⋅
⋅⋅=−
k
t
kk
y
y
x
DDyyxyyxP...
0
...
0
0...01
...,...,,2
1
2121
*
1B
,
where
−
−
−
−
−
−
=
2
1
2
12
2
1
1
2
12
12
1
10
...
1
10
111
k
k
k
D
ρ
ρ
ρ
ρ
ρ
ρ
O
O
O
L
.
Since we want to express the k-variate integration by means of a k-variate normal CDF, we now have to determine the correlation matric C with:
tDDC ⋅
⋅=−
−
0
...
0
0...01
1
1B.
An application of lemma A.1 and A.2 leads to
−
−⋅
⋅
−
−=
2
1
2
12
112
2
11
2
1212
10
...
10
1
0
...
0
0...01
1
...
1
001
k
k
kk
C
ρ
ρ
ρρ
ρρ
ρρ
O
O
B
O
O
O
L
O
L
,
23
or
=
k
k
C
1
12
112
...
1
ρ
ρ
ρρ
F
L
,
with F obtained by partitioning as
[ ]
−
−
⋅⋅
−
−
+⋅
2
1
2
12
2
1
2
12
112
1
2
1
1
1
1
...
kk
k
k
B
ρ
ρ
ρ
ρ
ρρ
ρ
ρ
O
O
O
O
OOL .
Hence this results in:
( )kjiijcC
,...,2,1, == with
( )( )
−−+=
=
=
−− 1,1
2
1
2
111
11
11
11
1
jijijiij
jj
bc
c
c
ρρρρ
ρ
Now, since ( )kyyxP ,...,, 21
* can be written as
( ) [ ]
⋅⋅= −
k
kk
y
y
x
CyyxyyxP...
...,...,,2
1
1
2121
*
and ( ) BCk
j
j det1det2
2
1 ⋅−= ∏=
ρ ,
for the integral we find
( ) ( )
( )
k
yyxP
m m k
j
j
k
dydydxe
B
k
k
LK 21
,...,,2
1
2
2
1
21*
1
1det2
1 −∞+
−
∞+
−
=
⋅
−Π
∫ ∫∏ ρ
,
or
( )
( )
k
yyxP
m m kdydydxe
C
k
k
LK 21
,...,,2
121
*
1 det2
1 −∞+
−
∞+
−⋅
Π∫ ∫ ,
or
( ),;,...,1 CmmN kk
which completes the proof. �
24
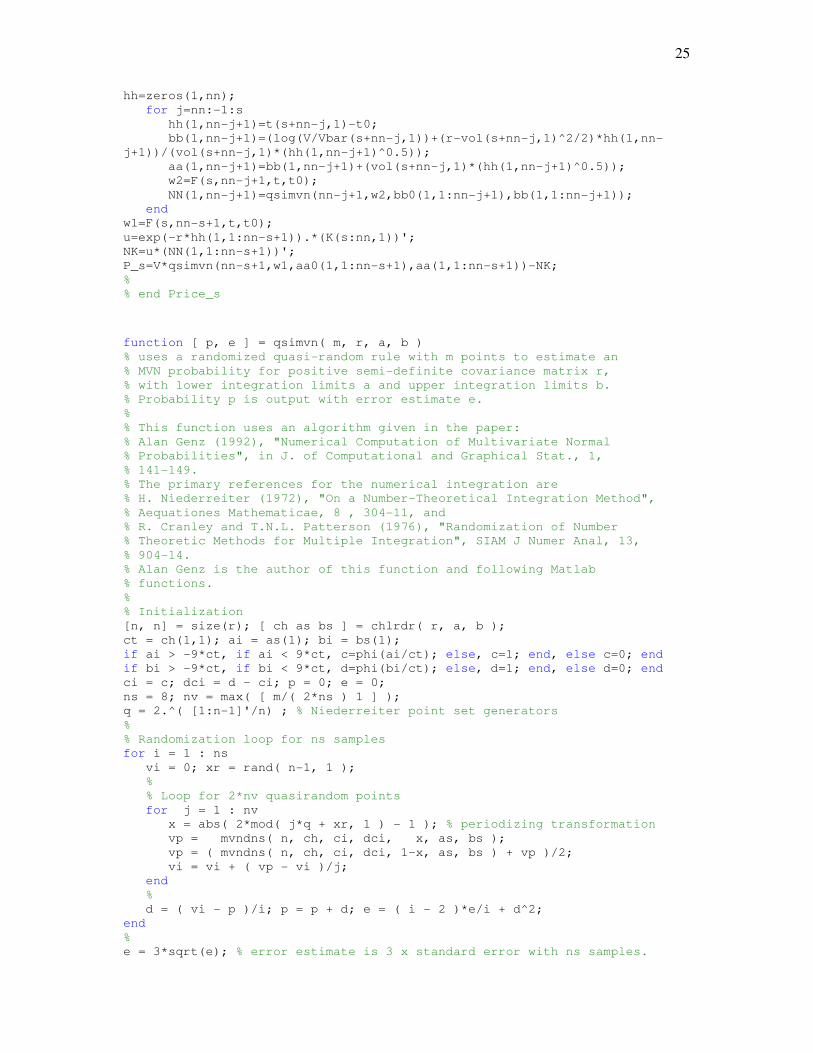
Appendix B. Matlab function for the calculation of the n-fold compound option with
phase-specific volatility
function P=Price(V,r,vol_i,t00,t_i,K_i,init); % the function computes the price of an n-fold compound option % the input is: % 1)V - current price of the underlying asset % 2)r - interest rate (input as a log form) % 3)vol_i - (n,1) volatilities vector of the underlying assets % 4)t00 - today date % 5)t_i - (n,1) vector of exercise dates % 6)K_i - (n,1) vector of strikes % 7)init - number that adjusts initial values in finding the zeros of % the nonlinear functions below. This number is subject to change.
% A rule of thumb is to put init to be equal to the number of digits in
% K(n,1). If it does not work and the function collapses init or qq
% below should be adjusted manually. format long t=t_i;K=K-i;vol=vol_i;
n=length(t); %computes the dimension of the problem qq=init; C=zeros(n,1);initial=K(n,1)*qq; Vbar=zeros(n,1); N=zeros(n,n);N1=zeros(n,n); a=zeros(n,n);a0=-inf.*ones(n,n); b=zeros(n,n);b0=-inf.*ones(n,n); h=zeros(n,n);h1=zeros(n,n); Vbar(n,1)=K(n,1); for s=n:-1:2 %loop for finding Vbar_s current=s-1; t0=t(current,1); options=optimset('Display','off'); Vbar(s-1,1)=fzero(@Price_ss,initial,options,s,Vbar,r,vol,t0,t,K);
%finding Vbar_s-1 %the initial values change through the loop initial=Vbar(s-1,1)*qq; [c1,h1,a1,b1,N1,w2,w1]=Price_s(V,s,Vbar,r,vol,t0,t,K); C(s,1)=c1;h(s,:)=h1;a(s,:)=a1;b(s,:)=b1;N(s,:)=N1; end k=1; %finding the price [c2,h2,a2,b2,N2,w4,w3]=Price_s(V,k,Vbar,r,vol,t00,t,K); C(k,1)=c2;h(k,:)=h2;a(k,:)=a2;b(k,:)=b2;N(k,:)=N2; P=C(k,1); %
% end Price
function ww=Price_ss(V,s,Vbar,r,vol,t0,t,K); ww=Price_s(V,s,Vbar,r,vol,t0,t,K)-K(s-1,1); % % end Price_ss
function [P_s,hh,aa,bb,NN,w2,w1]=Price_s(V,s,Vbar,r,vol,t0,t,K); % this function computes P_s, given s,V,Vbar,r,vol vector,t0, t vector
% and K vector rand('seed',0); nn=length(t); NN=zeros(1,nn); aa=zeros(1,nn);aa0=-inf.*ones(1,nn); bb=zeros(1,nn);bb0=-inf.*ones(1,nn);
25
hh=zeros(1,nn); for j=nn:-1:s hh(1,nn-j+1)=t(s+nn-j,1)-t0; bb(1,nn-j+1)=(log(V/Vbar(s+nn-j,1))+(r-vol(s+nn-j,1)^2/2)*hh(1,nn-
j+1))/(vol(s+nn-j,1)*(hh(1,nn-j+1)^0.5)); aa(1,nn-j+1)=bb(1,nn-j+1)+(vol(s+nn-j,1)*(hh(1,nn-j+1)^0.5)); w2=F(s,nn-j+1,t,t0); NN(1,nn-j+1)=qsimvn(nn-j+1,w2,bb0(1,1:nn-j+1),bb(1,1:nn-j+1)); end w1=F(s,nn-s+1,t,t0); u=exp(-r*hh(1,1:nn-s+1)).*(K(s:nn,1))'; NK=u*(NN(1,1:nn-s+1))'; P_s=V*qsimvn(nn-s+1,w1,aa0(1,1:nn-s+1),aa(1,1:nn-s+1))-NK; %
% end Price_s
function [ p, e ] = qsimvn( m, r, a, b ) % uses a randomized quasi-random rule with m points to estimate an % MVN probability for positive semi-definite covariance matrix r, % with lower integration limits a and upper integration limits b. % Probability p is output with error estimate e. % % This function uses an algorithm given in the paper: % Alan Genz (1992), "Numerical Computation of Multivariate Normal
% Probabilities", in J. of Computational and Graphical Stat., 1,
% 141-149.
% The primary references for the numerical integration are % H. Niederreiter (1972), "On a Number-Theoretical Integration Method", % Aequationes Mathematicae, 8 , 304-11, and % R. Cranley and T.N.L. Patterson (1976), "Randomization of Number
% Theoretic Methods for Multiple Integration", SIAM J Numer Anal, 13,
% 904-14. % Alan Genz is the author of this function and following Matlab
% functions. % % Initialization [n, n] = size(r); [ ch as bs ] = chlrdr( r, a, b ); ct = ch(1,1); ai = as(1); bi = bs(1); if ai > -9*ct, if ai < 9*ct, c=phi(ai/ct); else, c=1; end, else c=0; end if bi > -9*ct, if bi < 9*ct, d=phi(bi/ct); else, d=1; end, else d=0; end ci = c; dci = d - ci; p = 0; e = 0; ns = 8; nv = max( [ m/( 2*ns ) 1 ] ); q = 2.^( [1:n-1]'/n) ; % Niederreiter point set generators % % Randomization loop for ns samples for i = 1 : ns vi = 0; xr = rand( n-1, 1 ); % % Loop for 2*nv quasirandom points for j = 1 : nv x = abs( 2*mod( j*q + xr, 1 ) - 1 ); % periodizing transformation vp = mvndns( n, ch, ci, dci, x, as, bs ); vp = ( mvndns( n, ch, ci, dci, 1-x, as, bs ) + vp )/2; vi = vi + ( vp - vi )/j; end % d = ( vi - p )/i; p = p + d; e = ( i - 2 )*e/i + d^2; end % e = 3*sqrt(e); % error estimate is 3 x standard error with ns samples.
26
return % % end qsimvn
function [ c, ap, bp ] = chlrdr( R, a, b ) % Computes permuted lower Cholesky factor c for R which may be % singular, also permuting integration limit vectors a and b. ep = 1e-100; % singularity tolerance; [n,n] = size(R); c = R; ap = a; bp = b; y = zeros(n,1); sqtp = sqrt(2*pi); for k = 1 : n im = k; ckk = 0; dem = 1; s = 0; for i = k : n if c(i,i) > eps cii = sqrt( max( [c(i,i) 0] ) ); if i > 1, s = c(i,1:k-1)*y(1:k-1); end ai = ( a(i)-s )/cii; bi = ( b(i)-s )/cii; de = phi(bi) - phi(ai); if de <= dem, ckk = cii; dem = de; am = ai; bm = bi; im = i; end end end if im > k tv = ap(im); ap(im) = ap(k); ap(k) = tv; tv = bp(im); bp(im) = bp(k); bp(k) = tv; c(im,im) = c(k,k); t = c(im,1:k-1); c(im,1:k-1) = c(k,1:k-1); c(k,1:k-1) = t; t = c(im+1:n,im); c(im+1:n,im) = c(im+1:n,k); c(im+1:n,k) = t; t = c(k+1:im-1,k); c(k+1:im-1,k) = c(im,k+1:im-1)'; c(im,k+1:im-1) =
t'; end if ckk > ep*k^2 c(k,k) = ckk; c(k,k+1:n) = 0; for i = k+1 : n c(i,k) = c(i,k)/ckk; c(i,k+1:i) = c(i,k+1:i) - c(i,k)*c(k+1:i,k)'; end y(k) = ( exp( -am^2/2 ) - exp( -bm^2/2 ) )/( sqtp*dem ); else c(k:n,k) = 0; y(k) = 0; end end return %
% end chlrdr
function sigma=F(s,l,t,current);
% computes the covariance matrix given s, l, the time vector t, and the
% current moment F=zeros(l,l); for i=1:1:l for j=(i+1):1:l F(i,j)=((t(i+s-1,1)-current)/(t(j+s-1,1)-current))^0.5; end end sigma=F+F'+eye(l); %
% end F
function p = mvndns( n, ch, ci, dci, x, a, b ) % Transformed integrand for computation of MVN probabilities. y = zeros(n-1,1); s = 0; c = ci; dc = dci; p = dc; for i = 2 : n
27
y(i-1) = phinv( c + x(i-1)*dc ); s = ch(i,1:i-1)*y(1:i-1); ct = ch(i,i); ai = a(i) - s; bi = b(i) - s; if ai > -9*ct, if ai < 9*ct, c=phi(ai/ct); else, c=1; end, else c=0; end if bi > -9*ct, if bi < 9*ct, d=phi(bi/ct); else, d=1; end, else d=0; end dc = d - c; p = p*dc; end return % % end mvndns
function p = phi(z) % Standard statistical normal distribution p = ( 1 + erf( z/sqrt(2) ) )/2; return % % end phi
function z = phinv(w) % Standard statistical inverse normal distribution z = sqrt(2)*erfinv( 2*w - 1 ); return % % end phinv
28
Appendix C. A methodology to estimate the phase-specific volatilities
In this appendix, we show how we derived the estimations for the phase-specific volatilities used in the case study, as in section 4. The methodology uses a set of structured interview sessions with the project team that was responsible for conceptualizing and valuing the concrete project, which in our case was a team of five people. When jointly determining the phase-specific volatilities, the team felt very confident in agreeing on a volatility range for each of the phases; for that they relied on their experience and knowledge of past projects, and/or similar projects in the sector. More specifically, the ranges agreed upon were 50-60% for the first phase, 40-50% for the second phase, 35-45% for the third phase, and 30-40% for the last phase respectively. However, it was very difficult to narrow this range down to a specific volatility estimate, as needed within the lognormal distribution framework in which we base our model; furthermore we wanted to have a tool to make a consistency check of their estimates. In order to do that, we applied a calibrating exercise also used in Arnold and Shockley (2001) and Shockley (2007).
As Shockley (2007, p.298) rightly states, many managers are much more confident thinking in terms of presenting a set of different scenarios regarding the operating cash flows of the project (the value of the project), and then attaching to those scenarios their subjective probabilities of how likely it is that the project value will indeed be at least this value, or in case of a bad scenario, will not reach this minimal value. As shown by Shockley (2001, 2007) this set up can than be translated into theoretical probabilities under a (log)normal distribution. If we apply this procedure for a range of possible volatilities, we derive a particular set of theoretical probabilities, one for each value of the volatility used. The best volatility estimate is then that one that provides an optimal match between the theoretical probabilities and the subjective probabilities of managers, attached to the different scenarios. We perform this calibrating exercise in table C.1. We start by deriving the volatility of the first phase, as in the upper panel of table C.1Similar to Shockley (2007, p.292), together with the project team, we constructed a set of four scenarios, labeled as the best case, good case, launch, and worst case scenario. The launch scenario refers to the case where the value of the project (V) would at least allow the company to cover all the investment and development costs of the project (i.e. all Iit of table 1 in section 4 of the paper), expressed at the moment of the launch (this corresponds to a conventional NPV analysis, where NPV is zero). In our case this is equal to 83.11 million EUR. The other three scenarios use the expected value of the project, expressed at the moment of the launch of the project as a base; in our case, this value is equal to 103.94 million EUR (see again table 1 of section 4). The good case scenario refers to a scenario where the project value is 1.5 times this expected value of the project (1.5 times 103.94 equals 155.91 million EUR), while the best case scenario refers to project value exceeding twice the expected value of the project at launch (207.88 million EUR). Finally, the worst case refers to a scenario where the value of the project is lower than half of the expected value of the project (51.97 million EUR). The project values (Z) are presented in column 2 of table C.1. Project team members felt comfortable with the choice of the scenarios, and felt confident in attaching subjective probabilities to these 4 scenarios; most of the time, the five of them could easily agree on a particular probability estimate (often formulated as 1 out of six, or seven, or twenty projects). In cases where they could only agree on a narrow range but not on a specific number, everyone formulated its subjective probability and we took simple averages. The
29
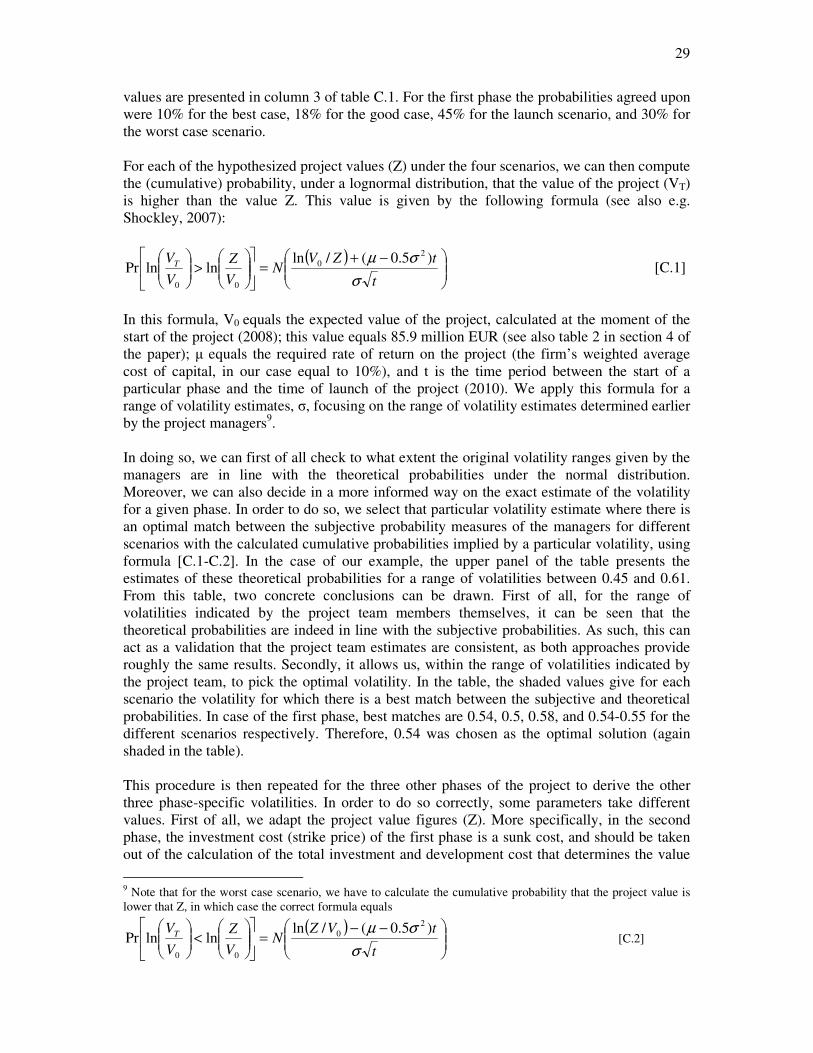
values are presented in column 3 of table C.1. For the first phase the probabilities agreed upon were 10% for the best case, 18% for the good case, 45% for the launch scenario, and 30% for the worst case scenario. For each of the hypothesized project values (Z) under the four scenarios, we can then compute the (cumulative) probability, under a lognormal distribution, that the value of the project (VT) is higher than the value Z. This value is given by the following formula (see also e.g. Shockley, 2007):
( )
−+=
>
t
tZVN
V
Z
V
VT
σ
σµ )5.0(/lnlnlnPr
2
0
00
[C.1]
In this formula, V0 equals the expected value of the project, calculated at the moment of the start of the project (2008); this value equals 85.9 million EUR (see also table 2 in section 4 of the paper); µ equals the required rate of return on the project (the firm’s weighted average cost of capital, in our case equal to 10%), and t is the time period between the start of a particular phase and the time of launch of the project (2010). We apply this formula for a range of volatility estimates, σ, focusing on the range of volatility estimates determined earlier by the project managers9. In doing so, we can first of all check to what extent the original volatility ranges given by the managers are in line with the theoretical probabilities under the normal distribution. Moreover, we can also decide in a more informed way on the exact estimate of the volatility for a given phase. In order to do so, we select that particular volatility estimate where there is an optimal match between the subjective probability measures of the managers for different scenarios with the calculated cumulative probabilities implied by a particular volatility, using formula [C.1-C.2]. In the case of our example, the upper panel of the table presents the estimates of these theoretical probabilities for a range of volatilities between 0.45 and 0.61. From this table, two concrete conclusions can be drawn. First of all, for the range of volatilities indicated by the project team members themselves, it can be seen that the theoretical probabilities are indeed in line with the subjective probabilities. As such, this can act as a validation that the project team estimates are consistent, as both approaches provide roughly the same results. Secondly, it allows us, within the range of volatilities indicated by the project team, to pick the optimal volatility. In the table, the shaded values give for each scenario the volatility for which there is a best match between the subjective and theoretical probabilities. In case of the first phase, best matches are 0.54, 0.5, 0.58, and 0.54-0.55 for the different scenarios respectively. Therefore, 0.54 was chosen as the optimal solution (again shaded in the table). This procedure is then repeated for the three other phases of the project to derive the other three phase-specific volatilities. In order to do so correctly, some parameters take different values. First of all, we adapt the project value figures (Z). More specifically, in the second phase, the investment cost (strike price) of the first phase is a sunk cost, and should be taken out of the calculation of the total investment and development cost that determines the value
9 Note that for the worst case scenario, we have to calculate the cumulative probability that the project value is lower that Z, in which case the correct formula equals
( )
−−=
<
t
tVZN
V
Z
V
VT
σ
σµ )5.0(/lnlnlnPr
2
0
00
[C.2]
30
of the launch scenario. Similarly, in order to keep scenarios comparable over phases, this sunk investment cost of the first phase needs to be deducted from the project values in other scenarios. The same adjustment is done for the third and fourth phase, deducting all sunk investment costs from previous phases. Moreover, obviously, also the subjective probabilities change: as the project team members now know that the project is in a further phase, this also changes their subjective view on the likelihood of each of the scenarios. To give one example, as we enter further phases, the likelihood of the launch scenario increases, reaching close to 1 in the fourth phase; in contrast, the likelihood of the worst case scenario drastically reduces in consecutive phases. The calculations presented in the other panels of table C.1 show that the optimal matches were derived at a volatility of 0.42 for the second phase, a volatility of 0.37 for the third phase, and a volatility of 0.35 for the fourth phase.
Table C.1: Determination of optimal phase-specific volatility estimates matching subjective and theoretical probabilities
Panel 1: Theoretical cumulative probabilities under normal distribution for different volatility estimates for first phase (t=2)
Legend: application of formula [C.1-C.2], with V0 =85.9and µ=10%;V and Z in million EUR..t equals the period between the beginning of the phase and the launch (in