Energy Research and Development Division FINAL PROJECT REPORT MUNICIPAL DIGESTER REPOWERING DEMONSTRATION (MDRD) PROJECT FEBRUARY 2017 CEC-500-2017-013 Prepared for: California Energy Commission Prepared by: Anaergia Services, LLC
Transcript
E n e r g y R e s e a r c h a n d D e v e l o p m e n t D i v i s i o n F I N A L P R O J E C T R E P O R T
MUNICIPAL DIGESTER REPOWERING DEMONSTRATION (MDRD) PROJECT
FEBRUARY 2017 CE C-500-2017-013
Prepared for: California Energy Commission Prepared by: Anaergia Services, LLC
PREPARED BY: Primary Author(s): Juan Josse Sasha Scattergood Yaniv Scherson PhD Anaergia Services 5780 Fleet St, Suite 310 Carlsbad, CA 92025 Phone: 760-436-8870 | Fax: 760-448-6847 http://www.anaergia.com Contract Number: PIR-11-026 Prepared for: California Energy Commission Rajesh Kapoor Contract Manager Virginia Lew Office Manager Energy Energy Efficiency Research Office Laurie ten Hope Deputy Director ENERGY RESEARCH AND DEVELOPMENT DIVISION Robert P. Oglesby Executive Director
DISCLAIMER This report was prepared as the result of work sponsored by the California Energy Commission. It does not necessarily represent the views of the Energy Commission, its employees or the State of California. The Energy Commission, the State of California, its employees, contractors and subcontractors make no warranty, express or implied, and assume no legal liability for the information in this report; nor does any party represent that the uses of this information will not infringe upon privately owned rights. This report has not been approved or disapproved by the California Energy Commission nor has the California Energy Commission passed upon the accuracy or adequacy of the information in this report.
PREFACE The California Energy Commission Energy Research and Development Division supports public interest energy research and development that will help improve the quality of life in California by bringing environmentally safe, affordable, and reliable energy services and products to the marketplace.
The Energy Research and Development Division conducts public interest research, development, and demonstration (RD&D) projects to benefit California.
The Energy Research and Development Division strives to conduct the most promising public interest energy research by partnering with RD&D entities, including individuals, businesses, utilities, and public or private research institutions.
Energy Research and Development Division funding efforts are focused on the following RD&D program areas:
• Buildings End-Use Energy Efficiency
• Energy Innovations Small Grants
• Energy-Related Environmental Research
• Energy Systems Integration
• Environmentally Preferred Advanced Generation
• Industrial/Agricultural/Water End-Use Energy Efficiency
• Renewable Energy Technologies
• Transportation
Municipal Digester Repowering Demonstration (MDRD) Project is the final report for the MUNICIPAL DIGESTER REPOWERING DEMONSTRATION (MDRD) project (contract number PIR-11-026) conducted by UTS Bioenergy LLC. The information from this project contributes to Energy Research and Development Division’s Public Interest Energy Research, Development and Demonstration Program.
For more information about the Energy Research and Development Division, please visit the Energy Commission’s website at www.energy.ca.gov/research/ or contact the Energy Commission at 916-327-1551.
High solids anaerobic digestion is an effective strategy to increase the capacity and biogas generation of new and existing sewage sludge digesters. Anaergia Services LLC (Anaergia) partnered with Victor Valley Wastewater Treatment Authority (VVWRA) to demonstrate at commercial-scale the OmnivoreTM Digester. This digestion retrofit system uses a recuperative thickening and submersible high solids mixers. The system increases the solids retention time and the solids content in digesters which improves digester performance and allows operation using more organic wastes. The biogas produced generates electrical power that can meet or exceeds a wastewater treatment plant’s energy demand.
The successful demonstration of the OmnivoreTM Digester tripled the capacity of an existing conventional digester enabling production of the same quantity of biogas a conventional digester three times its size.
Please use the following citation for this report:
Juan Josse, Sasha Scattergood; Yaniv Scherson. (Anaergia Services, LLC). 2015. Municipal Digester Repowering Demonstration Project. California Energy Commission. Publication number: CEC-500-2017-013.
TABLE OF CONTENTS
ABSTRACT ................................................................................................................................................. i
TABLE OF CONTENTS .......................................................................................................................... ii
LIST OF FIGURES .................................................................................................................................. iii
LIST OF TABLES .................................................................................................................................... iii
APPENDIX A: Example Marketing Material ....................................................................................... 1
LIST OF FIGURES
Figure 1: Overview of the OmnivoreTM Site .......................................................................................... 4 Figure 2: OmnivoreTM Digester. ............................................................................................................... 5 Figure 3: Net Biogas and Methane Production of Commercial Organic Food Processing Waste .. 9 Figure 4: Net Biogas and Methane Production of Commercial FOG ................................................. 9 Figure 5: Retrofitting One of the Anerobic Digesters ......................................................................... 10 Figure 6: Service Boxes and Platforms on Sides of Digester ............................................................. 11 Figure 7: New Recirculation Pump and Existing Spiral Heat Exchanger ........................................ 11 Figure 8: Hydraulic Power Units (HPUs) and Mixer on Support Mast ........................................... 12 Figure 9: Recuperative Thickener and End Products of Filtrate and Thickened Sludge ............... 13 Figure 10: High Strength Waste Receiving and Storage Station ....................................................... 14 Figure 11: Co-digestion Performance .................................................................................................... 15 Figure 12: OmnivoreTM biogas yield and HRT. .................................................................................... 16 Figure 13: OmnivoreTM Biogas Yield and OLR Compared to the Control Digester 4 (top) and Digester 5 (bottom). ................................................................................................................................. 17 Figure 14: OmnivoreTM Biogas Yield and HRT Compared to the Control Digester 4 (top) and 5 (bottom) ..................................................................................................................................................... 18 Figure 15: OmnivoreTM TS and VS Compared to Control Digesters 4 and 5 ................................... 19 Figure 16: OmnivoreTM Alkalinity and Volatile Fatty Acids to Alkalinity Ratio in Comparison to Digesters 4 & 5 ......................................................................................................................................... 20 Figure 17: OmnivoreTM, Digester 4 & 5 pH ........................................................................................... 21 Figure 18: Recuperative Thickener ........................................................................................................ 22
LIST OF TABLES
Table 1: Design Operational Parameters of the OmnivoreTM Digester and Conventional and Control Digesters ....................................................................................................................................... 6 Table 2: Digester and Thickener Feeding Schedule .............................................................................. 7 Table 3: OmnivoreTM Sampling Schedule ................................................................................................ 8 Table 4: OmnivoreTM Calculated Parameters ......................................................................................... 8 Table 5: Recuperative Thickener Efficiency ......................................................................................... 23
1
EXECUTIVE SUMMARY
Introduction
Municipal wastewater treatment is a necessity to protect clean water supply and promote environmental health. Measures have been taken to ensure wastes (effluents) from municipal wastewater treatment, including liquid and bio-solids discharges are of high quality and environmentally beneficial. Missing from this however, is the focus on the energy required to treat municipal wastewater with the processes, design and infrastructure currently used in U.S. wastewater treatment plants. Municipal wastewater treatment accounts for 0.5-0.6 percent of the national electricity demand and is typically the largest operating cost after staff.
Municipal wastewater treatment infrastructure has an excellent opportunity to re-define itself and evolve to being an energy producer versus an energy user. The solids, or sludge in municipal wastewater are rich in energy potential that can be harnessed when treated with the right anaerobic digestion technology. There are more than 2,200 sites producing biogas in all 50 states: 259 anaerobic digesters on farms, 1,269 water resource recovery facilities using an anaerobic digester (about 860 currently use the biogas they produce), 39 stand-alone systems that digest food waste, and 645 landfill gas projects. For comparison, Europe has more than 10,000 operating digesters and some communities are essentially fossil fuel free because of them.
In California, 117 municipal wastewater treatment plants use anaerobic digestion to handle the solids. In anaerobic digesters, micro-biological organisms (biomass) live and feed on the solids. The biomass consume the volatile solids portion, and as a by-product of this digestion process, biogas is produced. Biogas is rich in methane, and when cleaned, can be used as fuel for electricity generation or used as pipeline quality renewable natural gas.
Project Purpose
Anaerobic digestion in wastewater treatment is the stabilization of primary and waste activated solids. Biochemical reactions convert the sludge solids into useable digestate and biogas. The biogas can be used to heat boilers, fuel gas-driven engines, and generate combined heat and power. Unused biogas is typically sent to a waste gas burner for flaring.
This project demonstrated OmnivoreTM retrofits as a cost effective option for municipal wastewater treatment plants. The project uses existing anaerobic digestion infrastructure to increase the digester capacity without investing in costly additional infrastructure or more digesters. This technology allows plant owners to accommodate plant flow expansions or use their existing digester volume more efficiently to operate at higher solids and create more capacity. This technology makes it feasible for plants using co-digesting technology to generate enough biogas to convert into electricity and potentially making the wastewater treatment plant energy self-sufficient.
2
Project Process
The Municipal Digester Repowering Demonstration Project at the Victor Valley Wastewater Reclamation Authority’s (VVWRA) wastewater treatment facility, Victorville, CA addresses limitations of conventional anaerobic digestion by installing a high solids anaerobic digester retrofit package. This technology increases the solids content in the digester two to three times by removing water and concentrating the solids through recuperative thickening allowing adequate mixing and heating. The solids in the tank are a combination of anaerobic bacteria and partially digested solids. Recuperative thickening has the double process advantage of retaining more active bacteria in the tank and also retain the solids fed (food for the bacteria) also for a longer time. Basicly this increases the inventory of bacteria and gives them more time to breakdown and degrade the volatile solids fed with the sludge. As a result of this process, the breakdown of volatile solids is larger and a digester can handle more waste (feedstock) in the same tank volume.
Municipal water water treatments plants can typically generate no more than 50 percent of the power they consume by digesting the primary and waste activated sewage sludge produced. To make these facilities energy neutral or energy positive, digestion of external industrial feedstocks, food waste, and other municipal feedstocks is necessary. Yet, these types of feedstocks are often contaminated or inaccessible because they are embedded in mixed waste streams. Contaminated feedstocks can include food waste including source separated organics that often contain contaminants such as plastic, paper, metal, and glass. Inaccessible feedstocks can include organic material such as food scraps, yard trimmings, juices, and diapers that are mixed in municipal solid waste or wet commercial waste .
Extraction and preprocessing to generate a clean and highly digestible feedstock is critical and can be achieved with existing commercial technology that Anaergia supplies. Many municipal waste water treatment plants do not have the digestion capacity to import large quantities of external waste to become energy neutral or energy positive Water Resource Recovery Facilities . The OmnivoreTM retrofit package enables wastewater treatment plants to become Water Resource Recovery Facilities by increasing digestion capacity by up to three-fold with minimal operational disruption and cost.
Project Results
The results show that a conventional digester retrofitted to an OmnivoreTM digester allows the digester to operate with increased loading capacity and biogas generation two-three times higher than conventional sewage sludge digesters with long-term stable operation. Omnivore has demonstrated that increasing the solids content, and gas production capacity of a retrofitted digester is cost effective, practical and advantageous. Co-digestion with external commercial organic waste showed a significant increase in gas production and operation, more than triple that of conventional digesters.
New and emerging feedstocks for anaerobic digestion such as source separated organics, municipal solid waste, wet commercial waste are in enormous supply and their capture and digestion offers multiple environmental benefits including diverting material from landfills and
3
mitigating greenhouse gas emissions by eliminating fugitive methane release at landfills, shortening waste transport distances, and generating a carbon negative fuel - biogas.
Project Benefits
Installing OmnivoreTM retrofits in existing digesters can avoid building new digesters when water resource recovery facilities are required to increase digestion capacity because of growth, or when municipalities are interested in increasing energy generation to bring their wastewater treatment operations closer to energy self sufficiency. The thousands of pancake-type digesters in U.S. waste water treatment facilities are a vastly underused infrastructure. OmnivoreTM leverages existing digestion assets to increase organic waste capacities for power generation while eliminating having to build new anaerobic digesters.
• Anaergia used the biogas from VVWRA to produce electricity from two 800 kW internal combustion engines (owned by Anaergia). The gas supplied from the Omnivore system and the other two VVWRA digesters was used to produce electricity for on-site plant operations.
• VVWRA uses about 1.1 MW. This retrofit energy system generated about 1.3 MW. Any excess power (energy) could be sold to the local utility.
• VVWRA entered into a 20 year power purchase agreement with Anaergia. VVWRA will pay $734,000 annually at a fixed price for 20 years for the cost of the power or about $15 million. Estimated savings in utility bills over 20 years is $9 million.
4
CHAPTER 1: Methodology 1.1 Conventional Anaerobic Digesters at VVWRA VVWRA operates two 4,542 m3 (1.2 million gal) digesters, referred to as Digester 4 and Digester 5. They are fed a combination of PS and TWAS, at a ratio of approximately 60% PS and 40% TWAS. Digesters 4 and 5 currently operate at a TS content of approximately 1.8% and an organic loading rate (OLR) of 1.28 kg/m3/day (0.08 lb/ft3/day). Average gas production is 0.86 m3/kg (14 ft3/lb) of VS destroyed, resulting in a biogas productivity of 518 L/kg VS (8.3 ft3/lb VS) fed. Typical operating data from these digesters is used as a control to evaluate the performance of the OmnivoreTM Digester.
1.2 OmnivoreTM Digester at VVWRA The existing infrastructure and equipment used for the OmnivoreTM retrofit include a 1,136 m3 (300,000 gal) floating-cover anaerobic digester, spiral heat exchanger, motor control center (MCC), sludge piping, gas piping, and gas pressure relief valves (Figure 1). New equipment includes a double membrane gas holder cover replacing the floating cover, a sludge recirculation pump for digester heating, two Anaergia hydraulic power driven submersible mechanical mixers with service boxes and external hydraulic power units, a high strength waste receiving station, an Anaergia recuperative sludge thickener, a programmable logic controller (PLC) and control panel, and an MCC.
Figure 1: Overview of the OmnivoreTM Site
OmnivoreTM Demonstration Project site overview (top) with recuperative thickener, external waste reception, and OmnivoreTM retrofitted digester (bottom). Photo Credit: Anaergia Services.
5
Like Digesters 4 and 5, the OmnivoreTM digester (Figure 2) was fed a combination of PS and TWAS. At start-up, the OmnivoreTM solids content was 1.8% TS and gradually increased using Anaergia’s recuperative thickener SST225. This corresponded with a gradual increase in OLR to 4.0 kg/m3 d (0.25 lb/ft3d ) w
increased to 4.5 kg/m3 d (0.3 lb/ft3d ) by am end ing external organic food waste.
Figure 2: OmnivoreTM Digester.
Conventional anaerobic digester retrofitted with a recuperative thickener to achieve high solids digestion (front). Conventional sludge digester in the back. Photo Credit: Anaergia Services.
To quantify performance, the biogas yield, total solids (TS), volatile solids (VS), SRT, HRT, and organic loading rate (OLR) were monitored. Operation of the high solids digester commenced in January 2013 with a four month start-up period followed by seven months of stable operation. Operation is ongoing with continued stable operation and improved performance. Design operational parameters for the two digesters are summarized in Table 1.
6
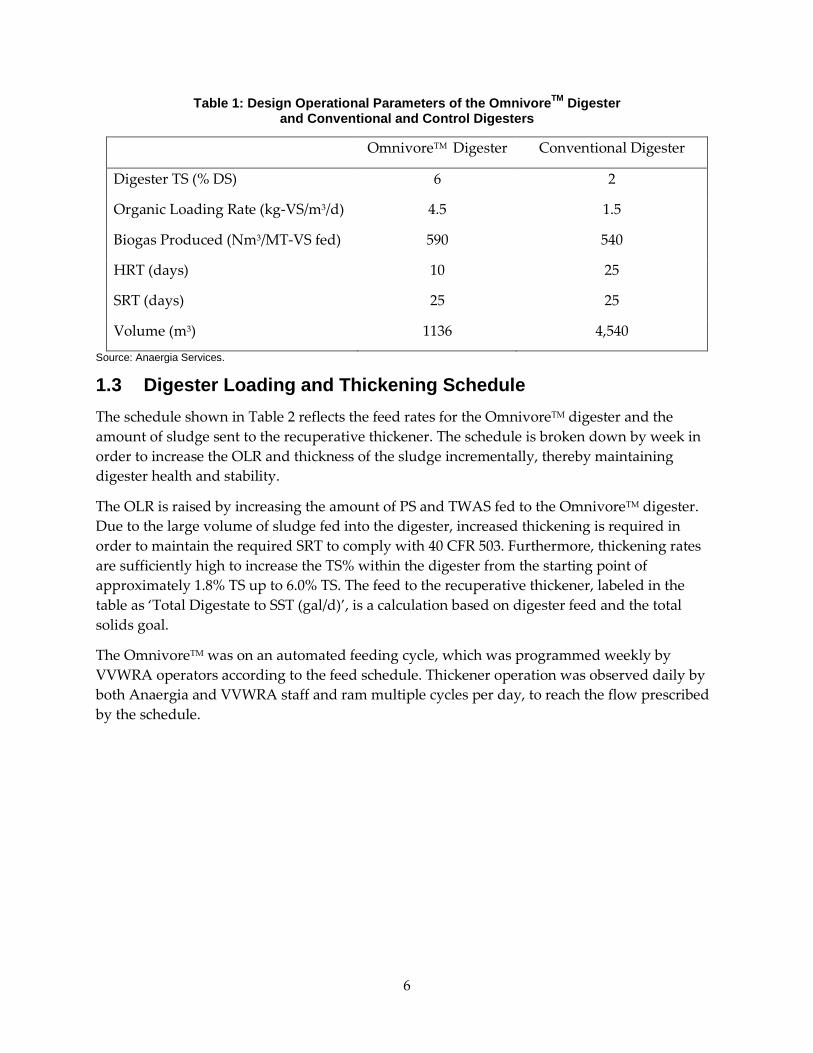
Table 1: Design Operational Parameters of the OmnivoreTM Digester and Conventional and Control Digesters
OmnivoreTM Digester Conventional Digester
Digester TS (% DS) 6 2
Organic Loading Rate (kg-VS/m3/d) 4.5 1.5
Biogas Produced (Nm3/MT-VS fed) 590 540
HRT (days) 10 25
SRT (days) 25 25
Volume (m3) 1136 4,540
Source: Anaergia Services.
1.3 Digester Loading and Thickening Schedule The schedule shown in Table 2 reflects the feed rates for the OmnivoreTM digester and the amount of sludge sent to the recuperative thickener. The schedule is broken down by week in order to increase the OLR and thickness of the sludge incrementally, thereby maintaining digester health and stability.
The OLR is raised by increasing the amount of PS and TWAS fed to the OmnivoreTM digester. Due to the large volume of sludge fed into the digester, increased thickening is required in order to maintain the required SRT to comply with 40 CFR 503. Furthermore, thickening rates are sufficiently high to increase the TS% within the digester from the starting point of approximately 1.8% TS up to 6.0% TS. The feed to the recuperative thickener, labeled in the table as ‘Total Digestate to SST (gal/d)’, is a calculation based on digester feed and the total solids goal.
The OmnivoreTM was on an automated feeding cycle, which was programmed weekly by VVWRA operators according to the feed schedule. Thickener operation was observed daily by both Anaergia and VVWRA staff and ram multiple cycles per day, to reach the flow prescribed by the schedule.
7
Table 2: Digester and Thickener Feeding Schedule
Source: Anaergia Services.
1.4 Sampling and Data Analysis To monitor digester health parameters and thickening efficiency, sampling was performed two to three times per week. Operators at VVWRA collect samples of the digestate from the OmnivoreTM digester, cake and filtrate from the thickener, and perform biogas analysis. Table 3 shows the frequency with which samples were collected, and the analysis performed on each.
All samples were analyzed at the VVWRA laboratory, with the exception of total Kjeldahl nitrogen (TKN) and ammonia which were sent out via courier to be completed by Babcock and Sons Laboratories in Riverside, California. ATP testing was done directly at the site by Anaergia staff to establish actual viable biomass content in the digestate. Analytical data was recorded and used to calculate critical operational indicators. Table 4 shows a representative sample of the parameters that were calculated and closely monitored.
1.5 External Waste Co-Digestion Evaluation External high strength, and highly digestible, commercial food processing waste was co-digested in the OmnivoreTM digester. Characterization revealed the following parameters: TS = 30-50%, VS = 95-98%, and biomethane potential (BMP) = 800-900 Nm3-biogas per ton of VS fed (Figures 3).
For comparison, the BMP of commercial FOG is shown in Figure 4. Note, FOG is an attractive feedstock for co-digestion because of its high BMP and relatively low TS content. A high BMP generates a large quantity of biogas and a low TS content enables co-digestion with conventional digestion and mixing technologies when FOG is fed at relatively low fraction to sludge (~10% of total VS fed).
However, the demand for FOG is large and its supply is limited. FOG is the most common feedstock for co-digestion in municipal wastewater treatment plants, and its supply is limited to select commercial generators with dedicated collection. The high demand and relative low supply of FOG requires that wastewater treatment utilities consider other external feedstocks with high economic and energy value.
9
With high solids mixing, digestion of feedstocks with high solids contents is possible. This broadens the types of feedstocks that can be received and increases the organic loading that is possible. Feeding high solids feedstocks is more efficient because the organic loading of the digester is greater with little, or in some cases no, recuperative thickening.
Figure 3: Net Biogas and Methane Production of Commercial Organic Food Processing Waste
Source: Anaergia Services.
Figure 4: Net Biogas and Methane Production of Commercial FOG
Source: Anaergia Services.
1.6 Operations Operation of the OmnivoreTM system was performed jointly by Anaergia and VVWRA staff. Anaergia closely monitored the process data from both the Carlsbad, California and Burlington, Ontario, Canada offices. Process and operational changes were implemented as necessary.
0200400600800
1000120014001600
0 2 4 6 8 10 12 14 16 18 20
Net
bio
gas p
rodu
ctio
n
(ml s
tp/g
VS
adde
d)
Time (d) Cellulose Ref Omega Alpha
0
200
400
600
800
1000
1200
0 2 4 6 8 10 12 14 16 18 20
Net
met
hane
pro
duct
ion
(ml C
H4/g
VS
adde
d)
Time (d) Cellulose Ref Omega Alpha
10
CHAPTER 2: Design Approach 2.1 Digester Retrofit One of three existing 12.2 m (40 ft) diameter concrete anaerobic digesters was retrofitted for OmnivoreTM. The digester concrete floating cover was removed, and the existing pump mixing system removed. The cover was replaced with a 144 m3 (5,085 ft3) dual-membrane gas holder supplied by Anaergia (Figure 5).
The external membrane is continuously pressurized by a low pressure air blower and the inner membrane of the new cover inflates and deflates with differential pressure created by production and consumption of biogas and allows for higher storage volume than the original floating cover. The existing Varec pressure relief valves were reinstalled and adjusted for the pressure rating of the membrane cover.
Figure 5: Retrofitting One of the Anerobic Digesters
Removing the floating dome cover (left) and installing the dual membrane gas holder (right).
Photo Credit: Anaergia Services.
Platforms were installed on each side of the digester to place Anaergia mixer service boxes, which allow access to the submersible hydraulic mechanical mixers without the need to empty the digester and without biogas escaping the digester heat space and gas holder cover (Figure 6). The Anaergia service boxes allow mixer repositioning without opening the digester and retrieval without biogas loss.
These boxes enable in-situ maintenance of the hydraulic mixers. The mixer is raised via hand winch and serviced without interrupting biogas production or requiring that the digester be emptied. The service boxes are an Anaergia proprietary product.
11
Figure 6: Service Boxes and Platforms on Sides of Digester
Photo Credit: Anaergia Services.
A new Netzsch progressing cavity (PC) recirculation pump was installed to transfer sludge between the digester and an existing spiral heat exchanger. The heat exchanger helps maintain mesophilic temperatures within the digester, which is especially important during the region’s cold winter season. Figure 7 shows the recirculation pump and heat exchanger.
Figure 7: New Recirculation Pump and Existing Spiral Heat Exchanger
Photo Credit: Anaergia Services.
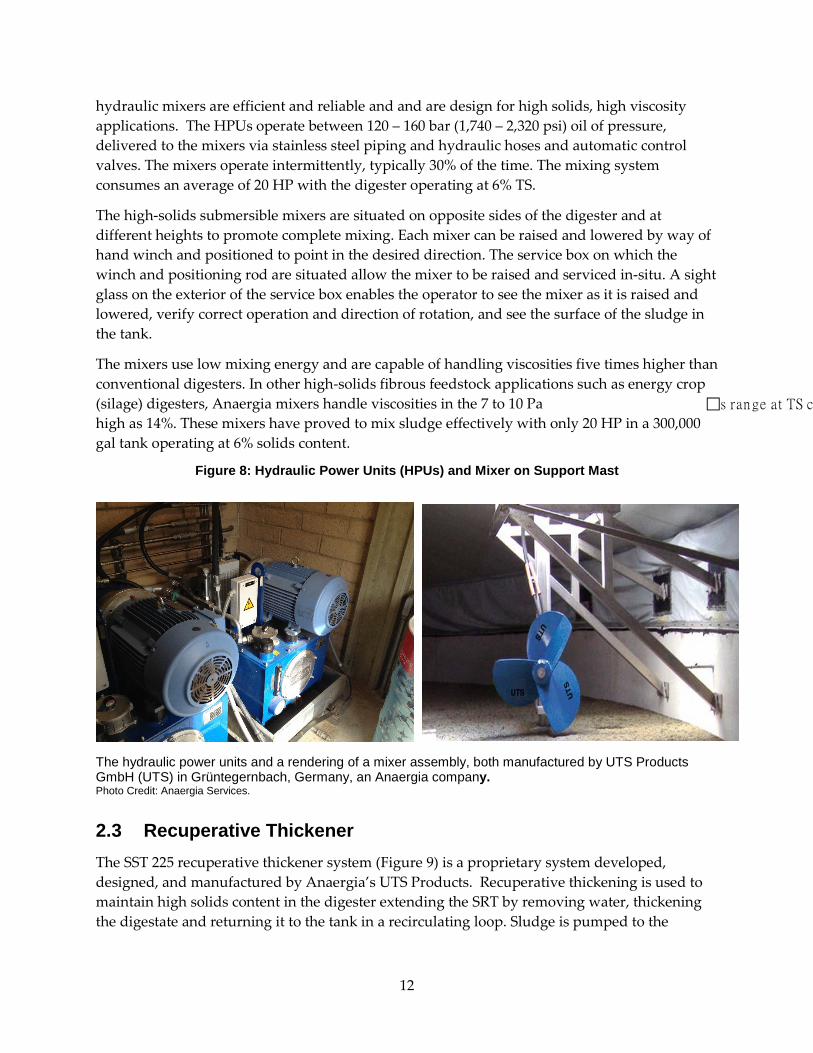
2.2 Hydraulic Power Units and Mixers Two Anaergia hydraulic power units (HPUs) were installed external to the digester to drive two Anaergia low-speed, high-torque 30 HP hydraulic mixers (Figure 8). Anaergia non-ragging
12
hydraulic mixers are efficient and reliable and and are design for high solids, high viscosity applications. The HPUs operate between 120 – 160 bar (1,740 – 2,320 psi) oil of pressure, delivered to the mixers via stainless steel piping and hydraulic hoses and automatic control valves. The mixers operate intermittently, typically 30% of the time. The mixing system consumes an average of 20 HP with the digester operating at 6% TS.
The high-solids submersible mixers are situated on opposite sides of the digester and at different heights to promote complete mixing. Each mixer can be raised and lowered by way of hand winch and positioned to point in the desired direction. The service box on which the winch and positioning rod are situated allow the mixer to be raised and serviced in-situ. A sight glass on the exterior of the service box enables the operator to see the mixer as it is raised and lowered, verify correct operation and direction of rotation, and see the surface of the sludge in the tank.
The mixers use low mixing energy and are capable of handling viscosities five times higher than conventional digesters. In other high-solids fibrous feedstock applications such as energy crop (silage) digesters, Anaergia mixers handle viscosities in the 7 to 10 Pa s range at TS co
high as 14%. These mixers have proved to mix sludge effectively with only 20 HP in a 300,000 gal tank operating at 6% solids content.
Figure 8: Hydraulic Power Units (HPUs) and Mixer on Support Mast
The hydraulic power units and a rendering of a mixer assembly, both manufactured by UTS Products GmbH (UTS) in Grüntegernbach, Germany, an Anaergia company. Photo Credit: Anaergia Services.
2.3 Recuperative Thickener The SST 225 recuperative thickener system (Figure 9) is a proprietary system developed, designed, and manufactured by Anaergia’s UTS Products. Recuperative thickening is used to maintain high solids content in the digester extending the SRT by removing water, thickening the digestate and returning it to the tank in a recirculating loop. Sludge is pumped to the
13
thickener using a PC pump. A low dose of polymer (3 to 4 kg/ton DS) is injected before the thickener and allowed sufficient contact time to flocculate before entering the unit.
Figure 9: Recuperative Thickener and End Products of Filtrate and Thickened Sludge
Installed skid and end products of the thickening process. Photo Credit: Anaergia Services. The unique design allows for sludge to be thickened and filtrate collected and pumped out of the system. The resulting filtrate contains an average of 0.2% TSS while the thickened sludge (cake) contains approximately 12% TS. Solids capture efficiency is close to 98%. The thickened sludge is pumped back to the digester to maintain 6% TS within the tank and extend the SRT. This system is unique due to its ability to receive sludge at over 6% TS, and concentrate up to 12% TS, with a low polymer dose and low power demand (<5 HP).
Recuperative thickening increases the SRT such that the tank can reach higher VS destruction. Removing filtrate during thickening decouples SRT from HRT, allowing the digester loading to be increased by a factor of three or more compare to conventional digestion. The OmnivoreTM digester operates with an SRT of over 25 days and the HRT under 10 days.
2.4 High Strength Waste Receiving A high strength waste receiving and storage station (Figure 10) was built as components of the OmnivoreTM demonstration. External waste was unloaded into the Anaergia receiving skid. The high strength liquid stream first passes through an in-line macerator and then is stored in a tank where it is continuously mixed. The 47 m3 (12,500 gal) storage tank is equipped with heat tracing and is mixed with a chopper pump mounted on the receiving skid.
High strength food processing waste was introduced for co-digestion to further increase biogas generation. The digester operated with an OLR = 4.0 kg/m3/d, and was increased to 4.5 kg/m3/d with the external organic waste.
The concept of co-digestion is not new, however taking advantage of the ability to decouple SRT from HRT to more efficiently utilize existing digester volumes has been done minimally, and with only moderate increases in digester loading rates. Internal Anaergia pilot testing trials have shown co-digestion can be effectively used at significantly increased OLRs compared to
14
traditional digestion at WWTPs and can achieve significantly increased biogas production and VS destruction.
Figure 10: High Strength Waste Receiving and Storage Station
Photo Credit: Anaergia Services. In Figure 11, the ‘Low Control’ and ‘High Conc. Control’ graphs refer to the control biogas production of low solids sludge digestion (~2% TS) and high solids sludge (~6% TS), respectively, without external waste. ‘High Conc. SSO + Sludge’ is the graph of biogas production of 6% TS sludge and source separated organics. ‘High Conc. FOG + Sludge’ is the graph of 6% TS sludge and fats, oils, and grease.
15
Figure 11: Co-digestion Performance
Source: Anaergia Services.
16
CHAPTER 3: Results 3.1 OmnivoreTM Digester Results The following figures summarize key performance parameters of the OmnivoreTM Digester and the two control digesters. Figure 12 shows changes in biogas yield and HRT in the High Solids OmnivoreTM Digester. The data shows that HRT gradually decreased while the biogas yield remained stable averaging roughly 700 Nm3/MT-VS fed and the SRT remained stable averaging 25 days. Current HRT is under 10 days with comparable biogas yield indicating the capacity to handle higher organic loading with stable operation.
Figure 12: OmnivoreTM biogas yield and HRT.
Biogas yield remains stable while HRT decreases.
Source: Anaergia Services.
The data shows that OmnivoreTM Digester achieves comparable biogas yield as the controls, but in one third of the reactor volume and with half the HRT. Figure 13 also shows the biogas yield and OLR of the OmnivoreTM Digester and the control Digester 4. The OmnivoreTM digester achieves comparable biogas production (in one third the volume of the control) and an OLR roughly three times greater. The OLR was 4.0 kg-VS/m3/day with only sludge as the feed, this compared to and OLR of 1.5 kg-VS/m3/day for the control.
Figures 13 and 14 show the biogas yield for the control Digesters 4 and 5, and the HRT for Digester 5. The biogas yield for the control Digesters 4 and 5 remained stable, averaging roughly 500 and 580 Nm3/MT-VS fed respectively, while the HRT and SRT was 26 days.
In December 2014, a co-digestion phase commenced with commercial high strength food processing waste. The OLR was increased from 4.0 to 4.5 kg-VS/m3/day and biogas generation per unit digester volume was three times greater with higher VS destruction compared to the control digesters.
Figure 15 shows a higher TS and VS content in the OmnivoreTM Digester compared to the control Digesters. The OmnivoreTM Digester operates with a TS content of roughly 4%, while the TS of the control digesters is under 2%. The VS/TS ratio for the OmnivoreTM Digester is slightly higher than the controls (80% vs. 65-75%).
Figure 15: OmnivoreTM TS and VS Compared to Control Digesters 4 and 5
The OmnivoreTM TS and VS/TS ratio is higher than control digesters.
Source: Anaergia Services.
The higher VS/TS ratio is a result of recuperative thickening and evidence of the increased biomass content in the OmnivoreTM. The recuperative thickener preferentially retains volatile solids and captures >99% of the influent solids. The VS/TS ratio of the influent digestate is ~80%, whereas the VS/TS ratio of the thickened solids is 81% ± 1% (avg. ± S.D.) and 42% ± 5% (avg. ±
S.D.) for the filtrate. The filtrate is sent to headworks for treatment and the thickened solids enriched with biomass are returned to the digester where residual organics or further stabilized.
The steady progression of increasing TS% in the OmnivoreTM digester with a slight decrease of TS% is noticeable in Digesters 4 and 5, likely due to the lowered loading rate resulting from the OmnivoreTM taking a portion of the plant sludge.
Thickener results show that the average VS/TS ratio in the thickener filtrate is 42% ± 5% (avg. ± S.D.). The average VS/TS in the thickened sludge is 81% ± 1% (avg. ± S.D.). The low VS content in the filtrate and high VS concentration in the thickened sludge indicates that the vast majority of biomass is being conserved in the digester. It should be noted that the higher VS/TS ratio in the OmnivoreTM digester compared to a typical digester (70% VS/TS) is not a function of decreased volatile solids reduction, but rather an indication that the digester has higher biomass inventory as the biomass yield is retained by the thickener and returned to the tank.
The OmnivoreTM digester operates at an HRT under 10 days, while Digesters 4 and 5 operate with an average HRT of roughly 26 days. The OmnivoreTM average biogas yield for OmnivoreTM is 650 Nm3/MT (9.6 ft3/lb) of VS fed when fed sludge only. Digesters 4 and 5 have biogas yields of 500 (7.8 ft3/lb) and 580 Nm3/MT (9.0 ft3/lb) of VS fed respectively when fed sludge only. This further proves that the OmnivoreTM not only has the potential to dramatically reduce the footprint of digesters, but the overall biogas yield and volatile solids reduction can be improved.
As seen in Figure 16, the concentration of alkalinity (ALK) is higher in the OmnivoreTM digestion process. However, when comparing the and volatile fatty acids (VFA) to alkalinity
Figure 16: OmnivoreTM Alkalinity and Volatile Fatty Acids to Alkalinity Ratio in Comparison to Digesters 4 & 5
However, when comparing the and volatile fatty acids (VFA) to alkalinity ratio there is no statistically significant difference between Digesters 4, 5, or the OmnivoreTM, showing that the digester is not overloaded and is operating stably. The ratio is consistently below 0.1 (VFA:ALK). Typically, the ratio should be less than 0.2, with 0.3-0.4 being considered an upset condition. The pH of the OmnivoreTM is consistent with Digesters 4 and 5 (Figure 17).
Viscosity has increased by five fold in the digester. At 40°C and a shear rate of 20 s-1, which is the typical of the mixing energy our mixer imparts, the viscosity for a typical digester operating at 1.8% TS digestate is 0.03 Pa s. At 6%, the same sludge at the same temperature and shear rate has a viscosity of 0.13, nearly five times higher. For reference, water viscosity at 40°C is 6.5 x 10⁻⁴.
3.2 Recuperative Thickener The recuperative thickener captured more than 98% of the total suspended solids (TSS) (Table 5). This equation was used to calculate the efficiency of the recuperative thickener:
where
Q = Sludge flow, LPM
S = Wash water + polymer water flow, LPM
C = Discharge cake, %TS
F = Feed, %TS
E = Filtrate, %TS
Few solids were observable in the filtrate (Figure 18), further evidence of the high performance of the recuperative thickener.
OmnivoreTM enables high solids digestion of sewage sludge that results in three major benefits: (1) increased loading capacity and biogas production, (2) co-digestion with high strength organic waste with a large proportion of high strength waste to sewage sludge solids, and (3) minimizes polymer consumption for recuperative thickening and dewatering by recycling polymer when solids are reintroduced into the digester.
The results show that a conventional digester retrofitted to an OmnivoreTM digester using Anaergia recuperative thickening and high-torque submersible mixers enables the digester to operate with increased loading capacity and biogas generation 2-3 times higher than conventional sewage sludge digesters with long-term stable operation. Omnivore has demonstrated that increasing the solids content, SRT, and gas production capacity of a retrofitted digester is cost effective, practical and advantageous. The OmnivoreTM digester operated at a solids content up to 6.0%. The digester is well mixed, the mixers and thickener show no signs of ragging, and both operate reliably and with low energy consumption. Biomass health parameters have remained stable, and biogas yield is higher than that of the control Digesters 4 and 5, which operate at much lower OLR and longer HRT. Co-digestion with external commercial organic waste showed a significant increase in gas production and operation at an OLR = 4.75 kg/m3/d, more than triple the OLR of conventional digesters.
Municipal WWTPs can typically generate no more than 50% of the power they consume by digesting the primary and waste activated sewage sludge they produce. To make WWTPs energy neutral or energy positive, digestion of external industrial feedstocks, food waste, and other municipal feedstocks is necessary. Yet, these types of feedstocks are often contaminated or inaccessible because they are embedded in mixed waste streams. Contaminated feedstocks can include food waste including source separated organics (SSO) that often contain contaminants such as plastic, paper, metal, and glass. Inaccessible feedstocks can include organic material such as food scraps, yard trimmings, juices, and diapers that are mixed in municipal solid waste (MSW) or wet commercial waste (WCW).
Extraction and preprocessing to generate a clean and highly digestible feedstock is critical and can be achieved with existing commercial technology that Anaergia supplies. Many municipal WWTPs do not have the digestion capacity to import large quantities of external waste to become energy neutral or energy positive Water Resource Recovery Facilities (WRRF). The OmnivoreTM retrofit package enables WWTPs to become WRRFs by increasing digestion capacity by up to three-fold with minimal operational disruption and cost.
New and emerging feedstocks for anaerobic digestion such as SSO, MSW, WCW are in enormous supply and their capture and digestion offers multiple environmental benefits including diverting material from landfills and mitigating greenhouse gas emissions by eliminating fugitive methane release at landfills, shortening waste transport distances, and generating a carbon negative fuel - biogas. Digestion of organics in mixed waste streams
25
achieves multiple California state goals and regulatory requirements related to renewable energy, biopower, landfill diversion, and greenhouse gas reductions.
California’s renewable portfolio standard (RPS) requires utilities to procure 33% of total energy from renewable sources by 2020, and Governor Brown has stated that this target will increase to 50%. Recently adopted Senate Bill 1122 requires the generation of electricity from waste organics (biopower) by mandating investor owned utilities to procure 250 MW of renewable electricity generated by organics, of which 110 MW must come from food waste, wastewater treatment plants, and diverted municipal organic waste. SB 1122 sets the initial price for the sale of biopower at $0.127 per kWh and adjusts this price based on program participation. California set a goal of 75% overall landfill diversion and Assembly Bill 1826, which recently signed into law, officially bans the landfilling of organic waste generated by businesses.
The California Global Warming Solutions Act, Assembly Bill 32, required a reduction in greenhouse gas emissions to 1990 levels by 2020. Considering biogas is a fuel with the lowest carbon intensity, and is in fact carbon negative, its use for generating power significantly contributes to the goals set forth in AB 32. A proposed bill, Assembly Bill 687, sought to set a renewable gas standard. Like the renewable portfolio standard for electricity, the renewable gas standard would require that a percentage of California’s natural gas be supplied by renewable gas, namely biogas), beginning with 1% in 2020 and increasing to 10% by 2030.
California currently consumes 2 trillion cubic feet of natural gas annually; 1% of this quantity is 20 billion cubic feet, equivalent to roughly 10,000 tons per day of organic material extracted from MSW. This quantity is equivalent to generating 1 MW of electricity at roughly 100 WWTPs. These regulatory measures and statewide goals make co-digestion of large quantities of landfilled organic waste particularly attractive at WWTPs. Increasing digestion capacity and extracting and cleaning organics from mixed solid waste streams will be key in achieving these goals.
OmnivoreTM is a cost effective approach for WWTPs with existing anaerobic digestion infrastructure to increase digester capacity and biogas production without investing in costly additional tank volume. The demonstration project showcased an economically attractive and technically feasible method to shift wastewater treatment plants from grid dependent consumers to energy-neutral or energy-positive facilities by creating digestion capacity to import municipal or industrial organic feedstock and increase biogas and power generation.
As of March 2015 the OmnivoreTM will be transferred to VVWRA. During this period, data will continue to be collected and analyzed by Anaergia.
26
CHAPTER 5: Commercial Plan The application at VVWRA has not only allowed Anaergia to demonstrate the benefits of the OmnivoreTM application, it has also offered an opportunity for refinement and improvement of system components and site design elements. The VVWRA OmnivoreTM application will remain after the demonstration duration is complete, where it will serve as a model unit for prospective customer visits. The installation has already helped inform municipal clients of the benefits of the OmnivoreTM system, and a number of municipalities and wastewater treatment consultants have visited the site. The findings from this study will compliment these site visits by demonstrating the long term stable operation and full-scale commercial viability of the OmnivoreTM system.
5.1 Market Opportunities – WWTP Upgrades and Organics Diversion The market for OmnivoreTM retrofits is influenced by many drivers, some are more obvious than others. Obvious drivers include increases in wastewater treatment plant capacity, replacement of aging infrastructure, and desire to increase biogas production. A factor less obvious relates to changing regulations in solid waste management. As described in the conclusions section of the final report, many U.S. states (including California) now mandate diversion of organics from solid waste, diverting significant volumes from landfills. Existing anaerobic digester sites offer ideal disposal alternatives for these newly diverted waste streams for a number or reasons:
• Value is created as both tip fees and biogas production. • Unlike composting, methane produced by decomposing organics is completely captured
and managed. • Existing wastewater treatment facilities have infrastructure and permits in place so
modifications can be implemented in a matter of months compared to development of entirely new facilities which can take many years and has associated risk.
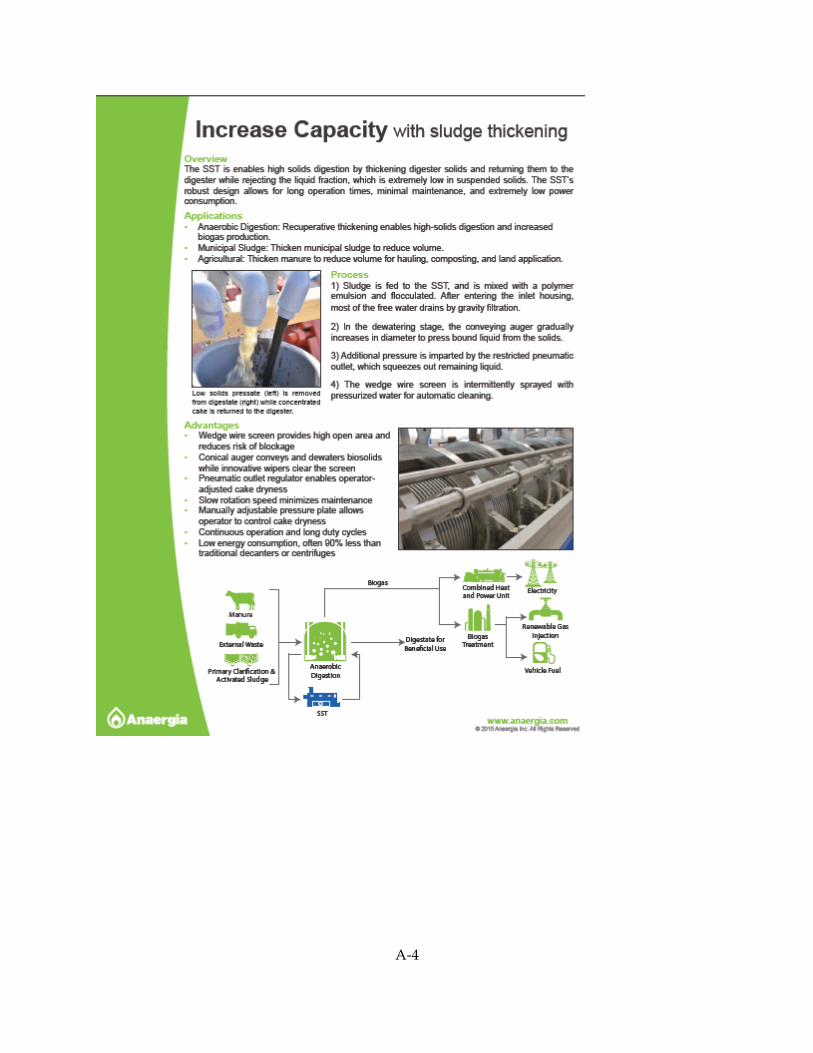
• Diversion of organics from solid waste streams relies on a solid waste processing facility’s ability to separate the organics, and reliable digestion of that extracted feedstock relies on reliable organics cleaning. This new resource recovery approach requires new technologies for both organics extraction and polishing that are robust and economical. Anaergia is responding to this need by introducing new technologies to market (in addition to what was included in the OmnivoreTM demonstration). Anaergia’s Organics Extrusion Press (OREX) separates the organic fraction from a variety of solid waste streams, producing a wet digestible feedstock. The Organics Polishing System (OPS) removes physical contaminants from the feedstock, preparing it for digestion. These technologies will help create feedstock streams which can be accepted by wastewater treatment facilities, increasing demand for digestion capacity which can be accomplished by an omnivoreTM retrofit.
Anaergia’s marketing brochures for all equipment mentioned in this section are included in Appendix A.
27
5.2 Product Design – Multiple OmnivoreTM Packages As described, OmnivoreTM retrofit equipment can be sold to facilities with existing anaerobic digesters, and for construction of new digesters for organics management and biogas production. Anaergia offers OmnivoreTM packages in a variety of configurations: one package focuses on high solids mixing equipment (with the option of adding an external feedstock reception skid), and the other combines high solids mixing equipment with recuperative thickening, similar to the system installed at VVWRA.
5.2.1 Option 1: High Solids Digestion Package
For applications where high solids feedstocks are supplied (such as dedicated digestion of food waste, crops, and manure), only the high solids mixing package is needed. Here, the solids content in the digester is naturally high and the digesters are limited by organic loading. In these applications, recuperative thickening is not needed, but high solid mixing is required. Additional benefits are be incorporated via Anaergia’s service boxes, flexible membrane covers, power units, and controls. If these applications call for accepting additional external feedstock, the optional waste reception skid is available as part of the package.
5.2.2 Option 2: Complete OmnivoreTM Package (Thickening and High Solids)
The complete OmnivoreTM package (high solids digestion, recuperative thickening, and waste reception) is appropriate when dilute waste streams (such as sludge or low solids content wastes) are fed to digesters. Here, recuperative thickening increases the solids content of the digester while shortening HRT, reducing required digester volume.
28
GLOSSARY
Term Definition
BMP Biomethane Potential CHP Combined Heat and Power d Day DS Dry Solids FOG Fats, Oils and Grease FOGHSW Fats, Oils, and Grease, High Strength Solid Waste gal Gallon HP Horsepower HPU Hydraulic Power Unit HRT Hydraulic Retention Time kg Kilogram L Liter lb Pound m3 Cubic Meter m3 Cubic Meter MCC Motor Control Center MDRD Municipal Digester Repowering Demonstration MT Metric Ton N Nitrogen NH3 Methane Nm3 Normal Meter Cubed OLR Organic Loading Rate PC Progressive Cavity PLC Primary Logic Controller PS Primary Sludge PS Primary Sludge RD&D Energy Research and Development Division SRT Solids Retention Time SSO Source Separated Organics TKN Total Kjeldahl Nitrogen TM Trademark TS Total Solids TS Total Solids TWAS Thickened Waste Activated Sludge VS Volatile Solids VVWRA Victor Valley Wastewater Treatment Authority WWTP Wastewater Treatment Plant
29
REFERENCES
Burton, F.L.; Stensel, H.D.; Tchobanoglous, G. Wastewater Engineering Treatment and Reuse, 4th ed.; Tata McGraw-Hill Publishing Company Limited: Nagar, New Delhi, 2003.
Hammer, Mark J.; Hammer Jr., Mark J. Water and Wastewater Technology, 7th ed.; Pearson Education, Inc.; Upper Saddle River, NJ, 2012.