23
Municipal Finance in the Commonwealth Going Broke in MassaCHOASetts
| Date post: | 15-Dec-2015 |
| Category: |
Documents |
| Upload: | sade-elbon |
| View: | 213 times |
| Download: | 0 times |

Municipal Finance in the Commonwealth
Going Broke in MassaCHOASetts
Remembering the SATs
Analogy Question
Kids are to Parents as
Municipalities are to the
STATE
Just as parents dictate to kids the terms of the relationship, so too does the State to municipalities

It’s the same old story, same old song and dance, my friend(s)
Expenses ↑Employee OverheadCapitalRevenues ↓Local AidNew Growth
Believe me,one size doesn’t always fit all!
Cities and towns have differing needs on the same issues, with cities generally requiring more revenue to support higher expenditures in:
Public Safety Education Social Services Infrastructure

The Battle of the Chel’s Urban vs. Suburban
Chelsea vs. ChelmsfordPopulation 32,792 33,707Median Income $30,000 $71,000Budget $127m $101mBud. Per Capita $3,827 $3,000Police 97 49School Pop 5,689 5,819School Budget $69m $56mBud. Per Pupil $12,198 $9,671

Not that there’s anything wrong with that!
Chelsea vs. Chelmsford STATE
Low Income 77.8% 6.4% 15.4
2nd Lang Learners 83.5% 7.3% 30.7
Offsets Difference
Low Income $9.3m $0.8m $8.5m
2nd Lang Learners $7.4m $0.6m $6.8m
TOTAL $16.7m $1.4m $15.3m
School Budget $69m $56m $13m
Show methe money
Two Largest Revenues Sources:Local Aid & Property Taxes
Urban communities are more reliant on Local Aid than others
Some urban communities may be “over-reliant” on Local Aid, but Mr. & Mrs. Commonwealth won’t let us kids go out and hustle for ourselves
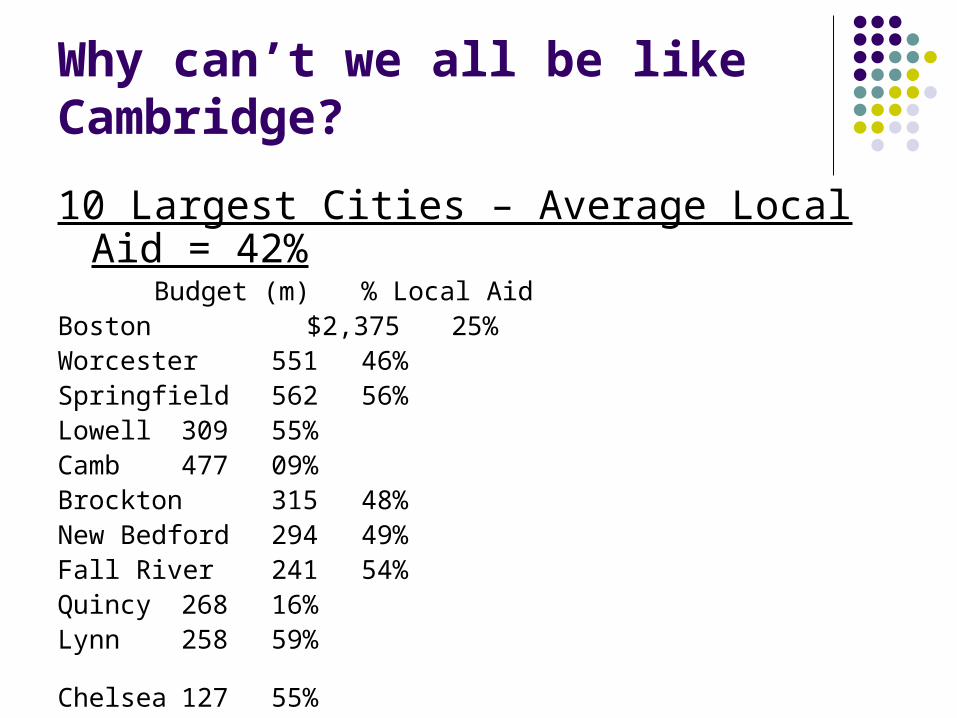
Why can’t we all be like Cambridge?
10 Largest Cities – Average Local Aid = 42% Budget (m) % Local Aid
Boston $2,375 25%Worcester 551 46%Springfield 562 56%Lowell 309 55%Camb 477 09%Brockton 315 48%New Bedford 294 49%Fall River 241 54%Quincy 268 16%Lynn 258 59%
Chelsea 127 55%

Can a town get some love?
10 Largest Towns – Average Local Aid = 17% Budget (m) % Local Aid
Framingham $225 14%Brookline 208 09%Weymouth 143 24%Barnstable 157 10%Billerica 127 19%Arlington 120 16%Amherst 70 24%Braintree 111 14%Chelmsford 101 16%Dartmouth 76 20%

You’ve given me the XBOX and the PS3, but why can’t I have a Wii too?
10 Largest Cities – Average Local Aid = 42%(Lawrence: 69% - Newton: 07%)
10 Largest Towns – Average Local Aid = 17%(Concord: 6%)
Significant driver of difference is School Aid(C’msford: 50% of LA is SA – C’sea: 72% of LA is SA)

Finally, some Pie with this PowerPoint?!
Local Aid55%
Other20%
Prop Tax25% Local
Aid16%
Other12%
Prop Tax72%
Chelsea ChelmsfordRevenues
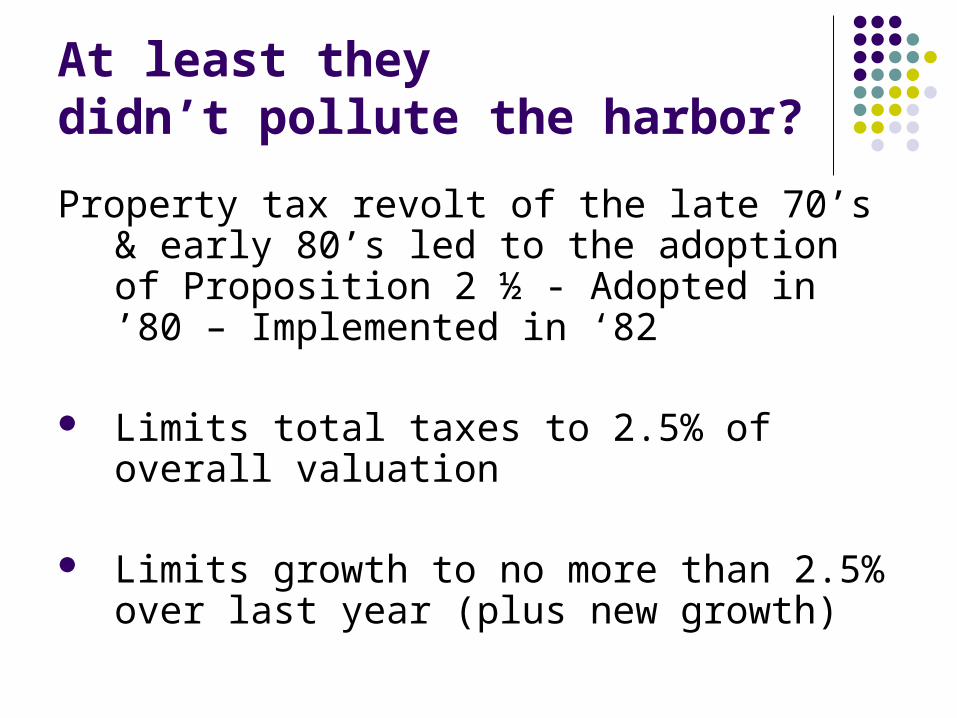
At least theydidn’t pollute the harbor?
Property tax revolt of the late 70’s & early 80’s led to the adoption of Proposition 2 ½ - Adopted in ’80 – Implemented in ‘82
Limits total taxes to 2.5% of overall valuation
Limits growth to no more than 2.5% over last year (plus new growth)
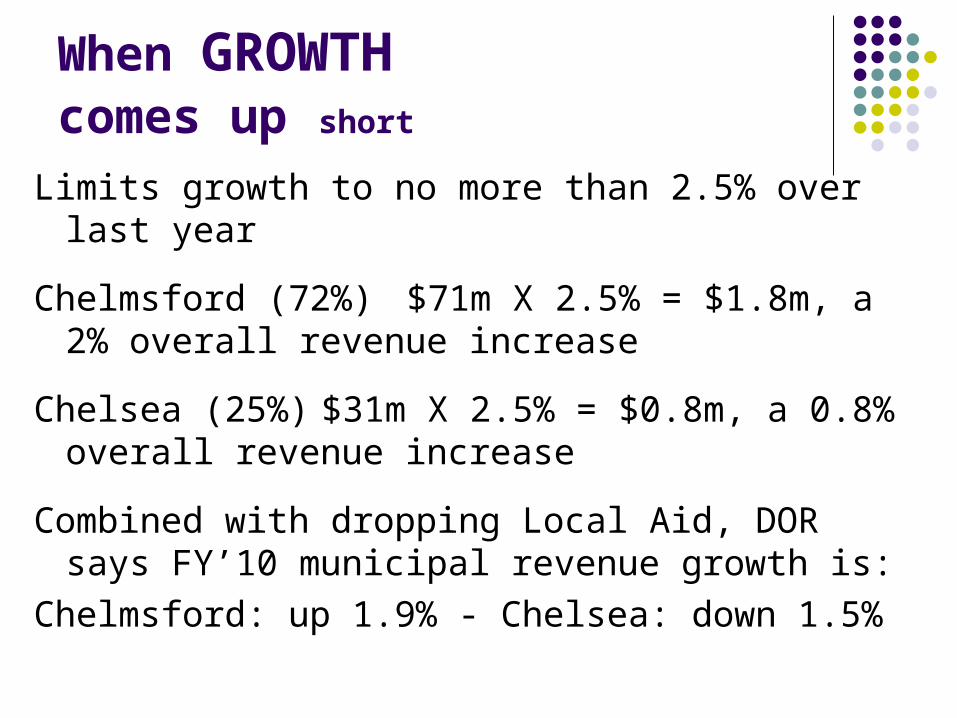
When GROWTHcomes up short
Limits growth to no more than 2.5% over last year
Chelmsford (72%)$71m X 2.5% = $1.8m, a 2% overall revenue increase
Chelsea (25%) $31m X 2.5% = $0.8m, a 0.8% overall revenue increase
Combined with dropping Local Aid, DOR says FY’10 municipal revenue growth is:
Chelmsford: up 1.9% - Chelsea: down 1.5%

Fairy tails, come true, it could happen to you, if you’re a town at heartProp 2 ½ does allow for an override, allowing
voters to increase property taxes Overrides are almost an exclusively town financing
tool (“Budgeting by Override”): Since 2000, of the approx 1,200 overrides placed before voters, 5
were proposed in just 2 of the State’s 45 cities (3 -Brockton ’08: loss), (2 – Northampton ’04: loss - ’09: win)
Small towns are most likely to propose and adopt overrides, like Aquinnnah (42: 14-28), West Tisbury (39: 26-13) and Tolland (30: 13-17)
Affluent Concord is 19-2 this decade, raising almost $9m more in tax revenue for local needs – Chilmark is 14-0 this decade and 35-5 since 2 ½ was adopted

The Emperor has no clothes (are we all “Karma Chameleons”?)
Problems with Prop 2 ½:
1. Huge increases in Local Aid masked the fallout from revenue restrictions caused by 2 ½, but those days are as distant as a Boy George hit
2. Huge increases in values hasn’t translated into that same increases in tax revenues
3. Prop 2 ½ limits haven’t keep up with inflation
4. There’s no concurrent limit on expenditure growth

I should havemanaged in the 80’s
1. Once covering up Prop 2 ½ shortfalls, declines in Local Aid are now exposing the system’s flaws:
Combined Non-School Aid (Lottery and Additional Assistance) by decade since the adoption of 2 ½
Increase
’81-’90 425%!!!!!’91-’00 7%’01-’10 (22%)!!!!!
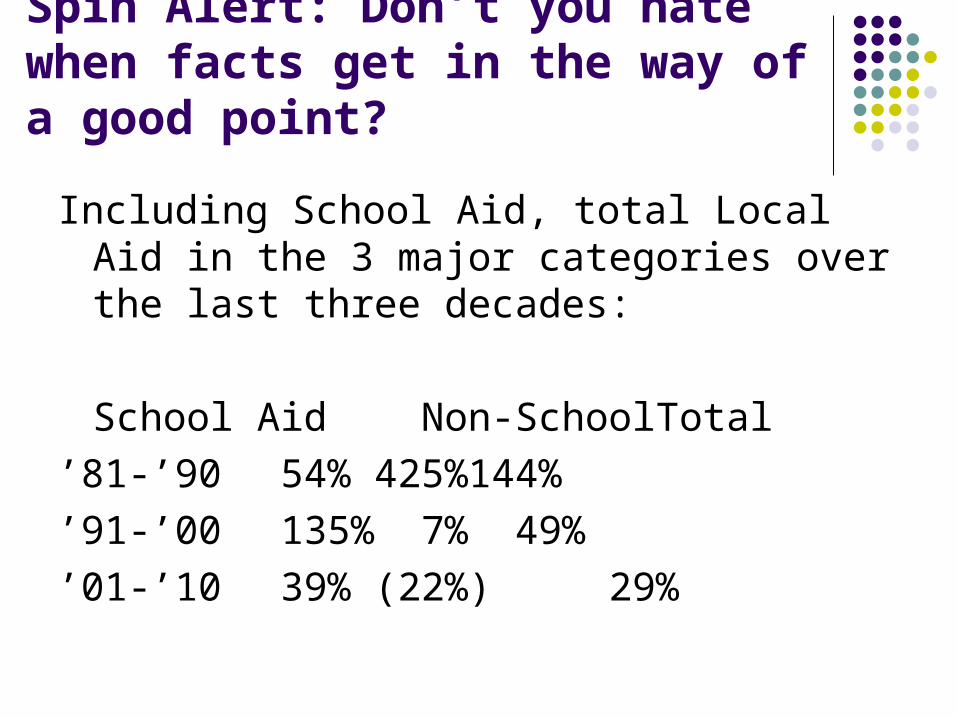
Spin Alert: Don’t you hate when facts get in the way of a good point?
Including School Aid, total Local Aid in the 3 major categories over the last three decades:
School Aid Non-School Total
’81-’90 54% 425% 144%
’91-’00 135% 7% 49%
’01-’10 39% (22%) 29%

How abouta little somethin’ for the effort!
2. Huge increases in property values haven’t produced a concurrent effect on tax receipts
Value Increases Tax IncreaseStatewide
’00-’09 up 122% up 63% Lowell’00-’09 up 157% up 54%(Chelsea up 172% up 64%)

Slip-sliding away
3. Prop 2 ½’s 2.5% allowable increase hasn’t kept up with inflation
Since the adoption of Prop 2 ½ in 1980, inflation has exceeded 2.5% in 22 of 29 years
Average inflation has been 3.9% (1998: 1.55% - 1980: 13.58%)
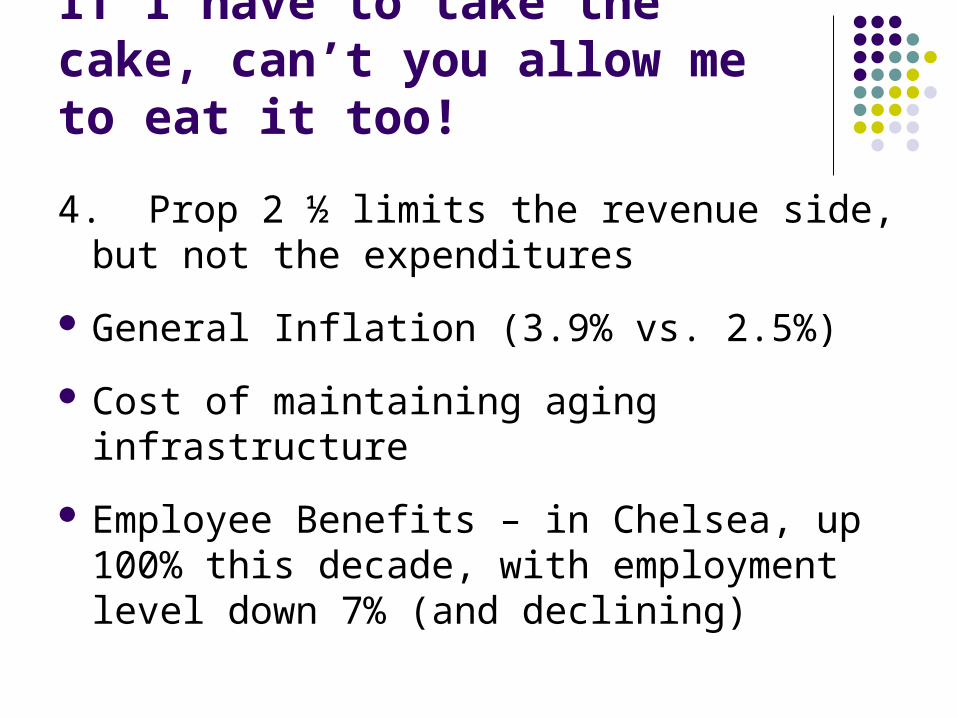
If I have to take the cake, can’t you allow me to eat it too!
4. Prop 2 ½ limits the revenue side, but not the expenditures
General Inflation (3.9% vs. 2.5%)
Cost of maintaining aging infrastructure
Employee Benefits – in Chelsea, up 100% this decade, with employment level down 7% (and declining)
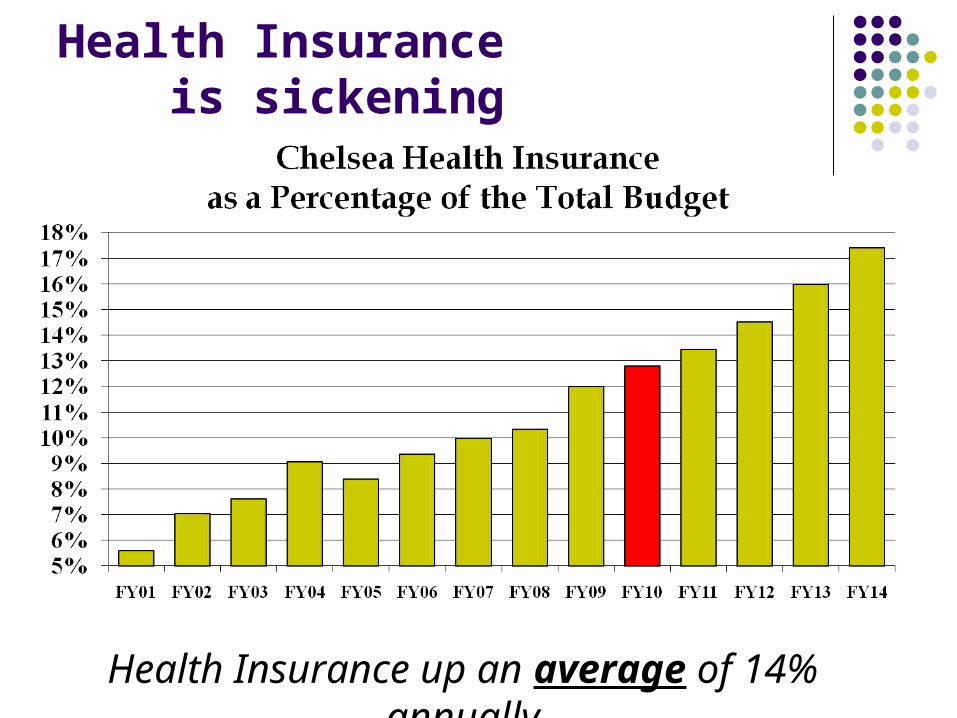
Health Insurance is sickening
Health Insurance up an average of 14% annually

Thank you, sir!May I have another?FY’10 is another in a long line of financially stressful years
for cities in towns
Historic Cuts In Local Aid – Chelsea ↓30% - with overall revenues ↓5% (decade ave. ↑2% a year)
Chelsea impacts (non-school): ½ of the municipal depts. budgets reduced Another 20 positions eliminated: ↓20% from ’02 Fees and fines raised again Capital investment deferred again Reserves continue to decrease Total revenue loss supporting non-schools: 15%

The Benevolent Dictator says:
What needs to be done is: Health Insurance relief Pension reforms Regionalism coordination Charter School financing reforms Continued support of Ed ReformAs well as: New Local Aid commitment – Partnership Aid Recalibration of Prop 2 ½ Consolidation of jurisdictions (under a Benevolent Dictator!)


