MUNICIPAL, FINANCES - A CASE STUDY OF KARACHI Author(s): Aisha Ghaus Source: Pakistan Economic and Social Review, Vol. 27, No. 2 (Winter 1989), pp. 77-108 Published by: Department of Economics, University of the Punjab Stable URL: http://www.jstor.org/stable/25825036 . Accessed: 25/02/2014 14:23 Your use of the JSTOR archive indicates your acceptance of the Terms & Conditions of Use, available at . http://www.jstor.org/page/info/about/policies/terms.jsp . JSTOR is a not-for-profit service that helps scholars, researchers, and students discover, use, and build upon a wide range of content in a trusted digital archive. We use information technology and tools to increase productivity and facilitate new forms of scholarship. For more information about JSTOR, please contact [email protected]. . Department of Economics, University of the Punjab is collaborating with JSTOR to digitize, preserve and extend access to Pakistan Economic and Social Review. http://www.jstor.org This content downloaded from 198.91.32.137 on Tue, 25 Feb 2014 14:23:48 PM All use subject to JSTOR Terms and Conditions
Transcript
MUNICIPAL, FINANCES - A CASE STUDY OF KARACHIAuthor(s): Aisha GhausSource: Pakistan Economic and Social Review, Vol. 27, No. 2 (Winter 1989), pp. 77-108Published by: Department of Economics, University of the PunjabStable URL: http://www.jstor.org/stable/25825036 .
Accessed: 25/02/2014 14:23
Your use of the JSTOR archive indicates your acceptance of the Terms & Conditions of Use, available at .http://www.jstor.org/page/info/about/policies/terms.jsp
.JSTOR is a not-for-profit service that helps scholars, researchers, and students discover, use, and build upon a wide range ofcontent in a trusted digital archive. We use information technology and tools to increase productivity and facilitate new formsof scholarship. For more information about JSTOR, please contact [email protected].
.
Department of Economics, University of the Punjab is collaborating with JSTOR to digitize, preserve andextend access to Pakistan Economic and Social Review.
http://www.jstor.org
This content downloaded from 198.91.32.137 on Tue, 25 Feb 2014 14:23:48 PMAll use subject to JSTOR Terms and Conditions
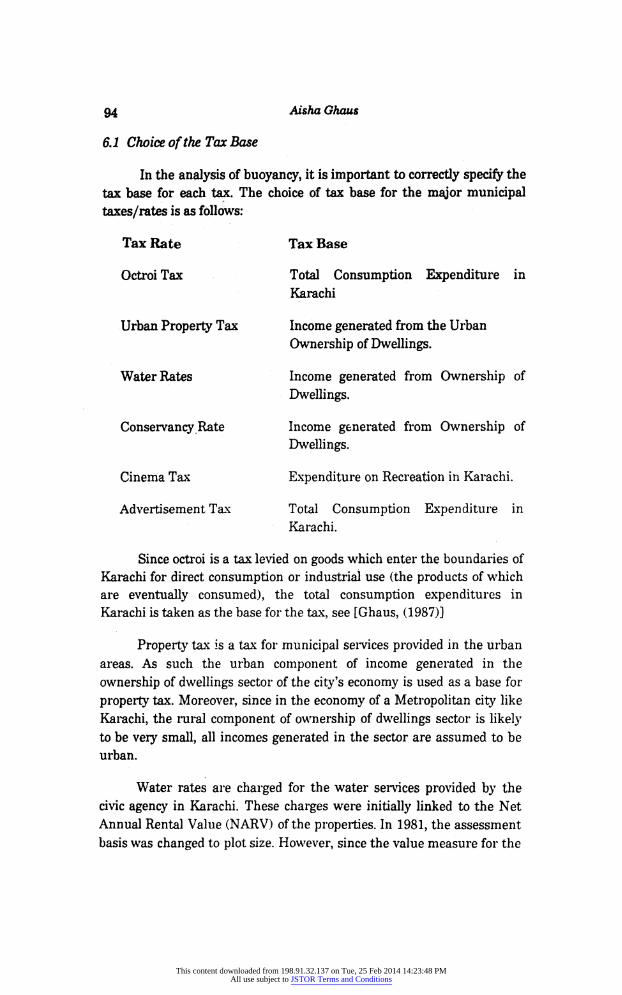
This paper undertakes thc analysis of the fiscal state of major civic agencies operating in Karachi for the period 1972-73 to 1984 85. Resource mobilisation and trends in expenditures on major municipal services are analysed and a composite index of the level
of urban services provided is constructed for the period of analysis. Also, buoyancies of major municipal taxes/rates is estimated to analyse their revenue generating potential. Decomposition of the buoyancy coefficient into tax-to-base and base-to-income components is done. Finallyy a set of policy recommendations is presented to enhance the extent of municipal resource mobilisation. These include measures for higher revenue
generation through existing taxes, new sources of revenues and
revenue-sharing transfers.
Karachi has grown from a small harbour town inhabitated by about 500,000 people at the time of independence to the biggest urban
centre of the countiy. According to the 1981 population census Karachi
accommodated approximately 5.2 million people, which constituted 22
percent of total urban population of Pakistan. Enormous influx of
Applied Economics Research Centre, University of Karachi, Karadii-32,Pakistan
This content downloaded from 198.91.32.137 on Tue, 25 Feb 2014 14:23:48 PMAll use subject to JSTOR Terms and Conditions
migrants initially from India (following independence) and later from other parts of the country has increased Karachi's population at a rate of
6 percent in the 60s, 5.7 percent in the 70s and 4.5 percent in the 80s.
These annual population growth rates are higher than the growth rates
experienced in the country as a whole during the corresponding periods.
Although the rate of growth has slowed overtime, Karachi is expected to
have well over ll million inhabitants by the end of the century.
The city's attractiveness to migrants is primarily due to its
economic vitality. In 1084-85, Karachi accounted for more than 19
percent of the nation's Gross Domestic Product, growing at a annual rate
of 5.9 percent during the past fourteen years.1 It's share in the major sectors of the national economy are; manufacturing 24 percent; banking & insurance 41 percent; construction 16 percent; and transport and
communications 18 percent. Because of all these factors, Karachi
generates a per capita annual income of Rs.12,672 which is
approximately 3 times that of Pakistan. (See Bengali, (1987)).
A direct consequence of a higher income level and the resultant
increase in migration (along with natural increase in population) is that the demand for urban services has increased rapidly overtime. The
inability of the local authorities to adequately meet the needs for land
and other basic amenities has led to the development of sub-standard,
congested squatter settlements in the city. According to an estimate, 37
percent of Karachi's population lives in Katchi Abadis. The recent
escalation in the level of violence, especially due to ethnic factors, largely concentrated in the poorer neighbourhoods of the city is perhaps an
indication of the dissatisfaction with the quality of life. This perception of an inadequate provision of publicservices is, however, not just restricted
to the relatively poorer sections of population in Karachi.
Clearly, if the city is to maintain a semblance of order in the
conduct of economic and other activities then fundamental structural
changes will be required to ensure fuller community participation,
especially of the lower income groups who feel largely disenfranchised,
particularly in the allocation of scare public funds. The tax structure will
have to be developed to mobilise more resources to ensure an adequate
supply of public goods to all. Also, it is important to ensure that the taxation structure acts as a redistribution device.
This content downloaded from 198.91.32.137 on Tue, 25 Feb 2014 14:23:48 PMAll use subject to JSTOR Terms and Conditions
builder of infrastructure. Its principal activity is the development of land
along with flood control works and the construction of some water
supply projects, as executing agent for KWSB. In addition, it undertakes
city master planning (the preparation of urban and regional plans for
Karachi), building control and traffic engineering functions.
The counterpart of these local authorities in the Cantonment
areas is the Directorate of Military Lands and Cantonments (MLC). All urban development and maintenance activities in the six cantonment
areas in Karachi fall under the control of this authority which operates under the federal government The cost of services is directly financed
through own sources by the Cantonment Board.
SECTION m
3.1 Municipal Fiscal Powers and Revenue Sources
Municipal agencies in Karachi are regulated by the Sind Local
Government Ordinance of 1979, which has been amended somewhat in
subsequent years. The Ordinance contains provisions relating to the
local government functions, administration and fiscal powers. In all
twenty-nine different kinds of levies are permitted under the Ordinance.
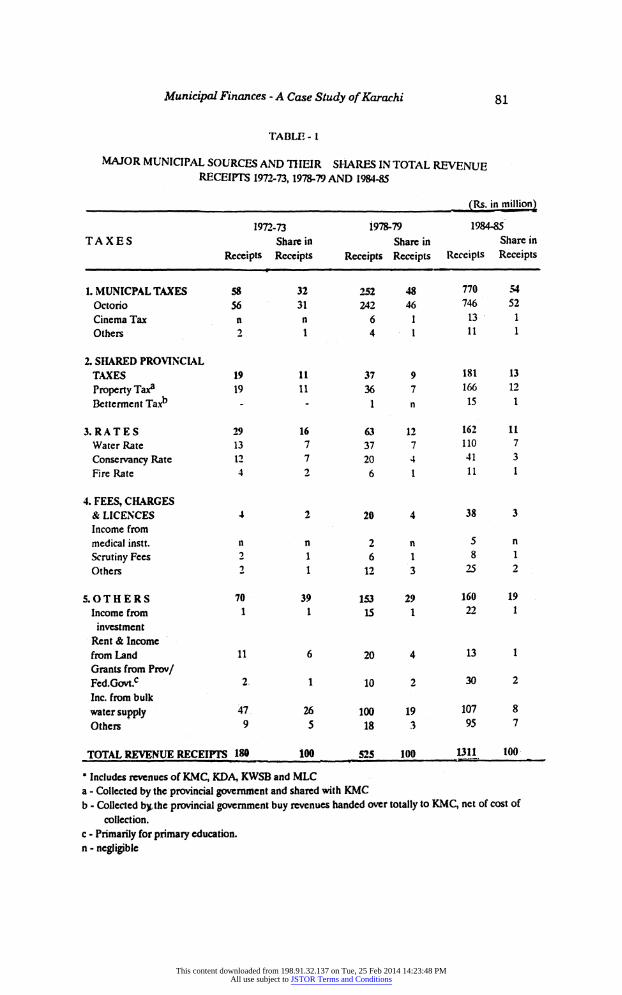
The structure of Karachi's Municipal finances is given in Table 1.
The table includes revenues of the major chic agencies operating in the
city, namely KMC, MLC, KDA & KWSB. The extreme dependence on
taxes, a feature common to the public finance structure of Pakistan, is
striking in Karachi's municipal accounts as well. In 1984-85, 67 percent of the total revenue receipts are generated through taxes. Also, there has
been a tendency for the share of taxes in total revenues to increase
overtime.
Octroi heavily dominates the revenues of Karachi. It accounts for
more than half of the total revenues generated. The other important source is the property tax. This is the only tax which is currently being shared between the provincial and the municipal governments in
Pakistan. In Sind, eighty-five percent of the revenues (net of costs of
collection) are being given by the provincial government to local bodies.
Betterment tax is the other tax which the provincial government collects
and passes on to the local governments. Its contribution to local finances is very meager.
This content downloaded from 198.91.32.137 on Tue, 25 Feb 2014 14:23:48 PMAll use subject to JSTOR Terms and Conditions
Besides, the municipal government levies other small taxes which
altogether constitute only 2 percent of total revenues. These include
cinema tax, advertisement tax, toll tax, vehicle tax etc.
A number of rates, fees, charges are also levied by the municipal
government. These are levies against various municipal services
provided. For example, water rates are charged for water supply
services, fire rate for fire brigade services etc. Altogether rates, licenses, fee and charges accounted for 14 percent of total municipal revenues in
1984-85. The highest revenue contribution among these are of water
rates and conservancy rates. Among the non-tax revenues, important are incomes from bulk water supply, investments, land and grants received from the provincial/federal governments.
As has already been mentioned, military lands and cantonments
fall outside the jurisdiction of the metropolitan corporation of Karachi.
They generate their own resource and incur their own expenditures and,
by and large, operate under the federal government. In all only 5 percent of the total revenues generated by the municipal authorities in Karachi
accrue to MLC. Their share in Karachi's population is 6 percent.
It may be mentioned here that properly tax, professional and
calling tax and entertainment tax (otherwise a provincial government
subject) are collected by the MLC on their land.
On the capital side, major source of finance are the current
account surpluses, funds from the provincial/federal governments
(including loans from international agencies) and income from lands and
investments. In 1984-85, current account surpluses financed
approximately 31 percent of Karachi's capital expenditures. 23 percent of
the capital expenditures were financed by income from land and
investments.
A brief mention of the Karachi Special Development Programme (KSDP) needs to be made here. The implementation of KSDP started from 1986-87 which is financed by the World Bank and the Asian Development Bank. KMC has been awarded three projects under the KSDP. Thes include solid waste management, katchi abadi upgrading and accounting assistance to KMC.
This content downloaded from 198.91.32.137 on Tue, 25 Feb 2014 14:23:48 PMAll use subject to JSTOR Terms and Conditions
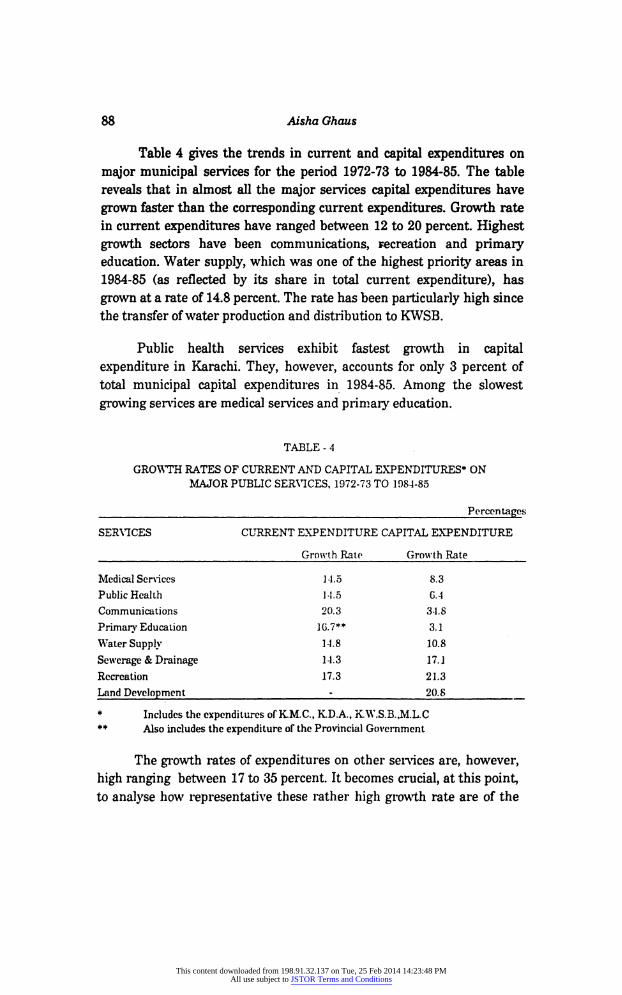
In the intersectoral distribution, highest priority areas (as
reflected by their share in total expenditures) are communications, water supply and land development Communication accounts for 18
percent of the total expenditure incurred in Karachi followed by water
supply 17 percent, and land development 16 percent. By and large, a
higher proportion of these expenditures was incurred on the
improvement and development of services.
Medical services along with education have taken up 8 percent of
the total municipal expenditures in 1984-85. As already mentioned these
services are provided by both the local and provincial governments in the
city. Little developmental activity took
SECTION rv
THE STATE OF MUNICIPAL FINANCES IN KARACHI
Allocation of functional responsibilities discussed in the previous
section, highlights the vital role of the local authorities in the provision of basic public services in Karachi. Since the quantity and quality of the
services provided depend on the state of finances of the providing agency, it is important to see what has been happening to the revenues and
expenditures of these agencies over time.
Analysis reveals that municipal expenditures have grown faster
than receipts during the period 1972-73 and 1984-85. The annual
cumulative growth rate of expenditure is estimated to be 15.8 percent while the growth rate of receipts during the corresponding period was 14.5 percent. This divergence is primarily the consequence of an
imbalanced growth in the capital accounts. The growth rate of capital
expenditure is substantially more than the growth rate of capital
receipts, which is estimated to be 9.3 percent. Increased developmental
activity, particularly in the 80's has increased capital expenditures of the
municipal governments by 16.7 percent annually.
As opposed to the capital accounts, the current accounts exhibits a
reverse pattern. Current revenue has grown at a rate of 17.5 percent whereas the growth rate of current expenditure has been 14.8 percent. In the public finance hierarchy of Pakistan this is the lowest growth rate
This content downloaded from 198.91.32.137 on Tue, 25 Feb 2014 14:23:48 PMAll use subject to JSTOR Terms and Conditions
The higher growth rate of revenues in comparison to expenditures
explains the growing pattern of surpluses in the current accounts of
Karachi. Current account surpluses have grown from 14 percent of
current expenditure in 1972-73 to 32 percent in 1984-85. The magnitude of the surplus was Rs. 342 million in 1984-85 (see Table 3).
By and large all the agencies, except KWSB have contributed to
the current surpluses of Karachi. KD A. has huge surpluses, followed by KMC. KWSB is the only agency which shows a deficit since its commencement. In 1984-85, its deficit was Rs. 202 million which
amounted to approximately 72 percent of its current expenditure.
In contrast to the current account, capital account exhibit
consistent and increasing deficits. Deficits have increased from Rs. 33
million in 1974-75 to Rs. 703 million in 1984-85. These capital account
deficits are almost a constant feature for all civic agencies except KD A.
KDA incurred a deficit in just three of the last thirteen years analysed.
Overall, Karachi's municipal finances show a net budgetary deficit. The overall deficit was approximately 17 percent of the total
expenditures in 1984-85. The cumulative deficit for the period of analysis was Rs. 794 million in 1984-85.
SECTION V
ANALYSIS OF THE PROVISION OF MAJOR PUBLIC SERVICES
The budgetary gap in the finances of Karachi is likely to have an adverse impact on the ability of the municipal authorities to adequately and efficiently meet the demand for public services in the face of growing population. However, since provision of services is divided among different agencies, the overall financial constraint is unlikely to affect all
the services equally. Thus a disaggregated analysis of the individual public services needs to be undertaken to see the varying impact of the
financial constraint on various services.
This content downloaded from 198.91.32.137 on Tue, 25 Feb 2014 14:23:48 PMAll use subject to JSTOR Terms and Conditions
The composite index of the overall provision of urban services has
gone up from 85 in 1972-73 to 225 in 1984-85, at the base of 1975-76, (see Table 5). In per capita terms, the increase is from 99 in 1972-73 to 141 in 1984-85. Fastest growing services have been hospitals, buses and
water supply. The least growth has been observed in sewerage
treatment, roads and all levels of education. Further, urban services
seem to have generally grown more rapidly after 1979-80.
It is important to emphasise that this index is just a
representation of the quantitative increase in the services. It in no way
captures the qualitative aspect of the services provided. For example, the
overall increase in the capacity to supply water to the city is captured in
the index. However, there is no reflection of the frequency of pipe line
bursts which hinder the smooth supply of water, the low pressure of
water supply to some parts of the city etc. Similarly, the increase in
electric power breakdowns and loadshedding in not reflected in the index
which just measures the increase in the electricity sold. It seems that
perhaps the pattern of growth in ser Aces experienced in the city during the period of analysis is such that there has been an extension in services
in quantitative terms at the expense of a qualitative improvement in
service provision. This phenomenon is supported by a higher growth rate of capital as opposed and current expenditures in Karachi. The
former is used for development of service while the latter reflects the funds directed to operation and maintenance.
Also, the index does not highlight the absolute level of provision of
services, which is generally low. For example, in 1984-85, the per capita domestic consumption of water was 23 gallons per day (with less than half the population having piped connections), primary school
This content downloaded from 198.91.32.137 on Tue, 25 Feb 2014 14:23:48 PMAll use subject to JSTOR Terms and Conditions
enrollments were 68 percent of the school-going age population, 12
hospital beds per 10,000 population, only 19 percent treatment of
sewerage generated and so on (see Table 6).
Therefore, it is clear that though expenditures on various services
have grown at a high rate and the quantum of services provided has also
grown over the past decade or so, the per capita level of provision of
major public services is still veiy low. This is true for all services and
particularly true for social services like education and health.
SECTION VI
BUOYANCY OF MUNICIPAL REVENU ICS IN KARACHI
Previous sections indicates that the financial constraint faced by the city has limited the ability of the local authorities to meet the need
TABLE - G AVAILABILITY OF SERVICES IN KARACHI, 1972-73 TO 198-1-85
SERVICE_ UNIT: 1072-73 1077-78 198-1-85 1. Domestic Water Supply per gallon 17 13 23
Capita per dav
2. Extent of Treatment of % 47 39 19
Sewerage Generated
3. % of School-Going Age* % 83 77 68
Children in Primary Schools
4. Hospital Beds for 10,000
Population No. No. 4 4 12
5. Public Transport Bus scats
per 1000 population No. 13 35 G8 6. Plots Developed per 100
_Incremental Households_Na_42_47_56
?5-9 Years of agc.
for public services overtime. Therefore, unless the performance in mobilisation of resources improve substantially, the local governments are unlikely to discharge their responsibilities in an adequate and efficient manner.
It is thus important to examine the present level and growth potential of the existing revenue sources under the local authorities.
This content downloaded from 198.91.32.137 on Tue, 25 Feb 2014 14:23:48 PMAll use subject to JSTOR Terms and Conditions
This is done, in this section, through the analysis of buoyancy coefficients.
Buoyancy of a tax system gives the total responsiveness of tax
yields to changes in national income. It is defined as a percentage change in total yield (or yields of individual taxes) associated with a given percentage change in GDP (or the relevant component of GDP). It shows
the growth that results from an automatic growth of the base caused by the increase in GDP and from discretionary tax changes.
The magnitude of the buoyancy co-efficient depends on a number
of factors which can be analysed by decomposing the buoyancy coefficient into tax-to-base and base-to-income components. The first
gives the responsiveness of tax yield to a change in tax base while the
latter encompasses the effect of changes in the tax base due to changes in
income.
The value of the tax-to-base buoyancy depends on tax rates and
the progressivity of the tax structure. If the rate structure is progressive or if there is an improvement in tax administration then the tax-to-base
buoyancy is likely to be high, thereby implying a higher overall
buoyancy. However, if high marginal tax rates induce higher evasion and
corruption and if tax rates are specific rather than ad valorem then revenues may not rise proportionately with the increase in tax base and
the buoyancy in this case would be less than unity.
The base-to-income buoyancy primarily depends upon the nature
of relationship between changes in income and the tax base. This
buoyancy can be assumed to be largely exogenous and beyond the
control of the collecting agency. In contrast to this, the magnitude of the
tax-to-base buoyancy can be influenced by policy action.
The buoyancy of the entire tax system at any particular time is
the weighted sum of the buoyancies of the individual taxes, with weights
corresponding to the revenue shares. If the share of buoyant taxes is
higher the overall tax system will be more buoyant.
This content downloaded from 198.91.32.137 on Tue, 25 Feb 2014 14:23:48 PMAll use subject to JSTOR Terms and Conditions
base. These have now fallen down to a mere 1.7 percent Since the
statutory rate is around 20 percent this indicates that there is massive
under-exploitation of the tax base. Moreover, the fall from 7 percent in
early 70's to just 1.7 percent in 1984-85 shows a tremendous
deterioration, of almost 75 percent, in the fiscal effort of the government in the collection of property tax in the city. This is a clear indication of the extent to which the tax base has been eroded due to lack of periodic re-assessment of rental values, creeping exemptions and possible evasion. If these tendencies are checked, property taxation could yield
more than four times as such as it currently does
Revenues from octroi, though have been steadily increasing
overtime, yet its incidence is less than one percent of the total
consumption expenditures. The main reason for this is that the octroi
rates (particularly in the case of land dues) are very low. Despite the 50
percent general escalation of rates in 1982, reflected in the jump in
revenues as percentage of the base from 0.62 percent to 0.94 percent in
1982-83, the nominal incidence of octroi is stilly very low.
Moreover, the effective incidence of octroi is also not very broadbased. Octroi tax is levied only on goods entering the boundaries of
Karachi for consumption. Goods manufactured indigenously are not
liable to the payment of octroi. Since part of the consumption
expenditure is on goods produced locally, they do not fall under the scope of octroi tax. Possible evasions (particularly in the case of land dues
collections) may also be a factor contributing to the low incidence of
octroi tax.
Total municipal taxes as a whole account for 1.2 percent of the
total GRP of Karachi in 1984-85. This increase in the tax revenue-to
GRP ratio from 1 percent in 1973-74 is consistent with the high
buoyancy of the municipal taxes highlighted earlier
SECTION VII
DIRECTIONS OF FISCAL REFORMS
Analysis undertaken in the previous sections has led to the
indentification of the basic areas of fiscal reforms. The objective of this
section is to spell out the various components of a policy package which
follows from the analysis of municipal finances in Karachi.
This content downloaded from 198.91.32.137 on Tue, 25 Feb 2014 14:23:48 PMAll use subject to JSTOR Terms and Conditions
provides a minimum target of extra tax revenue which are to be
mobilized by the municipal government. Of course, if it is proposed to
expand the provision of urban services then the fiscal effort would have
to be even greater.
Property Tax
It has been demonstrated that the nominal incidence of property taxes on rental incomes from immovable property has declined from
about 7 percent in 1972-73 to 1.7 percent in 1984-85. This sharp decline
is primarily the consequence of the absence of periodic revaluation of the
Gross Annual Rental Values (GARV) in line with inflation in price generally. As mentioned previously, properties are to be re-assessed once
every five years. Whereas, in Sind, the last comprehensive reassessment
of properties was in 1968-69, over seventeen y ars ago. During this
period the rent index in urban areas is estimated to have increased by over 400 percent. In other words, the GARVs currently captures only about one-fifth of market rental values on the average.
The case, therefore, for a more or less, immediate reassessment of
GARVs is very strong. The longer this process continues to be delayed on the ground of political expediency or otherwise the less will be the
degree of exploitation of the revenue potential of this tax.
Octroi Tax
In the past two decade, since the collection of octroi in Karachi, rates have been escalated twice. In 1973 there was a uniform escalation
of 10 percent on all commodities. The second time rates were increased
by 50 percent in 1982, again the escalation was a uniform across-the
board type. KMC seems to have adopted a policy of periodic, once and for
all, escalation in octroi tax rates. While this policy gives discrete jump in
revenues but does not ensure a steady growth in them. It is, therefore,
suggested that the increase in tax rate should be made by the amount of
average inflation of prices over shorter period of time, say, 3-5 years. The
indexation of tax rates in this way will avoid jumps in revenues and will
create a link between tax rates and the prices of various commodities.
Further, there is need to incorporate some changes in the relative
tax rates of different commodities. Since prices of some commodities
have increased much more compared to the others, uniform escalations
This content downloaded from 198.91.32.137 on Tue, 25 Feb 2014 14:23:48 PMAll use subject to JSTOR Terms and Conditions
result in a different rate of effective taxes on different commodities. For
example, the whole sale price index at the base of 1975-76, for wheat and gram is 164.39 and 444.49 respectively. With a 50 percent increase in the
tax rates, both the commodities are taxed at Rs.285 per ton. This clearly shows a decline in the effective tax rate on gram relative to wheat.
Differential enhancement in rates (higher taxation for goods consumed
by high income groups and vice versa) will remove this anamoly.
Water Rates
Water supply services in the city are largely subsidized. Presently,
only the recurring costs of water provision are currently recovered
through water rates. As such the immediate need for a higher level of
resource mobilisation through water rates is quite urgent, especially since there appears to be a greater ability to pay for such charges. The
switchover of water rates structure from NARV to plot size, which
tantamount^ to a switchover from advalorem to specific tax structure, has adversely affected the buoyancy of water rates. Following the
recommended reassessment of property values, this change will deprive the municipal authorities of a significant magnitude of revenues which
could potentially be generated. Moreover, since the present water rate
structure has lost the in-built ability to generate additional revenues
with an increase in property values, increase in revenues will require a
higher frequency of rate escalation than before. It is, therefore, recommended that property NARVs should again the made the basis for
water rate assessment. Linkage to NARVs will reduce the current
regressivity bias in water rates.
Further, metering of water sales, except for bulk consumers is
largely non-existent in Karachi. Since water rate is a user charge which
should vary with consumption, metering should be introduced in the case of big consumers, where it is feasible. At least in the first stage,
large commercial, industrial and residential users would have metered
water supply.
Moreover, to gradually reduce the element of subsidy to the water
sector and to make it more or less self-sustaining the policy of long mn
marginal cost pricing has to be adopted. This will require a substantial, but step-wise graduation of tariff rates in line with any perceived political constraints to large increase in the shortrun.
This content downloaded from 198.91.32.137 on Tue, 25 Feb 2014 14:23:48 PMAll use subject to JSTOR Terms and Conditions
No enhancement in conservancy rates has taken place during the
period of analysis. The rates continue to be 5 percent of the NARV. On the other hand, total expenditures on preventive health, for which
conservancy rates are charged have grown at annual compound rate of
approximately 19 percent. In 1984-85 only 22 percent of the current
expenditures on public health were recovered through conservancy
charges. There is a case, therefore, for an escalation in the conservancy rates.
7.2 New Sources of Revenues
A study of fiscal powers of the Metropolitan Corporation of
Karachi reveals that not all the taxes/rates/fees under its legal
jurisdiction are yet tapped by the municipal government in Karachi. It
has, by and large, relied on two taxes, octroi and property tax, which
together accounted for 64 percent of its recurring revenues in 1984-85.
Most of the services provided are financed by these sources. There is
need, therefore, for a broadening of the municipal tax base. A new
source of revenue could perhaps be the levy of cess/surcharge on taxes of
higher levels of government, which is potentially within municipal fiscal
powers. A prime candidate for this is a gasoline (used by automobiles)
surcharge on the excise duty levied by the federal government. It could
act as a proxy for a user charge on road transport and limit congestion on intra-urban highways. In addition, it would be progressive in
incidence given the highly concentrated pattern of automobile ownership in the city. Further, the tax base is large and even a small surcharge could fetch substantial revenues. If collected from oil distribution
companies on sales within the city, then it is recommended that
revenues from the surchage should go to a special development fund
created for financing the Karachi Special Development Programme (KSDP). This would ensure tax payers that revenues collected would be
used only for developing the services network, including that of roads, in
the city.
Also, the concept of self-sustained provision of municipal services
is not yet fully developed. By and large, only three services namely, water supply, fire brigade and sanitation and solid waste management have a direct mode of recovery. In the face of growing population leading
This content downloaded from 198.91.32.137 on Tue, 25 Feb 2014 14:23:48 PMAll use subject to JSTOR Terms and Conditions
to an increased demand of municipal services it is important to develop (to the extent feasible) the concept of direct recovery of cost A possible candidate for this is the sewerage tax. Presently, sewerage and drainage services, provided by the K.W. & S.B., are fully subsidised in Karachi. In
1984-85, expenditures on these services were of a magnitude of Rs. 135
million growing at an annual compound rate of approximately 16
percent. It is recommended that a sewerage tax be imposed, the
provision for which already exists in the ordinance. The tax can be
administered by K.W. & S.B. along with the conservancy rates.
7.3 Mobilisation through Revenue-Sharing Transfers
The case for expanded revenue sharing can be made on two
grounds. First, given the present functional allocations between various
levels of governments, the provincial and local governments have common functions to perform. The classic example of this is road maintenance. The municipal government is responsible for the maintenance of intra-city roads, while the maintenance of inter-city road network rests with the provincial government. A case, therefore, exists for the sharing of motor vehicle tax, levied by the provincial government for the specific purpose of road maintenance. The revenue shares for the two government in this case can be determined in proportion of the relative expenditures incurred by the two governments.
Second, given the present allocation of fiscal powers between different levels of government, the provincial and the local governments have common taxes under their jurisdiction. Examples of this are the tax on professions, trade and callings and entertainment tax. These taxes are presently pre-empted by the provincial government in the
metropolitan area in Karachi. However, in the cantonment areas, the local authority collects them. In view of the already limited fiscal powers of the local government and to bring harmony between the cantonments and the metropolitan areas of Karachi, there is a case for the handing over or sharing of revenues from such taxes.
The author would like to acknowledge the comments of Hafiz A Pasha and the inputs of Zafar H. Ismail.and Kiiser Bengali. Any defects that remain are, however, the sole responsibility of the author.
This content downloaded from 198.91.32.137 on Tue, 25 Feb 2014 14:23:48 PMAll use subject to JSTOR Terms and Conditions
Asian Development Bank Report, "Urban Sector Profile" Manila, Phillipines, 1987.
Ahmed, Nuzhat, "Biases in Tax Assessment of Residential Properties in
Karachi", Pakistan Journal of Applied Economics, VoLIV, No.2, Winter 1985
Bengali, Kaiser, "Macro Economics Analysis of Karachi", Research Report, Applied Economics Research Centre (AERO, University of Karachi
Bengali, Kaiser, Aisha Ghaus and Hafiz A Pasha, "Issue in Municipal Finances and Management in Developing Countries: A Case Study of the City of Karachi in Pakistan". Rcginal Development Dialogue, Vol. 10 No. 1,
Spring 1989.
Ghaus, Aisha, "The Fiscal Base of Karachi" Research Report, Applied Economics Research Centre, University of Karachi, 1987.
Government of Sind, The Sind Local Government Ordinance 1979.
Government of Sind, Sind Taxation Commission Report, 1982
Government of Sind, ZMC Ordinance, 1987.
Pasha, H.A. and Aisha Ghaus, "Analysis of Provincial Finances in Pakistan", Research Report No. 62, AERC, University of Karachi, 1986.
Pasha, H.A. Kaiser Bengali and others, "City on the Brink: An Analysis of
Municipal Finances in Karachi", Research Report No. 2, AERC,
University of Karachi, 1977.
Pasha, H.A., "Is the Local Tax Base Adequate? A Case Study of the KMC", Discussion paper No. 25, AERC, University of Karachi, April 1978.
Pasha, H.A. and Kaiser Bengali, "Impact of Fiscal Incentives on Industrialisation in Backward Areas: A Case Study of Hub Chowki in
Baluchistan", Pakistan Journal of Applied Economics, Vol. IV, No. 1. Summer 1985.
Pasha, H.A., Zafar H. Ismail, Nuzhat Ahmad and S.Ashraf Wasti, "Fiscal Incentives for Regional Industrial Development", Research Report No.
64, AERC, University of Karachi, March, 1986.
Pakistan Environmental Planning and Architectural Consultants (PEPAC) National Human Settlement Policy Study, 1987.
PEPAC, Management of Cities Policy Study, 1986.
This content downloaded from 198.91.32.137 on Tue, 25 Feb 2014 14:23:48 PMAll use subject to JSTOR Terms and Conditions