47
MUNICIPAL POLICE EMPLOYEES’ RETIREMENT SYSTEM ACTUARIAL VALUATION AS OF JUNE 30, 2014
MUNICIPAL POLICE EMPLOYEES’
RETIREMENT SYSTEM
ACTUARIAL VALUATION AS OF
JUNE 30, 2014
G. S. CURRAN & COMPANY, LTD. Actuarial Services
10555 N. Glenstone Place Baton Rouge, Louisiana 70810 (225)769-4825
Gary S. Curran, FCA, MAAA, ASA, EA Gregory M. Curran, FCA, MAAA, ASA, EA Consulting Actuary Consulting Actuary
November 18, 2014
Board of Trustees
Municipal Police Employees’ Retirement System
7722 Office Park Boulevard, Suite 200
Baton Rouge, Louisiana 70809
Ladies and Gentlemen:
We are pleased to present our report on the actuarial valuation of the Municipal Police Employees’
Retirement System for the fiscal year ending June 30, 2014. Our report is based on the actuarial
assumptions specified and relies on the data supplied by the system’s administrators and accountants.
This report was prepared at the request of the Board of Trustees of Municipal Police Employees’
Retirement System of the State of Louisiana. The primary purposes of the report are to determine the
actuarially required contribution for the retirement system for the fiscal year ending June 30, 2015 and
to recommend the net direct employer contribution rate for fiscal 2016. This report was prepared
exclusively for Municipal Police Employees’ Retirement System for a specific limited purpose. It is not
for the use or benefit of any third party for any purpose.
In our opinion, all of the assumptions on which this valuation is based are reasonable individually and in
the aggregate. Both economic and demographic assumptions are based on our expectations for future
experience for the fund. This report has been prepared in accordance with generally accepted actuarial
principles and practices, and to the best of our knowledge and belief, fairly reflects the actuarial present
values and costs stated herein. The undersigned actuaries are members of the American Academy of
Actuaries and have met the qualification standards for the American Academy of Actuaries to render the
actuarial opinions incorporated in this report, and are available to provide further information or answer
any questions with respect to this valuation.
Sincerely,

TABLE OF CONTENTS
SUBJECT PAGE
SUMMARY OF VALUATION RESULTS .................................................................................................... 1
COMMENTS ON DATA ................................................................................................................................ 2
COMMENTS ON ACTUARIAL METHODS AND ASSUMPTIONS ......................................................... 3
CHANGES IN PLAN PROVISIONS ............................................................................................................. 4
ASSET EXPERIENCE .................................................................................................................................... 4
DEMOGRAPHICS AND LIABILITY EXPERIENCE .................................................................................. 5
FUNDING ANALYSIS AND RECOMMENDATIONS ............................................................................... 6
COST OF LIVING INCREASES .................................................................................................................... 8
GRAPHS ...................................................................................................................................... 10
EXHIBIT I – Analysis of Actuarially Required Contributions ..................................................................... 14
EXHIBIT II – Present Value of Future Benefits ........................................................................................... 15
EXHIBIT III – SCHEDULE A – Market Value of Assets ............................................................................ 16
EXHIBIT III – SCHEDULE B – Actuarial Value of Assets ......................................................................... 17
EXHIBIT IV – Present Value of Future Contributions ................................................................................. 18
EXHIBIT V - SCHEDULE A – Actuarial Accrued Liabilities ..................................................................... 18
EXHIBIT V - SCHEDULE B – Change in Unfunded Actuarial Accrued Liability ..................................... 18
EXHIBIT V - SCHEDULE C – Amortization of Unfunded Actuarial Accrued Liability ............................ 19
EXHIBIT VI – Analysis of Increase in Assets .............................................................................................. 20
EXHIBIT VII – Census Data ......................................................................................................................... 21
EXHIBIT VIII – Year to Year Comparison .................................................................................................. 29
SUMMARY OF PRINCIPAL PLAN PROVISIONS ................................................................................... 31
ACTUARIAL ASSUMPTIONS .................................................................................................................... 37
GLOSSARY ...................................................................................................................................... 42
G. S. Curran & Company, Ltd. -1-
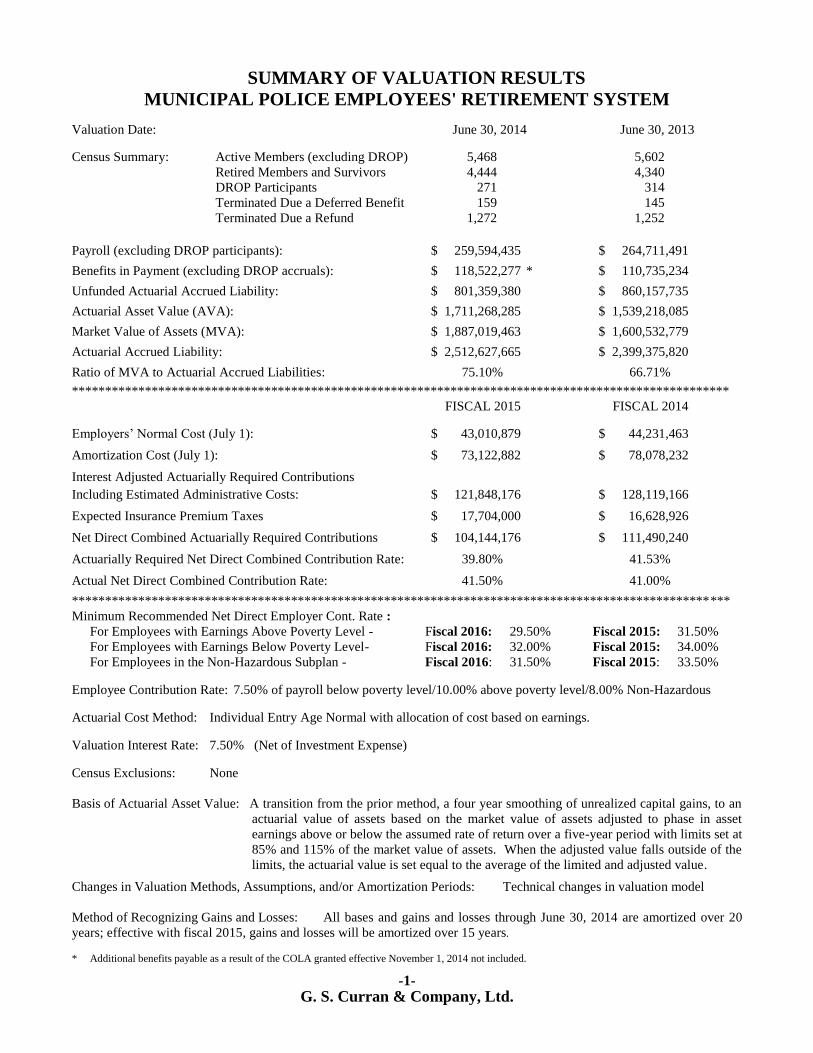
SUMMARY OF VALUATION RESULTS
MUNICIPAL POLICE EMPLOYEES' RETIREMENT SYSTEM
Valuation Date: June 30, 2014 June 30, 2013
Census Summary: Active Members (excluding DROP) 5,468 5,602
Retired Members and Survivors 4,444 4,340
DROP Participants 271 314
Terminated Due a Deferred Benefit 159 145
Terminated Due a Refund 1,272 1,252
Payroll (excluding DROP participants): $ 259,594,435 $ 264,711,491
Benefits in Payment (excluding DROP accruals): $ 118,522,277 * $ 110,735,234
Unfunded Actuarial Accrued Liability: $ 801,359,380 $ 860,157,735
Actuarial Asset Value (AVA): $ 1,711,268,285 $ 1,539,218,085
Market Value of Assets (MVA): $ 1,887,019,463 $ 1,600,532,779
Actuarial Accrued Liability: $ 2,512,627,665 $ 2,399,375,820
Ratio of MVA to Actuarial Accrued Liabilities: 75.10% 66.71%
***************************************************************************************************
FISCAL 2015 FISCAL 2014
Employers’ Normal Cost (July 1): $ 43,010,879 $ 44,231,463
Amortization Cost (July 1): $ 73,122,882 $ 78,078,232
Interest Adjusted Actuarially Required Contributions
Including Estimated Administrative Costs: $ 121,848,176 $ 128,119,166
Expected Insurance Premium Taxes $ 17,704,000 $ 16,628,926
Net Direct Combined Actuarially Required Contributions $ 104,144,176 $ 111,490,240
Actuarially Required Net Direct Combined Contribution Rate: 39.80% 41.53%
Actual Net Direct Combined Contribution Rate: 41.50% 41.00%
***************************************************************************************************
Minimum Recommended Net Direct Employer Cont. Rate :
For Employees with Earnings Above Poverty Level - Fiscal 2016: 29.50% Fiscal 2015: 31.50%
For Employees with Earnings Below Poverty Level- Fiscal 2016: 32.00% Fiscal 2015: 34.00%
For Employees in the Non-Hazardous Subplan - Fiscal 2016: 31.50% Fiscal 2015: 33.50%
Employee Contribution Rate: 7.50% of payroll below poverty level/10.00% above poverty level/8.00% Non-Hazardous
Actuarial Cost Method: Individual Entry Age Normal with allocation of cost based on earnings.
Valuation Interest Rate: 7.50% (Net of Investment Expense)
Census Exclusions: None
Basis of Actuarial Asset Value: A transition from the prior method, a four year smoothing of unrealized capital gains, to an
actuarial value of assets based on the market value of assets adjusted to phase in asset
earnings above or below the assumed rate of return over a five-year period with limits set at
85% and 115% of the market value of assets. When the adjusted value falls outside of the
limits, the actuarial value is set equal to the average of the limited and adjusted value. Changes in Valuation Methods, Assumptions, and/or Amortization Periods: Technical changes in valuation model
Method of Recognizing Gains and Losses: All bases and gains and losses through June 30, 2014 are amortized over 20
years; effective with fiscal 2015, gains and losses will be amortized over 15 years.
* Additional benefits payable as a result of the COLA granted effective November 1, 2014 not included.

-2-
G. S. Curran & Company, Ltd.
COMMENTS ON DATA
For the valuation, the administrator of the system furnished a census on CD derived from the system’s
master data processing file indicating each active covered employee’s sex, date of birth, service credit,
annual salary, and accumulated contributions. Information on retirees detailing dates of birth of retirees
and beneficiaries, sex, as well as option categories and benefit amounts, was provided in like manner. In
addition, data was supplied on former employees who are vested or who have contributions remaining
on deposit. As illustrated in Exhibit IX, there are 5,468 active contributing members in the system of
whom 2,516 have vested retirement benefits; in addition, there are 271 participants in the Deferred
Retirement Option Plan (DROP); 4,444 former members or their beneficiaries are receiving retirement
benefits. An additional 1,431 terminated members have contributions remaining on deposit with the
system; of this number 159 have vested rights for future retirement benefits. All individuals submitted
were included in the valuation. Cost of living benefits approved by the Board of Trustees prior to the
completion of this valuation were not included in the data used in this valuation. The retiree liabilities
were adjusted to include the expected present value of the cost of living adjustment.
Census data submitted to our office is tested for errors. Several types of census data errors are possible;
to ensure that the valuation results are as accurate as possible, a significant effort is made to identify and
correct these errors. In order to minimize coverage errors (i.e., missing or duplicated individual records)
the records are checked for duplicates, and a comparison of the current year's records to those submitted
in prior years is made. Changes in status, new records, and previous records that have no corresponding
current record are identified. This portion of the review indicates the annual flow of members from one
status to another and is used to check some of the actuarial assumptions such as retirement rates, rates of
withdrawal, and mortality. In addition, the census is checked for reasonableness in several areas such as
age, service, salary, and current benefits. The records identified by this review as questionable are
checked against data from prior valuations; those not recently verified are included in a detailed list of
items sent to the system's administrative staff for verification and/or correction. Once the identified data
has been researched and verified or corrected, it is returned to us for use in the valuation. Occasionally
some requested information is either unavailable or impractical to obtain. In such cases, values may be
assigned to missing data. The assigned values are based on information from similar records or based
on information implied from other data in the record. For this valuation, the number of such records
with imputed data is de minimis.
Issues with salary and service were discovered during the system’s auditor’s review of census data, due
in part to leave without pay not properly reported to the retirement system by the City of New Orleans.
Such information is being reviewed with the employer and data records are being adjusted by the
system’s staff. No change was made to the fiscal 2014 actuarial valuation data related to this issue since
it was determined that these issues would not have a material impact on the valuation results. Staff
expects the issue to be resolved by the submission of the 2015 actuarial valuation data.
In addition to the statistical information provided on the system’s participants, the system’s
administrator furnished general information related to other aspects of the system’s expenses, benefits
and funding. Valuation asset values as well as income and expenses for the fiscal year were based on
information furnished by the system’s auditor, the firm of Duplantier, Hrapmann, Hogan & Maher,
Certified Public Accountants. As indicated in the system’s financial statements, the net market value of
system’s assets was $1,887,019,463 as of June 30, 2014. Net investment income for fiscal 2014
measured on a market value was $296,633,966. Contributions to the system for the fiscal year totaled
$126,555,754; benefits and expenses amounted to $136,703,036.

-3-
G. S. Curran & Company, Ltd.
Notwithstanding our efforts to review both census and financial data for apparent errors, we must rely
upon the system’s administrative staff and accountants to provide accurate information. Our review of
submitted information is limited to validation of reasonableness and consistency. Verification of
submitted data to source information is beyond the scope of our efforts.
COMMENTS ON ACTUARIAL METHODS AND ASSUMPTIONS
This valuation is based on the Entry Age Normal actuarial cost method. Prior to fiscal 2002, experience
gains and losses as well as contribution gains and losses were amortized over fifteen years with level
amortization payments. Act 1079 of 2003 explicitly changed the amortization period for experience
gains and losses, changes in assumptions, changes in methods, cost of living increases, and changes in
plan benefit provisions to thirty years with level amortization payments. Act 402 of 2014 was
introduced to improve the long-term health of the system and to reduce the likelihood for
intergenerational cost shifting due to long amortization periods. The act changed the amortization
period for all the existing outstanding unfunded liability bases from various periods ranging from one to
thirty years to twenty years. The act also sets the period to amortize all future actuarial gains and losses
as well as changes in assumptions and benefits at fifteen years.
Since it was not practical to perform a detailed analysis of plan experience, the assumptions utilized for
the fiscal 2011 report, with the exception of active and healthy annuitant mortality, were designed to
match, to the extent possible, those used by the prior actuary for the fiscal 2010 valuation. Adjustments
to some non-mortality decrements were necessary due to differences in software design. For the 2012
valuation, technical changes were made to several assumptions. First, the salary increase assumption
was simplified and smoothed to reduce fluctuations at several points on the scale. Disability rates were
also rescaled to conform to a standard table. The DROP entry and retirement rates were recalibrated to
more closely reflect recent plan experience. For the fiscal 2013 valuation, DROP entry and retirement
rates were extended to lower eligible ages. Also, changes were made to several variables related to
family statistics and several technical program improvements. In addition, a technical change in the
software model was made in fiscal 2014. The net effect of this change was a decrease in the actuarial
accrued liability of $225,724 with a corresponding interest adjusted amortization credit of $21,355, or
0.01% of projected payroll
The method for determining the actuarial value of assets was changed with respect to the fiscal 2011
valuation. The prior valuation utilized a four year phase-in of all unrealized capital gains and losses at
25% per year. With the fiscal 2011 valuation, we began to transition to a five year phase-in of all
market earnings above or below the valuation interest rate, subject to a corridor with a maximum of
115% of the market value of assets and a minimum of 85% of the market value of assets. In the event
that the preliminary value of the actuarial value of assets falls outside of the corridor, the final value will
be determined by averaging the preliminary value with the nearest corridor limit. In order to transition
to the new method for calculating the actuarial value of assets, the deferral of capital gains for all years
before fiscal 2011 was based upon the prior method. The deferral of all gains and losses for fiscal 2011
and later was based on the new method.

-4-
G. S. Curran & Company, Ltd.
In determining the valuation interest rate, consideration was given to several factors. First, consensus
estimates of rates of return, standard deviations, and correlation coefficients for asset classes derived
from various asset consulting firms were developed. These factors were used to derive forward
estimates of the Fund’s portfolio earnings rate. Consideration was also given to the 2014 report of New
England Pension Consultants on future expected rates of return for the current portfolio asset allocation.
This report projected future long-term arithmetic average portfolio nominal returns to be 8.0%. Given
recognition to the expected variance in returns it was determined the 7.5% rate of return assumption
utilized for the fiscal 2013 valuation was still a reasonable estimate of future returns for the system. The
salary increase rate for the report was based on forward estimates of future increases in pay resulting
from three sources; inflation, merit, and productivity. An inflation rate of 3.00% was implicit in both
the assumed rate of return and rate of salary increases.
Although the board of trustees has authority to grant ad hoc Cost of Living Increases (COLAs) under
limited circumstances, these COLAs have not been shown to have a historical pattern, the amounts of
the COLAs have not been relative to a defined cost-of-living or inflation index, and there is no evidence
to conclude that COLAs will be granted on a predictable basis in the future. Therefore, for purposes of
determining the present value of benefits, these COLAs were deemed not to be substantively automatic
and the present value of benefits excludes COLAs not previously granted by the board of trustees.
The current year actuarial assumptions utilized for the report are outlined on pages thirty-seven through
forty-one. With the exception of a modification in the software model of plan design, all assumptions
were the same as those used in the fiscal 2013 valuation. All assumptions used are based on estimates of
future long-term experience for the fund. All calculations, recommendations, and conclusions are based
on the assumptions specified. To the extent that prospective experience differs from that assumed,
adjustments will be required to contribution levels. Such differences will be revealed in future actuarial
valuations.
CHANGES IN PLAN PROVISIONS
The following changes in plan provisions were enacted during the 2014 Regular Session of the
Louisiana Legislature:
Act 402 changes the amortization period for all the existing outstanding unfunded liability bases from
various periods ranging from one to thirty years to twenty years. The act also sets the period to amortize
all future actuarial gains and losses as well as changes in assumptions and benefits at fifteen years.
ASSET EXPERIENCE
The actuarial and market rates of return for the past ten years are given below. These investment rates
of return were determined by assuming a uniform distribution of income and expense throughout the
fiscal year.
Market Value Actuarial Value
2005 9.3% 9.4%
2006 8.7% 13.2%
2007 16.5% 13.6%
2008 - 7.6% 6.4%
-5-
G. S. Curran & Company, Ltd.
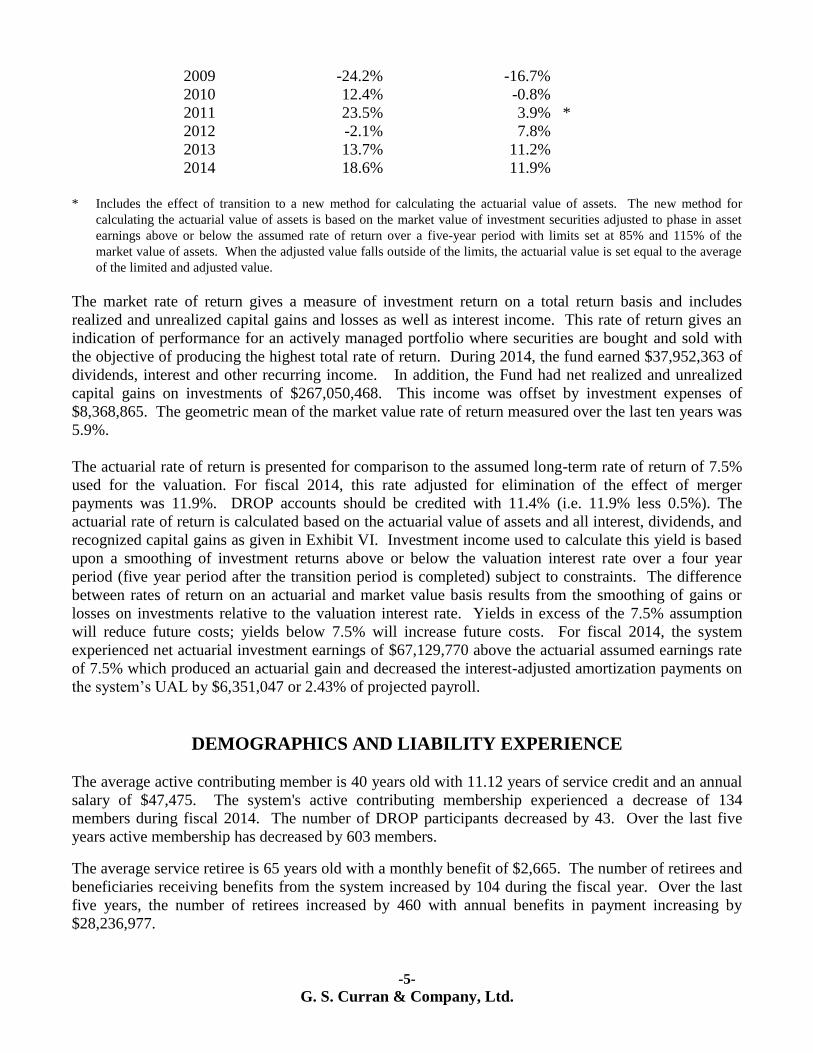
2009 -24.2% -16.7%
2010 12.4% -0.8%
2011 23.5% 3.9% *
2012 -2.1% 7.8%
2013 13.7% 11.2%
2014 18.6% 11.9%
* Includes the effect of transition to a new method for calculating the actuarial value of assets. The new method for
calculating the actuarial value of assets is based on the market value of investment securities adjusted to phase in asset
earnings above or below the assumed rate of return over a five-year period with limits set at 85% and 115% of the
market value of assets. When the adjusted value falls outside of the limits, the actuarial value is set equal to the average
of the limited and adjusted value.
The market rate of return gives a measure of investment return on a total return basis and includes
realized and unrealized capital gains and losses as well as interest income. This rate of return gives an
indication of performance for an actively managed portfolio where securities are bought and sold with
the objective of producing the highest total rate of return. During 2014, the fund earned $37,952,363 of
dividends, interest and other recurring income. In addition, the Fund had net realized and unrealized
capital gains on investments of $267,050,468. This income was offset by investment expenses of
$8,368,865. The geometric mean of the market value rate of return measured over the last ten years was
5.9%.
The actuarial rate of return is presented for comparison to the assumed long-term rate of return of 7.5%
used for the valuation. For fiscal 2014, this rate adjusted for elimination of the effect of merger
payments was 11.9%. DROP accounts should be credited with 11.4% (i.e. 11.9% less 0.5%). The
actuarial rate of return is calculated based on the actuarial value of assets and all interest, dividends, and
recognized capital gains as given in Exhibit VI. Investment income used to calculate this yield is based
upon a smoothing of investment returns above or below the valuation interest rate over a four year
period (five year period after the transition period is completed) subject to constraints. The difference
between rates of return on an actuarial and market value basis results from the smoothing of gains or
losses on investments relative to the valuation interest rate. Yields in excess of the 7.5% assumption
will reduce future costs; yields below 7.5% will increase future costs. For fiscal 2014, the system
experienced net actuarial investment earnings of $67,129,770 above the actuarial assumed earnings rate
of 7.5% which produced an actuarial gain and decreased the interest-adjusted amortization payments on
the system’s UAL by $6,351,047 or 2.43% of projected payroll.
DEMOGRAPHICS AND LIABILITY EXPERIENCE
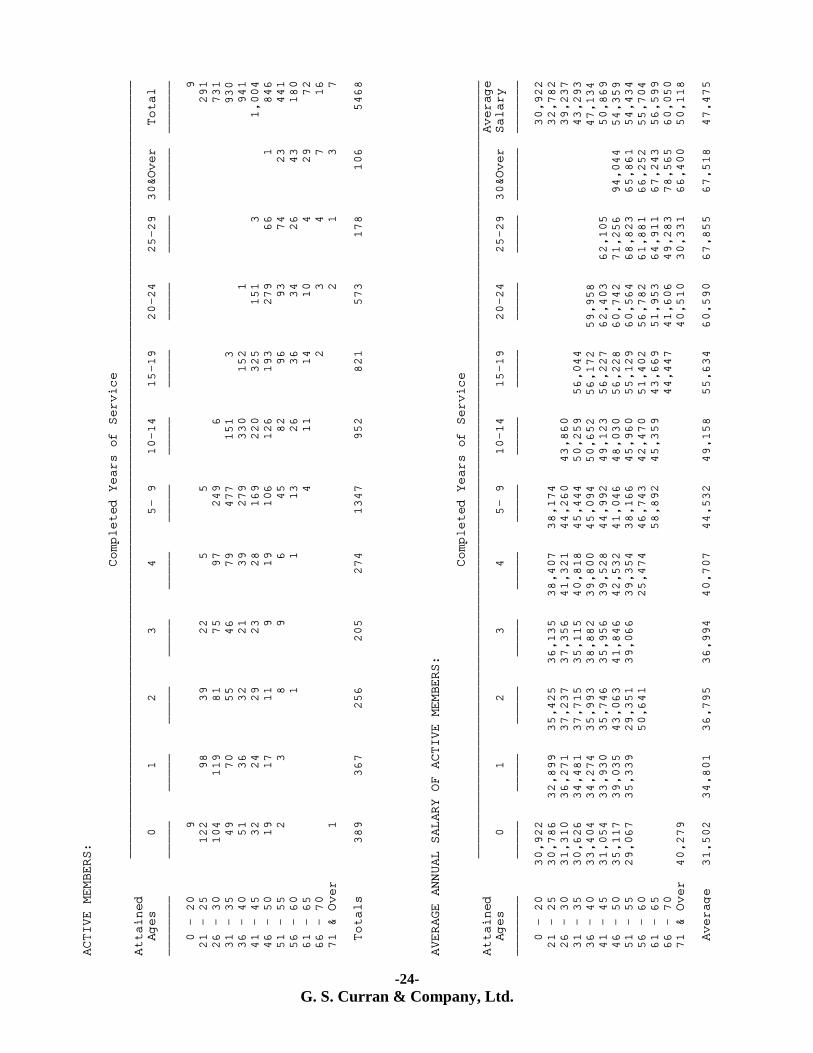
The average active contributing member is 40 years old with 11.12 years of service credit and an annual
salary of $47,475. The system's active contributing membership experienced a decrease of 134
members during fiscal 2014. The number of DROP participants decreased by 43. Over the last five
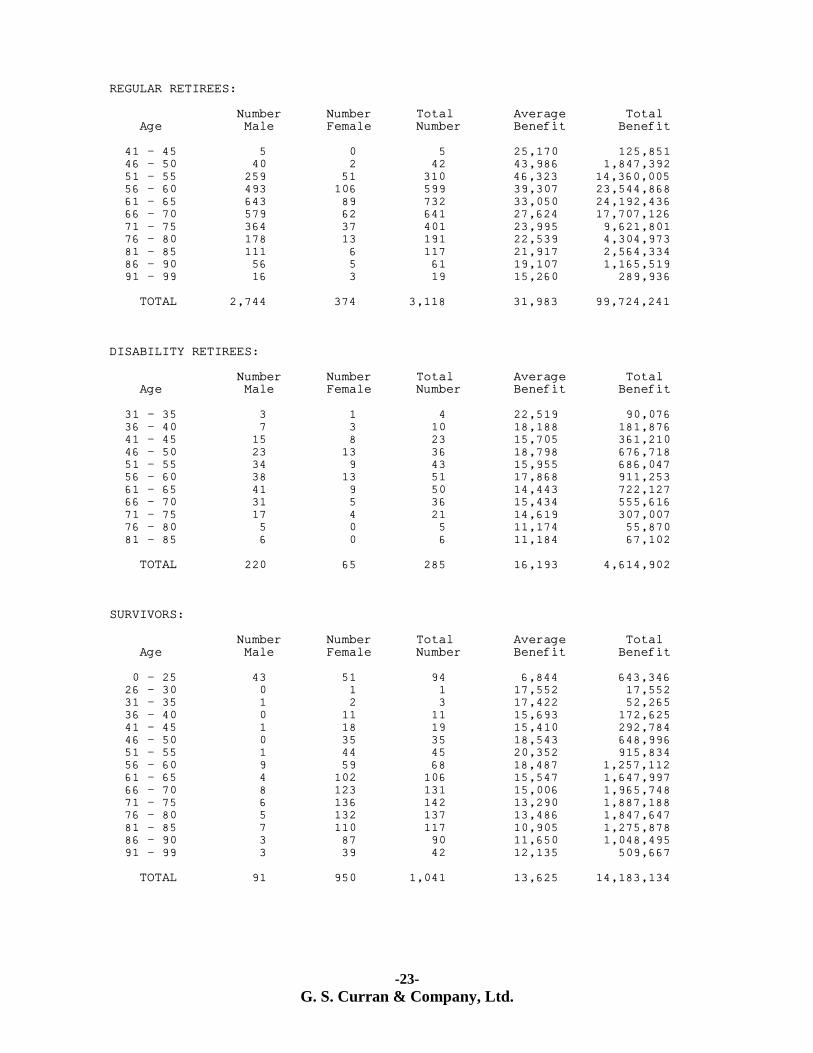
years active membership has decreased by 603 members. The average service retiree is 65 years old with a monthly benefit of $2,665. The number of retirees and
beneficiaries receiving benefits from the system increased by 104 during the fiscal year. Over the last
five years, the number of retirees increased by 460 with annual benefits in payment increasing by
$28,236,977.

-6-
G. S. Curran & Company, Ltd.
Liability experience for the year was favorable. The number of retirements, disabilities, and DROP
entries was below projected levels. Salary increases were also below expected levels. Withdrawals and
deaths were above projected levels. These factors tend to reduce costs. Net plan liability experience
gains totaled $14,670,717. The interest adjusted amortization credit on this gain was $1,387,975, or
0.53% of projected payroll.
FUNDING ANALYSIS AND RECOMMENDATIONS
Actuarial funding of a retirement system is a process whereby funds are accumulated over the working
lifetimes of employees in such a manner as to have sufficient assets available at retirement to pay for the
lifetime benefits accrued by each member of the system. The required contributions are determined by
an actuarial valuation based on rates of mortality, termination, disability, and retirement, as well as
investment return and other statistical measures specific to the particular group. Each year a
determination is made of two cost components, and the actuarially required contributions are based on
the sum of these two components plus administrative expenses. These two components are the normal
cost and the amortization payments on the unfunded actuarial accrued liability. The normal cost refers
to the annual cost for active members allocated to each year by the particular cost method utilized. The
term unfunded accrued liability (UAL) refers to the excess of the present value of plan benefits over the
sum of current assets and future normal costs. Each year the UAL grows with interest and is reduced by
payments. In addition it may be increased or diminished by plan experience, changes in assumptions, or
changes in benefits including COLA’s. Contributions in excess of or less than the actuarially required
amount can also decrease or increase the UAL balance. New entrants to the system can also increase or
lower costs as a percent of payroll depending upon their demographic distribution. Finally, payroll
growth affects plan costs since payments on the system’s unfunded liability are on a fixed, level
schedule. If payroll increases, these costs are reduced as a percentage of payroll.
In order to establish the actuarially required contribution in any given year, it is necessary to define the
assumptions, funding method, and method of amortizing the UAL. Thus, the determination of what
contribution is actuarially required depends upon the funding method and amortization schedules
employed. Regardless of the method selected, the ultimate cost of providing benefits is dependent upon
the benefits, expenses, and investment earnings. Only to the extent that some methods accumulate
assets more rapidly and thus produce greater investment earnings does the funding method affect the
ultimate cost.
An explanation of the change in costs related to asset and liability gains and losses as well as changes in
demographics and assumptions is given in prior sections of the report. In addition to these components,
variances in contribution levels and payroll also affect costs. For fiscal 2014 contributions totaled
$3,720,140 less than required; the interest-adjusted amortization payment on the contribution shortfall
for fiscal 2015 is $351,957, or 0.13% of projected payroll.
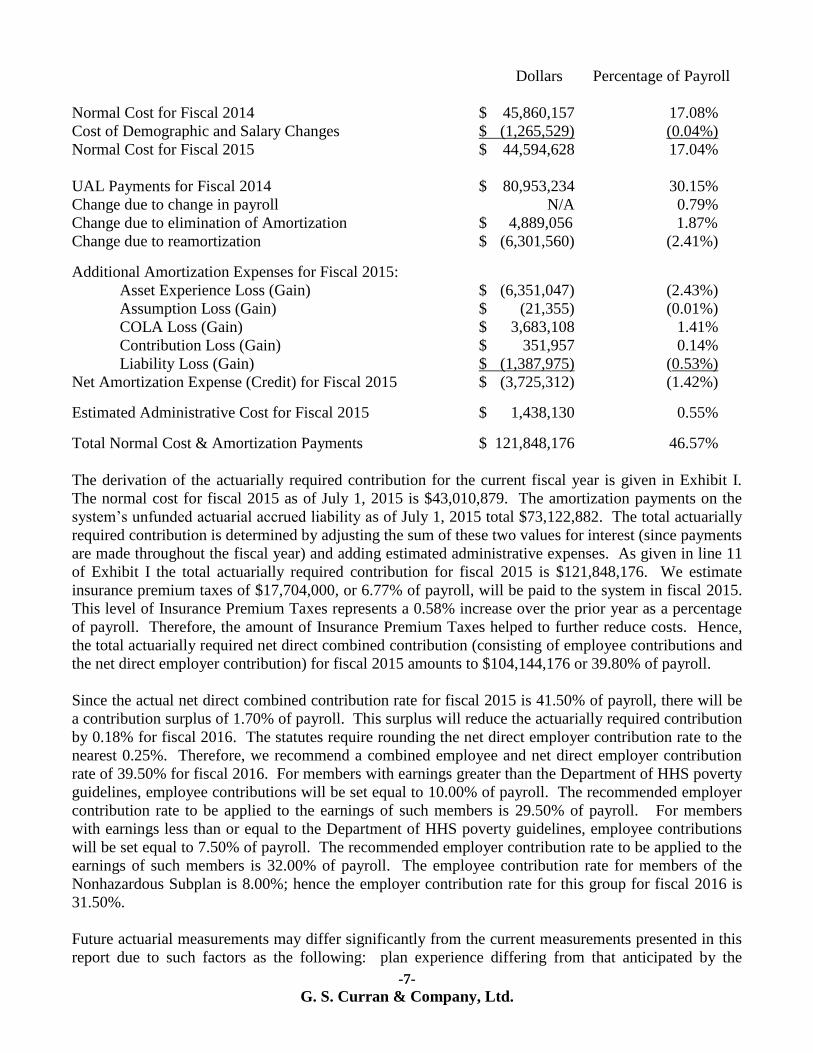
A reconciliation of the change in costs is given below. Values listed in dollars are interest adjusted for
payment throughout the fiscal year. Percentages are based on the projected payroll for fiscal 2015
except for those items labeled fiscal 2014.
-7-
G. S. Curran & Company, Ltd.
Dollars Percentage of Payroll
Normal Cost for Fiscal 2014 $ 45,860,157 17.08%
Cost of Demographic and Salary Changes $ (1,265,529) (0.04%)
Normal Cost for Fiscal 2015 $ 44,594,628 17.04%
UAL Payments for Fiscal 2014 $ 80,953,234 30.15%
Change due to change in payroll N/A 0.79%
Change due to elimination of Amortization $ 4,889,056 1.87%
Change due to reamortization $ (6,301,560) (2.41%)
Additional Amortization Expenses for Fiscal 2015:
Asset Experience Loss (Gain) $ (6,351,047) (2.43%)
Assumption Loss (Gain) $ (21,355) (0.01%)
COLA Loss (Gain) $ 3,683,108 1.41%
Contribution Loss (Gain) $ 351,957 0.14%
Liability Loss (Gain) $ (1,387,975) (0.53%)
Net Amortization Expense (Credit) for Fiscal 2015 $ (3,725,312) (1.42%)
Estimated Administrative Cost for Fiscal 2015 $ 1,438,130 0.55%
Total Normal Cost & Amortization Payments $ 121,848,176 46.57%
The derivation of the actuarially required contribution for the current fiscal year is given in Exhibit I.
The normal cost for fiscal 2015 as of July 1, 2015 is $43,010,879. The amortization payments on the
system’s unfunded actuarial accrued liability as of July 1, 2015 total $73,122,882. The total actuarially
required contribution is determined by adjusting the sum of these two values for interest (since payments
are made throughout the fiscal year) and adding estimated administrative expenses. As given in line 11
of Exhibit I the total actuarially required contribution for fiscal 2015 is $121,848,176. We estimate
insurance premium taxes of $17,704,000, or 6.77% of payroll, will be paid to the system in fiscal 2015.
This level of Insurance Premium Taxes represents a 0.58% increase over the prior year as a percentage
of payroll. Therefore, the amount of Insurance Premium Taxes helped to further reduce costs. Hence,
the total actuarially required net direct combined contribution (consisting of employee contributions and
the net direct employer contribution) for fiscal 2015 amounts to $104,144,176 or 39.80% of payroll.
Since the actual net direct combined contribution rate for fiscal 2015 is 41.50% of payroll, there will be
a contribution surplus of 1.70% of payroll. This surplus will reduce the actuarially required contribution
by 0.18% for fiscal 2016. The statutes require rounding the net direct employer contribution rate to the
nearest 0.25%. Therefore, we recommend a combined employee and net direct employer contribution
rate of 39.50% for fiscal 2016. For members with earnings greater than the Department of HHS poverty
guidelines, employee contributions will be set equal to 10.00% of payroll. The recommended employer
contribution rate to be applied to the earnings of such members is 29.50% of payroll. For members
with earnings less than or equal to the Department of HHS poverty guidelines, employee contributions
will be set equal to 7.50% of payroll. The recommended employer contribution rate to be applied to the
earnings of such members is 32.00% of payroll. The employee contribution rate for members of the
Nonhazardous Subplan is 8.00%; hence the employer contribution rate for this group for fiscal 2016 is
31.50%.
Future actuarial measurements may differ significantly from the current measurements presented in this
report due to such factors as the following: plan experience differing from that anticipated by the

-8-
G. S. Curran & Company, Ltd.
economic or demographic assumptions, changes in economic or demographic assumptions, completion
of amortization payments or credit schedules, and changes in plan provisions or applicable law.
Analysis of the effect of all these factors is beyond the scope of this report. We have, however,
calculated the sensitivity of the plan’s costs to a change in two factors. First, we have determined that
based on current assets, demographics, and amortization periods for each percentage under (over) the
assumed rate of return on the actuarial value of assets, there will be a corresponding increase (reduction)
in the actuarially required contribution as a percentage of projected payroll of 0.62% for the fund. We
have also determined that a 1% reduction in the valuation interest rate for the Fund would increase the
actuarially required contribution rate for fiscal 2015 by 12.20% of payroll.
In addition to calculating the actuarially required contribution to the fund, we have also calculated the
ratio of the system’s assets to liabilities. When the market value of assets is divided by the entry age
normal accrued liability for the fund the result is 75.10% as of June 30, 2014. This value in isolation
does not give a measure of the ability of the fund to pay benefits in the future or indicate that future
contributions are likely to be greater or less than current contributions. In addition, the ratio cannot be
used to compare the relative strength of different retirement systems. However, the trend of this ratio
over time can give some insight into the financial health of the plan. Even in this regard caution is
warranted since market fluctuations in asset values and changes in plan assumptions can distort the
underlying trends in this value.
COST OF LIVING INCREASES
During fiscal 2014, the actual cost of living (as measured by the US Department of Labor CPI-U)
increased by 2.07%. Cost of living provisions for the system are detailed in R.S. 11:2225(A)(7)(b), R.S.
11:246, and R.S. 11:241. R.S. 11:2225(A)(7)(b) allows the board to use interest earnings in excess of
the normal requirements to grant annual cost of living increases of 3% of each retiree’s original or
current benefit. R.S. 11:246 provides cost of living increases to retirees and beneficiaries over the age
of 65 equal to 2% of the benefit in payment on October 1, 1977, or the date the benefit was originally
received if retirement commenced after that date. R.S. 11:241 provides that cost of living benefits shall
be in the form (unless the board otherwise specifies) of $X(A+B) where X is at most $1 and "A"
represents the number of years of credited service accrued at retirement or at death of the member or
retiree and "B" is equal to the number of years since retirement or since death of the member or retiree
to June 30th
of the initial year of such increase. The provisions of this subpart do not repeal provisions
relative to cost of living adjustments contained within the individual laws governing systems; however,
they are to be controlling in cases of conflict.
All of the above provisions require that the system’s investments produce sufficient excess interest
earnings to fund the increases. R.S. 11:243 sets forth the funding criteria necessary in order to grant cost
of living adjustments to regular retirees and beneficiaries (who are neither the surviving spouse nor
children of the retiree.) The criteria for the fund to qualify as eligible to grant any such increase is as
follows: a funded ratio of at least 70% if the system has not granted a benefit increase to retirees,
survivors, or beneficiaries in any of the three most recent fiscal years; a funded ratio of at least 80% if
the system has not granted such an increase in any of the two most recent fiscal years; or a funded ratio
of at least 90% if the system has not granted such an increase in the most recent fiscal year. The funded
ratio at any fiscal year end is the ratio of the actuarial value of assets to the actuarial accrued liability
under the funding method prescribed by the legislative auditor (currently the Entry Age Normal Method
for this system.)

-9-
G. S. Curran & Company, Ltd.
Since the Board of Trustees elected to grant a cost of living increase during 2014, the system is not
authorized to grant a cost of living increase based upon this valuation. Based on the fiscal 2013
valuation, the Board of Trustees voted to grant a cost of living increase pursuant to R. S.
11:2225(A)(7)(c) and (d). The present value of this cost of living increase was estimated at
$38,924,984. This was included in the present value of future benefits and actuarial accrued liability as
stated in this report.

-10-
G. S. Curran & Company, Ltd.
Components of Present Value of Future Benefits June 30, 2014
Unfunded Accrued Liability
$1,711,268,285
$141,571,714
$183,033,761
$801,359,380
Actuarial Value of Assets Present Value of Future Employer Normal Cost
Present Value of Employee Contributions Unfunded Actuarial Accrued Liability
0
100
200
300
400
500
600
700
800
900
1000
2005 2006 2007 2008 2009 2010 2011 2012 2013 2014
Mil
lion
s
Unfunded Accrued Liability

-11-
G. S. Curran & Company, Ltd.
Market Value of Assets vs. Actuarial Accrued Liability
Components of Actuarial Funding
(2012 and later employee contribution level is based on members with earnings above the poverty level)
0
250
500
750
1000
1250
1500
1750
2000
2250
2500
2750
2005 2006 2007 2008 2009 2010 2011 2012 2013 2014
($)
Mil
lio
ns
Market Value of Assets Actuarial Accrued Liability
0 5 10 15 20 25 30 35 40 45 50
2015
2014
2013
2012
2011
2010
2009
2008
2007
2006
(%) Percentage of Payroll
Employee Contributions Required Tax Contributions Required Net Direct Employer Contributions

-12-
G. S. Curran & Company, Ltd.
Net Non-Investment Income
2005 2006 2007 2008 2009 2010 2011 2012 2013 2014
Non-Investment Income ($Mil) 74.6 66.7 66.3 69.3 60.6 67.0 106.1 116.0 125.9 126.6
Benefits and Expenses ($Mil)
86.2 89.6 92.9 96.9 100.7 107.2 115.3 120.0 124.2 136.7
Net Non-Investment Income ($Mil) -11.6 -22.9 -29.6 -27.6 -40.1 -40.2 -9.2 -4.0 1.7 -10.1
Total Income vs. Expenses (Based on Market Value of Assets)
2005 2006 2007 2008 2009 2010 2011 2012 2013 2014
Total Income ($Mil) 188.6 181.6 299.2 -53.6 -291.8 198.1 381.0 85.9 318.0 439.9
Benefits and Expenses ($Mil)
86.2 89.6 92.9 96.9 100.7 107.2 115.3 120.0 124.2 136.7
Net Change in MVA ($Mil) 102.4 92.0 206.3 -150.5 -392.5 90.9 265.7 34.1 193.8 303.2
-60
-40
-20
0
20
40
60
80
100
120
140
2005 2006 2007 2008 2009 2010 2011 2012 2013 2014
(Mil
lio
ns)
-500
-400
-300
-200
-100
0
100
200
300
400
500
2005 2006 2007 2008 2009 2010 2011 2012 2013 2014
(Mil
lio
ns)

-13-
G. S. Curran & Company, Ltd.
Historical Asset Yields
9.4
13.2 13.6
6.4
-16.7
-0.8
3.9
7.8
11.2 11.9
9.3 8.7
16.5
-7.6
-24.2
12.4
23.5
-2.1
13.7
18.6
-30
-20
-10
0
10
20
30
2005 2006 2007 2008 2009 2010 2011 2012 2013 2014
Yie
ld (
As
a P
erce
nt)
Actuarial Yield Market Yield

-14-
G. S. Curran & Company, Ltd.
EXHIBIT I ANALYSIS OF ACTUARIALLY REQUIRED CONTRIBUTIONS
1. Normal Cost of Retirement Benefits ................................................................... $ 32,233,824
2. Normal Cost of Death Benefits ........................................................................... $ 1,431,149
3. Normal Cost of Disability Benefits ..................................................................... $ 2,204,853
4. Normal Cost of Deferred Retirement Benefits .................................................... $ 1,424,192
5. Normal Cost of Contribution Refunds ................................................................ $ 5,716,861
6. TOTAL Normal Cost as of July 1, 2014 (1+2+3+4+5) ...................................... $ 43,010,879
7. Amortization of Unfunded Accrued Liability of $801,359,380.......................... $ 73,122,882
8. TOTAL Normal Cost & Amortization Payments (6+7) ..................................... 116,133,761
9. Normal Cost and Amortization Payments Interest Adjusted
for Midyear Payment ........................................................................................... $ 120,410,046
10. Estimated Administrative Cost for Fiscal 2015 .................................................. $ 1,438,130
11. TOTAL Administrative and Interest Adjusted Actuarial Costs (9+10) .............. $ 121,848,176
12. Expected Insurance Premium Taxes due in Fiscal 2015 ..................................... $ 17,704,000
13. Net Direct Combined Actuarially Req’d Contributions for Fiscal 2015 (11-12) $ 104,144,176
14. Projected Payroll For Contributing Members
July 1, 2014 through June 30, 2015 ................................................................... $ 261,650,924
15. Net Direct Combined Actuarially Required Contributions
as a % of Projected Payroll for Fiscal 2015 (13 ÷ 14) ........................................ $ 39.80%
16. Actual Net Direct Combined Contribution Rate for Fiscal 2015 ........................ $ 41.50%
17. Contribution Gain (Loss) as a Percentage of Payroll (16 – 15) .......................... $ 1.70%
18. Adjustment to Following Year Payment for Contribution Gain (Loss) .............. $ 0.18%
19. Recommended Net Direct Combined Contribution Rate for Fiscal 2016
(15 – 18) (Rounded to nearest 0.25%) ................................................................ $ 39.50%
20. Recommended Net Direct Employee Contribution Rate (for members with
earnings more than the Department of HHS poverty guidelines) ....................... 10.00%
21. Recommended Net Direct Employer Contribution Rate (for members with
earnings more than the Department of HHS poverty guidelines) ....................... 29.50%
22. Recommended Net Direct Employee Contribution Rate (for members with
earnings less than or equal to the Department of HHS poverty guidelines) ....... 7.50%
23. Recommended Net Direct Employer Contribution Rate (for members with
earnings less than or equal to the Department of HHS poverty guidelines) ....... 32.00%
24 Recommended Net Direct Employee Contribution Rate (Non-Hazardous Subplan) 8.00%
25. Recommended Net Direct Employer Contribution Rate (Non-Hazardous Subplan) 31.50%

-15-
G. S. Curran & Company, Ltd.
EXHIBIT II PRESENT VALUE OF FUTURE BENEFITS
PRESENT VALUE OF FUTURE BENEFITS FOR ACTIVE MEMBERS:
Retirement Benefits ................................................................ $ 1,333,514,627
Survivor Benefits .................................................................... 19,017,224
Disability Benefits .................................................................. 42,398,452
Vested Termination Benefits .................................................. 28,672,667
Refunds of Contributions ...................................................... 54,712,490
TOTAL Present Value of Future Benefits for Active Members .............................. $ 1,478,315,460
PRESENT VALUE OF FUTURE BENEFITS FOR TERMINATED MEMBERS:
Terminated Vested Members Due Benefits at Retirement ..... $ 25,450,455
Terminated Members with Reciprocals
Due Benefits at Retirement ................................................ 0
Terminated Members Due a Refund ...................................... 5,754,407
TOTAL Present Value of Future Benefits for Terminated Members ...................... $ 31,204,862
PRESENT VALUE OF FUTURE BENEFITS FOR RETIREES:
Regular Retirees ............................................................................ $ 1,049,949,895
Disability Retirees ......................................................................... 47,216,944
Survivors & Widows ..................................................................... 121,297,118
DROP Account Balances Payable to Retirees ............................. 69,476,162
IBO Retirees’ Account Balance .................................................... 842,715
Additional Liability for Cost of Living Increase Previously Granted 38,929,984
TOTAL Present Value of Future Benefits for Retirees & Survivors ....................... $ 1,327,712,818
TOTAL Present Value of Future Benefits .................................................................... $ 2,837,233,140

-16-
G. S. Curran & Company, Ltd.
EXHIBIT III – SCHEDULE A MARKET VALUE OF ASSETS
CURRENT ASSETS:
Cash in Banks ................................................................................. $ 34,567,283
Contributions and Taxes Receivable .............................................. 9,498,832
Accrued Interest and Dividends ..................................................... 3,468,197
Investments Receivable .................................................................. 858,710
Receivable on Currency Contracts ................................................. 8,219
TOTAL CURRENT ASSETS ................................................................. $ 48,401,241
Property Plant & Equipment .......................................................................................... $ 2,160,394
INVESTMENTS:
Cash Equivalents ........................................................................ $ 44,686,860
Equities ..................................................................................... 1,096,569,011
Fixed Income .............................................................................. 320,737,930
Real Estate ................................................................................. 177,987,806
Alternative Investments ............................................................. 123,402,294
Tactical Allocation ..................................................................... 78,180,751
Collateral for Securities Lending ............................................... 86,575,755
Other Investments ..................................................................... 370,950
TOTAL INVESTMENTS ....................................................................... $ 1,928,511,357
TOTAL ASSETS .................................................................................... $ 1,979,072,992
CURRENT LIABILITIES:
Accounts Payable ............................................................ $ 684,483
Refunds Payable .............................................................. 486,448
Investments Payable ........................................................ 3,751,895
Securities Lending Obligations ....................................... 86,575,755
Other Post-Employment Benefits .................................... 516,238
Deferred Contributions .................................................... 31,875
Payable on Currency Contracts ....................................... 6,835
TOTAL CURRENT LIABILITIES ........................................................ $ 92,053,529
MARKET VALUE OF ASSETS ............................................................ $ 1,887,019,463

-17-
G. S. Curran & Company, Ltd.
EXHIBIT III – SCHEDULE B ACTUARIAL VALUE OF ASSETS
Excess (Shortfall) of invested income for current and previous 4 years: Fiscal year 2014 ...................................................................................................... $ 176,967,651 Fiscal year 2013 ...................................................................................................... 86,627,167 Fiscal year 2012 ...................................................................................................... (138,057,227) Fiscal year 2011 ...................................................................................................... 187,118,241 Fiscal year 2010 ...................................................................................................... 0 Total for five years ................................................................................. $ 312,655,832 Deferral of excess (shortfall) of invested income: Fiscal year 2014 (80%) ........................................................................................... $ 141,574,121 Fiscal year 2013 (60%) ........................................................................................... 51,976,300 Fiscal year 2012 (40%) ........................................................................................... (55,222,891) Fiscal year 2011 (20%) ........................................................................................... 37,423,648 Fiscal year 2010 ( 0%) ........................................................................................... 0 Total deferred for year ............................................................................ $ 175,751,178 Market value of plan net assets, end of year ................................................................. $ 1,887,019,463 Preliminary actuarial value of plan assets, end of year ................................................. $ 1,711,268,285 Actuarial value of assets corridor
85% of market value, end of year ........................................................................... $ 1,603,966,544
115% of market value, end of year ......................................................................... $ 2,170,072,382
Final actuarial value of plan net assets, end of year ..................................................... $ 1,711,268,285

-18-
G. S. Curran & Company, Ltd.
EXHIBIT IV PRESENT VALUE OF FUTURE CONTRIBUTIONS
Employee Contributions to the Annuity Savings Fund ................................................ $ 183,033,761
Employer Normal Contributions to the Pension Accumulation Fund .......................... 141,571,714
Employer Amortization Payments to the Pension Accumulation Fund ....................... 801,359,380
TOTAL PRESENT VALUE OF FUTURE CONTRIBUTIONS .................. $ 1,125,964,855
EXHIBIT V - SCHEDULE A ACTUARIAL ACCRUED LIABILITIES
LIABILITY FOR ACTIVE MEMBERS Accrued Liability for Retirement Benefits ........................... $ 1,087,526,523 Accrued Liability for Survivor Benefits ............................... 8,579,707 Accrued Liability for Disability Benefits ............................. 26,160,432 Accrued Liability for Vested Termination Benefits ............. 18,168,470 Accrued Liability for Refunds of Contributions .................. 13,274,853 TOTAL Actuarial Accrued Liability for Active Members ................................ $ 1,153,709,985
LIABILITY FOR TERMINATED MEMBERS .......................................................... $ 31,204,862
LIABILITY FOR RETIREES AND SURVIVORS .................................................... $ 1,327,712,818
TOTAL ACTUARIAL ACCRUED LIABILITY .............................................. $ 2,512,627,665
ACTUARIAL VALUE OF ASSETS ................................................................. $ 1,711,268,285
UNFUNDED ACTUARIAL ACCRUED LIABILITY ..................................... $ 801,359,380
EXHIBIT V - SCHEDULE B CHANGE IN UNFUNDED ACTUARIAL ACCRUED LIABILITY
Prior Year Unfunded Accrued Liability ....................................................................... $ 860,157,735 Interest on Unfunded Accrued Liability ................................................. $ 64,511,830
Normal Cost for Prior Year..................................................................... 44,231,463
Interest on the Normal Cost .................................................................... 3,317,360
Administrative Expenses ........................................................................ 1,585,760
Interest on Expenses ............................................................................... 58,392
TOTAL Interest Adjusted Actuarially Required Contributions ................... $ 113,704,805
Required Contributions for Prior Year with interest............................... $ 133,127,073
Contribution Excess (Shortfall) with accrued interest ............................ (3,720,140)
Liability Assumption Gains (Losses)...................................................... 225,724
Cost of Living Adjustment Gains (Losses) ............................................. (38,929,984)
Liability Experience Gains (Losses) ....................................................... 14,670,717
Investment Gains (Losses) ...................................................................... 67,129,770
TOTAL Interest Adjusted Employer Contributions ..................................... $ 172,503,160
NET Change in Frozen Unfunded Accrued Liability ................................... $ (58,798,355)
CURRENT YEAR UNFUNDED ACCRUED LIABILITY ........................ $ 801,359,380

-19-
G. S. Curran & Company, Ltd.
EXHIBIT V - SCHEDULE C AMORTIZATION OF UNFUNDED ACTUARIAL ACCRUED LIABILITY
JUNE 30, 2014
FISCAL AMORT. INITIAL YEARS REMAINING AMORT.
YEAR DESCRIPTION PERIOD BALANCE REMAINING BALANCE PAYMENTS
2014 Cumulative Bases 20 801,359,380 20 801,359,380 73,122,882
TOTAL Unfunded Actuarial Accrued Liability $ 801,359,380
TOTAL Fiscal 2014 Amortization Payments $ 73,122,882
-20-
G. S. Curran & Company, Ltd.
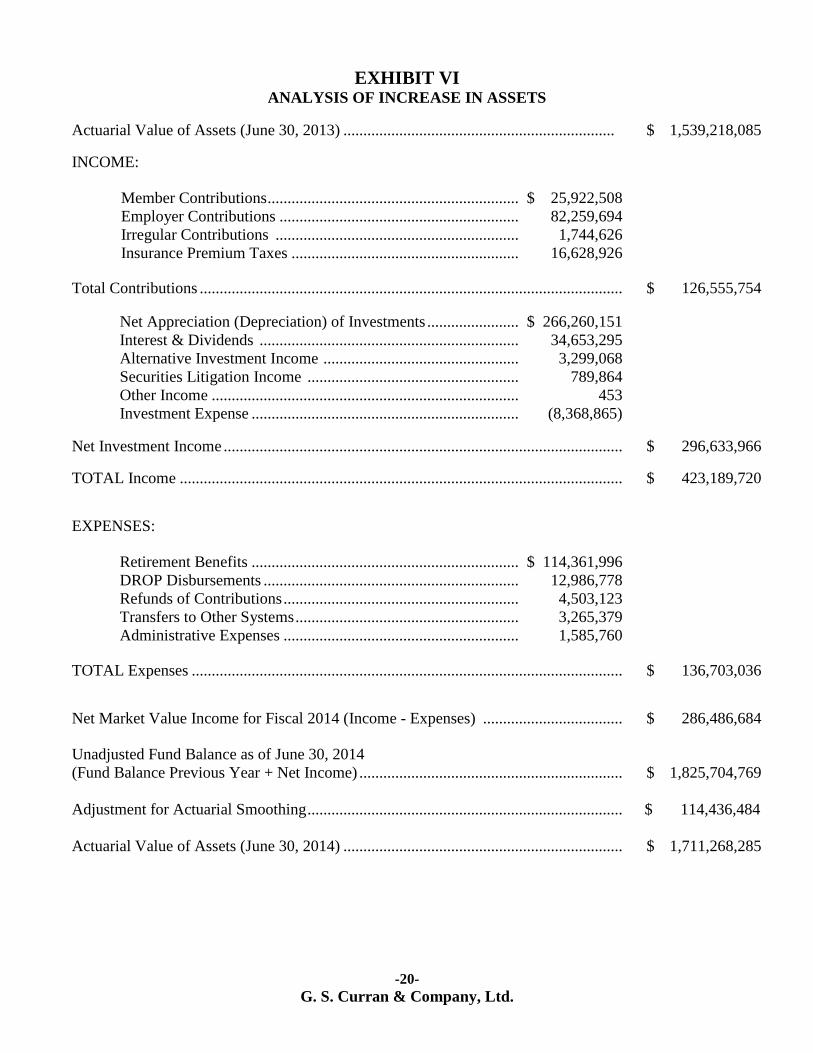
EXHIBIT VI ANALYSIS OF INCREASE IN ASSETS
Actuarial Value of Assets (June 30, 2013) .................................................................... $ 1,539,218,085 INCOME:
Member Contributions ............................................................... $ 25,922,508
Employer Contributions ............................................................ 82,259,694
Irregular Contributions ............................................................. 1,744,626
Insurance Premium Taxes ......................................................... 16,628,926
Total Contributions .......................................................................................................... $ 126,555,754 Net Appreciation (Depreciation) of Investments ....................... $ 266,260,151
Interest & Dividends ................................................................. 34,653,295
Alternative Investment Income ................................................. 3,299,068
Securities Litigation Income ..................................................... 789,864
Other Income ............................................................................. 453
Investment Expense ................................................................... (8,368,865) Net Investment Income .................................................................................................... $ 296,633,966 TOTAL Income ............................................................................................................... $ 423,189,720 EXPENSES:
Retirement Benefits ................................................................... $ 114,361,996
DROP Disbursements ................................................................ 12,986,778
Refunds of Contributions ........................................................... 4,503,123
Transfers to Other Systems ........................................................ 3,265,379
Administrative Expenses ........................................................... 1,585,760
TOTAL Expenses ............................................................................................................ $ 136,703,036 Net Market Value Income for Fiscal 2014 (Income - Expenses) ................................... $ 286,486,684
Unadjusted Fund Balance as of June 30, 2014
(Fund Balance Previous Year + Net Income) .................................................................. $ 1,825,704,769
Adjustment for Actuarial Smoothing ............................................................................... $ 114,436,484
Actuarial Value of Assets (June 30, 2014) ...................................................................... $ 1,711,268,285

-21-
G. S. Curran & Company, Ltd.
EXHIBIT VII CENSUS DATA
Active
Terminated
with Funds
on Deposit
DROP
Retired
Total
Number of members as of
June 30, 2013
5,602
1,397
314
4,340
11,653
Additions to Census
Initial membership
Omitted in error last year
Death of another member
Adjustment for multiple records
360
59
3
26
419
3
26
Change in Status during Year
Actives terminating service
Actives who retired
Actives entering DROP
Term. members rehired
Term. members who retire
Retirees who are rehired
Refunded who are rehired
DROP participants retiring
DROP returned to work
Omitted in error last year
(203)
(83)
(92)
42
1
21
35
203
(42)
(7)
92
(100)
(35)
83
7
(1)
100
21
Eliminated from Census
Refund of contributions
Deaths
Included in error last year
Adjustment for multiple records
(210)
(5)
(176)
(3)
(103)
(11)
(386)
(111)
(11)
Number of members as of
June 30, 2014
5,468
1,431
271
4,444
11,614

-22-
G. S. Curran & Company, Ltd.
-23-
G. S. Curran & Company, Ltd.
-24-
G. S. Curran & Company, Ltd.

-25-
G. S. Curran & Company, Ltd.

-26-
G. S. Curran & Company, Ltd.

-27-
G. S. Curran & Company, Ltd.

-28-
G. S. Curran & Company, Ltd.

-29-
G. S. Curran & Company, Ltd.
EXHIBIT VIII YEAR-TO-YEAR COMPARISON
**************************************************************************************
*
* COLA not included
Fiscal 2014 Fiscal 2013 Fiscal 2012 Fiscal 2011
Number of Active Members 5,468 5,602 5,779 5,933
Number of Retirees & Survivors 4,444 4,340 4,230 4,165
DROP Participants 271 314 284 231
Number of Terminated Due Deferred Benefits 159 145 130 128
Number Terminated Due Refunds 1,272 1,252 1,176 1,251
Active Lives Payroll
(excludes DROP participants) $ 259,594,435 $ 264,711,491 $ 272,606,934 $ 273,348,634
Retiree Benefits in Payment $ 118,522,277 * $ 110,735,234 $ 104,998,503 $ 99,863,547
Market Value of Assets $ 1,887,019,463 $1,600,532,779 $ 1,406,662,003 $ 1,440,795,586
Ratio of Market Value of Assets to
Actuarial Accrued Liability 75.10% 66.71% 60.80% 65.03%
Actuarial Accrued Liability $ 2,512,627,665 $ 2,399,375,820 $ 2,313,751,839 $ 2,215,674,343
Actuarial Value of Assets $ 1,711,268,285 $ 1,539,218,085 $ 1,382,503,860 $1,286,287,651
UAL (Funding Excess) $ 801,359,380 $ 860,157,735 $ 931,247,979 $ 929,386,692
Fiscal 2015 Fiscal 2014 Fiscal 2013 Fiscal 2012
Employee Contribution Rate (For employees
with earnings above the poverty level)
10.00%
10.00%
10.00%
10.00%
Required Tax Contributions as a Percentage of
Projected Payroll
6.77%
6.19%
5.75%
5.65%
Actuarially Required Employer Contribution as a
Percentage of Projected Payroll (For employees
with earnings above the poverty level)
29.80%
31.53%
31.03%
30.52%
Actual Employer Contribution Rate (For
employees with earnings above the poverty level)
31.50%
31.00%
31.00%
26.50%

-30-
G. S. Curran & Company, Ltd.
Fiscal 2010 Fiscal 2009 Fiscal 2008 Fiscal 2007 Fiscal 2006 Fiscal 2005
6,197 6,071 5,908 5,840 5,769 6,000
4,028 3,984 3,896 3,834 3,739 3,652
194 185 213 217 227 239
112 112 114 108 99 88
1,198 1,197 1,095 993 926 602
$ 280,977,278 $ 270,236,561 $ 252,562,020 $ 229,145,048 $ 223,213,661 $ 215,638,892
$ 93,382,980 $ 90,285,300 $ 85,848,060 $ 81,976,596 $ 77,538,204 $ 73,587,564
$ 1,175,083,706 $ 1,084,169,309 $ 1,476,652,461 $ 1,627,120,612 $ 1,420,792,356 $ 1,328,792,481
56.39% 54.52% 80.20% 94.63% 86.05% 85.60%
$2,083,809,321 $ 1,988,394,358 $1,841,234,995 $ 1,719,536,371 $1,651,055,550 $ 1,552,332,283
$1,247,546,395 $1,297,128,398 $ 1,600,941,810 $ 1,531,297,284 $ 1,371,981,645 $ 1,233,572,172
$ 836,262,926 $ 691,265,960 $ 240,293,185 $ 188,239,087 $ 279,073,905 $ 318,760,111
********************************************************************************
Fiscal 2011 Fiscal 2010 Fiscal 2009 Fiscal 2008 Fiscal 2007 Fiscal 2006
7.50%
7.50%
7.50%
7.50%
7.50%
7.50%
5.36%
5.52%
5.85%
5.59%
5.66%
5.44%
27.84%
24.13%
10.98%
10.45%
13.70%
15.59%
25.00%
11.00%
9.50%
13.75%
15.50%
16.25%
-31-
G. S. Curran & Company, Ltd.
SUMMARY OF PRINCIPAL PLAN PROVISIONS
The Municipal Police Employees’ Retirement System was established as of July 1, 1973, for the purpose
of providing retirement allowances and other benefits as described under R.S. 11:2211 - 11:2235. The
following summary of plan provisions is for general informational purposes only and does not constitute
a guarantee of benefits. The provisions contained within this section are as of June 30, 2013.
MEMBERSHIP - All full-time police officers empowered to make arrests, all full-time police officers
decommissioned due to illness or injury, empowered by a municipality of the state of Louisiana, and
engaged in law enforcement, all individuals in a position as defined in the municipal fire and police civil
service system who are employed on a full-time basis by a police department of any municipality of this
state, and are under the direction of a chief of police, and are paid from the budget of the applicable
police department are required to become members of this retirement system, if they earn at least $375
per month excluding state supplemental pay. All elected chiefs of police, whose salary is at least $100
per month, all academy recruits who are participating in or awaiting participation in a formal training
program, required prior to commission as a municipal police officer, with complete law enforcement
office authority, all full-time secretaries to an appointed chief or elected chief of police, and all full-time
employees of the system are required to become members of this retirement system. Persons must be
under the age of fifty on their date of employment to be eligible for system membership. Certain
restrictions to membership apply to those who are receiving disability or regular retirement benefits
from another system.
For employees whose first employment making them eligible for membership in the system occurred on
or after January 1, 2013, membership will be in the Hazardous Duty Subplan if they are eligible to
receive state supplemental pay by virtue of their employment or the Nonhazardous Duty Subplan if they
are not eligible for state supplemental pay.
CONTRIBUTION RATES - The fund is financed by employee and employer contributions together
with funds from dedicated insurance premium taxes as allocated by the Public Retirement Systems'
Actuarial Committee in accordance with R.S. 11:62, R.S 11:103, and R.S. 22:1476A(3). For employees
hired prior to January 1, 2013, the employee contribution rate is at least 7.5% but not greater than 10%
based on the total contribution expressed as a percentage of payroll after applying all required tax
contributions. The employee rate, when such contributions total 25% or less, is set at 7.5%. The
employee rate then increases 0.25% for each 0.75% increase in the total rate, and an additional 0.25%
when the rate exceeds 28.75%, subject to a maximum rate of 10%. Regardless of the total contribution
rate, members whose earnable compensation is less than or equal to the poverty guidelines issued by the
U.S. Department of Health and Human Services have an employee contribution rate of 7.5%. Net direct
employer contributions are nine percent (9.0%) of earnable compensation unless the funds allocated
from dedicated taxes are insufficient to provide the actuarially required contributions or the actuarially
required contributions are less than 9.0%. Members are not required to contribute to the system once
they have enough service to have accrued 100% of final average compensation, but the employer is
required to continue to contribute the employer’s contribution until the member retires or enters DROP.
For employees hired on or after January 1, 2013 who are members of the Hazardous Duty Subplan, the
employee contribution rate is the same as that for employees hired before January 1, 2013. For
employees hired on or after January 1, 2013 who are members of the Nonhazardous Duty Subplan, the
employee contribution rate is 8%.

-32-
G. S. Curran & Company, Ltd.
CONTRIBUTION REFUNDS - Upon withdrawal from service, members not entitled to a retirement
allowance may receive a refund of accumulated contributions. Refunds are payable thirty days after the
effective date of withdrawal from service, if the member’s employer has submitted all contributions.
AVERAGE FINAL COMPENSATION –
For employees hired prior to January 1, 2013: The average annual earned compensation of an
employee for the highest period of thirty-six successive or joined months of service as an employee.
For employees hired on or after January 1, 2013: The average annual earned compensation of an
employee for the highest period of sixty successive or joined months of service as an employee.
The twelve month salaries used to compute the average final compensation are subject to a limit in the
rate of increase of 15% per year with certain exceptions.
NORMAL RETIREMENT BENEFITS –
For employees hired prior to January 1, 2013: Members with twelve years of creditable service may
retire at age fifty-five; members with twenty years of service may retire at age fifty; members with
twenty-five years of service may retire regardless of age. The retirement allowance is equal to three and
one-third percent of the member's average final compensation multiplied by his years of creditable
service, not to exceed one hundred percent of his average final compensation.
For employees hired on or after January 1, 2013 who participate in the Hazardous Duty Subplan:
Members with twelve years of creditable service may retire at age fifty-five; members with twenty-five
years of service may retire at any age. The retirement allowance is equal to three percent of the
member's average final compensation multiplied by his years of creditable service, not to exceed one
hundred percent of his average final compensation. Members in this subplan who retire with thirty or
more years of creditable service receive benefits according to a three and one-third percent retirement
allowance.
For employees hired on or after January 1, 2013 who participate in the Nonhazardous Duty
Subplan: Members with twenty-five years of creditable service may retire at age fifty-five; members
with thirty years of service may retire at any age. The retirement allowance is equal to two and one-half
percent of the member's average final compensation multiplied by his years of creditable service, not to
exceed one hundred percent of his average final compensation.
EARLY RETIREMENT –
For employees hired prior to January 1, 2013: Members with twenty or more years of creditable
service who leave employment before age fifty may elect to receive early retirement benefits equal to an
actuarially reduced accrued normal retirement benefit.
For employees hired on or after January 1, 2013: Members with twenty or more years of creditable
service may elect to receive early retirement benefits equal to an actuarially reduced accrued normal
retirement benefit.

-33-
G. S. Curran & Company, Ltd.
OPTIONAL ALLOWANCES - Members may receive their benefits as a life annuity, or in lieu of such receive a reduced benefit according to the option selected which is the actuarial equivalent of the maximum benefit. Option 1 - If the member dies before he has received in annuity payments the present value of
his member's annuity as it was at the time of retirement the balance is paid to his beneficiary.
Option 2 - Upon retirement, the member receives a reduced benefit. Upon the member's death,
the designated beneficiary will continue to receive the same reduced benefit.
Option 3 - Upon retirement, the member receives a reduced benefit. Upon the member's death,
the designated beneficiary will receive one-half of the member's reduced benefit.
Option 4 - Upon retirement, the member elects to receive a board approved benefit which is
actuarially equivalent to the maximum benefit.
A member may also elect to receive an actuarially reduced benefit which provides for an
automatic 2 ½% annual compound increase in monthly retirement benefits based on the reduced
benefit and commencing on the later of age fifty-five or retirement anniversary; this COLA is in
addition to any ad hoc COLAs which are payable.
Initial Benefit Option – This option is available only to regular retirees who have not
participated in the Deferred Retirement Option Plan. Under this option members may receive an
initial benefit plus a reduced monthly retirement allowance which, when combined, equal the
actuarially equivalent amount of the maximum retirement allowance. The initial benefit may not
exceed an amount equal to thirty-six payments of the member’s maximum retirement allowance.
The initial benefit can be paid either as a lump-sum payment or placed in an account called an
“initial benefit account” with interest credited thereto and monthly payments made from the
account.
DISABILITY BENEFITS - Any member who has been officially certified as totally disabled solely as
the result of injuries sustained in the performance of his official duties, or for any cause, provided the
member has a least ten years of creditable service and provided that the disability was incurred while the
member was an active contributing member, is entitled to disability benefits.
For employees hired prior to January 1, 2013: Disability retirees will receive a benefit equal to three
percent of final average compensation multiplied by the number of years of service, subject to a
minimum of 40% of final compensation and a maximum of 60% of final compensation. Any disability
retiree who is in a coma or paraplegic, or who is blinded or loses the total use of a limb, solely as a result
of injuries sustained in the line of duty will receive a benefit equal to 100% of final average
compensation. Disability retirees who retired with a service-connected disability benefit have the
option, at normal retirement age, to continue receiving a disability benefit or to convert to receiving their
vested retirement benefit. All other disability retirees, at normal retirement age, will receive the greater
of their disability retirement benefit or their vested benefit.
For employees hired on or after January 1, 2013 who participate in the Hazardous Duty Subplan:
Disability retirees who are disabled in the line of duty or who have 10 years of service credit will receive
a benefit equal to two and three-quarters percent of final average compensation multiplied by the
number of years of service, subject to a minimum of 33% of final compensation and a maximum of 55%

-34-
G. S. Curran & Company, Ltd.
of final compensation. Any disability retiree who is in a coma or paraplegic, or who is blinded or loses
the total use of a limb, solely as a result of injuries sustained in the line of duty will receive a benefit
equal to 100% of final average compensation. Disability retirees who retired with a service-connected
disability benefit have the option, at normal retirement age, to continue receiving a disability benefit or
to convert to receiving their vested retirement benefit. All other disability retirees, at normal retirement
age, will receive the greater of their disability retirement benefit or their vested benefit.
For employees hired on or after January 1, 2013 who participate in the Nonhazardous Duty
Subplan: Disability retirees who have at least 10 years of service credit will receive a benefit equal to
two and one-quarter percent of final average compensation multiplied by the number of years of service,
subject to a minimum of 25% of final compensation and a maximum of 50% of final compensation.
Any disability retiree who is in a coma or paraplegic, or who is blinded or loses the total use of a limb,
solely as a result of injuries sustained in the line of duty will receive a benefit equal to 100% of final
average compensation. At normal retirement age, disability retirees will receive the greater of their
disability retirement benefit or their vested benefit.
SURVIVOR BENEFITS – Benefits are payable to survivors of any active contributing member who
dies before retirement, or disability retirees who die after retirement as follows.
For employees hired prior to January 1, 2013: If he leaves a surviving spouse, she will receive an
annual benefit equal to 3 1/3% of the deceased member's average final compensation multiplied by his
total years of creditable service; however, in no event is the annual benefit less than 40% nor more than
60% of the deceased member's average final compensation. If the surviving spouse remarries, the
benefits shall cease unless the remarriage occurs after age fifty-five. If the member dies as a result of
injuries sustained in the line of duty, the surviving spouse receives a benefit equal to 100% of final
average compensation, which shall not cease due to remarriage, less any benefits payable to surviving
children. Unmarried children of the deceased member who are under the age of eighteen years are
entitled to the greater of $200 per month or 10% of average final compensation (not to exceed 100% of
average final compensation when combined with the surviving spouse’s benefit) until reaching the age
of eighteen, or until the age of twenty-three, assuming they remain unmarried, if enrolled full-time in an
institution of higher learning, high school, or vocational-technical school, unless the surviving child is
physically handicapped or mentally retarded in which case the benefit is payable regardless of age. If a
deceased member dies leaving no surviving spouse, but at least one minor child, each child is entitled to
receive forty percent of the deceased's average final compensation, not to exceed an aggregate of sixty
percent of average final compensation, subject to the same age restrictions as in the case of a surviving
spouse with minor children. If a member dies after he is eligible for retirement but before actual
retirement, his surviving spouse will be paid the greater of the surviving spouse benefits detailed above,
or an automatic option 2 benefit. Members who have terminated employment with at least twelve years
of service credit are eligible for the benefits detailed in this paragraph.
For employees hired on or after January 1, 2013 who participate in the Hazardous Duty Subplan:
The surviving spouse of a deceased active contributing member or disability retiree with at least ten
years of creditable service not killed in the line of duty will receive an annual benefit equal to the benefit
calculated using the regular retirement formula; however, in no event is the annual benefit less than 33%
nor more than 55% of the deceased member's average final compensation. If the surviving spouse
remarries, the benefits shall cease unless the remarriage occurs after age sixty. If the member dies as a
result of injuries sustained in the line of duty, the surviving spouse receives a benefit equal to 100% of
final average compensation, which shall not cease due to remarriage, less any benefits payable to

-35-
G. S. Curran & Company, Ltd.
surviving children. Unmarried children of the deceased member who are under the age of eighteen
years are entitled to the greater of $200 per month or 10% of average final compensation (not to exceed
100% of average final compensation when combined with the surviving spouse’s benefit) until reaching
the age of eighteen, or until the age of twenty-three, assuming they remain unmarried, if enrolled full-
time in an institution of higher learning, high school, or vocational-technical school, unless the surviving
child is physically handicapped or mentally retarded in which case the benefit is payable regardless of
age. If a deceased member dies leaving no surviving spouse, but at least one minor child, each child is
entitled to receive twenty-five percent of the deceased's average final compensation, not to exceed an
aggregate of fifty percent of average final compensation, subject to the same age restrictions as in the
case of a surviving spouse with minor children. If a member dies after he is eligible for retirement but
before actual retirement, his surviving spouse will be paid the greater of the surviving spouse benefits
detailed above, or an automatic option 2 benefit. Members who have terminated employment with at
least twelve years of service credit are eligible for the benefits detailed in this paragraph.
For employees hired on or after January 1, 2013 who participate in the Nonhazardous Duty
Subplan: The surviving spouse of a deceased active contributing member or disability retiree with at
least ten years of creditable service not killed in the line of duty will receive an annual benefit equal to
the benefit calculated using the regular retirement formula; however, in no event is the annual benefit
less than 25% nor more than 50% of the deceased member's average final compensation. If the
surviving spouse remarries, the benefits shall cease unless the remarriage occurs after age sixty. If the
member dies as a result of injuries sustained in the line of duty, the surviving spouse receives a benefit
equal to 100% of final average compensation, which shall not cease due to remarriage, less any benefits
payable to surviving children. Unmarried children of the deceased member who are under the age of
eighteen years are entitled to the greater of $200 per month or 10% of average final compensation (not
to exceed 100% of average final compensation when combined with the surviving spouse’s benefit) until
reaching the age of eighteen, or until the age of twenty-three, assuming they remain unmarried, if
enrolled full-time in an institution of higher learning, high school, or vocational-technical school, unless
the surviving child is physically handicapped or mentally retarded in which case the benefit is payable
regardless of age. If a deceased member dies leaving no surviving spouse, but at least one minor child,
each child is entitled to receive twenty percent (twenty-five percent in the case of one minor child) of the
deceased's average final compensation, not to exceed an aggregate of fifty percent of average final
compensation, subject to the same age restrictions as in the case of a surviving spouse with minor
children. If a member dies after he is eligible for retirement but before actual retirement, his surviving
spouse will be paid the greater of the surviving spouse benefits detailed above, or an automatic option 2
benefit. Members who have terminated employment with at least twelve years of service credit are
eligible for the benefits detailed in this paragraph.
DEFERRED RETIREMENT OPTION PLAN - In lieu of terminating employment and accepting a
service retirement allowance, any member of the system who is eligible to receive a regular retirement
allowance may elect to participate in the Deferred Retirement Option Plan for up to thirty-six months
and defer the receipt of benefits. Upon commencement of participation in the plan, membership in the
system terminates and neither the employee nor employer contributions are payable. Compensation and
creditable service will remain as they existed on the effective date of commencement of participation in
the plan. The monthly retirement benefits that would have been payable, had the member elected to
cease employment and receive a service retirement allowance, are paid into the deferred retirement
option plan account. Upon termination of employment at the end of the specified period of
participation, a participant in the program may receive, at his option, a lump sum payment from the
account equal to the payments to the account, or a true annuity based upon his account, or he may elect

-36-
G. S. Curran & Company, Ltd.
any other method of payment if approved by the board of trustees. The monthly benefits that were being
paid into the fund during the period of participation will begin to be paid to the retiree. If employment is
not terminated at the end of the thirty-six months, payments into the account cease and the member
resumes active contributing membership in the system. Such members may accumulate an additional
benefit for service rendered after completion of the Deferred Retirement Option Plan. If the participant
dies during the period of participation in the program, a lump sum payment equal to his account balance
is paid to his named beneficiary or, if none, to his estate; in addition, normal survivor benefits are
payable to survivors of retirees.
COST OF LIVING INCREASES – Pursuant to R.S. 11:2225, the board of trustees is authorized to use
interest earnings in excess of the normal requirements to grant annual cost of living increases of 3% of
each retiree’s original or current benefit. R.S. 11:246 provides cost of living increases to retirees and
beneficiaries over the age of 65 equal to 2% of the benefit in payment on October 1, 1977, or the date
the benefit was originally received if retirement commenced after that date. In lieu of these cost of
living adjustments, the board may grant an increase under R.S. 11:241 in the form of $X(A+B) where
X is at most $1 and "A" represents the number of years of credited service accrued at retirement or at
death of the member or retiree, and "B" is equal to the number of years since retirement or since death of
the member or retiree to June 30th
of the initial year of such increase.
All of the above provisions require that the system earn sufficient excess interest earnings to fund the
increases and to meet certain other criteria detailed in the statutes related to funding status.
R. S. 11:2225(A)(7)(c) and (d) provide that the board of trustees is authorized to provide a one-time cost
of living adjustment of 3% of each retiree’s normal monthly benefit (not to be less than $20 per month)
from excess interest earnings without regard to the provisions of R.S. 11:242 (which describes the target
ratio).

-37-
G. S. Curran & Company, Ltd.
ACTUARIAL ASSUMPTIONS
In determining actuarial costs, certain assumptions must be made regarding future experience under the
plan. These assumptions include the rate of investment return, mortality of plan members, rates of
salary increase, rates of retirement, rates of termination, rates of disability, and various other factors that
have an impact on the cost of the plan. To the extent that future experience varies from the assumptions
selected for valuation, future costs will be either higher or lower than anticipated. The following chart
illustrates the effect of emerging experience on the plan.
Factor Increase in Factor Results in
Investment Earnings Rate Decrease in Cost
Annual Rate of Salary Increase Increase in Cost
Rates of Retirement Increase in Cost
Rates of Termination Decrease in Cost
Rates of Disability Increase in Cost
Rates of Mortality Decrease in Cost
ACTUARIAL COST METHOD: Individual Entry Age Normal With Allocation of
Cost Based on Earnings. Entry and Attained Ages
Calculated on an Age Near Birthday Basis.
VALUATION INTEREST RATE: 7.5% (Net of investment expense)
ACTUARIAL ASSET VALUES For this valuation, the Actuarial Value of Assets
TRANSITION: was calculated by phasing in to the ultimate
approach as given below from the prior method
which smoothed unrealized capital gains of losses
over a four year period at 25% per year. The
deferral of capital gains for all years before fiscal
2011 was based on the prior method. The deferral
of gains and losses for fiscal 2011 and later is
based on the ultimate method.
ACTUARIAL ASSET VALUES All assets are valued at market value adjusted to
ULTIMATE METHOD: defer four-fifths of all earnings above or below the
valuation interest rate in the valuation year, three-
fifths of all earnings above or below the valuation
interest rate in the prior year, two-fifths of all
earnings above or below the valuation interest rate
from two years prior, and one-fifth of all earnings
above or below the valuation interest rate from
three years prior. The resulting smoothed values
are subject to a corridor of 85% to 115% of the
market value of assets. If the smoothed value falls
outside the corridor, the actuarial value is set equal

-38-
G. S. Curran & Company, Ltd.
to the average of the corridor limit and the
smoothed value.
ACTIVE MEMBER MORTALITY: RP 2000 Sex Distinct Employee Tables set back 1
year for males and set back 1 year for females.
ANNUITANT AND BENEFICIARY RP 2000 Sex Distinct Healthy Annuitant Tables
MORTALITY: set back 1 year for males and set back 1 year for
females.
RETIREE COST OF LIVING INCREASES: The present value of future retirement benefits is
based on benefits currently being paid by the
system and includes previously granted cost of
living increases. The present values do not include
provisions for potential future increases not yet
authorized by the Board of Trustees.
ANNUAL SALARY INCREASE RATE: The gross rates including inflation and merit
increases are as follows:
Years of Service Salary Growth Rate
1 10%
2 6%
3-19 4.3%
20-29 5.5%
Above 30 4%
RETIREMENT RATES: The table of these rates through age 75 is included
later in the report. These rates apply only to those
individuals eligible to retire.
RETIREMENT LIMITATIONS: Projected retirement benefits are not subject to IRS
Section 415 limits.
DROP ENTRY RATES: These rates apply only to those individuals eligible
to participate.
Age Rate
54 & Under 22%
55 40%
56 – 66 22%
67 & Over 40%
DROP PARTICIPATION PERIOD: All DROP participants are assumed to participate
for 3 years and retire at the end of this participation
period.
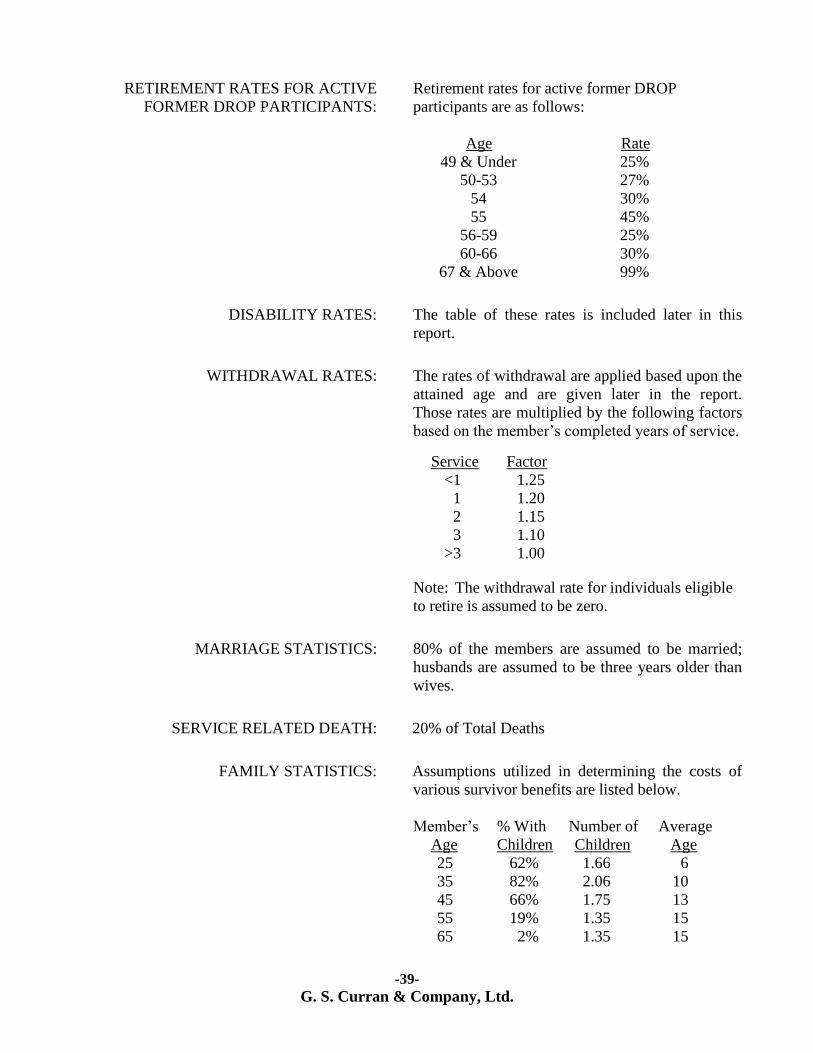
-39-
G. S. Curran & Company, Ltd.
RETIREMENT RATES FOR ACTIVE Retirement rates for active former DROP
FORMER DROP PARTICIPANTS: participants are as follows:
Age Rate
49 & Under 25%
50-53 27%
54 30%
55 45%
56-59 25%
60-66 30%
67 & Above 99%
DISABILITY RATES: The table of these rates is included later in this
report.
WITHDRAWAL RATES: The rates of withdrawal are applied based upon the
attained age and are given later in the report.
Those rates are multiplied by the following factors
based on the member’s completed years of service.
Service Factor
<1 1.25
1 1.20
2 1.15
3 1.10
>3 1.00 Note: The withdrawal rate for individuals eligible
to retire is assumed to be zero.
MARRIAGE STATISTICS: 80% of the members are assumed to be married;
husbands are assumed to be three years older than
wives.
SERVICE RELATED DEATH: 20% of Total Deaths
FAMILY STATISTICS: Assumptions utilized in determining the costs of
various survivor benefits are listed below.
Member’s % With Number of Average
Age Children Children Age
25 62% 1.66 6
35 82% 2.06 10
45 66% 1.75 13
55 19% 1.35 15
65 2% 1.35 15

-40-
G. S. Curran & Company, Ltd.
SERVICE RELATED DISABILITY: 20% of Total Disabilities
DISABLED LIVES MORTALITY: RP-2000 Disabled Lives Mortality Tables for
Males and Females
VESTING ELECTING PERCENTAGE: 20% of those vested elect deferred benefits in lieu
of contribution refunds.

-41-
G. S. Curran & Company, Ltd.
ACTUARIAL TABLES AND RATES
Age
Male
Employee
Mortality
Female
Employee
Mortality
Male
Retiree
Mortality
Female
Retiree
Mortality
Retirement
Rates
Disability
Rates
Remarriage
Rates
Withdrawal
Rates
18 0.00030 0.00018 0.00030 0.00018 0.00000 0.00060 0.02476 0.08500
19 0.00032 0.00019 0.00032 0.00019 0.00000 0.00060 0.02476 0.08500
20 0.00033 0.00019 0.00033 0.00019 0.00000 0.00060 0.02476 0.08500
21 0.00035 0.00019 0.00035 0.00019 0.00000 0.00060 0.05657 0.08500
22 0.00036 0.00019 0.00036 0.00019 0.00000 0.00060 0.06698 0.08500
23 0.00037 0.00019 0.00037 0.00019 0.00000 0.00060 0.07211 0.08500
24 0.00037 0.00020 0.00037 0.00020 0.00000 0.00060 0.06124 0.08000
25 0.00038 0.00020 0.00038 0.00020 0.00000 0.00060 0.04566 0.08000
26 0.00038 0.00021 0.00038 0.00021 0.00000 0.00060 0.04335 0.08000
27 0.00038 0.00021 0.00038 0.00021 0.00000 0.00060 0.04114 0.07000
28 0.00038 0.00022 0.00038 0.00022 0.00000 0.00060 0.03902 0.07000
29 0.00039 0.00024 0.00039 0.00024 0.00000 0.00060 0.03698 0.07000
30 0.00041 0.00025 0.00041 0.00025 0.00000 0.00060 0.03502 0.07000
31 0.00044 0.00026 0.00044 0.00026 0.00000 0.00060 0.03314 0.06000
32 0.00050 0.00031 0.00050 0.00031 0.00000 0.00060 0.03134 0.06000
33 0.00056 0.00035 0.00056 0.00035 0.00000 0.00060 0.02961 0.06000
34 0.00063 0.00039 0.00063 0.00039 0.00000 0.00060 0.02795 0.06000
35 0.00070 0.00044 0.00070 0.00044 0.00000 0.00068 0.02636 0.06000
36 0.00077 0.00047 0.00077 0.00047 0.00000 0.00076 0.03483 0.05000
37 0.00084 0.00051 0.00084 0.00051 0.00000 0.00084 0.02336 0.05000
38 0.00090 0.00055 0.00090 0.00055 0.00000 0.00096 0.02195 0.05000
39 0.00096 0.00060 0.00096 0.00060 0.00000 0.00108 0.02060 0.03600
40 0.00102 0.00065 0.00102 0.00065 0.00000 0.00124 0.01930 0.03600
41 0.00108 0.00071 0.00108 0.00071 0.08000 0.00140 0.01805 0.03600
42 0.00114 0.00077 0.00114 0.00077 0.08000 0.00156 0.01686 0.03600
43 0.00122 0.00085 0.00122 0.00085 0.08000 0.00176 0.01571 0.03600
44 0.00130 0.00094 0.00130 0.00094 0.08000 0.00200 0.01461 0.03600
45 0.00140 0.00103 0.00140 0.00103 0.08000 0.00228 0.01355 0.03600
46 0.00151 0.00112 0.00151 0.00112 0.08000 0.00260 0.01253 0.03600
47 0.00162 0.00122 0.00162 0.00122 0.08000 0.00292 0.01156 0.04000
48 0.00173 0.00133 0.00173 0.00133 0.08000 0.00332 0.01063 0.04000
49 0.00186 0.00143 0.00186 0.00143 0.08000 0.00376 0.00973 0.04000
50 0.00200 0.00155 0.00200 0.00155 0.08000 0.00428 0.00887 0.05000
51 0.00214 0.00168 0.00535 0.00234 0.08000 0.00488 0.00804 0.05000
52 0.00229 0.00181 0.00553 0.00246 0.08000 0.00552 0.00725 0.05000
53 0.00245 0.00197 0.00564 0.00265 0.08000 0.00628 0.00649 0.05000
54 0.00262 0.00213 0.00572 0.00290 0.08000 0.00712 0.00576 0.05000
55 0.00281 0.00232 0.00580 0.00319 0.15000 0.00808 0.00506 0.05000
56 0.00303 0.00253 0.00590 0.00353 0.08000 0.00920 0.00438 0.05000
57 0.00331 0.00276 0.00612 0.00393 0.08000 0.01044 0.00374 0.05000
58 0.00363 0.00301 0.00644 0.00438 0.08000 0.01184 0.00312 0.05000
59 0.00400 0.00329 0.00690 0.00492 0.08000 0.01348 0.00252 0.05000
60 0.00441 0.00360 0.00749 0.00553 0.08000 0.01952 0.00000 0.05000
61 0.00488 0.00393 0.00820 0.00620 0.08000 0.01952 0.00000 0.05000
62 0.00538 0.00429 0.00900 0.00692 0.08000 0.01952 0.00000 0.05000
63 0.00592 0.00466 0.00991 0.00769 0.08000 0.01952 0.00000 0.05000
64 0.00647 0.00504 0.01095 0.00851 0.08000 0.01952 0.00000 0.00000
65 0.00703 0.00543 0.01212 0.00939 0.08000 0.01952 0.00000 0.05000
66 0.00757 0.00582 0.01342 0.01036 0.08000 0.01952 0.00000 0.05000
67 0.00810 0.00621 0.01487 0.01141 0.15000 0.01952 0.00000 0.00000
68 0.00860 0.00658 0.01646 0.01254 0.15000 0.01952 0.00000 0.00000
69 0.00907 0.00695 0.01820 0.01377 0.15000 0.01952 0.00000 0.00000
70 0.00951 0.00729 0.02011 0.01515 0.15000 0.01952 0.00000 0.00000
71 0.00992 0.00761 0.02221 0.01674 0.15000 0.01952 0.00000 0.00000
72 0.02457 0.01858 0.02457 0.01858 0.15000 0.01952 0.00000 0.00000
73 0.02728 0.02067 0.02728 0.02066 0.15000 0.01952 0.00000 0.00000
74 0.03039 0.02297 0.03039 0.02297 0.15000 0.01952 0.00000 0.00000
75 0.03390 0.02546 0.03390 0.02546 0.15000 0.01952 0.00000 0.00000

-42-
G. S. Curran & Company, Ltd.
GLOSSARY
Accrued Benefit – The pension benefit that an individual has earned as of a specific date based on the
provisions of the plan and the individual’s age, service, and salary as of that date.
Actuarial Accrued Liability – The actuarial present value of benefits payable to members of the fund
less the present value of future normal costs attributable to the members.
Actuarial Assumptions - Assumptions as to the occurrence of future events affecting pension costs.
These assumptions include rates of mortality, withdrawal, disablement, and retirement. Also included
are rates of investment earnings, changes in compensation, as well as statistics related to marriage and
family composition. Actuarial Cost Method – A procedure for determining the portion of the cost of a pension plan to be allocated to each year. Each cost method allocates a certain portion of the actuarial present value of benefits between the actuarial accrued liability and future normal costs. Once this allocation is made, a determination of the normal cost attributable to a specific year can be made along with the payment to amortize any unfunded actuarial accrued liability. To the extent that a particular funding method allocates a greater (lesser) portion of the actual present value of benefits to the actuarial accrued liability it will allocate less (more) to future normal costs. Actuarial Equivalence – Payments or receipts with equal actuarial value on a given date when valued using the same set of actuarial assumptions. Actuarial Gain (Loss) – The financial effect on the fund of the difference between the expected and actual experience of the fund. The experience may be related to investment earnings above (or below) those expected or changes in the liability structure due to fewer (or greater) than the expected numbers of retirements, deaths, disabilities, or withdrawals. In addition, other factors such as pay increases above (or below) those forecast can result in actuarial gains or losses. The effect of such gains (or losses) is to decrease (or increase) future costs.
Actuarial Present Value - The value, as of a specified date, of an amount or series of amounts payable
or receivable thereafter, with each amount adjusted to reflect the time value of money (through accrual
of interest) and the probability of payments. For example: if $600 invested today will be worth $1,000
in 10 years and there is a 50% probability that a person will live 10 years, then the actuarial present
value of $1,000 payable to that person if he should survive 10 years is $300.
Actuarial Value of Assets - The value of cash, investments, and other property belonging to the pension
plan as used by the actuary for the purpose of the actuarial valuation. This may correspond to the book
value, market value, or some modification involving either or both book and market value. Adjustments
to market values are often made to reduce the volatility of asset values.
Asset Gain (Loss) - That portion of the actuarial gain attributable to investment performance above
(below) the expected rate of return in the actuarial assumptions.
Amortization Payment - That portion of the pension plan contribution designated to pay interest and
reduce the outstanding principal balance of unfunded actuarial accrued liability. If the amortization
payment is less than the accrued interest on the unfunded actuarial accrued liability the outstanding
principal balance will increase.
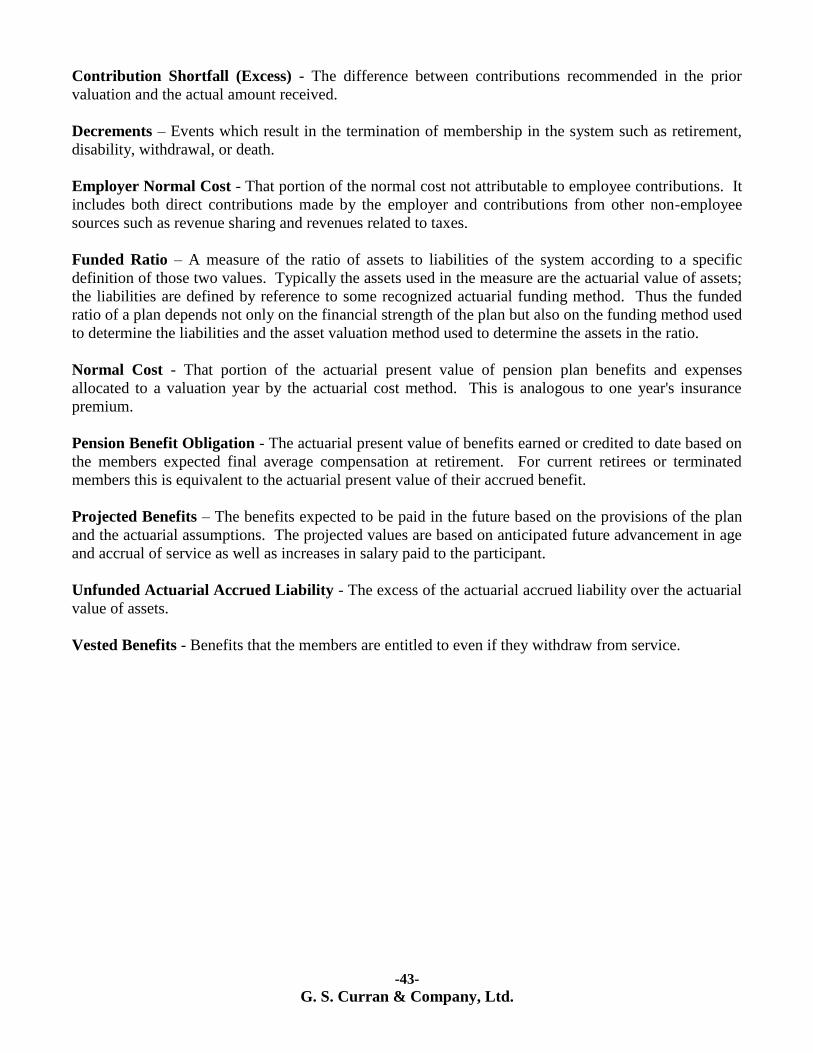
-43-
G. S. Curran & Company, Ltd.
Contribution Shortfall (Excess) - The difference between contributions recommended in the prior
valuation and the actual amount received.
Decrements – Events which result in the termination of membership in the system such as retirement,
disability, withdrawal, or death.
Employer Normal Cost - That portion of the normal cost not attributable to employee contributions. It
includes both direct contributions made by the employer and contributions from other non-employee
sources such as revenue sharing and revenues related to taxes.
Funded Ratio – A measure of the ratio of assets to liabilities of the system according to a specific
definition of those two values. Typically the assets used in the measure are the actuarial value of assets;
the liabilities are defined by reference to some recognized actuarial funding method. Thus the funded
ratio of a plan depends not only on the financial strength of the plan but also on the funding method used
to determine the liabilities and the asset valuation method used to determine the assets in the ratio.
Normal Cost - That portion of the actuarial present value of pension plan benefits and expenses
allocated to a valuation year by the actuarial cost method. This is analogous to one year's insurance
premium.
Pension Benefit Obligation - The actuarial present value of benefits earned or credited to date based on
the members expected final average compensation at retirement. For current retirees or terminated
members this is equivalent to the actuarial present value of their accrued benefit.
Projected Benefits – The benefits expected to be paid in the future based on the provisions of the plan
and the actuarial assumptions. The projected values are based on anticipated future advancement in age
and accrual of service as well as increases in salary paid to the participant.
Unfunded Actuarial Accrued Liability - The excess of the actuarial accrued liability over the actuarial
value of assets.
Vested Benefits - Benefits that the members are entitled to even if they withdraw from service.

-44-
G. S. Curran & Company, Ltd.
NOTES


